EP1223865B1 - Verbessertes verfahren zur intrakranialen druckmessung - Google Patents
Verbessertes verfahren zur intrakranialen druckmessung Download PDFInfo
- Publication number
- EP1223865B1 EP1223865B1 EP00963647A EP00963647A EP1223865B1 EP 1223865 B1 EP1223865 B1 EP 1223865B1 EP 00963647 A EP00963647 A EP 00963647A EP 00963647 A EP00963647 A EP 00963647A EP 1223865 B1 EP1223865 B1 EP 1223865B1
- Authority
- EP
- European Patent Office
- Prior art keywords
- pixels
- flow
- correlation
- image elements
- velocity
- Prior art date
- Legal status (The legal status is an assumption and is not a legal conclusion. Google has not performed a legal analysis and makes no representation as to the accuracy of the status listed.)
- Expired - Lifetime
Links
- 238000000034 method Methods 0.000 title claims abstract description 73
- 238000007917 intracranial administration Methods 0.000 title description 30
- 239000012530 fluid Substances 0.000 claims abstract description 26
- 230000000747 cardiac effect Effects 0.000 claims abstract description 22
- 230000002596 correlated effect Effects 0.000 claims description 9
- 210000001175 cerebrospinal fluid Anatomy 0.000 description 63
- 238000002595 magnetic resonance imaging Methods 0.000 description 37
- 230000017531 blood circulation Effects 0.000 description 25
- 230000008859 change Effects 0.000 description 21
- 238000005259 measurement Methods 0.000 description 19
- 210000000278 spinal cord Anatomy 0.000 description 15
- 210000004369 blood Anatomy 0.000 description 14
- 239000008280 blood Substances 0.000 description 14
- 210000003462 vein Anatomy 0.000 description 14
- 210000001367 artery Anatomy 0.000 description 13
- 210000004204 blood vessel Anatomy 0.000 description 12
- 230000011218 segmentation Effects 0.000 description 10
- 238000004364 calculation method Methods 0.000 description 8
- 230000033001 locomotion Effects 0.000 description 8
- 210000004556 brain Anatomy 0.000 description 7
- 230000000541 pulsatile effect Effects 0.000 description 7
- 230000001419 dependent effect Effects 0.000 description 6
- 210000003169 central nervous system Anatomy 0.000 description 5
- 238000002474 experimental method Methods 0.000 description 5
- 210000004731 jugular vein Anatomy 0.000 description 5
- 241001504519 Papio ursinus Species 0.000 description 4
- 238000009530 blood pressure measurement Methods 0.000 description 4
- 210000001715 carotid artery Anatomy 0.000 description 4
- 230000000052 comparative effect Effects 0.000 description 4
- 238000006073 displacement reaction Methods 0.000 description 4
- 238000003708 edge detection Methods 0.000 description 4
- 210000002532 foramen magnum Anatomy 0.000 description 4
- 238000003384 imaging method Methods 0.000 description 4
- 230000003534 oscillatory effect Effects 0.000 description 4
- 210000001519 tissue Anatomy 0.000 description 4
- 210000002385 vertebral artery Anatomy 0.000 description 4
- 241001269524 Dura Species 0.000 description 3
- 230000008569 process Effects 0.000 description 3
- 230000035485 pulse pressure Effects 0.000 description 3
- 238000011002 quantification Methods 0.000 description 3
- 238000012307 MRI technique Methods 0.000 description 2
- 230000000875 corresponding effect Effects 0.000 description 2
- 230000007423 decrease Effects 0.000 description 2
- 238000003745 diagnosis Methods 0.000 description 2
- 238000010586 diagram Methods 0.000 description 2
- 230000000004 hemodynamic effect Effects 0.000 description 2
- 238000012986 modification Methods 0.000 description 2
- 230000004048 modification Effects 0.000 description 2
- 238000010606 normalization Methods 0.000 description 2
- 230000010363 phase shift Effects 0.000 description 2
- 230000003068 static effect Effects 0.000 description 2
- 238000012360 testing method Methods 0.000 description 2
- 230000002792 vascular Effects 0.000 description 2
- 238000012935 Averaging Methods 0.000 description 1
- 208000034577 Benign intracranial hypertension Diseases 0.000 description 1
- 0 CC*(C)(C(C(C)C(*)C(C)(C(C)C(C)C(C)C(C)C(C)C(C)C)O)N=O)C1*(*)C1 Chemical compound CC*(C)(C(C(C)C(*)C(C)(C(C)C(C)C(C)C(C)C(C)C(C)C)O)N=O)C1*(*)C1 0.000 description 1
- 208000017667 Chronic Disease Diseases 0.000 description 1
- 208000018652 Closed Head injury Diseases 0.000 description 1
- 208000018127 Idiopathic intracranial hypertension Diseases 0.000 description 1
- 238000012952 Resampling Methods 0.000 description 1
- 230000004913 activation Effects 0.000 description 1
- 230000002411 adverse Effects 0.000 description 1
- 238000010171 animal model Methods 0.000 description 1
- 230000008901 benefit Effects 0.000 description 1
- 230000000740 bleeding effect Effects 0.000 description 1
- 210000000988 bone and bone Anatomy 0.000 description 1
- 210000001627 cerebral artery Anatomy 0.000 description 1
- 230000006378 damage Effects 0.000 description 1
- 230000003247 decreasing effect Effects 0.000 description 1
- 238000002405 diagnostic procedure Methods 0.000 description 1
- 230000004069 differentiation Effects 0.000 description 1
- 230000000916 dilatatory effect Effects 0.000 description 1
- 201000010099 disease Diseases 0.000 description 1
- 208000037265 diseases, disorders, signs and symptoms Diseases 0.000 description 1
- 230000000694 effects Effects 0.000 description 1
- 230000003628 erosive effect Effects 0.000 description 1
- 208000003906 hydrocephalus Diseases 0.000 description 1
- 230000006872 improvement Effects 0.000 description 1
- 230000006698 induction Effects 0.000 description 1
- 238000002347 injection Methods 0.000 description 1
- 239000007924 injection Substances 0.000 description 1
- 208000014674 injury Diseases 0.000 description 1
- 230000010354 integration Effects 0.000 description 1
- 201000009941 intracranial hypertension Diseases 0.000 description 1
- 210000003140 lateral ventricle Anatomy 0.000 description 1
- 238000009593 lumbar puncture Methods 0.000 description 1
- 230000036244 malformation Effects 0.000 description 1
- 239000011159 matrix material Substances 0.000 description 1
- 230000007246 mechanism Effects 0.000 description 1
- 230000035515 penetration Effects 0.000 description 1
- 210000002381 plasma Anatomy 0.000 description 1
- 238000012545 processing Methods 0.000 description 1
- 208000001381 pseudotumor cerebri Diseases 0.000 description 1
- 230000010349 pulsation Effects 0.000 description 1
- 230000004044 response Effects 0.000 description 1
- 210000001202 rhombencephalon Anatomy 0.000 description 1
- 230000035945 sensitivity Effects 0.000 description 1
- 239000000243 solution Substances 0.000 description 1
- 230000000638 stimulation Effects 0.000 description 1
- 230000002123 temporal effect Effects 0.000 description 1
- 230000008733 trauma Effects 0.000 description 1
- 238000002604 ultrasonography Methods 0.000 description 1
- 230000002861 ventricular Effects 0.000 description 1
Images


Classifications
-
- G—PHYSICS
- G01—MEASURING; TESTING
- G01R—MEASURING ELECTRIC VARIABLES; MEASURING MAGNETIC VARIABLES
- G01R33/00—Arrangements or instruments for measuring magnetic variables
- G01R33/20—Arrangements or instruments for measuring magnetic variables involving magnetic resonance
- G01R33/44—Arrangements or instruments for measuring magnetic variables involving magnetic resonance using nuclear magnetic resonance [NMR]
- G01R33/48—NMR imaging systems
- G01R33/54—Signal processing systems, e.g. using pulse sequences ; Generation or control of pulse sequences; Operator console
- G01R33/56—Image enhancement or correction, e.g. subtraction or averaging techniques, e.g. improvement of signal-to-noise ratio and resolution
- G01R33/563—Image enhancement or correction, e.g. subtraction or averaging techniques, e.g. improvement of signal-to-noise ratio and resolution of moving material, e.g. flow contrast angiography
-
- A—HUMAN NECESSITIES
- A61—MEDICAL OR VETERINARY SCIENCE; HYGIENE
- A61B—DIAGNOSIS; SURGERY; IDENTIFICATION
- A61B5/00—Measuring for diagnostic purposes; Identification of persons
- A61B5/03—Measuring fluid pressure within the body other than blood pressure, e.g. cerebral pressure ; Measuring pressure in body tissues or organs
- A61B5/031—Intracranial pressure
-
- A—HUMAN NECESSITIES
- A61—MEDICAL OR VETERINARY SCIENCE; HYGIENE
- A61B—DIAGNOSIS; SURGERY; IDENTIFICATION
- A61B5/00—Measuring for diagnostic purposes; Identification of persons
- A61B5/40—Detecting, measuring or recording for evaluating the nervous system
- A61B5/4058—Detecting, measuring or recording for evaluating the nervous system for evaluating the central nervous system
- A61B5/407—Evaluating the spinal cord
-
- A—HUMAN NECESSITIES
- A61—MEDICAL OR VETERINARY SCIENCE; HYGIENE
- A61B—DIAGNOSIS; SURGERY; IDENTIFICATION
- A61B5/00—Measuring for diagnostic purposes; Identification of persons
- A61B5/72—Signal processing specially adapted for physiological signals or for diagnostic purposes
- A61B5/7235—Details of waveform analysis
- A61B5/7239—Details of waveform analysis using differentiation including higher order derivatives
Definitions
- the field of the invention relates to medical diagnostic testing and more particularly to methods of measuring intracranial pressure within the cranium of a patient.
- Intracranial pressure (ICP) and compliance are important clinical parameters for diagnosis and treatment of diseases of the central nervous system (CNS). Elevated intracranial pressure, if left untreated, may result in patient death or permanent damage. Techniques currently available to measure ICP are invasive and associated with risk. In addition, penetration into the CNS space to measure the ICP often alters the pressure.
- the inside pressure and volume are related.
- the change in pressure due to change in volume is determined by the overall mechanical elastance of the system.
- Studies of the relation between intracranial volume and pressure date back almost 200 years.
- Alexander Monro stated that the intracranial space contains two compartments (brain matter and blood) that can change in volume. Since neither can be compressed and the cranium is rigid, he concluded that the volume of blood within the intracranial space is constant.
- Burrows concluded that intracranial blood volume does change and it is accompanied by a reciprocal change in the volume of the other two compartments, brain and CSF. This is known as the Monro-Kelli doctrine.
- the majority of the added volume during systole is accommodated by displacement of the CSF into the spinal canal.
- the derived pressure-volume curve also called the elastance curve, is well described by a monoexponential curve.
- the elastance (inverse of compliance) is defined as the change in pressure due to a change in volume (dP/dV).
- the intracranial elastance i.e., the derivative of the pressure-volume curve
- volume pressure test The most practical method of assessing the volume-pressure relationship is the volume pressure test.
- VPR volume-pressure response
- VPR and ICP In both clinical patients and experimental animals, the relationship between VPR and ICP has been shown to be linear. This linear relation validates the monoexponential volume-pressure relation.
- the elastance coefficient (the coefficient defining the shape of the volume-pressure exponential curve) is determined from the slope of the VPR-ICP linear relationship.
- the intracranial compliance coefficient is the reciprocal of the elastance coefficient.
- Intracranial pressure is often measured for the diagnosis and clinical management of closed-head injuries such as trauma and intracranial bleeding or of chronic disorders such as hydrocephalus, malformations involving hindbrain herniation and pseudotumor cerebri.
- Intracranial pressure measurement is an invasive procedure and thus it is associated with risk.
- Burdart et. al. developed an automated segmentation technique for phase contrast MRI images using pixel intensity differences between vessel and background within a single image. Using the fact that pixels have either positive or negative intensity magnitudes depending on their direction (whereas stationary pixels have intensity value significantly closer to zero) the vessels were threshold against a pre-selected threshold index.
- Hu et. al. used a region growing technique with an intensity threshold to segment the entire vascular structure in a set of three-dimensional MRI images of blood vessels.
- Singleton and Pohost extended the region growing technique to segment cardiac lumens using a region growing method, along with eroding and dilating operations, to include holes and excluding isolated regions outside the ventricle.
- Baledent et. al. segmented CSF flow area in phase contrast MRI technique using the fundamental frequency component, obtained from Fast Fourier Transform to enhance the pulsatile dynamics.
- Cross-correlation technique has also been used, as an image processing technique for applications not related to segmentation of flow regions.
- Bandettini et. al. used cross-correlation between a reference pattern and image intensity values in echo-planar MR images that were acquired during brain stimulation. Regions in which signal intensity changes correlated with the activation pattern were identified as the active region in the brain. A arbitrary threshold value was used to differentiate between activated and background regions.
- a method and apparatus are provided for finding a fluid conduit of a human body within a set of images collected over a portion of a cardiac cycle and where each image of the set of images is formed by a plurality of image elements.
- the method includes the steps of selecting a reference image element within the fluid conduit from the plurality of image elements, determining a velocity profile of each of the image elements over the cardiac cycle and identifying the fluid conduit by correlating the velocity profile of the reference element with velocity profiles at least some of the other image elements.
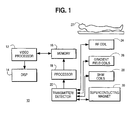
- FIG. 1 is a block diagram of a device 10 that may be used to determine intracranial pressure (ICP) non-invasively.
- ICP intracranial pressure
- magnetic resonance imaging (MRI) techniques are used to determine ICP from a series of measurements performed on a subject.
- the MRI imaging techniques may be used to obtain flow data regarding transcranial (i.e., into and out of the cranium) blood, cranial spinal fluid flow and spinal cord oscillatory movement.
- the imaging techniques may also be used to obtain data regarding the conduits within which the measured flows occur. Together, the measured values may be used to determine a value of intracranial pressure.
- an MRI imaging system 10 may be set up to measure velocity information at each point (voxel) in three-dimensional space.
- a MRI system 10 may be provided with a superconducting magnet 30, gradient field coils 26 and shim coils 28 to create a varying magnetic field throughout an space (e.g., within the cranium of a patient).
- the superconducting magnet 30 and gradient field and shim coils 26, 28 provide a varying magnetic field of a known magnitude and variance throughout the measured space.
- the magnetic field causes atoms (e.g., protons) to align themselves to the magnetic field in a known manner.
- a series of radio frequency pulses may be applied to the space at a Larmor frequency of the selected atoms within a selected space. Since the Larmor frequency of the atoms vary as a function of the magnetic field which the atoms experience, only a few atoms at known locations will resonate and generate a measurable signal during a free induction decay (FID) of the electrons of those atoms.
- FID free induction decay
- a velocity of an atom may be determined by a phase shift of the signal from the selected atoms caused by the movement of the atom within a magnetic field gradient.
- a slice of tissue of a subject 22 may be examined in three-dimensional space. Further, since velocity can be determined at any point (area) along the slice of tissue based upon phase shifts, flow through vascular structures (e.g., arteries, veins, etc.) can be determined by integrating and averaging velocity through the selected areas. Determination of flow then becomes the simple step of multiplying velocity times area.
- vascular structures e.g., arteries, veins, etc.
- FIG. 4 is a flow chart 100 which depicts a series of steps that may be used in determining ICP. Reference will be made to FIG. 4 as appropriate to an understanding of the invention.
- flow of blood into and out of the cranium may be determined. Blood flow into the cranium is pulsatile. Also, at each instant the value of blood flow into the cranium is not equal to blood flow out of the cranium.
- Venous outflow is composed mainly of jugular flow and a small amount of flow that may go through other channels such as the ophthalmic veins.
- the flow through the other channels is estimated from the constraint that over a cardiac cycle inflow equals outflow.
- the flow through the jugular is measured directly under the process described herein. Not measuring the flow in those other channels doesn't adversely affect ICP results. Stated differently, net arterial inflow does not equal net jugular flow but does equal venous flow that can be calculated from the measured jugular flow.
- a volume of blood is pumped into the brain through the associated arteries.
- a delay occurs before an equal amount of blood perfuses through the brain and exits the cranium through the veins. Since blood is incompressible, the differences in volume is, for the most part, accommodated by movement of the cranial spinal fluid and movement of the spinal cord within the spinal column (spinal cord oscillatory flow). The majority of the added volume in the cranium is accommodated in the spinal compartment in the form of displaced CSF, especially at lower levels of increased ICP.
- ICP intracranial content
- A(t) is the total arterial flow
- V(t) is the total venous flow (the sum of the measured jugular flow and the estimated other venous flow)
- CSF(t) is the rate of CSF outflow through the foramen magnum
- Cord(t) is the volumetric rate of spinal cord displacement.
- I(t) can be defined to be the portion of the time-varying arteriovenous flow which is not compensated by the CSF and spinal cord displacement.
- the integral of I(t) is the time-varying intracranial volume change from which the systolic intracranial volume change may be derived.
- Time-varying flow rate waveforms may be derived from the MRI phase images by integration of phase values representing the velocities inside regions of interest defining the area of the vessels, the cord and the CSF space.
- the intracranial volume change during the cardiac cycle may be calculated from the time-varying net flow into and out of the cranium.
- FIGs. 5a-c provides an example of measured data regarding blood flow, cranial spinal fluid flow and cord movement.
- Arterial blood inflow and venous outflow may be measured during a first scan using the well-known MRI technique that is optimized for quantification of blood flow.
- CSF and cord displacement below the foramen magnum may be measured during a second MRI scan that is optimized for slow flow.
- the two scans are performed in quick succession, at an axial location below the foramen magnum.
- Blood flow through the four major arteries (two internal carotid and two vertebral) and two veins (jugular) is obtained from one dynamic scan.
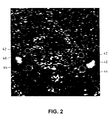
- An example of an MRI phase image representing flow in the major blood vessels is shown in FIG. 2.
- the second scan may be used to measure cervical CSF and cord pulsation.
- An example of MRI phase images of the CSF flow taken at different cardiac phases are shown in FIG. 3a-b.
- a section 5 mm thick, with a field of view of 1-16 cm, a matrix size of 256 x 160 mm and two averages may be used.
- the shortest possible repetition time TR (e.g., 21-26 ms) may be used to optimize temporal resolution (equal to twice the TR).
- a high velocity encoding (e.g., 80 cm/sec) with flip angle of 20-30 degrees may be used for measurement of blood flow, and a low velocity encoding (e.g., 3-10 cm/sec) with flip angle of 20 degrees may be used for measurements of CSF flow and cord motion.
- the maximum number of time points allowed per cardiac cycle (e.g., 32) may be selected to minimize errors due to interpolation and resampling.
- the dark areas 42, 44 depict blood flow into the cranium through the carotid and cerebral arteries.
- the light areas 40 depicts blood flow out of the cranium through the jugular veins.
- the blood flow within the arteries 42, 44 and veins 40 may each be determined.
- the size (e.g., in number of pixels) of each artery and vein may be determined.
- the number of pixels making up each artery and vein may be determined (marked) by edge-detecting software, or by manually marking the appropriate areas 40, 42, 44 (e.g., by clicking on the appropriate areas with a computer mouse).
- a velocity may be determined within each artery and vein. Since the pixel values within the marked areas are a measure of velocity, the velocity values of each pixel within each marked area may be integrated. The integrated velocity may be averaged to determine an average blood flow within the vein or artery.
- the net blood flow may be determined.
- the average velocities may be multiplied by the areas.
- each scan may be used to provide a size of each vein and artery, as well as an average velocity and blood flow in that vein or artery for that scan.
- the result of a series of scans may be a profile of blood flow for each vein and artery during each point of the cardiac cycle.
- FIGs. 3a-b shows a phase contrast image of CSF pulsatile flow.
- the light area 46 in the center of FIG. 3a shows the outward flow of cranial spinal fluid during systole.
- the corresponding dark area of FIG. 3b shows the inward flow of CSF during diastole.
- the area 48 in the center of the CSF 46 depicts the spinal cord.
- Flow of the CSF and spinal cord may be determined as part of a two step process.
- First the spinal cord 48 is marked as described above and a spinal cord oscillatory flow is determined as discussed above. Since the cross-sectional area of the cord moves as a unit, one or two pixel values may be sufficient to determine velocity. Under a preferred embodiment all pixels within the cord area are integrated (summed) to obtain an average cord velocity.
- a flow in the annular area of the CSF between lines 46 and 48 may be determined.
- An outer periphery 46 (i.e., the dura) of the CSF is marked.
- the pixels of the spinal cord 48 is excluded from area and velocity determinations of the CSF.
- the area of the annular area is determined and a CSF flow may be determined from an average velocity.
- flow across the annulus may be determined by integrating a velocity of each pixel around the annulus.
- the value I(t) may be determined. From I(t), a value for ICP may be determined once a cranial pressure gradient (dP/dz) has been calculated.
- dP/dz the area below the foramen magnum is again considered.
- the value for dP/dz can be calculated or determined with a high degree of accuracy, using convention pressure-flow equations.
- dp/dZ has not been widely used in the past in arteries or veins because of the elastic periphery of such conduits.
- the dura of the CSF is attached to the surrounding bone and provides a rigid tube which facilitates accurate measurements.
- dP/dz may be calculated for the CSF using the Navier-Stokes equation or Womersley Pressure-Flow Relation within the annular area containing the CSF. Such calculations may be accurately based upon assumptions including: no in-plane velocities, rigid walls of the space and minimum curvature along an axis of the conduit.
- the space between the spinal cord and dura bounding the CSF may be relatively precisely determined.
- a velocity across that determined space may also be determined (or may also have been determined during flow measurements).
- the pressure gradient waveform may be calculated using the Navier-Stokes equation.
- the inertial component of the pressure gradient is approximated by the first order central difference template of the time series images and the shear component is derived by using a pair of second order central difference operators.
- the sum of the shear and inertia components in the region of interest which includes only the CSF pixels where added to derive mean pressure for each phase of the cardiac cycle.
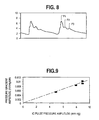
- FIG. 6a provides a profile of pressure gradient versus time using the Womersley Pressure Flow Relationship.
- FIG. 6a shows pressure gradient waveforms derived from flow information for 4 different circular annulus cross-sectional areas.
- FIG. 6b is a gradient waveform derived using CSF velocity images and the Navier-Stokes equation.
- the pressure gradient is highly dependent upon the size of the annulus.
- the diameter of the CSF 46 for purposes of FIG. 6a was assumed to be 10.0 mm.
- the pressure gradient must be multiplied by an area of the annulus.
- the concentric annulus model of FIG. 6a was used to evaluate the effect of the CSF cross-sectional area on the derived pressure gradient waveforms.
- Pressure gradient waveforms were derived for 4 models of concentric circular annulus with outer radius of 10 mm and inner radius that varied from 1 mm to 7.5 mm.
- the same CSF flow waveform was used for the 4 models.
- the derived waveforms are shown in FIG. 6a.
- the derived waveforms had similar shape but were different by a scale factor. This result suggests that normalization of the pressure gradients with the CSF cross-sectional area provides a way to obtain pressure gradients that are not velocity dependent, but are flow dependent. As a result, it is possible to compare pressure gradients derived form spinal canals that may differ in the CSF cross-sectional area.
- FIG. 6b provides a pressure gradient derived from the velocity images and the Navier-Stokes equation.
- FIG. 9 shows experimental results from a baboon comparing amplitude of MRI derived pulse pressure gradient and amplitude of invasively measured ICP pulse pressure at three different values of mean intracranial pressures. The relations obtained in this experiment are used when pulse pressure is estimated from MRI pressure gradients.
- DP/dV is estimated from the MRI derived pressure gradients and amplitude of the of the intracranial volume change.
- This value also referred to as elastance index is related to the ICP as expressed by the derivative of the elastance curve.
- the elastance curve is shown in FIG. 7. A relationship exists between the elastance index and intracranial pressure. (As is shown in FIG. 11).
- FIG. 11 shows the relationship between the MRI derived elastance index and mean ICP.
- FIG. 10 shows the correlation between MRI derived elastance indexes and ICP for four patients (circles indicate data normalized for CSF area). As should be noted (neglecting the logarithmic scale) a linear relationship exists between elastance and ICP.
- FIG. 10a-b shows comparative data between pressure gradient and ICP.
- FIG. 11a shows a pressure gradient of a patient with a low ICP within a normal range.
- FIG. 11b shows a pressure gradient profile for a patient with an elevated ICP.
- Table I shows comparative data from baboon experimentation. As shown, the MRI-derived data shows extremely good correlation to the invasively derived data.
- Table II shows comparative data for four patents. As with the baboon data, the MRI derived data shows extremely good correlation with the invasively derived data.
- HR (ICU) bpm) Mean ICP (mmHg) PTP ICP (mmHg) HR (MRI) (bpm) PTP Pr Grad (mm/Hg/ cm) (A) CSF flow area (cm 2 ) (C) PTP Vol Chng (cc) (B) Elast.
- mean ICP was controlled by changing the fluid volume in the CNS (i.e., the transcranial blood flow was unchanged). Under these conditions, a linear relationship may be found between the peak to peak (PTP) amplitude of the MRI-derived CSF pulsatile pressure gradient and the PTP amplitude of the ICP. The results are shown in FIG. 9. A similar correlation was found between the PTP amplitude of the MRI-derived pressure gradients and the means ICP.
- the elastance index can be estimated from the ratio of the PTP amplitude of the MRI-derived pressure gradients and the PTP amplitude of intracranial volume change.
- the results of the second experiment are summarized in Table I. As expected, when hemodynamic changes occurs in conjunction with change in the mean ICP, the elastance, and not the PTP pressure gradients, is correlated with the mean ICP value.
- Patient 1 and 2 had mean ICP values within the normal range, while patient 3 had an elevated mean ICP, and patient 4 had extremely elevated ICP.
- the ICP measurements covers a large portion of the practical range expected for ICP measurements.
- the MRI measurements and the ICP recordings were not measured simultaneously (measurements were made from an hour to several hours apart), there was good correspondence between mean ICP, measured invasively, and the MRI-derived estimate for the elastance. It is clear that using the CSF flow area for normalization of the PTP pressure gradients improves the correspondence between the elastance and the mean ICP.
- Actual ICP recordings and the corresponding MRI-derived pressure gradients are shown in FIGs. 11a and 11b, respectively. These results indicate that the sensitivity of the MRI measurements are within the range needed to differentiate between normal and elevated ICP.
- an automated method for segmentation of flow areas (i.e., fluid conduits) in blood vessels, CSF spaces, or any region that exhibits a specific dynamic behavior that is different from the surrounding region. (e.g. pulsatile blood flow versus static tissue).
- This technique automates the calculation of blood and CSF flow rates, which are intermediate steps in the method for non-invasive measurements of intracranial pressure (ICP).
- ICP intracranial pressure
- it can be used in any application that requires identification of the lumen region of vessels that contains non-steady flow. Such applications include the calculation of blood flow in any area in the body, as well as CSF flow rates.
- One of the significant aspects of the embodiment is the use of dynamic information in time-series images to identify and segment the lumen.
- Prior techniques have used the spatial information in a single image for this purpose.
- the prior techniques have been limited by the contrast to noise of the single image used for determination of the border of the lumen (e.g. blood vessel).
- the new technique utilizes multiple images for identification of the lumen region and therefore it utilizes information with an inherently higher contrast to noise ratio.
- a second unique feature of this new technique is a built-in mechanism to identify an optimal threshold criterion for identification of the lumen region. Unlike many previous techniques, which use arbitrary threshold values to differentiate between the lumen region and the surrounding background, an optimal threshold is identified based on the information contained in the images.
- An additional advantage of this new technique is the possibility to segment several vessels' lumen simultaneously when the flow dynamics in these vessels is similar.
- volumetric flow rates waveforms can be calculated from multiple time series images that depict velocities across the lumen as a function of time.
- the flow rate at each time point is then calculated by summation of the velocity values in all image elements (pixels) that are included in the flow area region (i.e., the lumen). Therefore, identification of the lumen region is required for volumetric flow calculation.
- Most commonly used imaging modalities to obtain flow rates in medical applications are the Doppler ultrasound technique and the MRI dynamic phase contrast techniques. The new method is based upon images that are obtained with MRI.
- dynamic MRI phase contrast technique can provide a set of 32 images (each providing a velocity map) which together represents the flow dynamics during one cardiac cycle.
- the new method may be applied to segment flow area regions for automated calculation of blood flow in all major blood vessel that supply blood to and from the brain and for automated calculation of CSF flow between the cranium and the spinal canal.
- the new method may include five basic steps.
- a reference location may be selected (e.g., by clicking on a pixel or group of pixels) inside the flow area (within the lumen of the vessel).
- a time-varying velocity waveform is determined at the selected pixel location, which we refer to as the "reference waveform”.
- a map is prepared of the cross-correlation values for the velocity waveforms at all pixel location in the image (or a region of interest within it) between the time varying velocity waveforms and the reference waveform.
- the optimal threshold value range to be used for identification of the lumen region may then be determined.
- the boundary of the regions with cross-correlation values above the threshold may be determined.
- a reference pixel location may be selected within the vessel.
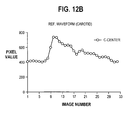
- An example is shown in FIG. 12a.
- One of the 32 images of the velocity encoded MRI images obtained through an axial plane in the neck is shown.
- the 32 images may represent a time-sequence of one cardiac cycle.
- the cross-mark indicates the pixel location selected as a reference.
- a time varying velocity waveform (i.e., "the reference waveform") may be generated for the selected pixel location using the velocity data of the selected pixel from the 32 images.
- An example of a reference waveform is shown in FIG. 12b. This waveform is obtained by plotting the pixel velocity value, which in our case is proportional to the fluid velocity, at the same selected pixel location from all 32 images. This waveform describes the velocities as a function of time at this location during a cardiac cycle.
- a time varying velocity waveform may also be prepared for every other pixel in the images.
- a cross-correlation among the velocity waveforms may be prepared next.
- the cross correlation (CC) value between the reference waveform and the time varying waveform at that other pixel location is calculated.
- the possible CC values range from 1 to -1. High CC values indicates high similarity between the current and reference waveform. The maximum value of one indicates identity between the current waveform and the reference waveform. Lower values indicate decreased in similarity.
- the CC value is calculated using the following expression, which is well-known in the literature to those of skill in the art: where P xy is the cross correlation value at pixel location XY, R is the reference waveform, k is the time index of the time-series image and N is the total number of images in the time series.
- a cross correlation map that was obtained for the image region of FIG. 12 that includes the blood vessels is shown in FIG. 13. Higher image intensity (i.e., a lighter color in FIG. 13) indicates higher CC value.
- An optimal threshold value may be determined next. It is evident that the velocity waveforms at different image location within the lumen are of similar dynamic behavior. Therefor these waveforms are highly correlated and would have a relatively high CC value. The following step is used to determine the CC value that will be used for differentiation between pixels inside the lumen and outside (i.e., in the surrounding region). Pixels with CC value above the threshold will be segmented as pixels that are included in the segmented lumen region.
- the processor 18 may be used for the automatic selection of the optimal CC threshold value.
- the number of pixels with CC value above a certain CC threshold is calculated for threshold values between 0.3 to 0.9 at 0.025 intervals.
- An example of such graph obtained from an image containing the blood vessel region is shown in FIG. 14. This plot has three distinct regions. Two regions A, C in which the number of pixels decreases rapidly with increase in threshold value and a region B in between where the number of pixel detected are relative constant and do not change much with increases in the threshold value.
- the CC value is either too low, pixels from the background region are detected with decrease in CC value, or too high, where only part of the pixels inside the vessel lumen are detected.
- the flat region B indicates the intermediate region where most or all the pixels inside the lumen are detected and none or very few pixels are detected outside the lumen region. Therefore a threshold value in the "flat" region of the graph is optimal for identification of the lumen region.
- the "flat" region is identified by search for region with the highest derivative values.
- the threshold may be selected as an average value for that region B or offset by some value, depending upon the shape of this "flat" region.
- Edge detection of the lumen's contour may be considered next.
- a simple edge tracking method may be used to find the contour of the lumen region. Often a few isolated pixels in the surrounding regions have CC values above the threshold due to noise present in the data.
- the edge-tracking step excludes these pixels from the cluster of connected (locus of) pixels that constitute the outline of the lumen.
- the selected method uses a binary edge detection algorithm to obtain efficient edge detection.
- the CC map is converted to a binary image where pixels with CC value equal to or above the threshold are assigned the value of one. Pixels with CC value below the threshold are assigned the value zero.
- the lumen contour is identified by searching for the nearest neighbor pixels with a value of one that are connected and are bordering with pixels with a value of zero.
- An example of a vessel lumen with the contour identified automatically using this technique is shown in FIG. 15.
- the relative performance of the new technique may be considered next.
- the time-series technique was evaluated for reproducibility and was compared with manual segmentation. Fifteen sets of data were tested by 5 observers with different skill levels. Each set contains two image-series, one series used to image blood flow in 6 blood vessels and the second to image cerebrospinal fluid (CSF) flow.
- CSF cerebrospinal fluid
- the table below demonstrates the improvement in the reproducibility of lumen segmentation with this technique.
- the reproducibility was determined by comparing the mean standard deviation of the number of pixels identified as the lumen region using manual tracing and the automated time-series method. Comparison between reproducibility of manual and automated segmentation VESSELS MANUAL TECH. AUTOMATED TECH. Mean St. dev. Mean St. dev.
- the mean standard deviation of pixel number (area),and mean total flow (mL/min), are listed in the table above.
- the mean standard deviations of the automated method are significantly smaller than the manual method. For all vessel types, the reproducibility is improved by a factor of approximately four.
- the detected pixel numbers are higher with the automated method. Since users choose the image with highest contrast, which means that the flow velocity is maximum and the cross-sectional area of the lumen is not necessarily largest, the manual method produces smaller region of interest than the automated method. (With naked human eyes, it is difficult to detect slow flowing pixels at the edge of the vessel. (Also, the resolution of the computer monitor affects the user's decision.) The % change is higher with smaller vessels, such as vertebral arteries and the left jugular vein, since one pixel width represent a larger % change in the lumen area. In general, lumen sizes obtained by a skilled observer had the smallest area difference between the automated and the manual techniques. An example is shown in FIG. 21. Both the automated contours (red) and the manually traced contours (brown) are shown for the carotid and vertebral artery, the jugular vein, and the CSF flow area.
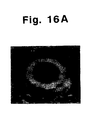
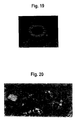
- FIGs. 16-19 demonstrate the technique for MRI images obtained to quantify CSF flow. These figures correspond to FIGs. 11-15 and 21 that were obtained for MRI images obtained to quantify flow in blood vessels.
- FIG. 20 demonstrates that the method can be used to segment multiple vessels using only one reference waveform.
Landscapes
- Health & Medical Sciences (AREA)
- Physics & Mathematics (AREA)
- Life Sciences & Earth Sciences (AREA)
- Nuclear Medicine, Radiotherapy & Molecular Imaging (AREA)
- General Health & Medical Sciences (AREA)
- Engineering & Computer Science (AREA)
- Biophysics (AREA)
- Heart & Thoracic Surgery (AREA)
- High Energy & Nuclear Physics (AREA)
- Condensed Matter Physics & Semiconductors (AREA)
- General Physics & Mathematics (AREA)
- Neurosurgery (AREA)
- Hematology (AREA)
- Radiology & Medical Imaging (AREA)
- Vascular Medicine (AREA)
- Pathology (AREA)
- Biomedical Technology (AREA)
- Signal Processing (AREA)
- Medical Informatics (AREA)
- Molecular Biology (AREA)
- Surgery (AREA)
- Animal Behavior & Ethology (AREA)
- Public Health (AREA)
- Veterinary Medicine (AREA)
- Measuring Pulse, Heart Rate, Blood Pressure Or Blood Flow (AREA)
- Magnetic Resonance Imaging Apparatus (AREA)
- Measuring And Recording Apparatus For Diagnosis (AREA)
- Compounds Of Alkaline-Earth Elements, Aluminum Or Rare-Earth Metals (AREA)
- Steroid Compounds (AREA)
- Other Investigation Or Analysis Of Materials By Electrical Means (AREA)
Claims (15)
- Verfahren zur Lokalisierung des Fluidkanals und der Kanalgrenzen eines menschlichen Körpers innerhalb eines Satzes von Bildern, die über einen Teil eines Herzzyklus gesammelt worden sind und worin jedes Bild des Satzes von Bildern aus einer Mehrheit von Bildelementen gebildet wird, wobei dieses Verfahren durch die Schritte gekennzeichnet ist:Auswahl eines Bezugsbildelements innerhalb des Fluidkanals aus der Mehrheit von Bildelementen;Bestimmung eines Geschwindigkeitsprofils jedes der Bildelemente über den Herzzyklus; undIdentifizierung des Fluidkanals durch Korrelation des Geschwindigkeitsprofils des Bezugselements mit Geschwindigkeitsprofilen zumindest einiger der anderen Bildelemente.
- Verfahren nach Anspruch 1, weiter umfassend die Verwendung von Pixeln als Bildemente: und die Berechnung eines Kreuzkorrelationswertes für jeden Pixel.
- Verfahren nach Anspruch 2, weiter umfassend die Auswahl einer Korrelationsschwelle zwischen dem Kreuzkorrelationswert des Bezugspixels und den anderen Pixeln; und die Auswahl der Korrelationsschwelle aus einer Region mit einer verhältnismässig konstanten Anzahl von Pixeln, die Korrelationswerte oberhalb eines gewählten Schwellenwertes besitzen.
- Verfahren nach Anspruch 3, weiter umfassend die Bildung eines Umrisses des Gebiets auf der Grundlage der korrelierten Geschwindigkeitsprofile.
- Verfahren nach Anspruch 4, weiter umfassend die Identifizierung einer Gruppe benachbarter Pixel unter den Pixeln mit korrelierten Geschwindigkeitsprofilen.
- Verfahren nach Anspruch 5, weiter umfassend die Identifizierung eines Ortes von Punkten, die die gruppierten Pixel umgeben.
- Vorrichtung zur Lokalisierung des Fluidkanals und der Kanalgrenzen eines menschlichen Körpers innerhalb eines Satzes von Bildern, die über einen Teil eines Herzzyklus gesammelt worden sind und worin jedes Bild des Satzes von Bildern aus einer Mehrheit von Bildelementen gebildet wird, wobei die Vorrichtung gekennzeichnet ist durch:Mittel zur Auswahl eines Bezugsbildelements innerhalb des Fluidkanals aus der Mehrheit von Bildelementen;Mittel zur Bestimmung eines Geschwindigkeitsprofils jedes der Bildelemente über den Herzzyklus; undMittel zur Identifizierung des Fluidkanals durch Korrelation des Geschwindigkeitsprofils des Bezugselements mit Geschwindigkeitsprofilen zumindest einiger der anderen Bildelemente.
- Vorrichtung nach Anspruch 7, weiter umfassend Mittel zur Verwendung von Pixeln als Bildemente; und Mittel zur Berechnung eines Kreuzkorretationswertes für jeden Pixel.
- Vorrichtung nach Anspruch 8, weiter umfassend Mittel zur Auswahl einer Korrelationsschwelle zwischen dem Kreuzkorrelationswert des Bezugspixels und den anderen Pixeln.
- Vorrichtung nach Anspruch 9, weiter umfassend Mittel zur Auswahl der Korrelationsschwelle aus einer Region mit einer verhältnismässig konstanten Anzahl von Pixeln, die Korrelationswerte oberhalb eines gewählten Schwellenwertes besitzen.
- Vorrichtung nach Anspruch 10, weiter umfassend Mittel zur Bildung eines Umrisses des Gebiets auf der Grundlage der korrelierten Geschwindigkeitsprofile.
- Vorrichtung nach Anspruch 11, weiter umfassend Mittel zur Identifizierung einer Gruppe benachbarter Pixel unter den Pixeln mit korrelierten Geschwindigkeitsprofilen.
- Vorrichtung nach Anspruch 12, weiter umfassend Mittel zur Identifizierung eines Ortes von Punkten, die die gruppierten Pixel umgeben.
- Vorrichtung nach Anspruch 7, worin die Auswahlmittel ein Zeiger sind, der dafür geeignet ist, das Bezugsbildelement innerhalb des Gebiets aus der Mehrheit von Bildelementen auszuwählen;
die Mittel zur Bestimmung ein Geschwindigkeitsprozessor sind, der dafür geeignet ist, das Geschwindigkeitsprofil jedes der Bildelemente über den Herzzyklus zu bestimmen: und
die Mittel zur Ideritifizierung ein Korreiationsprozessor sind, der dafür geeignet ist, das Gebiet durch Korrelation des Geschwindigkeitsprofils des Bezugselements mit Geschwindigkeitsprofilen zumindest einiger der anderen Bildelemente zu identifizieren. - Vorrichtung nach Anspruch 14, weiter umfassend einen Bildcompiler, der dafür geeignet ist, einen Satz von Bildern über den Herzzyklus zu sammeln; einen Pixelprozessor, der dafür geeignet ist, Pixel als Bildelemente zu verwenden; einen Kreuzkorrelationsprozessor, der dafür geeignet ist, einen Kreuzkorrelationswert für jeden Pixel zu berechnen: einen Schwellenprozessor, der dafür geeignet ist, eine Kreuzkorrelationsschwelle zwischen dem Kreuzkorrelationswert des Bezugspixels und den anderen Pixeln auszuwählen; einen Ableitungsprozessor, der dafür geeignet ist, die Korrelationsschwelle aus einem Gebiet mit einer verhältnismässig konstanten Anzahl von Pixeln, die Korrelationswerte oberhalb eines gewählten Schwellenwertes besitzen, auszuwählen; einen Umrissprozessor, der dafür geeignet ist, auf der Grundlage der korrelierten Geschwindigkeitsprofile einen Umriss des Gebiets zu bilden; einen Vergleichsprozessor, der dafür geeignet ist, eine Gruppe benachbarter Pixel unter den Pixeln mit korrelierten Geschwindigkeitsprofilen zu identifizieren; und einen Ortsprozessor, der dafür geeignet ist, einen Ort von Punkten zu identifizieren, die die gruppierten Pixel umgeben.
Applications Claiming Priority (3)
| Application Number | Priority Date | Filing Date | Title |
|---|---|---|---|
| US399566 | 1989-08-24 | ||
| US09/399,566 US6245027B1 (en) | 1998-04-10 | 1999-09-20 | Method of measuring intracranial pressure |
| PCT/US2000/025741 WO2001021073A1 (en) | 1999-09-20 | 2000-09-20 | Improved method of measuring intracranial pressure |
Publications (3)
| Publication Number | Publication Date |
|---|---|
| EP1223865A1 EP1223865A1 (de) | 2002-07-24 |
| EP1223865A4 EP1223865A4 (de) | 2003-07-16 |
| EP1223865B1 true EP1223865B1 (de) | 2005-11-16 |
Family
ID=23580043
Family Applications (1)
| Application Number | Title | Priority Date | Filing Date |
|---|---|---|---|
| EP00963647A Expired - Lifetime EP1223865B1 (de) | 1999-09-20 | 2000-09-20 | Verbessertes verfahren zur intrakranialen druckmessung |
Country Status (6)
| Country | Link |
|---|---|
| US (1) | US6245027B1 (de) |
| EP (1) | EP1223865B1 (de) |
| AT (1) | ATE309744T1 (de) |
| AU (1) | AU3884801A (de) |
| DE (1) | DE60024124T2 (de) |
| WO (1) | WO2001021073A1 (de) |
Cited By (1)
| Publication number | Priority date | Publication date | Assignee | Title |
|---|---|---|---|---|
| RU2447833C1 (ru) * | 2010-12-16 | 2012-04-20 | Государственное учреждение здравоохранения Научно-исследовательский институт скорой помощи имени Н.В. Склифосовского Департамента здравоохранения г. Москвы | Способ контроля внутричерепного давления при проведении гипербарической оксигенации в условиях искусственной вентиляции легких у больных с внутричерепными кровоизлияниями, находящихся в критическом состоянии |
Families Citing this family (29)
| Publication number | Priority date | Publication date | Assignee | Title |
|---|---|---|---|---|
| US8211031B2 (en) * | 2002-01-15 | 2012-07-03 | Orsan Medical Technologies Ltd. | Non-invasive intracranial monitor |
| WO2006011128A1 (en) | 2004-07-15 | 2006-02-02 | Orsan Medical Technologies Ltd. | Cerebral perfusion monitor |
| US7998080B2 (en) * | 2002-01-15 | 2011-08-16 | Orsan Medical Technologies Ltd. | Method for monitoring blood flow to brain |
| US6990368B2 (en) * | 2002-04-04 | 2006-01-24 | Surgical Navigation Technologies, Inc. | Method and apparatus for virtual digital subtraction angiography |
| US7147605B2 (en) * | 2002-07-08 | 2006-12-12 | Uab Vittamed | Method and apparatus for noninvasive determination of the absolute value of intracranial pressure |
| US7520862B2 (en) * | 2004-02-03 | 2009-04-21 | Neuro Diagnostic Devices, Inc. | Cerebral spinal fluid shunt evaluation system |
| US20080214951A1 (en) * | 2004-02-03 | 2008-09-04 | Neuro Diagnostic Devices, Inc. | Cerebrospinal Fluid Evaluation Systems |
| US20050215882A1 (en) * | 2004-03-23 | 2005-09-29 | The Regents Of The University Of Michigan | Noninvasive method to determine fat content of tissues using MRI |
| CN101014360A (zh) | 2004-08-03 | 2007-08-08 | 埃米斯菲尔技术公司 | 抗糖尿病口服胰岛素-双胍组合物 |
| US8401612B1 (en) * | 2006-09-11 | 2013-03-19 | Fonar Corporation | Magnetic resonance imaging system and method for detecting chiari malformations |
| ES2841379T3 (es) | 2007-03-13 | 2021-07-08 | Jds Therapeutics Llc | Procedimientos y composiciones para la liberación sostenida de cromo |
| WO2009002867A2 (en) | 2007-06-26 | 2008-12-31 | Nutrition 21, Inc. | Multiple unit dosage form having a therapeutic agents in combination with a nutritional supplement |
| EP2345003B1 (de) * | 2008-09-30 | 2019-01-16 | Analogic Corporation | 3d segmentierung von ct-bildern von gescannten gepäckstücken zwecks automatischen erkennens von bedrohungen wobei potentiell sich berührende objekte durch erosion getrennt werden und fälschlicherweise getrennte objektteile mittels eines zusammenhangsmasses oder kompaktheitsmasses der fraglichen objekteteile wieder verbunden werden |
| US20120022349A1 (en) * | 2008-10-07 | 2012-01-26 | Orsan Medical Technologies Ltd. | Diagnosis of acute strokes |
| US8064674B2 (en) * | 2008-11-03 | 2011-11-22 | Siemens Aktiengesellschaft | Robust classification of fat and water images from 1-point-Dixon reconstructions |
| US8277385B2 (en) | 2009-02-04 | 2012-10-02 | Advanced Brain Monitoring, Inc. | Method and apparatus for non-invasive assessment of hemodynamic and functional state of the brain |
| WO2011056122A1 (en) * | 2009-11-03 | 2011-05-12 | Waahlin Anders | A method and an apparatus for determining body vessel characteristics using pc-mri imaging |
| WO2012089900A1 (en) * | 2010-12-30 | 2012-07-05 | Nokia Corporation | Methods, apparatuses and computer program products for efficiently recognizing faces of images associated with various illumination conditions |
| US20120203122A1 (en) | 2011-02-09 | 2012-08-09 | Opher Kinrot | Devices and methods for monitoring cerebral hemodynamic conditions |
| AU2012223282B2 (en) | 2011-03-01 | 2017-02-02 | Nutrition 21, Llc | Compositions of insulin and chromium for the treatment and prevention of diabetes, hypoglycemia and related disorders |
| US9585568B2 (en) * | 2011-09-11 | 2017-03-07 | Steven D. Wolff | Noninvasive methods for determining the pressure gradient across a heart valve without using velocity data at the valve orifice |
| GB201121406D0 (en) | 2011-12-13 | 2012-01-25 | Isis Innovation | Systems and methods |
| GB201121404D0 (en) | 2011-12-13 | 2012-01-25 | Isis Innovation | Diagnosis |
| US8971562B2 (en) | 2012-03-02 | 2015-03-03 | Wr Nine Ventures Llc | Wireless headphone with parietal feature |
| GB201304728D0 (en) | 2013-03-15 | 2013-05-01 | Isis Innovation | Medical imaging |
| WO2015110909A1 (en) | 2014-01-23 | 2015-07-30 | Isis Innovation Limited | Motion correction to improve t10 estimation in dce-mri |
| CA3014308A1 (en) | 2016-02-11 | 2017-08-17 | Nutrition 21, Llc | Chromium containing compositions for improving health and fitness |
| WO2018173009A1 (en) | 2017-03-24 | 2018-09-27 | Oxford University Innovation Limited | Methods for extracting subject motion from multi-transmit electrical coupling in imaging of the subject |
| WO2021214714A1 (en) | 2020-04-22 | 2021-10-28 | Oxford University Innovation Limited | Partial volume estimation from surface reconstructions |
Family Cites Families (7)
| Publication number | Priority date | Publication date | Assignee | Title |
|---|---|---|---|---|
| US4276885A (en) * | 1979-05-04 | 1981-07-07 | Rasor Associates, Inc | Ultrasonic image enhancement |
| US4689560A (en) * | 1985-08-16 | 1987-08-25 | Picker International, Inc. | Low R.F. dosage magnetic resonance imaging of high velocity flows |
| US5257625A (en) * | 1990-11-26 | 1993-11-02 | Board Of Trustees Of The Leland Stanford Junior University | Method of noninvasive motion analysis by using forced closure of phase contrast MRI maps of velocity |
| US5652513A (en) * | 1996-08-01 | 1997-07-29 | Picker International, Inc. | Phase sensitive magnetic resonance technique with integrated gradient profile and continuous tunable flow |
| US6126603A (en) * | 1997-05-07 | 2000-10-03 | General Electric Company | Method and apparatus for segmenting color flow mode data using velocity information in three-dimensional ultrasound imaging |
| US5895358A (en) * | 1997-05-07 | 1999-04-20 | General Electric Company | Method and apparatus for mapping color flow velocity data into display intensities |
| KR100255730B1 (ko) * | 1997-12-15 | 2000-05-01 | 이민화 | 동맥/정맥구별이가능한초음파칼라도플러영상시스템 |
-
1999
- 1999-09-20 US US09/399,566 patent/US6245027B1/en not_active Expired - Lifetime
-
2000
- 2000-09-20 AU AU38848/01A patent/AU3884801A/en not_active Abandoned
- 2000-09-20 AT AT00963647T patent/ATE309744T1/de not_active IP Right Cessation
- 2000-09-20 DE DE60024124T patent/DE60024124T2/de not_active Expired - Lifetime
- 2000-09-20 WO PCT/US2000/025741 patent/WO2001021073A1/en not_active Ceased
- 2000-09-20 EP EP00963647A patent/EP1223865B1/de not_active Expired - Lifetime
Cited By (1)
| Publication number | Priority date | Publication date | Assignee | Title |
|---|---|---|---|---|
| RU2447833C1 (ru) * | 2010-12-16 | 2012-04-20 | Государственное учреждение здравоохранения Научно-исследовательский институт скорой помощи имени Н.В. Склифосовского Департамента здравоохранения г. Москвы | Способ контроля внутричерепного давления при проведении гипербарической оксигенации в условиях искусственной вентиляции легких у больных с внутричерепными кровоизлияниями, находящихся в критическом состоянии |
Also Published As
| Publication number | Publication date |
|---|---|
| ATE309744T1 (de) | 2005-12-15 |
| EP1223865A4 (de) | 2003-07-16 |
| WO2001021073A1 (en) | 2001-03-29 |
| DE60024124T2 (de) | 2006-07-27 |
| AU3884801A (en) | 2001-04-24 |
| DE60024124D1 (de) | 2005-12-22 |
| EP1223865A1 (de) | 2002-07-24 |
| US6245027B1 (en) | 2001-06-12 |
Similar Documents
| Publication | Publication Date | Title |
|---|---|---|
| EP1223865B1 (de) | Verbessertes verfahren zur intrakranialen druckmessung | |
| US5993398A (en) | Method of measuring intracranial pressure | |
| Holmgren et al. | Assessment of cerebral blood flow pulsatility and cerebral arterial compliance with 4D flow MRI | |
| Lee et al. | Discrimination of large venous vessels in time‐course spiral blood‐oxygen‐level‐dependent magnetic‐resonance functional neuroimaging | |
| US6073041A (en) | Physiological corrections in functional magnetic resonance imaging | |
| Bammer et al. | Time‐resolved 3D quantitative flow MRI of the major intracranial vessels: initial experience and comparative evaluation at 1.5 T and 3.0 T in combination with parallel imaging | |
| CN101380232B (zh) | 优化血管造影磁共振图像的方法 | |
| EP2299286A1 (de) | MRI mit arteriellem Spinlabeling | |
| CN116227374A (zh) | 血流动力的仿真方法及装置 | |
| US10912470B2 (en) | System and method for tracking cerebral blood flow in fMRI | |
| JP6328624B2 (ja) | 組織微小毛細血管網中の水の相対量の定量化 | |
| Strik et al. | Intracranial oscillations of cerebrospinal fluid and blood flows: analysis with magnetic resonance imaging | |
| Balédent | Imaging of the cerebrospinal | |
| Lal et al. | Non invasive blood flow features estimation in cerebral arteries from uncertain medical data | |
| Sonnabend et al. | Cerebrospinal fluid pulse wave velocity measurements: In vitro and in vivo evaluation of a novel multiband cine phase‐contrast MRI sequence | |
| Ashenagar et al. | Modeling dynamic inflow effects in fMRI to quantify cerebrospinal fluid flow | |
| Alperin | MR–Intracranial Compliance and Pressure: A Method for Noninvasive Measurement of Important Neurophysiologic Parameters | |
| US20130144154A1 (en) | Method of visualization of tissue perfusion by means of assessing BOLD signal fluctuations, an apparatus therefor and the use thereof | |
| US8315450B2 (en) | Method and system for display of medical image data | |
| Piechnik et al. | Magnetic resonance measurement of blood and CSF flow rates with phase contrast–normal values, repeatability and CO2 reactivity | |
| WO2024081779A2 (en) | Imaging slow flow dynamics of cerebrospinal fluid using magnetic resonance imaging | |
| Golzan et al. | Visualization of orbital flow by means of phase contrast MRI | |
| Hamilton et al. | Quantification of pulsatile cerebrospinal fluid flow within the prepontine cistern | |
| US20200397317A1 (en) | Visualization of 4d dynamic pulsatile flow | |
| Poutanen et al. | Multiphase segmented k-space velocity mapping in pulsatile flow waveforms |
Legal Events
| Date | Code | Title | Description |
|---|---|---|---|
| PUAI | Public reference made under article 153(3) epc to a published international application that has entered the european phase |
Free format text: ORIGINAL CODE: 0009012 |
|
| 17P | Request for examination filed |
Effective date: 20020419 |
|
| AK | Designated contracting states |
Kind code of ref document: A1 Designated state(s): AT BE CH CY DE DK ES FI FR GB GR IE IT LI LU MC NL PT SE |
|
| AX | Request for extension of the european patent |
Free format text: AL;LT;LV;MK;RO;SI |
|
| A4 | Supplementary search report drawn up and despatched |
Effective date: 20030602 |
|
| RIC1 | Information provided on ipc code assigned before grant |
Ipc: 7G 01R 33/563 B Ipc: 7A 61B 8/02 A Ipc: 7A 61B 5/03 B |
|
| 17Q | First examination report despatched |
Effective date: 20040521 |
|
| GRAP | Despatch of communication of intention to grant a patent |
Free format text: ORIGINAL CODE: EPIDOSNIGR1 |
|
| GRAS | Grant fee paid |
Free format text: ORIGINAL CODE: EPIDOSNIGR3 |
|
| GRAA | (expected) grant |
Free format text: ORIGINAL CODE: 0009210 |
|
| AK | Designated contracting states |
Kind code of ref document: B1 Designated state(s): AT BE CH CY DE DK ES FI FR GB GR IE IT LI LU MC NL PT SE |
|
| PG25 | Lapsed in a contracting state [announced via postgrant information from national office to epo] |
Ref country code: IT Free format text: LAPSE BECAUSE OF FAILURE TO SUBMIT A TRANSLATION OF THE DESCRIPTION OR TO PAY THE FEE WITHIN THE PRESCRIBED TIME-LIMIT;WARNING: LAPSES OF ITALIAN PATENTS WITH EFFECTIVE DATE BEFORE 2007 MAY HAVE OCCURRED AT ANY TIME BEFORE 2007. THE CORRECT EFFECTIVE DATE MAY BE DIFFERENT FROM THE ONE RECORDED. Effective date: 20051116 Ref country code: CH Free format text: LAPSE BECAUSE OF FAILURE TO SUBMIT A TRANSLATION OF THE DESCRIPTION OR TO PAY THE FEE WITHIN THE PRESCRIBED TIME-LIMIT Effective date: 20051116 Ref country code: AT Free format text: LAPSE BECAUSE OF FAILURE TO SUBMIT A TRANSLATION OF THE DESCRIPTION OR TO PAY THE FEE WITHIN THE PRESCRIBED TIME-LIMIT Effective date: 20051116 Ref country code: BE Free format text: LAPSE BECAUSE OF FAILURE TO SUBMIT A TRANSLATION OF THE DESCRIPTION OR TO PAY THE FEE WITHIN THE PRESCRIBED TIME-LIMIT Effective date: 20051116 Ref country code: FI Free format text: LAPSE BECAUSE OF FAILURE TO SUBMIT A TRANSLATION OF THE DESCRIPTION OR TO PAY THE FEE WITHIN THE PRESCRIBED TIME-LIMIT Effective date: 20051116 Ref country code: LI Free format text: LAPSE BECAUSE OF FAILURE TO SUBMIT A TRANSLATION OF THE DESCRIPTION OR TO PAY THE FEE WITHIN THE PRESCRIBED TIME-LIMIT Effective date: 20051116 |
|
| REG | Reference to a national code |
Ref country code: GB Ref legal event code: FG4D |
|
| REG | Reference to a national code |
Ref country code: CH Ref legal event code: EP |
|
| REG | Reference to a national code |
Ref country code: IE Ref legal event code: FG4D |
|
| REF | Corresponds to: |
Ref document number: 60024124 Country of ref document: DE Date of ref document: 20051222 Kind code of ref document: P |
|
| PG25 | Lapsed in a contracting state [announced via postgrant information from national office to epo] |
Ref country code: SE Free format text: LAPSE BECAUSE OF FAILURE TO SUBMIT A TRANSLATION OF THE DESCRIPTION OR TO PAY THE FEE WITHIN THE PRESCRIBED TIME-LIMIT Effective date: 20060216 Ref country code: DK Free format text: LAPSE BECAUSE OF FAILURE TO SUBMIT A TRANSLATION OF THE DESCRIPTION OR TO PAY THE FEE WITHIN THE PRESCRIBED TIME-LIMIT Effective date: 20060216 Ref country code: GR Free format text: LAPSE BECAUSE OF FAILURE TO SUBMIT A TRANSLATION OF THE DESCRIPTION OR TO PAY THE FEE WITHIN THE PRESCRIBED TIME-LIMIT Effective date: 20060216 |
|
| PG25 | Lapsed in a contracting state [announced via postgrant information from national office to epo] |
Ref country code: ES Free format text: LAPSE BECAUSE OF FAILURE TO SUBMIT A TRANSLATION OF THE DESCRIPTION OR TO PAY THE FEE WITHIN THE PRESCRIBED TIME-LIMIT Effective date: 20060227 |
|
| PG25 | Lapsed in a contracting state [announced via postgrant information from national office to epo] |
Ref country code: PT Free format text: LAPSE BECAUSE OF FAILURE TO SUBMIT A TRANSLATION OF THE DESCRIPTION OR TO PAY THE FEE WITHIN THE PRESCRIBED TIME-LIMIT Effective date: 20060417 |
|
| REG | Reference to a national code |
Ref country code: CH Ref legal event code: PL |
|
| PG25 | Lapsed in a contracting state [announced via postgrant information from national office to epo] |
Ref country code: IE Free format text: LAPSE BECAUSE OF NON-PAYMENT OF DUE FEES Effective date: 20060920 |
|
| PLBE | No opposition filed within time limit |
Free format text: ORIGINAL CODE: 0009261 |
|
| STAA | Information on the status of an ep patent application or granted ep patent |
Free format text: STATUS: NO OPPOSITION FILED WITHIN TIME LIMIT |
|
| PG25 | Lapsed in a contracting state [announced via postgrant information from national office to epo] |
Ref country code: MC Free format text: LAPSE BECAUSE OF NON-PAYMENT OF DUE FEES Effective date: 20060930 |
|
| 26N | No opposition filed |
Effective date: 20060817 |
|
| EN | Fr: translation not filed | ||
| GBPC | Gb: european patent ceased through non-payment of renewal fee |
Effective date: 20060920 |
|
| REG | Reference to a national code |
Ref country code: IE Ref legal event code: MM4A |
|
| PG25 | Lapsed in a contracting state [announced via postgrant information from national office to epo] |
Ref country code: GB Free format text: LAPSE BECAUSE OF NON-PAYMENT OF DUE FEES Effective date: 20060920 |
|
| PG25 | Lapsed in a contracting state [announced via postgrant information from national office to epo] |
Ref country code: FR Free format text: LAPSE BECAUSE OF FAILURE TO SUBMIT A TRANSLATION OF THE DESCRIPTION OR TO PAY THE FEE WITHIN THE PRESCRIBED TIME-LIMIT Effective date: 20070105 |
|
| PG25 | Lapsed in a contracting state [announced via postgrant information from national office to epo] |
Ref country code: LU Free format text: LAPSE BECAUSE OF NON-PAYMENT OF DUE FEES Effective date: 20060920 |
|
| PG25 | Lapsed in a contracting state [announced via postgrant information from national office to epo] |
Ref country code: FR Free format text: LAPSE BECAUSE OF FAILURE TO SUBMIT A TRANSLATION OF THE DESCRIPTION OR TO PAY THE FEE WITHIN THE PRESCRIBED TIME-LIMIT Effective date: 20051116 Ref country code: CY Free format text: LAPSE BECAUSE OF FAILURE TO SUBMIT A TRANSLATION OF THE DESCRIPTION OR TO PAY THE FEE WITHIN THE PRESCRIBED TIME-LIMIT Effective date: 20051116 |
|
| PGFP | Annual fee paid to national office [announced via postgrant information from national office to epo] |
Ref country code: NL Payment date: 20090929 Year of fee payment: 10 |
|
| PGFP | Annual fee paid to national office [announced via postgrant information from national office to epo] |
Ref country code: DE Payment date: 20101101 Year of fee payment: 11 |
|
| REG | Reference to a national code |
Ref country code: NL Ref legal event code: V1 Effective date: 20110401 |
|
| PG25 | Lapsed in a contracting state [announced via postgrant information from national office to epo] |
Ref country code: NL Free format text: LAPSE BECAUSE OF NON-PAYMENT OF DUE FEES Effective date: 20110401 |
|
| REG | Reference to a national code |
Ref country code: DE Ref legal event code: R119 Ref document number: 60024124 Country of ref document: DE Effective date: 20120403 |
|
| PG25 | Lapsed in a contracting state [announced via postgrant information from national office to epo] |
Ref country code: DE Free format text: LAPSE BECAUSE OF NON-PAYMENT OF DUE FEES Effective date: 20120403 |