EP1293780A2 - Spezifisches Bindungsanalyseverfahren - Google Patents
Spezifisches Bindungsanalyseverfahren Download PDFInfo
- Publication number
- EP1293780A2 EP1293780A2 EP02020330A EP02020330A EP1293780A2 EP 1293780 A2 EP1293780 A2 EP 1293780A2 EP 02020330 A EP02020330 A EP 02020330A EP 02020330 A EP02020330 A EP 02020330A EP 1293780 A2 EP1293780 A2 EP 1293780A2
- Authority
- EP
- European Patent Office
- Prior art keywords
- specific binding
- detection zone
- analyte
- sample
- substance
- Prior art date
- Legal status (The legal status is an assumption and is not a legal conclusion. Google has not performed a legal analysis and makes no representation as to the accuracy of the status listed.)
- Granted
Links
Images

Classifications
-
- G—PHYSICS
- G01—MEASURING; TESTING
- G01N—INVESTIGATING OR ANALYSING MATERIALS BY DETERMINING THEIR CHEMICAL OR PHYSICAL PROPERTIES
- G01N33/00—Investigating or analysing materials by specific methods not covered by groups G01N1/00 - G01N31/00
- G01N33/48—Biological material, e.g. blood, urine; Haemocytometers
- G01N33/50—Chemical analysis of biological material, e.g. blood, urine; Testing involving biospecific ligand binding methods; Immunological testing
- G01N33/53—Immunoassay; Biospecific binding assay; Materials therefor
- G01N33/543—Immunoassay; Biospecific binding assay; Materials therefor with an insoluble carrier for immobilising immunochemicals
- G01N33/54306—Solid-phase reaction mechanisms
-
- G—PHYSICS
- G01—MEASURING; TESTING
- G01N—INVESTIGATING OR ANALYSING MATERIALS BY DETERMINING THEIR CHEMICAL OR PHYSICAL PROPERTIES
- G01N33/00—Investigating or analysing materials by specific methods not covered by groups G01N1/00 - G01N31/00
- G01N33/48—Biological material, e.g. blood, urine; Haemocytometers
- G01N33/50—Chemical analysis of biological material, e.g. blood, urine; Testing involving biospecific ligand binding methods; Immunological testing
- G01N33/53—Immunoassay; Biospecific binding assay; Materials therefor
- G01N33/543—Immunoassay; Biospecific binding assay; Materials therefor with an insoluble carrier for immobilising immunochemicals
- G01N33/54366—Apparatus specially adapted for solid-phase testing
- G01N33/54386—Analytical elements
- G01N33/54387—Immunochromatographic test strips
- G01N33/54388—Immunochromatographic test strips based on lateral flow
Definitions
- the present invention relates to a specific binding analysis method for performing a qualitative or quantitative analysis of an analyte in a sample.
- chromatography which is a type of immunoassay
- a liquid sample is brought into contact with a matrix comprising, for example, a porous carrier or a fine particle-packed carrier in each of which a specific binding substance is insolubilized or immobilized.
- a matrix comprising, for example, a porous carrier or a fine particle-packed carrier in each of which a specific binding substance is insolubilized or immobilized.
- the presence or absence of an analyte in the sample is analyzed by utilizing a phenomenon in which the liquid sample flows out along the matrix by permeating force caused by capillarity (see, e.g., Japanese Patent Nos. 2504923 and 2667793, Japanese Examined Patent Publication No. Hei 7-78503, Japanese Unexamined Patent Publication Nos. Hei 10-73592 and Hei 8-240591).
- a specific binding substance which is labeled with a labeling material freely detectable by naked eyes or with an optical method, is specifically bound to an analyte.
- the specific binding substance specifically bound to the analyte is then bound to a binding material immobilized on the matrix.
- the presence or absence of the analyte in the sample is analyzed, according to the labeled amount of the specific binding substance immobilized on the matrix.
- the carrier comprising the matrix used for such chromatography has a large surface area where a great amount of a specific binding substance can be immobilized, so that the collision between reacting molecules, which may cause a specific binding reaction, occurs with a higher frequency as compared with the reaction in a liquid phase. Accordingly, the above-described chromatography is advantageous from the viewpoint of the measurement sensitivity and the measurement time.
- the conventional chromatography has a problem called a prozone phenomenon.
- the prozone phenomenon is a phenomenon in which the concentration of an analyte cannot be unambiguously determined from a signal intensity attributed to a specific binding reaction.
- an analyte specifically bound to a labeled specific binding substance a labeling material-specific binding substance-analyte complex
- an analyte not bound to the labeled specific binding substance a simple substance
- the analyte bound to the labeled specific binding substance and the analyte as the simple substance compete to specifically bind to a binding material immobilized on the matrix.
- the analyte as the simple substance is undesirably bound to the binding material, and the analyte bound to the labeled specific binding substance is flowed out due to permeating force caused by capillarity.
- the amount of the analyte determined from the labeled amount of the specific binding substance is measured to be abnormally small, thereby in some cases preventing an accurate determination of the presence or absence of the analyte in the sample.
- measurement accuracy is high, particularly in the low concentration range, because a labeling material-first specific binding substance-analyte complex is immobilized in a first detection zone where a second specific binding substance is immobilized, and a quantitative analysis is performed based on the intensity of a signal in the first detection zone.
- the present invention relates to a specific binding analysis method comprising the steps of:
- step (E) when concentration 1 and concentration 2, which are different from one another, are derived at the time of determining a concentration of the analyte based on the intensity of the signal 1 obtained in the step (D), a concentration of the analyte is determined after judging which one of the concentration 1 and the concentration 2 is true based on the intensity of the signal 2.
- the above-described specific binding analysis method further comprises judging whether or not a prozone phenomenon is present based on the intensity of the signal 2 obtained in the step (D).
- the sample having been subjected to the step (A) is brought into contact with a first detection zone where a second specific binding substance is immobilized, to allow an excess of the analyte, which has not bound to the first specific binding substance, and the complex to bind to the second specific binding substance, thereby immobilizing the excess of the analyte and the complex in the first detection zone, and that in the step (C), the sample having been subjected to the step (B) is brought into contact with a second detection zone where a substance identical to the analyte or an analog of the analyte is immobilized, to allow the first specific binding substance in the complex to bind to the substance or the analog, thereby immobilizing the complex in the second detection zone, the step (C) being performed subsequently to the step (B).
- the sample having been subjected to the step (A) is brought into contact with a second detection zone where a substance identical to the analyte or an analog of the analyte is immobilized, to allow the first specific binding substance in the complex to bind to the substance or the analog, thereby immobilizing the complex in the second detection zone, and that in the step (B), the sample having been subjected to the step (C) is brought into contact with a first detection zone where a second specific binding substance is immobilized, to allow an excess of the analyte, which has not bound to the first specific binding substance, and the complex to bind to the second specific binding substance, thereby immobilizing the excess of the analyte and the complex in the first detection zone, the step (B) being performed subsequently to the step (C).
- the sample having been subjected to the step (A) is dropped upstream from the first detection zone and the second detection zone, to allow the sample to migrate, by permeating force caused by capillarity, to each of the first detection zone and the second detection zone on the matrix, followed by performing the steps (B) to (E).
- the sample is dropped to the retention zone or upstream therefrom, to allow the sample to migrate, by permeating force caused by capillarity, to each of the retention zone, the first detection zone and the second detection zone on the matrix, followed by performing the steps (A) to (E).
- the signal attributed to the labeling material is a signal exhibiting coloration, fluorescence or luminescence.
- At least one of the first specific binding substance and the second specific binding substance is an antibody.
- the labeling material is a particle containing a metal sol, a dye sol or a fluorescent substance, or a colored latex particle.
- the intensity of the signal 1 and the intensity of the signal 2 are continuously measured in an order in which the intensity of the signal 1 is measured before measuring the intensity of the signal 2, along the migrating direction of the analyte.
- step (D) a graph showing the relation between a position of the analyte in the migrating direction thereof and each of the intensity of the signal 1 and the intensity of the signal 2 each measured continuously, is produced, and that in the step (E), a qualitative or quantitative analysis is performed based on the graph.
- the graph as used herein refers to either linear line or curved line.
- step (E) a quantitative analysis is performed based on a quantitative information previously obtained from a sample having a known concentration of an analyte, as well as on the intensity of the signal 1 and the intensity of the signal 2 each obtained in the step (D).
- the present invention provides a specific binding analysis device comprising:
- the above-described specific binding analysis device further comprises a retention zone where a specific binding substance labeled with a detectable labeling material, the retention zone being provided upstream from the first detection zone on the matrix, wherein the sample is allowed to migrate, by permeating force caused by capillarity, from the retention zone to each of the first detection zone and the second detection zone.
- the above-described specific binding analysis device further comprises a sample application zone provided upstream from the retention zone on the matrix, wherein the sample is allowed to migrate, by permeating force caused by capillarity, from the sample application zone to each of the retention zone, the first detection zone and the second detection zone.
- the above-described specific binding analysis device further comprises a sample application zone provided upstream from the first detection zone on the matrix, wherein the sample is allowed to migrate, by permeating force caused by capillarity, from the sample application zone to each of the first detection zone and the second detection zone.
- FIG. 1 is a schematic oblique view of a test strip which can be used as a specific binding analysis device in the specific binding analysis method of the present invention.
- a test strip 1 is a sheet-shaped test strip, for example, a chromatography test strip having a matrix 2, which is a region where a sample containing an analyte can permeate and develop, formed on the surface thereof.
- the strip 1 comprises, for example, a porous carrier or a fine particle-packed carrier in each of which the sample can permeate and develop by capillarity.
- the sample application zone 3 is a region where the sample is applied on the matrix 2.
- the retention zone 4 is placed between the sample application zone 3 and a region including the first detection zone 5 and the second detection zone 6.
- the retention zone 4 is a region where the applied sample flows in and a first specific binding substance labeled with a labeling material is provided.
- the first detection zone 5 is a region where the sample that has passed through the retention zone 4 flows in and a second specific binding substance as a binding material is immobilized.
- the second detection zone 6 is a region where the sample that has passed through the retention zone 4 and subsequently through the first detection zone 5 flows in and an analyte or analog thereof is immobilized.
- the sample used in the specific binding analysis method of the present invention is a liquid sample suspected of containing an analyte.
- examples include urine, blood serum, blood plasma, whole blood, saliva, lacrimal fluid, spinal fluid and secretion from papillae.
- the sample may also be one prepared by suspending or dissolving a solid substance, a gel substance or sol substance of mucus, human body tissue, cell or the like, in a liquid such as a buffer solution, extract solution or dissolved solution.
- the analyte used in the present invention may be any substance having a specific binding partner capable of specifically binding thereto.
- examples include various proteins, polypeptides, glycoproteins, polysaccharides, complex glycolipids, nucleic acids, effector molecules, receptor molecules, enzymes and inhibitors, each of which functions as an antibody or antigen.
- tumor markers such as ⁇ -fetoprotein, carcinoembryonic antigen (CEA), CA 125 and CA 19-9; various proteins, glycoproteins or complex glycolipids such as ⁇ 2-microglobulin ( ⁇ 2m) and ferritin; various hormones such as estradiol (E2), estriol (E3), human chorionic gonadotropin (hCG), luteinizing hormone (LH) and human placental lactogen (hPL); various virus-associated antigens or virus-associated antibodies such as HBs antigen, HBs antibody, HBc antigen, HBc antibody, HCV antibody and HIV antibody; various allergens and IgE antibodies thereto; narcotic drugs, medical drugs and metabolites thereof; and virus-associated and tumor-associated nucleic acids having a polynucleotide sequence.
- cancer markers such as ⁇ -fetoprotein, carcinoembryonic antigen (CEA), CA 125 and CA 19-9
- various proteins, glycoproteins or complex glycolipids
- the specific binding substance used in the present invention may be any substance capable of specifically binding to the above-described analytes. Examples include antibodies, antigens, glycoproteins, polysaccharides, complex glycolipids, nucleic acids, effector molecules, receptor molecules, enzymes and inhibitors.
- the first specific binding substance labeled with a labeling material and the second specific binding substance are employed, and that the labeled first specific binding substance and the second specific binding substance are able to bind to each other, via the analyte.
- at least one of the first specific binding substance and the second specific binding substance is preferably an antibody, and more preferably a monoclonal antibody.
- the first specific binding substance and the second specific binding substance may not necessarily be same substances.
- the analyte does not have a plurality of same epitopes, it is preferable that the first specific binding substance and the second specific binding substance have different specificities against respective different epitopes.
- same substances may be used as the first specific binding substance and second specific binding substance.
- the substance to be immobilized in the second detection zone 6 may be the analyte itself or analog thereof exhibiting the same behavior as that of the analyte.
- any substance capable of binding to the first specific binding substance labeled with a labeling material may be employed.
- a substance having the same epitope as that of the analyte to be bound to the first specific binding substance may also be employed.
- the labeling material used in the present invention may be any substance whose presence can be freely detected. Examples include not only a direct label such as a labeling material visible by naked eyes in the natural state, a labeling material visible with the use of an optical filter or a labeling material visible when stimulated with an ultraviolet ray or the like to promote its fluorescence, but also an indirect label such as a labeling material whose visible signal is detectable by adding therewith a developing reagent such as a substrate.
- Examples of the direct label include fine colored particles such as dye sols, metal sols or colored latex particles, and particles containing a fluorescent substance.
- examples of the indirect label include enzymes such as alkaline phosphatase and horseradish peroxidase.
- the direct label may be preferably used, since it generates a signal detectable without addition of a different reagent and thereby instantaneously provides an analytical result, as well as being durable and stable.
- urine was used as a sample and an hCG was used as an analyte contained in the sample. Further, an anti-hCG monoclonal antibody capable of participating in a sandwich reaction with the hCG was used both as a first specific binding substance and as a second specific binding substance, and colloidal gold was used as a labeling material.
- the use of colored particles of colloidal gold or the like allows a labeled portion to be concentrated in a small zone or volume, because the colored particles are minute. This enables an accurate qualitative and/or quantitative analysis of the hCG to be performed in the first detection zone 5 and the second detection zone 6, using a signal attributed to a reaction in which colloidal gold serving as the labeling material for the first specific binding substance participates.
- the sample to be subjected to a qualitative or quantitative analysis is firstly applied to the sample application zone 3.
- the applied sample migrates from the sample application zone 3 to the retention zone 4 in the matrix 2, while permeating and developing by capillarity. That is, the sample containing an analyte is brought into contact with the retention zone retaining the first specific binding substance labeled with a detectable labeling material, to allow the analyte to bind to the first specific binding substance, thereby obtaining a labeling material-first specific binding substance-analyte complex (step (A)).
- any material capable of forming a site where the analyte and the specific binding substance can develop may be employed as the material constituting the matrix 2.
- Examples include a porous carrier, a gel carrier and a fine particle-packed carrier.
- nitrocellulose is employed.
- Nitrocellulose is superior to other matrix materials such as paper, because it is inherently capable of binding to protein without being previously sensitized.
- a specific binding substance such as an antibody can be reliably immobilized, without requiring any chemical treatment which might suppress the specific binding capability of the specific binding substance.
- the immobilization of the antibody necessitates a chemical binding to be performed using CNBr, carbonyldiimidazole, tressil chloride or the like.
- nitrocellulose is commercially available in various pore sizes, so that the matrix material can be readily selected according to requirements such as the flow rate of sample.
- a nitrocellulose sheet it is preferable to improve the strength and handleability by attaching (backing) on the back of the nitrocellulose sheet, a sheet-like reinforcing material made of plastic or the like.
- a reinforced nitrocellulose sheet can be readily produced by forming a thin film of nitrocellulose on a reinforcing material.
- the antibody After the antibody is immobilized in the detection zone, it is preferable to block the matrix to reduce nonspecific absorption to the matrix.
- the blocking may be performed by application of, for example, protein (e.g., bovine serum albumin and milk protein), polyvinylalcohol or ethanolamine, or a combination thereof.
- the anti-hCG monoclonal antibody as the first specific binding substance capable of immunologically binding to the hCG as the analyte.
- the anti-hCG monoclonal antibody is labeled with colloidal gold serving as the labeling material.
- the hCG as the analyte contained in a urine sample flows into the retention zone 4, and it specifically binds to the first specific binding substance therein to give a labeling material-first specific binding substance-analyte complex.
- the hCG as the analyte is provided with colloidal gold via the anti-hCG monoclonal antibody.
- the first specific binding substance in the dry state.
- a reagent containing the first specific binding substance is applied to the matrix, followed by a freeze-drying treatment, thereby retaining in the retention zone 4, the first specific binding substance in the dry state.
- the first specific binding substance is retained in the retention zone 4.
- the matrix 2 is wetted with the liquid sample permeating and developing therein, the first specific binding substance can freely migrate on the matrix 2.
- the sample containing the complex in which the analyte is bound to the first specific binding substance, flows into the first detection zone 5 and the second detection zone 6 provided on the matrix 2, while permeating and developing in the matrix 2.
- the anti-hCG monoclonal antibody as the second specific binding substance capable of binding to the hCG as the analyte is substantially immobilized.
- the matrix comprises nitrocellulose
- the antibody can be immobilized by applying to the matrix a reagent containing the above antibody to allow the antibody to be absorbed in the matrix, both physically and chemically.
- This anti-hCG monoclonal antibody as the second specific binding substance does not migrate even when it is in the wet state.
- the analyte (hCG) or analog thereof capable of binding to the anti-hCG monoclonal antibody as the first specific binding substance is substantially immobilized. This analyte and analog thereof also do not migrate when they are in the wet state.
- the sample may be applied to the sample application zone after being reacted with the first specific binding substance outside the test reagent strip.
- the first specific binding substance to be reacted with the sample outside the strip may be the one not bound to the labeling material. Further, it may also be the one bound to a labeling material which generates a signal different from that of the labeled first specific binding substance in the matrix.
- the labeled first specific binding substance is previously reacted with the sample outside the strip, it is not necessary to provide on the matrix 2, the retention zone 4 where the first specific binding substance is provided.
- the analyte in the sample that has reached the first detection zone 5 specifically binds to the second specific binding substance.
- the analyte is immobilized in the first detection zone 5, via the second specific binding substance.
- the colloidal gold labeled anti-hCG monoclonal antibody as the first specific binding substance binds, via the hCG as the analyte, to the anti-hCG monoclonal antibody as the second specific binding substance immobilized in the first detection zone 5.
- the sample having been subjected to the step (A) is brought into contact with a first detection zone where a second specific binding substance is immobilized, to allow an excess of the analyte, which has not been bound to the first specific binding substance, to bind to the second specific binding substance, thereby immobilizing the excess of the analyte in the first detection zone (step (B)).
- the hCG not specifically bound to the colloidal gold labeled anti-hCG monoclonal antibody and the hCG specifically bound to the colloidal gold labeled anti-hCG monoclonal antibody compete to specifically bind to the second specific binding substance in the first detection zone 5.
- the hCG as the simple substance specifically binds to the specific binding substance immobilized in the first detection zone 5 in preference to the hCG specifically bound to the colloidal gold labeled anti-hCG monoclonal antibody.
- the signal intensity detected in the first detection zone 5 does not reflect the amount of the hCG in the sample.
- this phenomenon in which the signal intensity does not increase according to the amount of the analyte, is called a prozone phenomenon.
- the colloidal gold labeled anti-hCG monoclonal antibody as the first specific binding substance that have reached the second detection zone 6, those capable of further binding to the hCG as the analyte specifically bind to the hCG as the immobilized analyte thereby to be immobilized in the second detection zone 6.
- the colloidal gold labeled anti-hCG monoclonal antibody as the first specific binding substance is immobilized in the second detection zone 6, via the hCG as the analyte.
- the sample having been subjected to the step (B) is brought into contact with a second detection zone where a substance identical to the analyte or an analog of the analyte is immobilized, to allow the first specific binding substance in the complex to bind to the analyte or the analog, thereby immobilizing the complex in the second detection zone (step (C)).
- the sample develops such that the sample keeps flowing even after it migrates beyond the first detection zone 5 and the second detection zone 6.
- a sufficient amount of the sample is applied to the sample application zone 3 so that an excess of the labeled first specific binding substance, which does not participate in the specific binding reaction in the first detection zone 5 and the second detection zone 6, is allowed to be washed off from the first detection zone 5 and the second detection zone 6, by the sample flowing through the detection zones. Therefore, an absorption zone may be provided on the end of the matrix 2 where the sample develops.
- the material constituting the absorption zone may be any material having an absorptive property to sufficiently wash off the components other than the analyte. Examples include the glass fiber filter paper GA-200 (manufactured by TOYO KABUSHIKI KAISHA).
- any unreacted substance can be washed off along with the flow of the sample, so that after the specific binding reaction, a signal attributed to the specific binding reaction can be detected in the first detection zone 5 and the second detection zone 6, without performing separation of the unreacted substance.
- the specific binding analysis method of the present invention it is possible to measure a signal intensity attributed to the specific binding reaction between the analyte and the specific binding substance, at any portion in a site where the specific binding reaction occurs.
- it is preferable to perform a qualitative or quantitative analysis of the analyte in the sample by measuring a signal intensity or a distribution of the signal intensity in each of the first detection zone 5 and the second detection zone 6, or in a wide region including these detection zones.
- an intensity of signal 1 and that of signal 2, which are attributed to the labeling material and are obtained in the first detection zone and the second detection zone, are respectively measured (step (D)), and a concentration of the analyte in the sample is determined based on the intensity of the signal 1 and that of the signal 2, thereby performing a qualitative or quantitative analysis of the analyte in the sample (step (E)).
- a quantitative information showing the correlation between the distribution of the signal intensity and the concentration of an analyte may be previously prepared using samples having known concentrations.
- the concentration of the analyte may also be determined based on the quantitative information and the distribution of the signal intensity obtained by the actual analysis.
- FIG. 2 is a schematic diagram illustrating an analysis apparatus used along with the strip 1 in the specific binding analysis method of the present invention.
- the analysis device comprises, for example, a first electrode 11, a second electrode 12, a start-of-measurement detector 10, an analyzer 9, a light source 7 and a light detector 8.
- the first electrode 11 and the second electrode 12 are used for measuring the electrical conductivity of the sample application zone 3.
- the start-of-measurement detector 10 detects the application of a sample to the sample application zone 3 based on the change of the electrical conductivity, and supplies a detection signal to the analyzer 9. After an elapse of a predetermined time from the receiving of the detection signal, the analyzer 9 controls a stage 13 to scan the entire test strip 1 in the direction shown by the arrow Z.
- the analyzer 9 controls the light source 7, and analyzes an output signal from the light detector 8.
- the light source 7 applies light to each of the first detection zone 5 and the second detection zone 6.
- the light detector 8 detects a reflected light from each of the first detection zone 5 and the second detection zone 6.
- the start-of-measurement detector 10 detects the application of the sample to the sample application zone 3.
- the test strip 1 applied with the sample may be placed in the specific binding analysis device.
- the analyzer 9 controls the stage 13 to scan the test strip 1 in the direction shown by the arrow Z. At the same time, the analyzer 9 controls both the light source 7 and the light detector 8 to measure, at a predetermined time interval, the signal intensity caused by the scanning, thereby giving chromatograms shown in FIGS. 3 and 4.
- the light source 7 applies light of a predetermined wavelength (e.g., 650 nm) to a region including the first detection zone 5 and the second detection zone 6, whereupon the light detector 8 detects the reflected light.
- a predetermined wavelength e.g., 650 nm
- any wavelength suitable for the coloration of the sample or that of the labeling material in the first detection zone 5 and the second detection zone 6, may be appropriately selected.
- the signal as used herein may be any detectable signal that can be generated by a reaction in which a labeling material participates, for example: fluorescence measurable with a fluorometer; luminescence measurable with a luminescence photometer; and coloration measurable with a visual evaluation or with a color-difference meter in the first detection zone 5 and the second detection zone 6.
- fluorescence measurable with a fluorometer for example: fluorescence measurable with a fluorometer; luminescence measurable with a luminescence photometer; and coloration measurable with a visual evaluation or with a color-difference meter in the first detection zone 5 and the second detection zone 6.
- the intensity or the like of a reflected light, or fluorescence or luminescence generated in the first detection zone 4 and the second detection zone 6 is detected in the first detection zone 5 and the second detection zone 6.
- the detection of the above-described signal is continuously performed, while relatively changing the position of the test strip 1 and the positions of the light source 7 and light detector 8 in the direction parallel to the permeating direction of the sample on the test strip 1, that is, in the direction shown by the arrow Z. Either one of the test strip 1 and the light source 7 may be moved, or both of them may be moved together, in the direction parallel to the permeating direction of the sample.
- the light detector 8 sends the signal to the analyzer 9.
- the analyzer 9 analyzes the signal from the light detector 8, thereby measuring the intensity of the signal. Then, the analyzer 9 produces a correlation curve representing the relation between the measured signal intensity and the scanned distance, that is, a chromatogram, and analyses the same.
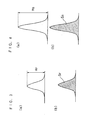
- FIGS. 3 and 4 are schematic diagrams respectively showing the correlation curves (chromatograms) plotted by analyzing the distribution of the signal intensity in the vicinities of the first detection zone 5 and the second detection zone 6.
- the chromatograms were plotted by applying light from the light source 7 onto the matrix 2 while scanning the test strip 1 or the light source 7, and then analyzing a reflected light detected by the light detector 8 with the analyzer 9.
- the virtual vertical axis denotes the signal intensity on or in the vicinity of the first detection zone 5 or the second detection zone 6
- the horizontal axis denotes the region of the first detection zone 5 or the second detection zone 6 (the scanned distance from the sample application zone 3).
- each chromatogram may be measured as a signal intensity attributed to a specific binding reaction.
- the area of each chromatogram may also be measured as a signal intensity attributed to a specific binding reaction.
- the heights of the chromatograms of the first detection zone 5 and the second detection zone 6 are denoted as Hs and Hr, respectively.
- the areas of the chromatograms of the first detection zone 5 and the second detection zone 6 are denoted as Ss and Sr, respectively.
- the chromatograms are obtained by continuously measuring a reflected light in a region including the first detection zone 5 and the second detection zone 6, while scanning the test strip 1 or the light source 7.
- a signal intensity in an upstream portion of a region including the first detection zone 5 and the second detection zone 6, i.e., a portion of the region which is closer to the sample application zone 3, is connected with a straight line to a signal intensity in a downstream portion of the region, i.e., a portion of the region which is more distant from the sample application zone 3.
- a distance obtained by subtracting the height of the straight line from that of the highest value of the chromatogram of each of the first detection zone 5 and the second detection zone 6, may be considered as the height of the chromatogram.
- the area of the region surrounded by the straight line and the chromatograms may be considered as the area of the chromatogram.
- a signal intensity attributed to a background can be subtracted from the signal intensity in each of the first detection zone 5 and the second detection zone 6, thereby making it possible to obtain a signal intensity attributed to a specific binding reaction. Accordingly, it is possible to perform a qualitative or quantitative analysis of an analyte even in a colored sample such as whole blood, without being influenced by the background and foreign matter.
- a signal intensity in an arbitrary portion on the matrix 2 other than the first detection zone 5 and the second detection zone 6 may also be considered as a signal intensity attributed to the background.
- a signal intensity of the smallest value may be selected from signal intensities in the vicinity of each of the first detection zone 5 and the second detection zone 6.
- the background as used herein refers to a behavior exhibited by a sample containing no analyte.
- a signal intensity attributed to the nonspecific absorption of the specific binding substance or the like in each of the first detection zone 5 and the second detection zone 6, and coloration or the like of the sample itself in the case of measuring a signal attributed to the coloration have an influence on the background, thereby reducing the measurement sensitivity.
- the foreign matter generally refers to a substance other than an analyte contained in a sample.
- the foreign matter that can cause a problem in a specific binding analysis method is a substance such as the one which exhibits a similar behavior to that of the analyte in its binding reaction with a specific binding substance (e.g., an analog of the analyte), or the one which impedes a specific binding reaction between the analyte and the specific binding substance, for example, by binding to the analyte.
- a specific binding substance e.g., an analog of the analyte
- the analyzer 9 contains a quantitative information in a memory (not shown), and determines the concentration of the analyte by making reference to the quantitative information as well as Hs and Hr, or Ss and Sr, each of which is the analyzed value.
- the specific binding analysis method of the present invention was carried out using the strip 1 shown in FIG. 1 and the analysis device shown in FIG. 2.
- the concentration of the analyte was determined from Hs and Hr by the analyzer 9.
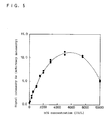
- FIG. 5 shows a graph showing the relation between signal intensity Hs and the hCG concentration in the case of applying light having a wavelength of 650 nm to the first detection zone 5.
- the samples used herein were each prepared by adding an hCG to a control urine for accuracy control whose hCG concentration was substantially zero.
- the hCG concentrations of the samples were set to 0 (IU/L), 10 (IU/L), 30 (IU/L), 50 (IU/L), 100 (IU/L), 300 (IU/L), 500 (IU/L), 1000 (IU/L), 1500 (IU/L), 2000 (IU/L), 3000 (IU/L), 5000 (IU/L), 7500 (IU/L) and 10000 (IU/L), respectively. Measurement was carried out either two or three times for each sample.
- the concentration of the analyte By using the dotted line shown in FIG. 5 as an analytical line, it was possible to determine the concentration of the analyte. More specifically, when the signal intensity Hs gave a certain value, a concentration corresponding to the certain value was determined by the horizontal axis via the dotted line. For example, when the signal intensity Hs was 5.0, the concentration could be determined as approximately 1200 (IU/L).
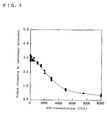
- FIG. 6 shows a graph showing the relation between signal intensity Hr and the hCG concentration in the case of applying light having a wavelength of 650 nm to the second detection zone 6.
- the samples used herein were each prepared by adding an hCG to a control urine for accuracy control whose hCG concentration was substantially zero.
- the hCG concentrations of the samples were 0 (IU/L), 10 (IU/L), 30 (IU/L), 50 (IU/L), 100 (IU/L), 300 (IU/L), 500 (IU/L), 1000 (IU/L), 1500 (IU/L), 2000 (IU/L), 3000 (IU/L), 5000 (IU/L), 7500 (IU/L) and 10000 (IU/L), respectively. Measurement was carried out two or three times for each sample.
- the concentration of the analyte in the sample was high, the labeled first specific binding substance not bound to the analyte flew from the first detection zone and bound to the analyte or analog thereof immobilized in the second detection zone 6, so that the signal intensity Hr, which was attributed to the labeling material, decreased. More specifically, when the concentration of the analyte in the sample was low and there was thus present labeled first specific binding substances not bound to the analyte, the excessive, free labeled first specific binding substances were bound to the analyte or analog thereof immobilized in the second detection zone 6. This resulted in the generation of the signal intensity Hr, which was attributed to a reaction in which the labeling material participated.
- the binding states of the respective binding sites were reflected on the signal intensity. That is, there was a significantly low possibility that the first specific binding substance all of which binding sites were occupied by analytes would be able to further bind to an analyte. Accordingly, there was also a significantly low possibility that such first specific binding substance would bind to the analyte immobilized in the second detection zone 6.
- the possibility for this first specific binding substance to bind to the analyte immobilized in the second detection zone 6 increased with the ratio of the remaining binding site.
- the signal intensity Hr denoted by the dotted line in FIG. 6 decreased with an increase in the analyte concentration.
- the analyzer 9 by making reference to the dotted line of FIG. 5, determined that plural concentrations were present and thus the analyte concentration corresponding to the signal intensity could not be unambiguously determined.
- the hCG concentration could be 6000 (IU/L) or higher, it was not possible to determine whether the hCG concentration was approximately 3500 (IU/L) or approximately 7600 (IU/L) when the signal intensity Hs was 10.
- it was possible to determine the concentration by further making reference to the dotted line in FIG. 6. More specifically, when the signal intensity Hr was 1.2 in FIG. 6, the concentration could be determined as approximately 3500 (IU/L) from the dotted line. When the signal intensity Hr was 0.45 in FIG. 6, the concentration could be determined as approximately 7600 (IU/L) from the dotted line.
- the concentration was determined only from the Hr in FIG. 6.
- the measurement accuracy was lower when the concentration was determined from the Hr than when it was determined from the Hs, since the gradient of the dotted line with respect to the concentration was small in the low concentration range. Accordingly, it was preferable to employ the Hr only for determining either one of two concentrations derived from the Hs was true, while employing the Hs alone for determining the concentration.
- the measurement was simplified by, for instance, determining the concentration from the Hs in FIG. 5 only when the Hr was 0.6 or greater, and judging that the prozone phenomenon was present when the Hr was 0.6 or less and merely limiting the concentration to 6000 (IU/L) or higher, without determining a specific amount of the concentration. That is, employing the Hr only for judging whether or not the prozone phenomenon was present, was effective in simplifying the measurement.
- the second detection zone 6 was placed downstream from the first detection zone 5 in the developing direction of the liquid sample (the direction shown by the arrow Z).
- Such placement improved the accuracy of the quantitative analysis for the following reason.
- a liquid sample flowed through a matrix wherein protein such as an antibody was immobilized the flow of the liquid sample was impeded to induce a phenomenon in which the liquid sample flowed only through a particular portion of the matrix, thereby resulting in a inhomogeneous binding in the detection zone in the downstream side. Consequently, the measurement reproducibility was reduced.
- the impeding of the liquid sample flow by the protein immobilized in the matrix was induced by a spatial barrier, nonuniform hydrophilicity caused by inhomogeneous immobilization density and the like. Since the measurement accuracy was improved by ensuring the reproducibility of the signal for determining, that is, quantitatively analyzing the concentration, which was generated in the detection zone 5, it was preferable to place the detection zone for quantitative analysis in the upstream side.
- the amount of an analyte in a sample can be determined by making reference to a quantitative information showing the correlation between the concentration of the analyte and the analyzed values of signal intensities which are attributed to the specific binding reaction of specific binding substances and are generated in two detection zones, thereby enabling an accurate qualitative or quantitative analysis to be performed in a simple and rapid manner, without being influenced by the prozone phenomenon.
- a specific binding method including the steps of: bringing into contact a sample with a zone where a first specific binding substance labeled with a labeling material is retained, to allow an analyte to bind to the first specific binding substance; bringing into contact the sample with a first detection zone where a second specific binding substance is immobilized, to allow an excess of the analyte to bind to the second specific binding substance; bringing into contact the sample with a second detection zone where a substance identical to the analyte is immobilized, to allow the first specific binding substance to bind to the substance; respectively measuring the intensities of signal 1 and signal 2 obtained in the first detection zone and the second detection zone and attributed to the labeling material; and then determining the concentration of the analyte based on the intensities.
Landscapes
- Health & Medical Sciences (AREA)
- Immunology (AREA)
- Life Sciences & Earth Sciences (AREA)
- Engineering & Computer Science (AREA)
- Chemical & Material Sciences (AREA)
- Molecular Biology (AREA)
- Biomedical Technology (AREA)
- Hematology (AREA)
- Urology & Nephrology (AREA)
- Food Science & Technology (AREA)
- Biochemistry (AREA)
- Cell Biology (AREA)
- Biotechnology (AREA)
- Medicinal Chemistry (AREA)
- Physics & Mathematics (AREA)
- Analytical Chemistry (AREA)
- Microbiology (AREA)
- General Health & Medical Sciences (AREA)
- General Physics & Mathematics (AREA)
- Pathology (AREA)
- Chemical Kinetics & Catalysis (AREA)
- Investigating Or Analysing Biological Materials (AREA)
- Investigating Or Analyzing Non-Biological Materials By The Use Of Chemical Means (AREA)
- Investigating Or Analysing Materials By The Use Of Chemical Reactions (AREA)
Applications Claiming Priority (2)
| Application Number | Priority Date | Filing Date | Title |
|---|---|---|---|
| JP2001280359 | 2001-09-14 | ||
| JP2001280359 | 2001-09-14 |
Publications (3)
| Publication Number | Publication Date |
|---|---|
| EP1293780A2 true EP1293780A2 (de) | 2003-03-19 |
| EP1293780A3 EP1293780A3 (de) | 2003-12-10 |
| EP1293780B1 EP1293780B1 (de) | 2006-06-28 |
Family
ID=19104370
Family Applications (1)
| Application Number | Title | Priority Date | Filing Date |
|---|---|---|---|
| EP02020330A Expired - Lifetime EP1293780B1 (de) | 2001-09-14 | 2002-09-11 | Spezifisches Bindungsanalyseverfahren |
Country Status (4)
| Country | Link |
|---|---|
| US (1) | US20030068665A1 (de) |
| EP (1) | EP1293780B1 (de) |
| CN (1) | CN1262841C (de) |
| DE (1) | DE60212776T2 (de) |
Cited By (3)
| Publication number | Priority date | Publication date | Assignee | Title |
|---|---|---|---|---|
| EP1496361A1 (de) * | 2003-07-07 | 2005-01-12 | Matsushita Electric Industrial Co., Ltd. | Immuntest - Verfahren und Vorrichtung, welche zum Nachweis von Zonenphänomenen dient unter Verwendung einer Fourier-Transformation. |
| EP1361435A4 (de) * | 2001-09-28 | 2005-01-26 | Matsushita Electric Industrial Co Ltd | Analysegerät und -verfahren für spezifische bindung |
| US8354235B2 (en) * | 2004-05-12 | 2013-01-15 | Roche Diagnostics Operations, Inc. | Method for increasing the dynamic measuring range of test elements based on specific binding reactions |
Families Citing this family (11)
| Publication number | Priority date | Publication date | Assignee | Title |
|---|---|---|---|---|
| US6927062B2 (en) * | 2002-11-25 | 2005-08-09 | Agdia, Inc. | Controls and standards for assays and method for manufacture thereof |
| US7723099B2 (en) * | 2003-09-10 | 2010-05-25 | Abbott Point Of Care Inc. | Immunoassay device with immuno-reference electrode |
| US20050208593A1 (en) * | 2004-03-19 | 2005-09-22 | Arizona Board Of Regents, Acting For And On Behalf Of Northern Arizona University | Lateral flow diagnostic assay reader with radial cassette |
| US8080849B2 (en) * | 2008-01-17 | 2011-12-20 | International Business Machines Corporation | Characterizing films using optical filter pseudo substrate |
| EP2554990B1 (de) * | 2010-03-31 | 2016-08-31 | Sekisui Medical Co., Ltd. | Messverfahren mit immunchromatographie, teststreifen für immunchromatographie und messreagenzienkit für immunchromatographie |
| US10295472B2 (en) | 2010-05-05 | 2019-05-21 | Alverix, Inc. | Assay reader operable to scan a test strip |
| CN102944672B (zh) * | 2012-11-16 | 2015-05-20 | 李方和 | 采用光激发化学发光免疫分析对血清中的待测靶物质进行定性与定量检测的方法 |
| US10031100B2 (en) | 2013-03-13 | 2018-07-24 | Robert Bosch Gmbh | Generation of pH/temperature/ionic gradients on a lateral flow platform with multiple parallel lanes for modulating protein interactions |
| CN104714017A (zh) * | 2015-02-06 | 2015-06-17 | 北京豪迈生物工程有限公司 | 一种定量检测降钙素原的方法 |
| CN106053779B (zh) * | 2015-04-14 | 2019-06-14 | 爱科来株式会社 | 测定方法和测定系统 |
| US10823746B1 (en) | 2020-05-22 | 2020-11-03 | Thermogenesis Holdings, Inc. | Lateral flow immunoassay test reader and method of use |
Family Cites Families (2)
| Publication number | Priority date | Publication date | Assignee | Title |
|---|---|---|---|---|
| US6183972B1 (en) * | 1998-07-27 | 2001-02-06 | Bayer Corporation | Method for the determination of analyte concentration in a lateral flow sandwich immunoassay exhibiting high-dose hook effect |
| US6180417B1 (en) * | 1999-04-22 | 2001-01-30 | Bayer Corporation | Immunochromatographic assay |
-
2002
- 2002-09-11 DE DE60212776T patent/DE60212776T2/de not_active Expired - Fee Related
- 2002-09-11 EP EP02020330A patent/EP1293780B1/de not_active Expired - Lifetime
- 2002-09-13 US US10/242,672 patent/US20030068665A1/en not_active Abandoned
- 2002-09-16 CN CNB021427887A patent/CN1262841C/zh not_active Expired - Fee Related
Non-Patent Citations (2)
| Title |
|---|
| JENKINS PHILIP ET AL: "Ultrasound pre-treatment can extend immunoagglutination test sensitivity while avoiding the prozone phenomenon" JOURNAL OF CLINICAL LIGAND ASSAY, vol. 22, no. 4, January 1999 (1999-01), pages 410-412, XP009019287 ISSN: 1081-1672 * |
| SALAMA A ET AL: "ELIMINATION OF THE PROZONE EFFECT IN THE ANTI GLOBULIN REACTION BY A SIMPLE MODIFICATION" VOX SANGUINIS, vol. 42, no. 3, 1982, pages 157-159, XP009019286 ISSN: 0042-9007 * |
Cited By (3)
| Publication number | Priority date | Publication date | Assignee | Title |
|---|---|---|---|---|
| EP1361435A4 (de) * | 2001-09-28 | 2005-01-26 | Matsushita Electric Industrial Co Ltd | Analysegerät und -verfahren für spezifische bindung |
| EP1496361A1 (de) * | 2003-07-07 | 2005-01-12 | Matsushita Electric Industrial Co., Ltd. | Immuntest - Verfahren und Vorrichtung, welche zum Nachweis von Zonenphänomenen dient unter Verwendung einer Fourier-Transformation. |
| US8354235B2 (en) * | 2004-05-12 | 2013-01-15 | Roche Diagnostics Operations, Inc. | Method for increasing the dynamic measuring range of test elements based on specific binding reactions |
Also Published As
| Publication number | Publication date |
|---|---|
| US20030068665A1 (en) | 2003-04-10 |
| EP1293780B1 (de) | 2006-06-28 |
| CN1262841C (zh) | 2006-07-05 |
| DE60212776D1 (de) | 2006-08-10 |
| CN1484032A (zh) | 2004-03-24 |
| DE60212776T2 (de) | 2007-06-28 |
| EP1293780A3 (de) | 2003-12-10 |
Similar Documents
| Publication | Publication Date | Title |
|---|---|---|
| EP1347299B1 (de) | Analyseverfahren durch spezifisches binden und vorrichtung, die das verfahren einsetzt | |
| JP4846573B2 (ja) | 基準としての天然分析物を有するラテラルフローアッセイ装置および方法 | |
| AU2009333937B2 (en) | Quantitative analyte assay device and method | |
| EP0398913B1 (de) | Testverfahren und reagenzsatz dazu | |
| JP5047131B2 (ja) | 検出方法において干渉性のサンプルを検出するためのコントロール領域の使用 | |
| EP1293780B1 (de) | Spezifisches Bindungsanalyseverfahren | |
| US20040096985A1 (en) | Specific binding analyzer and method of analyzing specific binding | |
| JP3005303B2 (ja) | 測定装置 | |
| US20070087450A1 (en) | Immuno-gold lateral flow assay | |
| JPS62231168A (ja) | アナライト−レセプタ−分析用内部標準を設けるための改良法 | |
| JP2024074809A (ja) | 側方流動アッセイのシグナルを増幅させるシステム、装置および方法 | |
| JP4824674B2 (ja) | 特異的結合反応型試験素子、特に免疫試験素子のダイナミック測定レンジを大きくするための方法 | |
| CN104714008A (zh) | 一种免疫层析试纸条及其制作方法与检测方法 | |
| JP5173808B2 (ja) | 横向き移動でのイムノクロマトの手段による検体アッセイ | |
| JP3654591B2 (ja) | 特異結合分析方法および特異結合分析デバイス | |
| EP0402023B1 (de) | Diagnostisches Gerät mit verlängerter Durchflussmembran und Verfahren | |
| JP2000258418A (ja) | 免疫クロマトグラフィーを用いた測定方法およびそれに用いる検体分析用具 | |
| JP3481894B2 (ja) | 免疫学的クロマト方式を利用した測定方法 | |
| JPH07218438A (ja) | 測定対象物の定量法 | |
| HK1106025B (en) | Method for increasing the dynamic measuring range of test elements, especially immunological test elements, that are based on specific bonding reactions | |
| HK1001235A (en) | Test method and reagent kit therefor | |
| HK1001235B (en) | Test method and reagent kit therefor |
Legal Events
| Date | Code | Title | Description |
|---|---|---|---|
| PUAI | Public reference made under article 153(3) epc to a published international application that has entered the european phase |
Free format text: ORIGINAL CODE: 0009012 |
|
| AK | Designated contracting states |
Kind code of ref document: A2 Designated state(s): AT BE BG CH CY CZ DE DK EE ES FI FR GB GR IE IT LI LU MC NL PT SE SK TR |
|
| AX | Request for extension of the european patent |
Extension state: AL LT LV MK RO SI |
|
| PUAL | Search report despatched |
Free format text: ORIGINAL CODE: 0009013 |
|
| AK | Designated contracting states |
Kind code of ref document: A3 Designated state(s): AT BE BG CH CY CZ DE DK EE ES FI FR GB GR IE IT LI LU MC NL PT SE SK TR |
|
| AX | Request for extension of the european patent |
Extension state: AL LT LV MK RO SI |
|
| 17P | Request for examination filed |
Effective date: 20040402 |
|
| 17Q | First examination report despatched |
Effective date: 20040506 |
|
| AKX | Designation fees paid |
Designated state(s): DE FR GB IT |
|
| GRAP | Despatch of communication of intention to grant a patent |
Free format text: ORIGINAL CODE: EPIDOSNIGR1 |
|
| GRAS | Grant fee paid |
Free format text: ORIGINAL CODE: EPIDOSNIGR3 |
|
| GRAA | (expected) grant |
Free format text: ORIGINAL CODE: 0009210 |
|
| AK | Designated contracting states |
Kind code of ref document: B1 Designated state(s): DE FR GB IT |
|
| PG25 | Lapsed in a contracting state [announced via postgrant information from national office to epo] |
Ref country code: IT Free format text: LAPSE BECAUSE OF FAILURE TO SUBMIT A TRANSLATION OF THE DESCRIPTION OR TO PAY THE FEE WITHIN THE PRESCRIBED TIME-LIMIT;WARNING: LAPSES OF ITALIAN PATENTS WITH EFFECTIVE DATE BEFORE 2007 MAY HAVE OCCURRED AT ANY TIME BEFORE 2007. THE CORRECT EFFECTIVE DATE MAY BE DIFFERENT FROM THE ONE RECORDED. Effective date: 20060628 |
|
| REG | Reference to a national code |
Ref country code: GB Ref legal event code: FG4D |
|
| REF | Corresponds to: |
Ref document number: 60212776 Country of ref document: DE Date of ref document: 20060810 Kind code of ref document: P |
|
| ET | Fr: translation filed | ||
| PLBE | No opposition filed within time limit |
Free format text: ORIGINAL CODE: 0009261 |
|
| STAA | Information on the status of an ep patent application or granted ep patent |
Free format text: STATUS: NO OPPOSITION FILED WITHIN TIME LIMIT |
|
| 26N | No opposition filed |
Effective date: 20070329 |
|
| PGFP | Annual fee paid to national office [announced via postgrant information from national office to epo] |
Ref country code: FR Payment date: 20080915 Year of fee payment: 7 |
|
| PGFP | Annual fee paid to national office [announced via postgrant information from national office to epo] |
Ref country code: GB Payment date: 20080917 Year of fee payment: 7 |
|
| PGFP | Annual fee paid to national office [announced via postgrant information from national office to epo] |
Ref country code: DE Payment date: 20080926 Year of fee payment: 7 |
|
| GBPC | Gb: european patent ceased through non-payment of renewal fee |
Effective date: 20090911 |
|
| REG | Reference to a national code |
Ref country code: FR Ref legal event code: ST Effective date: 20100531 |
|
| PG25 | Lapsed in a contracting state [announced via postgrant information from national office to epo] |
Ref country code: DE Free format text: LAPSE BECAUSE OF NON-PAYMENT OF DUE FEES Effective date: 20100401 Ref country code: FR Free format text: LAPSE BECAUSE OF NON-PAYMENT OF DUE FEES Effective date: 20090930 |
|
| PG25 | Lapsed in a contracting state [announced via postgrant information from national office to epo] |
Ref country code: GB Free format text: LAPSE BECAUSE OF NON-PAYMENT OF DUE FEES Effective date: 20090911 |