EP1302804A2 - Verfahren zur optischen Erfassung von charakteristischen Grössen einer beleuchteten Probe - Google Patents
Verfahren zur optischen Erfassung von charakteristischen Grössen einer beleuchteten Probe Download PDFInfo
- Publication number
- EP1302804A2 EP1302804A2 EP02021433A EP02021433A EP1302804A2 EP 1302804 A2 EP1302804 A2 EP 1302804A2 EP 02021433 A EP02021433 A EP 02021433A EP 02021433 A EP02021433 A EP 02021433A EP 1302804 A2 EP1302804 A2 EP 1302804A2
- Authority
- EP
- European Patent Office
- Prior art keywords
- detector
- channels
- detection
- sample
- shift
- Prior art date
- Legal status (The legal status is an assumption and is not a legal conclusion. Google has not performed a legal analysis and makes no representation as to the accuracy of the status listed.)
- Withdrawn
Links
- 238000000034 method Methods 0.000 title claims abstract description 29
- 230000003287 optical effect Effects 0.000 title claims abstract description 11
- 238000001514 detection method Methods 0.000 claims abstract description 31
- 230000005855 radiation Effects 0.000 claims abstract description 15
- 238000003384 imaging method Methods 0.000 claims description 8
- 230000008569 process Effects 0.000 claims description 5
- 238000005259 measurement Methods 0.000 claims description 4
- 238000001228 spectrum Methods 0.000 claims description 3
- 238000006073 displacement reaction Methods 0.000 claims description 2
- 238000011144 upstream manufacturing Methods 0.000 claims description 2
- 230000000694 effects Effects 0.000 claims 1
- 239000000975 dye Substances 0.000 description 30
- 230000005284 excitation Effects 0.000 description 20
- 230000003595 spectral effect Effects 0.000 description 20
- 238000010521 absorption reaction Methods 0.000 description 13
- 239000000523 sample Substances 0.000 description 12
- 238000000295 emission spectrum Methods 0.000 description 8
- 238000002360 preparation method Methods 0.000 description 5
- 238000000799 fluorescence microscopy Methods 0.000 description 3
- 238000002189 fluorescence spectrum Methods 0.000 description 3
- XKRFYHLGVUSROY-UHFFFAOYSA-N Argon Chemical compound [Ar] XKRFYHLGVUSROY-UHFFFAOYSA-N 0.000 description 2
- 102100023882 Endoribonuclease ZC3H12A Human genes 0.000 description 2
- 101710112715 Endoribonuclease ZC3H12A Proteins 0.000 description 2
- 238000010586 diagram Methods 0.000 description 2
- 238000001917 fluorescence detection Methods 0.000 description 2
- 239000007850 fluorescent dye Substances 0.000 description 2
- 230000005283 ground state Effects 0.000 description 2
- 230000010354 integration Effects 0.000 description 2
- 238000011835 investigation Methods 0.000 description 2
- 238000000386 microscopy Methods 0.000 description 2
- 238000012216 screening Methods 0.000 description 2
- 238000000926 separation method Methods 0.000 description 2
- 230000000638 stimulation Effects 0.000 description 2
- 230000007704 transition Effects 0.000 description 2
- 206010067482 No adverse event Diseases 0.000 description 1
- 239000013543 active substance Substances 0.000 description 1
- 230000006978 adaptation Effects 0.000 description 1
- 229910052786 argon Inorganic materials 0.000 description 1
- WZSUOQDIYKMPMT-UHFFFAOYSA-N argon krypton Chemical compound [Ar].[Kr] WZSUOQDIYKMPMT-UHFFFAOYSA-N 0.000 description 1
- 230000006399 behavior Effects 0.000 description 1
- 239000012472 biological sample Substances 0.000 description 1
- 238000004364 calculation method Methods 0.000 description 1
- 230000008859 change Effects 0.000 description 1
- 238000004624 confocal microscopy Methods 0.000 description 1
- 239000013078 crystal Substances 0.000 description 1
- 230000001419 dependent effect Effects 0.000 description 1
- 238000011161 development Methods 0.000 description 1
- 230000018109 developmental process Effects 0.000 description 1
- 238000009792 diffusion process Methods 0.000 description 1
- 230000005281 excited state Effects 0.000 description 1
- 239000000835 fiber Substances 0.000 description 1
- 238000002060 fluorescence correlation spectroscopy Methods 0.000 description 1
- 230000006870 function Effects 0.000 description 1
- 238000013537 high throughput screening Methods 0.000 description 1
- 238000002372 labelling Methods 0.000 description 1
- 230000015654 memory Effects 0.000 description 1
- 231100000252 nontoxic Toxicity 0.000 description 1
- 238000000399 optical microscopy Methods 0.000 description 1
- 210000001747 pupil Anatomy 0.000 description 1
- 238000001758 scanning near-field microscopy Methods 0.000 description 1
- 238000004621 scanning probe microscopy Methods 0.000 description 1
- 230000035945 sensitivity Effects 0.000 description 1
- 238000004611 spectroscopical analysis Methods 0.000 description 1
- 230000004936 stimulating effect Effects 0.000 description 1
- 230000001629 suppression Effects 0.000 description 1
Images


Classifications
-
- G—PHYSICS
- G01—MEASURING; TESTING
- G01J—MEASUREMENT OF INTENSITY, VELOCITY, SPECTRAL CONTENT, POLARISATION, PHASE OR PULSE CHARACTERISTICS OF INFRARED, VISIBLE OR ULTRAVIOLET LIGHT; COLORIMETRY; RADIATION PYROMETRY
- G01J3/00—Spectrometry; Spectrophotometry; Monochromators; Measuring colours
- G01J3/28—Investigating the spectrum
- G01J3/2803—Investigating the spectrum using photoelectric array detector
-
- G—PHYSICS
- G02—OPTICS
- G02B—OPTICAL ELEMENTS, SYSTEMS OR APPARATUS
- G02B21/00—Microscopes
- G02B21/0004—Microscopes specially adapted for specific applications
- G02B21/002—Scanning microscopes
-
- G—PHYSICS
- G01—MEASURING; TESTING
- G01N—INVESTIGATING OR ANALYSING MATERIALS BY DETERMINING THEIR CHEMICAL OR PHYSICAL PROPERTIES
- G01N21/00—Investigating or analysing materials by the use of optical means, i.e. using sub-millimetre waves, infrared, visible or ultraviolet light
- G01N21/62—Systems in which the material investigated is excited whereby it emits light or causes a change in wavelength of the incident light
- G01N21/63—Systems in which the material investigated is excited whereby it emits light or causes a change in wavelength of the incident light optically excited
- G01N21/64—Fluorescence; Phosphorescence
Definitions
- the invention relates to a method and an arrangement in the Fluorescence microscopy, especially laser scanning microscopy, the Fluorescence correlation spectroscopy and scanning near field microscopy, for the investigation of predominantly biological samples, Preparations and related components.
- Fluorescence detection based methods for screening active substances (High throughput screening) and flow cytometer are included on Fluorescence detection based methods for screening active substances (High throughput screening) and flow cytometer.
- Simultaneous examinations of samples with Multiple fluorophores are thus used with overlapping fluorescence spectra also possible in spatial structures of thick samples.
- the spectral resolution of the detection unit is increased.
- the wavelength of the emitted photon is generally red due to the Stokes shift compared to the excitation radiation, so it has a longer wavelength.
- the Stokes shift enables the fluorescence radiation to be separated from the excitation radiation.
- the fluorescent light is split off from the excitation radiation with suitable dichroic beam splitters in combination with block filters and observed separately. This makes it possible to display individual cell parts stained with different dyes. In principle, however, several parts of a preparation can also be colored simultaneously with different specific dyes (multiple fluorescence). To distinguish between the fluorescence signals emitted by the individual dyes, special dichroic beam splitters are used.
- LSM is essentially divided into 4 modules: light source, scan module, Detection unit and microscope. These modules are discussed in more detail below described. Reference is also made to DE19702753A1.
- lasers with different wavelengths are used in an LSM.
- the choice of the excitation wavelength depends on the absorption properties of the dyes to be examined.
- the excitation radiation is generated in the light source module.
- Various lasers are used here (argon, argon krypton, TiSa laser).
- the wavelengths are selected and the intensity of the required excitation wavelength is set in the light source module, for example by using an acousto-optical crystal.
- the laser radiation then reaches the scan module via a fiber or a suitable mirror arrangement.
- the laser radiation generated in the light source is focused into the specimen with the aid of the objective (2) and diffraction-limited via the scanner, the scanning optics and the tube lens.
- the focus raster scans the sample in the xy direction.
- the pixel dwell times when scanning over the sample are usually in the range of less than a microsecond to a few seconds.
- confocal detection descanned detection
- MDB dichroic beam splitter
- the fluorescent light is then focused on a diaphragm (confocal diaphragm / pinhole) which is located exactly in a plane conjugate to the focal plane. This suppresses fluorescent light components outside of the focus.
- the optical resolution of the microscope can be adjusted by varying the aperture size.
- Another dichroic block filter (EF) is located behind the diaphragm, which again suppresses the excitation radiation. After passing the block filter, the fluorescent light is measured using a point detector (PMT).
- PMT point detector
- the excitation of the dye fluorescence takes place in a small volume in which the excitation intensity is particularly high. This area is only slightly larger than the detected area when using a confocal arrangement. The use of a confocal diaphragm can thus be omitted and the detection can take place directly after the lens (non-descanned detection).
- the plane (optical section) that is in the focal plane of the objective is reproduced by both detection arrangements in conjunction with the corresponding single-photon or multi-photon absorption.
- a three-dimensional image of the sample can then be generated with the aid of a computer.
- the LSM is therefore suitable for examining thick specimens.
- the excitation wavelengths are determined by the dye used with its specific absorption properties. Dichroic filters matched to the emission properties of the dye ensure that only the fluorescent light emitted by the respective dye is measured by the point detector.
- the fluorescent light is switched off using a Prism spectrally split.
- the process differs from that Arrangement described above with dichroic filters only in that the characteristics of the filter used can be adjusted. However, it will furthermore preferably the emission band of one for each point detector Dye recorded.
- the location of the emission spectrum of the dyes used is unknown or occurs a displacement of the Emission spectrum (Fig. 3c), so is a high-resolution detection of the Dye fluorescence necessary.
- the wavelength shift can be up to to be several 10 nm.
- the sample is also used in conjunction with a spectrometer LSM used. This is a conventional one instead of a point detector mostly high-resolution spectrometer used (Patent Dixon, et al. US 5,192,980). However, these can only be spotted or averaged over an area record an emission spectrum. So it's a kind of Spectroscopy.
- the mostly weak fluorescence signal of the Sample on a large number of individual channels in the spectrometer (mostly 512 or 1024 individual channels) distributed or becomes a narrow fluorescence band detected according to the spectral resolution. Therefore the signal is pro Single channel extremely small and possibly no longer detectable.
- the background of the method according to the invention is spectral split detection of fluorescence, with different Spectral components is summed.
- the emission light in the Scan module or in a microscope (with multiphoton absorption) with the help of a Element for separating the excitation radiation from the detected one Radiation such as the main color splitter (MDB) or an AOTF according to 7346DE or split off from the excitation light according to 7323DE.
- MDB main color splitter
- 7346DE AOTF
- split off from the excitation light according to 7323DE split off from the excitation light according to 7323DE.
- the light of the sample is confocal with the help of an imaging optic PO Detection through an aperture (pinhole) PH focused, causing fluorescence, that was created out of focus is suppressed. At a the aperture is not required for unscanned detection.
- the light is now using of an angle-dispersive element Dl broken down into its spectral components. As angle-dispersive elements come prisms, grids and for example acousto-optical elements in question. That from the dispersive element in his spectral components split light is then on a Line detector DE shown. This line detector DE therefore measures that Emission signal depending on the wavelength and converts this into electrical signals around.
- an interconnection of individual channels i.e. a summation over individual channels of the Line detector.
- a line filter can also be used for the detection unit Suppression of the excitation wavelengths are connected upstream.
- a possible embodiment of the optical beam path of the in Fig. 4 Fig. 5 shows the detector unit shown in the block diagram.
- a confocal detection is the light L of the sample with the pinhole optics PO focused through the confocal aperture PH. With an undescanned Detection in the event of multi-photon absorption can be this aperture omitted.
- the first imaging mirror M2 collimates the fluorescent light. The light then strikes a line grating G, for example a grating with a line count of 651 lines per mm. The grating diffracts the light in different directions according to its wavelength.
- the second imaging mirror M1 focuses the individual spectrally split Wavelength components on the corresponding channels of the line detector DE
- the use of a line secondary electron multiplier is particularly advantageous from the company Hamamatsu H7260.
- the detector owns 32 channels and high sensitivity.
- the free spectral range of the above described embodiment is about 350 nm.
- the use of the unit in an imaging system is advantageous because the signal per detection channel due to the relatively wide detected spectral band is still relatively large.
- a shift in the Fluorescence spectrum can be twisted by, for example, the Grid, from M1, from M2, to the angle phi and / or through one Shift of the line receiver in the direction of the wavelength splitting around dl (see fig).
- the spectral resolution in the optical arrangements shown above is determined by the number of individual channels.
- each individual channel detects a spectral band of the emission spectrum with a spectral width of approximately 10 nm. If not all individual channels of the detector can be read out simultaneously, according to the state of the art, the individual channels are read out sequentially (multiplexing). According to the invention, this is summed up over individual channels with different patterns.
- Fig. 6 shows schematically in each line the different individual channels of the line detector, whose N individual signals correspond to C.
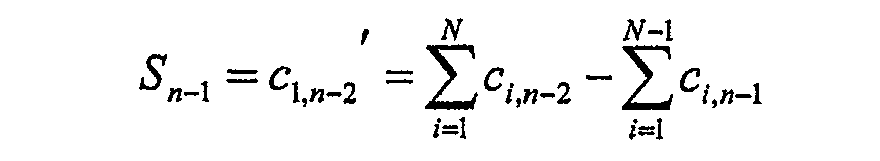
- the measured signals of the individual channels are c c , j (in Fig. 6 as
- To calculate the N times n spectral values S m differences of sums over individual channels are now formed according to the following algorithm: .... .... .... .... .... .... .... .... .... .... .... .... .... .... .... ....
- the spectral values S (intermediate values) calculated in this way can subsequently graphically on the displayed image, e.g. during a spectral scan being represented.
- the summation over various individual channels and thus the measurement of the c k, j is shown schematically in Fig. 7.
- the signals of the individual channels are in turn transformed with an amplifier A into voltage signals.
- the individual voltage signals are then integrated in an integrator 1 during the pixel dwell time.
- a comparator K which compares the integrated signal with a reference signal is connected downstream of the integrator. If the integrated signal is smaller than the comparator threshold, then no or too small a fluorescence signal would be measured in the corresponding individual channel. In such a case, the signal of the individual channel should not be processed further, since this channel only contributes a noise component to the overall signal.
- the comparator actuates a switch S via SR and the individual channel is switched off for the pixel just measured. With the aid of the comparators in combination with the switches, the spectral range relevant for the pixel currently being measured is automatically selected.
- the integrated voltage signal of the individual channels can then be used a demultiplexer MPX connected to the switch register SR different total points can be switched through the register Reg1.
- Fig. 7 shows 8 different sum points SP.
- the control of the register Reg1 is carried out by a control line V1 from the computer.
- the summation pattern can be controlled with pixel accuracy, i.e. in one Period of a few ⁇ s.
- a sum point SP forms part of the summation amplifier SV, which carries out the summation of the selected individual channels.
- a total of 8 sum amplifiers SV are shown in Fig. 7.
- the sum signals c k, j are then converted into digital signals with an analog-digital converter and further processed by the computer or DSP.
- the sum amplifier SV can also be operated with a variable non-linear characteristic.
- a change of the summation pattern by V1 can be made image-wise after the recording or during the scanning of an image point or an image line / column.
- the requirements for the switching speed of the MPX depend on the type of setting. If, for example, a pixel-by-pixel setting is made, the scan must take place within the integration time for this pixel (ie in a few microseconds). If the setting is made image-wise, the scan must take place within a few milliseconds to seconds.
- the signals of the individual channels are calculated using the algorithm described above using the c k, j .
Landscapes
- Physics & Mathematics (AREA)
- Spectroscopy & Molecular Physics (AREA)
- General Physics & Mathematics (AREA)
- Chemical & Material Sciences (AREA)
- Analytical Chemistry (AREA)
- Optics & Photonics (AREA)
- Investigating, Analyzing Materials By Fluorescence Or Luminescence (AREA)
- Spectrometry And Color Measurement (AREA)
Abstract
Description
Die eingestrahlten Photonen einer bestimmten Energie regen die Farbstoffmoleküle durch die Absorption eines Photons aus dem Grundzustand in einen angeregten Zustand an. Diese Anregung wird meist als Einphotonen-Absorption bezeichnet (Abb. 1a). Die so angeregten Farbstoffmoleküle können auf verschiedene Weise in den Grundzustand zurück gelangen. In der Fluoreszenzmikroskopie ist der Übergang unter Aussendung eines Fluoreszenzphotons am wichtigsten. Die Wellenlänge des emittierten Photons ist aufgrund der Stokesverschiebung im Vergleich zur Anregungsstrahlung generell rot verschoben, besitzt also eine größere Wellenlänge. Die Stokesverschiebung ermöglicht die Trennung der Fluoreszenzstrahlung von der Anregungsstrahlung.
Das Fluoreszenzlicht wird mit geeigneten dichroitischen Strahlteilern in Kombination mit Blockfiltern von der Anregungsstrahlung abgespalten und getrennt beobachtet. Dadurch ist die Darstellung einzelner, mit verschiedenen Farbstoffen eingefärbten Zellteilen, möglich. Grundsätzlich können jedoch auch mehrere Teile eines Präparates gleichzeitig mit verschiedenen sich spezifisch anlagernden Farbstoffen eingefärbt werden (Mehrfachfluoreszenz). Zur Unterscheidung, der von den einzelnen Farbstoffen ausgesendeten Fluoreszenzsignale, werden wiederum spezielle dichroitischen Strahlteiler verwendet.
Die in der Lichtquelle erzeugte Laserstrahlung wird mit Hilfe des Objektivs (2) beugungsbegrenzt über die Scanner, die Scanoptik und die Tubuslinse in das Präparat fokussiert. Der Fokus rastert punktförmig die Probe in x-y-Richtung ab. Die Pixelverweilzeiten beim Scannen über die Probe liegen meist im Bereich von weniger als einer Mikrosekunde bis zu einigen Sekunden.
Bei einer konfokalen Detektion (descanned Detection) des Fluoreszenzlichtes, gelangt das Licht das aus der Fokusebene (Specimen) und aus den darüber- und darunterliegenden Ebenen emittiert wird, über die Scanner auf einen dichroitischen Strahlteiler (MDB). Dieser trennt das Fluoreszenzlicht vom Anregungslicht. Anschließend wird das Fluoreszenzlicht auf eine Blende (konfokale Blende / Pinhole) fokussiert, die sich genau in einer zur Fokusebene konjugierten Ebene befindet. Dadurch werden Fluoreszenzlichtanteile außerhalb des Fokus unterdrückt. Durch Variieren der Blendengröße kann die optische Auflösung des Mikroskops eingestellt werden. Hinter der Blende befindet sich ein weiterer dichroitischer Blockfilter (EF) der nochmals die Anregungsstrahlung unterdrückt. Nach Passieren des Blockfilters wird das Fluoreszenzlicht mittels eines Punktdetektors (PMT) gemessen.
Bei Verwendung einer Mehrphotonen-Absorption erfolgt die Anregung der Farbstofffluoreszenz in einem kleinen Volumen in dem die Anregungsintensität besonders hoch ist. Dieser Bereich ist nur unwesentlich größer als der detektierte Bereich bei Verwendung einer konfokalen Anordnung. Der Einsatz einer konfokalen Blende kann somit entfallen und die Detektion kann direkt nach dem Objektiv erfolgen (non descannte Detektion).
Das LSM ist somit zur Untersuchung von dicken Präparaten geeignet. Die Anregungswellenlängen werden durch den verwendeten Farbstoff mit seinen spezifischen Absorptionseigenschaften bestimmt. Auf die Emissionseigenschaften des Farbstoffes abgestimmte dichroitische Filter stellen sicher, daß nur das vom jeweiligen Farbstoff ausgesendete Fluoreszenzlicht vom Punktdetektor gemessen wird.
Bevorzugte Weiterbildungen sind Gegenstand der abhängigen Ansprüche.
Erfindungsgemäß wird hierbei über Einzelkanäle mit verschiedenen Mustern summiert.
Die gemessenen Signale der Einzelkanäle werden mit ck,j (in Abb. 6 als
Zur Berechnung der N mal n Spektralwerte Sm werden nun Differenzen von Summen über Einzelkanäle nach folgendem Algorithmus gebildet:


Dem Integrator nachgeschaltet ist ein Komparator K der einen Vergleich des aufintegrierten Signals mit einem Referenzsignal durchführt.
Falls das aufintegrierte Signal kleiner als die Komparatorschwelle ist, so würde in dem entsprechenden Einzelkanal kein oder ein zu kleines Fluoreszenzsignal gemessen. In einem solchen Falle soll das Signal des Einzelkanals nicht weiter verarbeitet werden, da dieser Kanal nur einen Rauschanteil zum Gesamtsignal beiträgt. Der Komparator betätigt in einem solchen Falle über SR einen Schalter S und der Einzelkanal wird für den gerade gemessenen Pixel ausgeschalten. Mit Hilfe der Komparatoren in Kombination mit den Schaltern wird also automatisch der für den gerade gemessenen Bildpunkt relevante Spektralbereich ausgewählt.
Die Berechnung der Signale der Einzelkanäle erfolgt mit dem oben beschriebenen Algorithmus unter Verwendung der ck,j .
Vorteilhaft erfolgt erfindungsgemäß eine speichermäßige bildpunktweise Zuordnung der erfaßten jeweiligen Wellenlängenverteilung ( λ- stack) zur jeweiligen Bildpunktkoordinate x,y oder z und/ oder eine zusätzliche zeitliche Zuordnung bei gemessenen zeitveränderlichen Abläufen.
Claims (12)
- Verfahren zur optischen Erfassung von charakteristischen Größen einer beleuchteten Probe,
wobei das von der Probe rückgestreute, reflektierte und/ oder fluoreszierte und/ oder transmittierte Signal mit einem ortsauflösenden Detektor in mehreren Kanälen detektiert wird, indem die von der Probe kommende Strahlung spektral aufgespalten auf den Detektor abgebildet wird, , wobei eine Verknüpfung von Detektionskanälen erfolgt, so daß die Anzahl der ausgelesenen und weiterverarbeiteten Meßwerte kleiner ist als die Zahl der Detektionskanäle - Verfahren nach Anspruch 1, wobei die Verknüpfung eine Summierung ist
- Verfahren nach Anspruch 1 oder 2 , wobei eine Verschiebung der verknüpften Meßwerte erfolgt und/ oder die Zahl der verknüpften Detektorkanäle geändert wird
- Verfahren nach einem der vorangehenden Ansprüche,
wobei die Verschiebung um mindestens einen Detektorkanal erfolgt - Verfahren nach einem der vorangehenden Ansprüche,
wobei die Größe der Verschiebung veränderbar ist - Verfahren nach einem der vorangehenden Ansprüche,
wobei mittels eines Algorithmus aus den ausgelesenen Meßwerten Zwischenwerte zum Zwecke des effizienten Auslesens einer Detektorzeile ermittelt werden. - Verfahren nach einem der vorangehenden Ansprüche, wobei eine Verschiebung des Summationsmusters entlang eines Zeilendetektors durch einen Multiplexer erfolgt.
- Verfahren nach einem der vorangehenden Ansprüche, wobei eine
spektral aufgelöste Messung von Spektren über ein dem Detektor vorgeordnetes dispersives Element erfolgt - Verfahren nach einem der vorangehenden Ansprüche,
wobei die spektral aufgespaltene Strahlung relativ zum Detektor verschoben wird. - Verfahren nach einem der vorangehenden Ansprüche, wobei
das dispersive Element um mindestens eine Achse schwenkbar ist - Verfahren nach einem der vorangehenden Ansprüche, wobei
bei feststehendem dispersiven Element in mindestens einer seiner Schwenkachsen die räumlich verändernde Wirkung der Schwenkung in dieser Achse durch eine Scaneinheit und/oder Verschiebung des Detektors erfolgt. - Verfahren nach einem der vorangehenden Ansprüche,wobei eine speichermäßige bildpunktweise Zuordnung der erfaßten jeweiligen Wellenlängenverteilung (λ- stack) zur jeweiligen Bildpunktkoordinate x,y oder z und/ oder eine zusätzliche zeitliche Zuordnung bei gemessenen zeitveränderlichen Abläufen erfolgt.
Applications Claiming Priority (2)
| Application Number | Priority Date | Filing Date | Title |
|---|---|---|---|
| DE10151216A DE10151216A1 (de) | 2001-10-16 | 2001-10-16 | Verfahren zur optischen Erfassung von charakteristischen Größen einer beleuchteten Probe |
| DE10151216 | 2001-10-16 |
Publications (2)
| Publication Number | Publication Date |
|---|---|
| EP1302804A2 true EP1302804A2 (de) | 2003-04-16 |
| EP1302804A3 EP1302804A3 (de) | 2004-09-22 |
Family
ID=7702774
Family Applications (1)
| Application Number | Title | Priority Date | Filing Date |
|---|---|---|---|
| EP02021433A Withdrawn EP1302804A3 (de) | 2001-10-16 | 2002-09-25 | Verfahren zur optischen Erfassung von charakteristischen Grössen einer beleuchteten Probe |
Country Status (4)
| Country | Link |
|---|---|
| US (1) | US6703621B2 (de) |
| EP (1) | EP1302804A3 (de) |
| JP (2) | JP2003185582A (de) |
| DE (1) | DE10151216A1 (de) |
Families Citing this family (29)
| Publication number | Priority date | Publication date | Assignee | Title |
|---|---|---|---|---|
| EP1562035B1 (de) | 1997-01-31 | 2017-01-25 | Xy, Llc | Optischer Apparat und optisches Verfahren |
| US6149867A (en) | 1997-12-31 | 2000-11-21 | Xy, Inc. | Sheath fluids and collection systems for sex-specific cytometer sorting of sperm |
| US6071689A (en) | 1997-12-31 | 2000-06-06 | Xy, Inc. | System for improving yield of sexed embryos in mammals |
| US7208265B1 (en) | 1999-11-24 | 2007-04-24 | Xy, Inc. | Method of cryopreserving selected sperm cells |
| AU2002237689B2 (en) | 2000-11-29 | 2008-01-10 | Xy, Llc. | System to separate frozen-thawed spermatozoa into X-chromosome bearing and Y-chromosome bearing populations |
| US7713687B2 (en) | 2000-11-29 | 2010-05-11 | Xy, Inc. | System to separate frozen-thawed spermatozoa into x-chromosome bearing and y-chromosome bearing populations |
| EP1269126A1 (de) * | 2000-12-08 | 2003-01-02 | Foundation For Research And Technology Hellas | Bilderzeugungsverfahren und anordnung zur zerstörungsfreien analyse von gemälden und denkmälern |
| WO2004009237A2 (en) * | 2002-07-22 | 2004-01-29 | Xy, Inc. | Sperm cell process system |
| CN1674780A (zh) | 2002-08-01 | 2005-09-28 | Xy公司 | 低压精子分离系统 |
| US8486618B2 (en) | 2002-08-01 | 2013-07-16 | Xy, Llc | Heterogeneous inseminate system |
| US7855078B2 (en) | 2002-08-15 | 2010-12-21 | Xy, Llc | High resolution flow cytometer |
| US7169548B2 (en) | 2002-09-13 | 2007-01-30 | Xy, Inc. | Sperm cell processing and preservation systems |
| EP2305173B1 (de) | 2003-03-28 | 2016-05-11 | Inguran, LLC | Vorrichtung und Verfahren zur Bereitstellung von sortierten Partikeln |
| WO2004104178A2 (en) * | 2003-05-15 | 2004-12-02 | Xy, Inc. | Efficient haploid cell sorting for flow cytometer systems |
| DE10343276A1 (de) * | 2003-09-18 | 2005-04-14 | Carl Zeiss Jena Gmbh | Mehr-Photonen-Fluoreszenzmikroskopie |
| JP2005116251A (ja) * | 2003-10-06 | 2005-04-28 | Nikon Corp | 受光器及び蛍光共焦点顕微鏡 |
| JP2007537727A (ja) | 2004-03-29 | 2007-12-27 | モンサント テクノロジー エルエルシー | 受精で用いられる精子分散液 |
| DE102004031049A1 (de) * | 2004-06-25 | 2006-01-12 | Leica Microsystems Cms Gmbh | Optische Anordnung zum spektralselektiven Nachweis von Licht eines Lichtstrahls |
| MX2007000888A (es) | 2004-07-22 | 2007-04-02 | Monsanto Technology Llc | Procedimiento para enriquecer una poblacion de celulas de esperma. |
| JP4720146B2 (ja) * | 2004-10-28 | 2011-07-13 | 株式会社ニコン | 分光装置および分光システム |
| JP4987233B2 (ja) * | 2005-01-06 | 2012-07-25 | オリンパス株式会社 | レーザ走査型顕微鏡 |
| DE102005046510B4 (de) | 2005-09-29 | 2022-02-17 | Leica Microsystems Cms Gmbh | Mikroskopsystem für FCS-Messungen |
| JP5307629B2 (ja) * | 2009-05-22 | 2013-10-02 | オリンパス株式会社 | 走査型顕微鏡装置 |
| US9182341B2 (en) * | 2012-06-13 | 2015-11-10 | Kla-Tencor Corporation | Optical surface scanning systems and methods |
| JP6292759B2 (ja) * | 2013-03-12 | 2018-03-14 | 住友重機械工業株式会社 | マークセンサ及び光検出素子によるマーク判定方法 |
| EP3513235B1 (de) | 2016-09-16 | 2023-06-07 | Leica Microsystems CMS GmbH | Lichtmikroskop |
| US11506877B2 (en) | 2016-11-10 | 2022-11-22 | The Trustees Of Columbia University In The City Of New York | Imaging instrument having objective axis and light sheet or light beam projector axis intersecting at less than 90 degrees |
| AU2022234898A1 (en) | 2021-03-12 | 2023-09-28 | Stryker European Operations Limited | Neurosurgical methods and systems for detecting and removing tumorous tissue |
| DE102021126145A1 (de) * | 2021-10-08 | 2023-04-13 | Heidelberg Engineering Gmbh | Anordnung mit einem Detektor |
Citations (4)
| Publication number | Priority date | Publication date | Assignee | Title |
|---|---|---|---|---|
| DE4017317A1 (de) * | 1990-05-30 | 1991-12-05 | Bodenseewerk Perkin Elmer Co | Anodnung zur verbesserung der aufloesung eines spektrometers |
| WO2000006979A1 (en) * | 1998-07-31 | 2000-02-10 | The Research Foundation Of State University Of New York | Sensors for detection and spectroscopy |
| WO2002012863A1 (de) * | 2000-08-08 | 2002-02-14 | Carl Zeiss Jena Gmbh | Verfahren und anordnung zur erfassung des wellenlängenabhängigen verhaltens einer beleuchteten probe |
| WO2002012864A1 (de) * | 2000-08-08 | 2002-02-14 | Carl Zeiss Jena Gmbh | Verfahren und anordnung zur erhöhung der spektralen und räumlichen detektorauflösung |
Family Cites Families (20)
| Publication number | Priority date | Publication date | Assignee | Title |
|---|---|---|---|---|
| FR2615280B1 (fr) * | 1987-05-11 | 1996-07-19 | Canon Kk | Dispositif de mesure de la distance en mouvement relatif de deux objets mobiles l'un par rapport a l'autre |
| US5114236A (en) * | 1989-08-04 | 1992-05-19 | Canon Kabushiki Kaisha | Position detection method and apparatus |
| ATE89411T1 (de) * | 1989-11-02 | 1993-05-15 | Heidenhain Gmbh Dr Johannes | Positionsmesseinrichtung. |
| GB9000740D0 (en) * | 1990-01-12 | 1990-03-14 | Univ Salford | Measurement of luminescence |
| DE4111903A1 (de) * | 1991-04-12 | 1992-10-15 | Bayer Ag | Spektroskopiekorrelierte licht-rastermikroskopie |
| US6134003A (en) * | 1991-04-29 | 2000-10-17 | Massachusetts Institute Of Technology | Method and apparatus for performing optical measurements using a fiber optic imaging guidewire, catheter or endoscope |
| US5198816A (en) * | 1991-08-30 | 1993-03-30 | Eg&G, Inc. | General purpose system for digitizing an analog signal |
| GB9320261D0 (en) * | 1993-10-01 | 1993-11-17 | Unicam Ltd | Spectrophotometer |
| US5742389A (en) * | 1994-03-18 | 1998-04-21 | Lucid Technologies Inc. | Spectrophotometer and electro-optic module especially suitable for use therein |
| US5673144A (en) * | 1994-09-14 | 1997-09-30 | International Business Machines, Corporation | Oblique viewing microscope system |
| JP3095970B2 (ja) * | 1995-02-06 | 2000-10-10 | 日本分光株式会社 | デコンボリューション処理方法及び装置 |
| US5627639A (en) * | 1995-06-06 | 1997-05-06 | Lockheed Missiles & Space Company, Inc. | Coded aperture imaging spectrometer |
| US6151185A (en) * | 1996-09-05 | 2000-11-21 | Canon Kabushiki Kaisha | Position detecting apparatus, positioning apparatus, and information recording apparatus using the same |
| US6167173A (en) * | 1997-01-27 | 2000-12-26 | Carl Zeiss Jena Gmbh | Laser scanning microscope |
| DE19707227A1 (de) * | 1997-02-24 | 1998-08-27 | Bodenseewerk Perkin Elmer Co | Lichtabtastvorrichtung |
| JP2888813B2 (ja) * | 1997-08-29 | 1999-05-10 | 株式会社東芝 | 高解像度画素出力方法及び装置 |
| US6097034A (en) * | 1998-02-12 | 2000-08-01 | Instrumentarium Oy | Radiation source assembly and transducer for analyzing gases or other substances |
| US6053613A (en) * | 1998-05-15 | 2000-04-25 | Carl Zeiss, Inc. | Optical coherence tomography with new interferometer |
| US6128078A (en) * | 1999-04-09 | 2000-10-03 | Three Lc, Inc. | Radiation filter, spectrometer and imager using a micro-mirror array |
| DE10004233B4 (de) * | 2000-02-01 | 2005-02-17 | Leica Microsystems Heidelberg Gmbh | Mikroskop-Aufbau |
-
2001
- 2001-10-16 DE DE10151216A patent/DE10151216A1/de not_active Withdrawn
-
2002
- 2002-01-16 US US10/051,205 patent/US6703621B2/en not_active Expired - Lifetime
- 2002-09-25 EP EP02021433A patent/EP1302804A3/de not_active Withdrawn
- 2002-10-10 JP JP2002296999A patent/JP2003185582A/ja active Pending
-
2005
- 2005-12-28 JP JP2005377505A patent/JP2006098419A/ja active Pending
Patent Citations (4)
| Publication number | Priority date | Publication date | Assignee | Title |
|---|---|---|---|---|
| DE4017317A1 (de) * | 1990-05-30 | 1991-12-05 | Bodenseewerk Perkin Elmer Co | Anodnung zur verbesserung der aufloesung eines spektrometers |
| WO2000006979A1 (en) * | 1998-07-31 | 2000-02-10 | The Research Foundation Of State University Of New York | Sensors for detection and spectroscopy |
| WO2002012863A1 (de) * | 2000-08-08 | 2002-02-14 | Carl Zeiss Jena Gmbh | Verfahren und anordnung zur erfassung des wellenlängenabhängigen verhaltens einer beleuchteten probe |
| WO2002012864A1 (de) * | 2000-08-08 | 2002-02-14 | Carl Zeiss Jena Gmbh | Verfahren und anordnung zur erhöhung der spektralen und räumlichen detektorauflösung |
Also Published As
| Publication number | Publication date |
|---|---|
| US20030071227A1 (en) | 2003-04-17 |
| US6703621B2 (en) | 2004-03-09 |
| JP2006098419A (ja) | 2006-04-13 |
| EP1302804A3 (de) | 2004-09-22 |
| JP2003185582A (ja) | 2003-07-03 |
| DE10151216A1 (de) | 2003-04-24 |
Similar Documents
| Publication | Publication Date | Title |
|---|---|---|
| EP1264169B1 (de) | Verbesserung der spektralen und/oder räumlichen auflösung in einem laser-scanning mikroskop | |
| EP1302804A2 (de) | Verfahren zur optischen Erfassung von charakteristischen Grössen einer beleuchteten Probe | |
| DE10038526B4 (de) | Verfahren und Anordnung zur Erfassung des wellenlängenabhängigen Verhaltens einer beleuchteten Probe | |
| EP1504300B1 (de) | Verfahren und anordnung zur untersuchung von proben | |
| DE10151217B4 (de) | Verfahren zum Betrieb eines Laser-Scanning-Mikroskops | |
| EP2516993B1 (de) | Hochauflösendes mikroskop und verfahren zur zwei- oder dreidimensionalen positionsbestimmung von objekten | |
| DE10033180B4 (de) | Verfahren zur Detektion von Farbstoffen in der Fluoreszenzmikroskopie | |
| EP1396739B1 (de) | Verfahren und Anordnung zur einstellbaren Veränderung von Beleuchtungslicht und/oder Probenlicht bezüglich seiner spektralen Zusammensetzung und/oder Intensität | |
| EP3295236B1 (de) | Auswertung von signalen der fluoreszenzrastermikroskopie unter verwendung eines konfokalen laserscanning-mikroskops | |
| EP1248132B1 (de) | Verfahren und Anordnung zur tiefenaufgelösten optischen Erfassung einer Probe | |
| EP0977069A2 (de) | Verfahren und Anordnung zur konfokalen Mikroskopie | |
| EP4189358B1 (de) | Verfahren zum detektieren von emissionslicht, detektionsvorrichtung und laserscanning-mikroskop | |
| EP3217205A1 (de) | Vorrichtung und verfahren zur multispot-scanning-mikroskopie | |
| DE10118463A1 (de) | Verfahren und Anordnung zur tiefenaufgelösten optischen Erfassung einer Probe | |
| DE10227111A1 (de) | Spektralmikroskop und Verfahren zur Datenaufnahme mit einem Spektralmikroskop | |
| DE10339312A1 (de) | Verfahren zur Trennung von Fluoreszenzspektren von in einer Probe vorhandenen Farbstoffen | |
| EP1636624A1 (de) | Verefahren zur fluoreszenzmikroskopie | |
| WO2002014811A1 (de) | Lichterfassungseinheit und verfahren zum erfassen von lumineszenzlicht sowie konfokales mikroskop für die lumineszenzmikroskopie | |
| DE102019119147A1 (de) | Mikroskop und verfahren zur mikroskopie | |
| DE102023134043A1 (de) | Mikroskop |
Legal Events
| Date | Code | Title | Description |
|---|---|---|---|
| PUAI | Public reference made under article 153(3) epc to a published international application that has entered the european phase |
Free format text: ORIGINAL CODE: 0009012 |
|
| 17P | Request for examination filed |
Effective date: 20020925 |
|
| AK | Designated contracting states |
Designated state(s): AT BE BG CH CY CZ DE DK EE ES FI FR GB GR IE IT LI LU MC NL PT SE SK TR |
|
| AX | Request for extension of the european patent |
Extension state: AL LT LV MK RO SI |
|
| PUAL | Search report despatched |
Free format text: ORIGINAL CODE: 0009013 |
|
| AK | Designated contracting states |
Kind code of ref document: A3 Designated state(s): AT BE BG CH CY CZ DE DK EE ES FI FR GB GR IE IT LI LU MC NL PT SE SK TR |
|
| AX | Request for extension of the european patent |
Extension state: AL LT LV MK RO SI |
|
| RIC1 | Information provided on ipc code assigned before grant |
Ipc: 7G 01J 3/28 B Ipc: 7G 01N 21/64 B Ipc: 7G 01J 3/443 B Ipc: 7G 01J 3/50 B Ipc: 7G 06T 7/00 B Ipc: 7G 02B 21/00 A |
|
| AKX | Designation fees paid |
Designated state(s): AT BE BG CH CY CZ DE DK EE ES FI FR GB GR IE IT LI LU MC NL PT SE SK TR |
|
| 17Q | First examination report despatched |
Effective date: 20090728 |
|
| REG | Reference to a national code |
Ref country code: HK Ref legal event code: WD Ref document number: 1057100 Country of ref document: HK |
|
| RAP1 | Party data changed (applicant data changed or rights of an application transferred) |
Owner name: CARL ZEISS MICROSCOPY GMBH |
|
| STAA | Information on the status of an ep patent application or granted ep patent |
Free format text: STATUS: THE APPLICATION IS DEEMED TO BE WITHDRAWN |
|
| 18D | Application deemed to be withdrawn |
Effective date: 20160401 |