EP1309062A2 - Verfahren und Vorrichtung zur Bestimmung von Wochentagen mit ähnlichen Verbrauchsprofilen - Google Patents
Verfahren und Vorrichtung zur Bestimmung von Wochentagen mit ähnlichen Verbrauchsprofilen Download PDFInfo
- Publication number
- EP1309062A2 EP1309062A2 EP02253862A EP02253862A EP1309062A2 EP 1309062 A2 EP1309062 A2 EP 1309062A2 EP 02253862 A EP02253862 A EP 02253862A EP 02253862 A EP02253862 A EP 02253862A EP 1309062 A2 EP1309062 A2 EP 1309062A2
- Authority
- EP
- European Patent Office
- Prior art keywords
- clusters
- data
- day
- consumption
- week
- Prior art date
- Legal status (The legal status is an assumption and is not a legal conclusion. Google has not performed a legal analysis and makes no representation as to the accuracy of the status listed.)
- Withdrawn
Links
Images




Classifications
-
- H—ELECTRICITY
- H02—GENERATION; CONVERSION OR DISTRIBUTION OF ELECTRIC POWER
- H02J—ELECTRIC POWER NETWORKS; CIRCUIT ARRANGEMENTS OR SYSTEMS FOR SUPPLYING OR DISTRIBUTING ELECTRIC POWER; SYSTEMS FOR STORING ELECTRIC ENERGY
- H02J3/00—Circuit arrangements for AC mains or AC distribution networks
-
- H—ELECTRICITY
- H02—GENERATION; CONVERSION OR DISTRIBUTION OF ELECTRIC POWER
- H02J—ELECTRIC POWER NETWORKS; CIRCUIT ARRANGEMENTS OR SYSTEMS FOR SUPPLYING OR DISTRIBUTING ELECTRIC POWER; SYSTEMS FOR STORING ELECTRIC ENERGY
- H02J3/00—Circuit arrangements for AC mains or AC distribution networks
- H02J3/003—Load forecast, e.g. methods or systems for forecasting future load demand
-
- H—ELECTRICITY
- H02—GENERATION; CONVERSION OR DISTRIBUTION OF ELECTRIC POWER
- H02J—ELECTRIC POWER NETWORKS; CIRCUIT ARRANGEMENTS OR SYSTEMS FOR SUPPLYING OR DISTRIBUTING ELECTRIC POWER; SYSTEMS FOR STORING ELECTRIC ENERGY
- H02J2103/00—Details of circuit arrangements for mains or AC distribution networks
- H02J2103/30—Simulating, planning, modelling, reliability check or computer assisted design [CAD] of electric power networks
-
- Y—GENERAL TAGGING OF NEW TECHNOLOGICAL DEVELOPMENTS; GENERAL TAGGING OF CROSS-SECTIONAL TECHNOLOGIES SPANNING OVER SEVERAL SECTIONS OF THE IPC; TECHNICAL SUBJECTS COVERED BY FORMER USPC CROSS-REFERENCE ART COLLECTIONS [XRACs] AND DIGESTS
- Y02—TECHNOLOGIES OR APPLICATIONS FOR MITIGATION OR ADAPTATION AGAINST CLIMATE CHANGE
- Y02E—REDUCTION OF GREENHOUSE GAS [GHG] EMISSIONS, RELATED TO ENERGY GENERATION, TRANSMISSION OR DISTRIBUTION
- Y02E60/00—Enabling technologies; Technologies with a potential or indirect contribution to GHG emissions mitigation
-
- Y—GENERAL TAGGING OF NEW TECHNOLOGICAL DEVELOPMENTS; GENERAL TAGGING OF CROSS-SECTIONAL TECHNOLOGIES SPANNING OVER SEVERAL SECTIONS OF THE IPC; TECHNICAL SUBJECTS COVERED BY FORMER USPC CROSS-REFERENCE ART COLLECTIONS [XRACs] AND DIGESTS
- Y04—INFORMATION OR COMMUNICATION TECHNOLOGIES HAVING AN IMPACT ON OTHER TECHNOLOGY AREAS
- Y04S—SYSTEMS INTEGRATING TECHNOLOGIES RELATED TO POWER NETWORK OPERATION, COMMUNICATION OR INFORMATION TECHNOLOGIES FOR IMPROVING THE ELECTRICAL POWER GENERATION, TRANSMISSION, DISTRIBUTION, MANAGEMENT OR USAGE, i.e. SMART GRIDS
- Y04S10/00—Systems supporting electrical power generation, transmission or distribution
- Y04S10/50—Systems or methods supporting the power network operation or management, involving a certain degree of interaction with the load-side end user applications
-
- Y—GENERAL TAGGING OF NEW TECHNOLOGICAL DEVELOPMENTS; GENERAL TAGGING OF CROSS-SECTIONAL TECHNOLOGIES SPANNING OVER SEVERAL SECTIONS OF THE IPC; TECHNICAL SUBJECTS COVERED BY FORMER USPC CROSS-REFERENCE ART COLLECTIONS [XRACs] AND DIGESTS
- Y04—INFORMATION OR COMMUNICATION TECHNOLOGIES HAVING AN IMPACT ON OTHER TECHNOLOGY AREAS
- Y04S—SYSTEMS INTEGRATING TECHNOLOGIES RELATED TO POWER NETWORK OPERATION, COMMUNICATION OR INFORMATION TECHNOLOGIES FOR IMPROVING THE ELECTRICAL POWER GENERATION, TRANSMISSION, DISTRIBUTION, MANAGEMENT OR USAGE, i.e. SMART GRIDS
- Y04S40/00—Systems for electrical power generation, transmission, distribution or end-user application management characterised by the use of communication or information technologies, or communication or information technology specific aspects supporting them
- Y04S40/20—Information technology specific aspects, e.g. CAD, simulation, modelling, system security
Definitions
- the present invention relates to analyzing consumption of utilities, such as electricity, natural gas and water, and more particularly to using time series of energy or other utility to determine the days of the week with similar consumption profiles as other days of the week.
- utilities such as electricity, natural gas and water
- control system which manage the operation of different subsystems, such as for heating, ventilation and air conditioning.
- the control system operates the associated equipment as efficiently as possible.
- a large entity may have numerous buildings under common management, such as on a university campus or a chain of stores located in different cities.
- the controllers in each building gather data regarding performance of the building subsystems so that the data can be analyzed at the central monitoring location.
- RTP real-time pricing
- utility companies can adjust energy rates based on actual time-varying marginal costs, thereby providing an accurate and timely stimulus for encouraging customers to lower demand when marginal costs are high.
- RTP the consumer must have the ability to make short-term adjustments to curtail energy demand in response to periods with higher energy prices.
- One increasingly popular method of accomplishing this objective is by supplementing environmental conditioning systems with energy storage mediums, such as ice-storage systems. To maximize the benefits from such energy storage mediums, the consumer must have not only the ability to analyze energy demand and consumption information but also the ability to project future load requirements.
- the ability to analyze energy or utility consumption is also of critical importance in identifying abnormal consumption.
- Abnormal energy or utility consumption may indicate malfunctioning equipment or other problems in the building. Therefore, monitoring utility usage and detecting abnormal consumption levels can indicate when maintenance or replacement of the machinery is required.
- sensors are being incorporated into building management systems to measure utility usage for the entire building, as well as specific subsystems such as heating, ventilation and air conditioning equipment.
- These management systems collect and store massive quantities of utility use data which can be overwhelming to the facility operator when attempting to analyze that data in an effort to detect anomalies.
- Alarm and warning systems and data visualization programs often are provided to assist in deriving meaningful information from the gathered data. With most such systems, however, human operators must select the thresholds for alarms and warnings, which is a daunting task. If the thresholds are too tight, then numerous false alarms are issued; and if the thresholds are too loose, equipment or system failures can go undetected.
- the data visualization programs can help building operators detect and diagnose problems, a large amount of time can be spent detecting problems. Also, the expertise of building operators varies greatly. New or inexperienced operators, in particular, may have difficulty detecting faults, and the performance of an operator may vary with the time of day or day of the week.
- the '371 application provides a robust data analysis method that automatically determines if the current energy use is significantly different than previous energy patterns and, if so, alerts the building operator or mechanics to investigate and correct the problem. This is accomplished by reviewing the data for a given utility service to detect outliers, which are data samples that vary significantly from the majority of the data. The data related to that service is separated from all the data gathered by the associated building management system. That relevant data is then categorized based on the time periods during which the data was gathered.
- utility consumption can vary widely from one day of the week to another.
- a typical office building may have relatively high utility consumption Monday through Friday when most workers are present, and significantly lower consumption on weekends.
- a manufacturing facility that operates seven days a week may have similar utility consumption every day.
- different manufacturing operations may be scheduled on different days of the week, thereby varying the level of utility consumption on a daily basis.
- the '371 application proposes that the building operator define one or more groups of days having similar utility consumption prior to implementing the outlier analysis. That grouping by the operator can be based on personal knowledge of the building use, or from visual analysis of data regarding daily average or peak utility consumption. Complicating this task, however, are the effects of seasonal trends in utility consumption. As persons skilled in the art will recognize, the power use in buildings can go through large variations during a change of season, such as when a building requires cooling in the spring.
- the present invention relates to systems and methods that analyze energy or other utility consumption information to automatically determine days of the week having similar consumption profiles.
- Such systems and methods have numerous applications.
- such systems and methods could be used to improve algorithms for forecasting or predicting future energy and electricity use, such as are commonly used in ice-storage systems.
- such systems or methods could be used to improve algorithms for predicting or detecting unusual electricity or utility consumption in buildings.
- such systems and methods could be used to fill in missing energy or utility use data in building management systems that are adapted to utilize such information.
- a method for determining days of the week with similar consumption of a utility by a computerized system.
- the method includes gathering data representative of utility consumption for a plurality of days.
- the method further includes analyzing the data to determine days of the week having similar utility consumption profiles.
- a method for determining days of the week with similar consumption of a utility by a computerized system.
- the method includes receiving a time series of utility use data spanning a plurality of days, and generating at least one feature of interest for each day in the time series.
- the method further includes transforming the at least one feature of interest for each day to remove any seasonal variation present therein, and grouping the features of interest by day of the week to define seven clusters.
- the method also includes identifying and removing outliers from the seven clusters for each feature of interest, and analyzing the seven clusters to determine days of the week with similar utility consumption profiles.
- an apparatus for determining days of the week with similar consumption of a utility includes a processor running a program.
- the program causes the processor to perform the steps of gathering time series data representative of utility consumption for a plurality of days, and analyzing the time series data to determine days of the week having similar utility consumption profiles.
- an apparatus for determining days of the week with similar consumption of a utility.
- the apparatus includes means for receiving a time series of utility use data spanning a plurality of days, and means for generating at least one feature of interest for each day in the time series.
- the apparatus further includes means for transforming the at least one feature of interest for each day to remove any seasonal variation present therein, and means for grouping the features of interest by day of the week to define seven clusters.
- the apparatus also includes means for identifying and removing outliers from the seven clusters for each feature of interest, and means for analyzing the seven clusters to determine days of the week with similar utility consumption profiles.
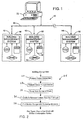
- FIG. 1 is a block diagram of a distributed facility management system which incorporates the present invention.
- FIG. 2 shows the major components of a pattern recognition system for determining days of the week with similar power consumption.
- FIG. 3 is a flow chart for a form of an agglomerative clustering algorithm along with a stopping rule for determining the final number of clusters.
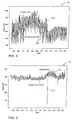
- FIG. 4 is a time series graph of peak demand and average consumption data for a first building.
- FIG. 5 is a time series graph of peak demand and average consumption data for a second building.
- FIG. 6 is a time series graph of peak demand and average consumption data for a third building.
- FIG. 7 is a time series graph of peak demand and transformed peak demand for the first building.
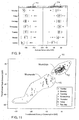
- FIG. 8 shows box plots of the original and transformed peak demand for the first building.
- FIG. 9 shows box plots of the original and transformed average consumption for the first building.
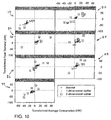
- FIG. 10 shows Trellis plots of transformed peak demand versus transformed average consumption for normal data, one-dimensional outliers and two-dimensional outliers for the first building.
- FIG. 11 shows plots of the final clusters for the first building.
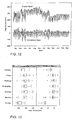
- FIG. 12 is a time series graph of peak demand and transformed peak demand for the second building.
- FIG. 13 shows box plots of the original and transformed peak demand for the second building.
- FIG. 14 shows box plots of the original and transformed average consumption for the second building.
- FIG. 15 shows Trellis plots of transformed peak demand versus transformed average consumption for normal data, one-dimensional outliers and two-dimensional outliers for the second building.
- FIG. 16 shows plots of the final clusters for the second building.
- FIG. 17 is a time series graph of peak demand and transformed peak demand for the third building.
- FIG. 18 shows box plots of the original and transformed peak demand for the third building.
- FIG. 19 shows box plots of the original and transformed average consumption for the third building.
- FIG. 20 shows Trellis plots of transformed peak demand versus transformed average consumption for normal data, one-dimensional outliers and two-dimensional outliers for the third building.
- FIG. 21 shows plots of the final clusters for the third building.
- a distributed facility management system 10 supervises the operation of systems in a plurality of buildings 12, 13 and 14.
- Each building contains its own building management system 16, which is a computer that governs the operation of various subsystems within the building.
- each building management system 16 is connected to numerous sensors positioned throughout the building to monitor consumption of different utility services at certain points of interest.
- the building management system 16 in building 13 may be connected to a main electric meter 17, a central gas meter 18 and a main water meter 19.
- individual meters for electricity, gas, water and other utilities may be attached at the supply connection to specific pieces of equipment to measure their consumption. For example, water drawn into a cooling tower of an air conditioning system may be monitored, as well as the electric consumption of the pumps for that unit.
- building management system 10 gathers data from the various sensors and stores that information in a database contained within the memory of the computer for building management system 16.
- the frequency at which the data is gathered is determined by the operator of the building based on the type of the data and the associated building function.
- the utility consumption for functions with relatively steady state operation can be sampled less frequently, as compared to equipment having large variations in utility consumption.
- the gathered data can be analyzed either locally by building management system 16 or forwarded via a communication link 20 for analysis by a centralized computer 22.
- Communication link 20 may be, for example, a wide area computer network extending among multiple buildings in an office park or on a university campus. Alternatively, communication link 20 may comprise telephone lines extending between individual stores and the main office of a large retailer spread throughout one or more cities and regions. If the analysis is to be performed locally, the system would typically utilize a local area network or direct cable connections for transmitting and receiving the gathered data between the various sensors, databases, computers, and other networked telecommunications equipment in the building management system 16.
- FIG. 2 shows the major components of a pattern recognition system 24 in accordance with one embodiment of the present invention.
- Pattern recognition system 24 may be a program that is resident on building management system 16 or on centralized computer 22. In either case, the input to pattern recognition system 24 is a time series of building energy consumption data such as electricity use, natural gas consumption, district heating consumption, cooling requirements, heating requirements, and the like.
- pattern recognition system 24 begins with a feature vector generation block 26 that determines important energy consumption features from the time series of building energy data. Examples of important features are the average daily energy consumption, peak energy use during a fifteen-minute interval for a one-day period, or minimum energy use over a fifteen-minute interval for a one-day period.
- the features are transformed with a feature transformation block 28 which is described in detail below.
- the data is grouped into seven clusters (one cluster for each day of the week) by a grouping block 30 which also is described in detail below.
- Abnormal or unusual data for each cluster are identified using an outlier analysis block 32 that removes any detected outliers from the seven clusters.
- a cluster analysis block 34 determines days of the week with similar consumption to other days of the week.
- pattern recognition system 24 is able to determine the days of the week having statistically similar electrical energy consumption profiles even when seasonal variation exists in the data samples.
- pattern recognition system 24 is described in the context of energy usage, it will be recognized that the system could be utilized in the context of numerous other utilities such as natural gas and water.
- the time series of energy use data is analyzed to generate important energy consumption features such as the average daily energy consumption and peak daily consumption over a one-hour period.
- Block 26 does not determine features for days when there is missing data or days that have an average or peak consumption of zero.
- the features generated by block 26 may be represented by a vector x d .
- the feature vector x d for day d is: where f 1, d and f 2, d are the first and second features for day d, respectively.
- the data is transformed by determining the difference between the reading for a day and a one-week period of surrounding data. This helps prevent clusters for a day of the week from being split into two distinct groups when there is a change in power use resulting from seasonal variation.
- Equation (2) was used to transform the data for average daily consumption and peak energy consumption during a fifteen-minute period to remove the seasonal variations from each building.
- the transformed feature vectors are grouped by day of the week. There are seven groups, and each group contains the feature vectors for one day of the week. For each group of data, block 30 uses only the most recent feature vectors. In the experimental results section below, the thirty most recent feature vectors were used to determine the day types for each building.
- outliers are identified and removed for each of the seven groups.
- outliers are values that are significantly different than the majority of values in a data set. For example, in the data set ⁇ 4, 5, 3, 6, 2, 99, 1, 5, 7 ⁇ , the number 99 may be considered an outlier.
- Numerous methods have been developed to identify outliers in both single and multiple dimensions.
- a preferred method of outlier detection for use in system 10 is based on the Generalized Extreme Studentized Deviate (GESD) statistical procedure described by B. Rosner, in "Percentage Points for a Generalized ESD Many-Outlier Procedure," Technometrics, Vol. 25, No. 2, pp. 165-172, May 1983.
- An application of the GESD method for identifying outliers in the specific context of analyzing electric power measurement data is provided in commonly owned U.S. Application No. 09/910,371, the entire content of which was incorporated by reference above.
- the GESD method has two user selected parameters: the probability ( ⁇ ) of incorrectly declaring one or more outliers when no outliers exist, and an upper bound ( n u ) on the number of potential outliers.
- This guideline for determining an upper bound ( n u ) on the number of potential outliers is described by Carey et al., in "Resistant and Test-Based Outlier Rejection: Effects on Gaussian One- and Two-Sampled Inference," Technometrics , Vol. 93, No. 3, pp. 320-30, August 1997.
- the GESD method is used to identify the outliers for each feature in each of the seven groups.
- the GESD method is used multiple times to determine the outliers. For example, if there are two features in each feature vector, the GESD method is used fourteen times (2 features times 7 clusters) to the determine outliers. Similarly, if there are three features in each feature vector, the GESD method is used twenty-one times (3 features times 7 clusters) to the determine outliers. For each group, any outliers that are detected are removed from the data set by block 32.
- clustering block 34 a clustering analysis is used to find similar groups.
- One common method of cluster analysis is the agglomerative hierarchical clustering method.
- the number of initial clusters equals the number of observations (i.e., "feature vectors" in the illustrated embodiment).
- the number of initial clusters is seven (i.e., the number of groups) and there is more than one observation (or feature vector) in each cluster.
- the traditional agglomerative hierarchical clustering method is not appropriate for solving the problem at hand.
- FIG. 3 is a flow chart for a revised form of the traditional agglomerative clustering along with a stopping rule for determining the final number of clusters.
- the revised clustering algorithm is indicated generally by reference numeral 36.
- Clustering algorithm 36 commences at a step 38 by determining a measure of dissimilarity between each pair of clusters.
- a measure of dissimilarity between two clusters is known as a dissimilarity coefficient. If two clusters are close together, the dissimilarity coefficient is small; and if two clusters are far apart, the dissimilarity coefficient is large.
- the dissimilarity coefficient between two clusters can be defined by several different methods that are well known.
- One common method is the average linkage method.
- the average linkage method defines the dissimilarity coefficient between clusters C i and C j as the average distance between every pair of observations (or feature vectors), where one observation of the pair belongs to cluster C i and the other observation belongs to cluster C j .
- the dissimilarity coefficient between clusters C i and C j is determined from: where n i is the number of observations (or feature vectors) in cluster C i , n j is the number of observations in cluster C j , and d ( x , y ) is the dissimilarity measure between observations x and y .
- Clustering algorithm 36 continues at a step 40 by finding the nearest clusters among all possible pairs of clusters. This is done by finding the pair of clusters that is most similar in terms of the measurement of dissimilarity between clusters.
- clustering algorithm 36 determines whether the nearest clusters should be combined. This may be done by utilizing a stopping rule.
- a stopping rule is a method for determining the best number of clusters. There are numerous stopping rules known in the art of clustering analysis. A disadvantage of some stopping rules is they are unable to determine if there should be only one cluster.
- the nearest clusters (e.g., assumed to be clusters C i and C j for convenience) should be joined if the following inequality is satisfied: z ⁇ 1 - 2 ⁇ n features - SS i + SS j SS i ⁇ j 2[1-8/( ⁇ 2 n features )] ( n i + n j ) n features
- z is a critical value from a standard normal distribution
- n features is the number of features
- n i and n j are the number of observations (or feature vectors) in clusters C i and C j , respectively
- SS i and SS j are the sum of squared distance from the mean for clusters C i and C j
- SS i ⁇ j is the sum of squared distances from the mean when cluster C i is combined with cluster C j .
- the sum of squared distance from the mean for cluster C is determined from: where x
- step 46 the nearest clusters C i and C j are combined, after which a new dissimilarity coefficient is determined between the combined cluster C i ⁇ C j and each remaining cluster.
- the flow returns to step 40.
- step 48 If the nearest clusters C i and C j should be joined as determined by step 42, and there are only two remaining clusters C i and C j as determined by step 44, then the number of day types is set to one by a step 48.
- step 42 determines that clusters C i and C j should not be joined, then the number of day types is set to the number of remaining clusters in a step 50.
- FIGS. 4, 5 and 6 show time series graphs 52-62 of the peak consumption (e.g., solid lines 52, 56 and 60) over a fifteen-minute period and the average daily consumption (e.g., dashed lines 54, 58 and 62) for buildings 12, 13 and 14, respectively.
- the baselines for the average and peak consumption in the illustrated field test results for buildings 12, 13 and 14 appear to change with the season.
- the base consumption level is higher during the warmer months (May through September) than during the cooler season, possibly due to an increase in energy consumption resulting from mechanical cooling.
- the opposite results are seen, i.e., the cooler season appears to exhibit a slightly higher base consumption level.
- Table 1 summarizes the final results of this analysis for buildings 12, 13 and 14: Building Number Number Of Final Clusters Final Clusters 12 2 Weekdays & Weekends 13 3 Saturdays, Sundays, & Weekdays 14 3 Mondays, Weekends, & ⁇ Tuesdays, Wednesdays, Thursdays, & Fridays ⁇
- the critical Z value i.e., the stopping value
- the nearest clusters are combined into one cluster. Notice that the final clusters are different for each of the three buildings.
- Table 2 shows the nearest clusters, dissimilarity measure between clusters, and the right-hand side of inequality (5) (i.e., the stopping rule) during operation of clustering algorithm 36 for building 12: Number of Clusters Nearest Clusters Dissimilarity Measure z stop 7 Wed Thu 5.2 -2.4 6 Fri Wed, Thu 5.8 -2.0 5 Tue Wed, Thu Fri 6.5 -3.5 4 Mon Tue, Wed, Thu, Fri 8.1 -1.4 3 Sat Sun 26.0 1.5 2 Sat, Sun Mon, Tue, Wed, Thu, Fri 40.4 6.6
- the final clusters for a critical Z value of 2 are weekends (Sat & Sun) and weekdays (Mon, Tue, Wed, Thu, & Fri).
- Table 3 shows the nearest clusters, the dissimilarity measure between clusters, and the right-hand side of inequality (5) during operation of clustering algorithm 36 for building 13: Number of Clusters Nearest Clusters Dissimilarity Measure z stop 7 Mon Tue 8.4 -2.4 6 Fri Mon, Tue 11.6 -3.3 5 Thu Mon, Tue, Fri 12.8 -3.7 4 Wed Mon, Tue, Thu, Fri 15.3 -4.3 3 Sat Mon, Tue, Wed, Thu, Fri 33.5 2.5 In the data from building 13, the final clusters for a critical Z value of 2 are Saturdays, Sundays, and Weekdays (Mon, Tue, Wed, Thu, & Fri).
- Table 4 shows the nearest clusters, the dissimilarity measure between clusters, and the right-hand side of inequality (5) during operation of clustering algorithm 36 for building 14: Number of Clusters Nearest Clusters Dissimilarity Measure z stop 7 Wed Fri 4.6758 -2.2932 6 Tue Wed, Fri 5.4663 -3.1477 5 Thu Tue, Wed, Fri 5.8964 -4.0164 4 Sat Sun 6.0515 -2.2309 3 Sat, Sun Tue, Wed, Thu, Fri 12.996 3.9469
- the final clusters for a critical Z value of 2 are Mondays, Weekends (Sat & Sun) and ⁇ Tuesdays, Wednesdays, Thursdays, and Fridays ⁇ .
- FIGS. 7-11 all relate to the consumption data associated with building 12.
- time series graphs 64 and 66 are representative of the original peak daily consumption (upper line) and the transformed peak daily consumption (lower line).
- the baseline for the original peak consumption (graph 64) appears to change with the season.
- the feature vector transformation block 28 described above removes this seasonal change in power consumption and results in the transformed consumption (graph 66) having a baseline 68 of zero.
- FIG. 8 shows box plots 70 and 72 which are representative of the peak consumption for each day of the week for the original data (left column) and transformed data (right column), respectively, for building 12. Notice that inter-quartile range for the transformed data (box plots 72) is much smaller than the inter-quartile range for the original data (box plots 70). As a result, it is substantially easier to visually determine the days of the week having similar peak consumption profiles in the transformed data compared to the original data.
- FIG. 9 shows similar box plots 74 and 76 which are representative of the average consumption for each day of the week for the original data (left column) and transformed data (right column), respectively, for building 12. Notice that the average consumption for all the weekdays in the transformed data (box plots 76) are similar. This pattern is significantly more difficult to detect in the original data (box plots 74).
- FIG. 10 shows Trellis plots 78-90 which are representative of transformed peak demand (vertical axes) versus transformed average consumption (horizontal axes) for normal observations (feature vectors), one-dimensional outliers, and two-dimensional outliers, for each day of the week for building 12. Notice that the plot for Friday (Trellis plot 88) contains three types of outliers: one-dimensional outliers, two-dimensional outliers, and observations (feature vectors) that are both one and two-dimensional outliers.
- FIG. 11 is a scatter plot 92 that shows the final two clusters 94 and 96 corresponding to weekdays and weekends, respectively. Notice that there is no overlap between clusters 94 and 96.
- FIGS. 12-21 Similar graphs and plots can be seen in FIGS. 12-21. More specifically, FIGS. 12-16 generally correspond to FIGS. 5-11, respectively, except that they relate to consumption data associated with building 13 rather than building 12. Similarly, FIGS. 17-21 generally correspond to FIGS. 5-11, respectively, except that they relate to consumption data associated with building 14 rather than building 12.
Landscapes
- Engineering & Computer Science (AREA)
- Power Engineering (AREA)
- Management, Administration, Business Operations System, And Electronic Commerce (AREA)
- Image Analysis (AREA)
- Complex Calculations (AREA)
- Information Retrieval, Db Structures And Fs Structures Therefor (AREA)
Applications Claiming Priority (2)
| Application Number | Priority Date | Filing Date | Title |
|---|---|---|---|
| US21382 | 1979-03-19 | ||
| US10/021,382 US20030101009A1 (en) | 2001-10-30 | 2001-10-30 | Apparatus and method for determining days of the week with similar utility consumption profiles |
Publications (2)
| Publication Number | Publication Date |
|---|---|
| EP1309062A2 true EP1309062A2 (de) | 2003-05-07 |
| EP1309062A3 EP1309062A3 (de) | 2004-03-10 |
Family
ID=21803868
Family Applications (1)
| Application Number | Title | Priority Date | Filing Date |
|---|---|---|---|
| EP02253862A Withdrawn EP1309062A3 (de) | 2001-10-30 | 2002-05-31 | Verfahren und Vorrichtung zur Bestimmung von Wochentagen mit ähnlichen Verbrauchsprofilen |
Country Status (3)
| Country | Link |
|---|---|
| US (1) | US20030101009A1 (de) |
| EP (1) | EP1309062A3 (de) |
| JP (1) | JP2003242212A (de) |
Cited By (17)
| Publication number | Priority date | Publication date | Assignee | Title |
|---|---|---|---|---|
| WO2007103662A1 (en) * | 2006-03-01 | 2007-09-13 | Honeywell International Inc. | Characterization of utility demand using utility demand footprint |
| EP1704500B1 (de) * | 2003-12-31 | 2008-07-16 | Nokia Siemens Networks Oy | Cluster-technik für zyklische phänomene |
| WO2009005780A1 (en) * | 2007-06-29 | 2009-01-08 | Square D Company | Automatic utility usage rate analysis methodology |
| GB2477005A (en) * | 2009-11-12 | 2011-07-20 | Onzo Ltd | Wavelet analysis for noise reduction in data associated with consumption of utilities |
| US8204675B2 (en) | 2009-03-24 | 2012-06-19 | International Business Machines Corporation | Portable navigation device point of interest selection based on store open probability |
| US8325637B2 (en) | 2007-07-31 | 2012-12-04 | Johnson Controls Technology Company | Pairing wireless devices of a network using relative gain arrays |
| EP2650831A1 (de) * | 2012-04-12 | 2013-10-16 | Thomson Licensing | Verfahren zur Bestimmung eines Stromverbrauchsprofils einer Einrichtung und eines Systems |
| CN103477360A (zh) * | 2011-04-21 | 2013-12-25 | 松下电器产业株式会社 | 能量管理装置以及能量管理系统 |
| US8781767B2 (en) | 2011-08-19 | 2014-07-15 | General Electric Company | Systems and methods for data anomaly detection |
| US8825583B2 (en) | 2009-12-18 | 2014-09-02 | Onzo Limited | Utility data processing system |
| US9483737B2 (en) | 2011-05-18 | 2016-11-01 | Onzo Limited | Identifying an event associated with consumption of a utility |
| US9953474B2 (en) | 2016-09-02 | 2018-04-24 | Honeywell International Inc. | Multi-level security mechanism for accessing a panel |
| US10482204B2 (en) | 2015-02-17 | 2019-11-19 | Schneider Electric Industries Sas | System for processing data and modelling for analysis of the energy consumption of a site |
| US10684030B2 (en) | 2015-03-05 | 2020-06-16 | Honeywell International Inc. | Wireless actuator service |
| US10789800B1 (en) | 2019-05-24 | 2020-09-29 | Ademco Inc. | Systems and methods for authorizing transmission of commands and signals to an access control device or a control panel device |
| US10832509B1 (en) | 2019-05-24 | 2020-11-10 | Ademco Inc. | Systems and methods of a doorbell device initiating a state change of an access control device and/or a control panel responsive to two-factor authentication |
| US12455949B2 (en) | 2021-01-22 | 2025-10-28 | Resideo Llc | Enhanced sequential biometric verification |
Families Citing this family (82)
| Publication number | Priority date | Publication date | Assignee | Title |
|---|---|---|---|---|
| US20030200134A1 (en) * | 2002-03-29 | 2003-10-23 | Leonard Michael James | System and method for large-scale automatic forecasting |
| US6766265B2 (en) * | 2002-12-18 | 2004-07-20 | Advanced Micro Devices, Inc. | Processing tester information by trellising in integrated circuit technology development |
| US7707148B1 (en) * | 2003-10-07 | 2010-04-27 | Natural Selection, Inc. | Method and device for clustering categorical data and identifying anomalies, outliers, and exemplars |
| US8010324B1 (en) | 2005-05-09 | 2011-08-30 | Sas Institute Inc. | Computer-implemented system and method for storing data analysis models |
| US8112302B1 (en) * | 2006-11-03 | 2012-02-07 | Sas Institute Inc. | Computer-implemented systems and methods for forecast reconciliation |
| JP5134266B2 (ja) * | 2007-03-07 | 2013-01-30 | 大阪瓦斯株式会社 | 省エネ行動支援システム |
| US20080277486A1 (en) * | 2007-05-09 | 2008-11-13 | Johnson Controls Technology Company | HVAC control system and method |
| US20090065596A1 (en) * | 2007-05-09 | 2009-03-12 | Johnson Controls Technology Company | Systems and methods for increasing building space comfort using wireless devices |
| US20090216611A1 (en) * | 2008-02-25 | 2009-08-27 | Leonard Michael J | Computer-Implemented Systems And Methods Of Product Forecasting For New Products |
| US9547710B2 (en) * | 2008-08-05 | 2017-01-17 | Vmware, Inc. | Methods for the cyclical pattern determination of time-series data using a clustering approach |
| US9245000B2 (en) * | 2008-08-05 | 2016-01-26 | Vmware, Inc. | Methods for the cyclical pattern determination of time-series data using a clustering approach |
| US8171033B2 (en) * | 2008-09-30 | 2012-05-01 | Vmware, Inc. | Methods and systems for the determination of thresholds via weighted quantile analysis |
| US20100106543A1 (en) * | 2008-10-28 | 2010-04-29 | Honeywell International Inc. | Building management configuration system |
| US8850347B2 (en) | 2010-09-30 | 2014-09-30 | Honeywell International Inc. | User interface list control system |
| US20110093493A1 (en) | 2008-10-28 | 2011-04-21 | Honeywell International Inc. | Building management system site categories |
| US8719385B2 (en) * | 2008-10-28 | 2014-05-06 | Honeywell International Inc. | Site controller discovery and import system |
| US8819562B2 (en) | 2010-09-30 | 2014-08-26 | Honeywell International Inc. | Quick connect and disconnect, base line configuration, and style configurator |
| US8572502B2 (en) * | 2008-11-21 | 2013-10-29 | Honeywell International Inc. | Building control system user interface with docking feature |
| US9471202B2 (en) * | 2008-11-21 | 2016-10-18 | Honeywell International Inc. | Building control system user interface with pinned display feature |
| TWI482033B (zh) * | 2009-01-23 | 2015-04-21 | Wistron Corp | 排程方法及電腦 |
| US8554714B2 (en) * | 2009-05-11 | 2013-10-08 | Honeywell International Inc. | High volume alarm management system |
| US8224763B2 (en) | 2009-05-11 | 2012-07-17 | Honeywell International Inc. | Signal management system for building systems |
| US8781608B2 (en) * | 2009-07-31 | 2014-07-15 | Johnson Controls Technology Company | Systems and methods for improved start-up in feedback controllers |
| TW201118789A (en) * | 2009-09-09 | 2011-06-01 | Univ Trobe | Method and system for energy management |
| US8352047B2 (en) | 2009-12-21 | 2013-01-08 | Honeywell International Inc. | Approaches for shifting a schedule |
| US8428755B2 (en) * | 2010-02-01 | 2013-04-23 | Johnson Controls Technology Company | Systems and methods for increasing feedback controller response times |
| US20110196539A1 (en) * | 2010-02-10 | 2011-08-11 | Honeywell International Inc. | Multi-site controller batch update system |
| US8631040B2 (en) | 2010-02-23 | 2014-01-14 | Sas Institute Inc. | Computer-implemented systems and methods for flexible definition of time intervals |
| US7920983B1 (en) | 2010-03-04 | 2011-04-05 | TaKaDu Ltd. | System and method for monitoring resources in a water utility network |
| US8640098B2 (en) * | 2010-03-11 | 2014-01-28 | Honeywell International Inc. | Offline configuration and download approach |
| US8890675B2 (en) | 2010-06-02 | 2014-11-18 | Honeywell International Inc. | Site and alarm prioritization system |
| US8648706B2 (en) | 2010-06-24 | 2014-02-11 | Honeywell International Inc. | Alarm management system having an escalation strategy |
| US8386087B2 (en) * | 2010-08-02 | 2013-02-26 | General Electric Company | Load shed system for demand response without AMI/AMR system |
| US9213539B2 (en) | 2010-12-23 | 2015-12-15 | Honeywell International Inc. | System having a building control device with on-demand outside server functionality |
| US8989910B1 (en) * | 2010-12-31 | 2015-03-24 | C3, Inc. | Systems and methods for data mining of energy consumption data |
| US8583386B2 (en) | 2011-01-18 | 2013-11-12 | TaKaDu Ltd. | System and method for identifying likely geographical locations of anomalies in a water utility network |
| US8682491B2 (en) | 2011-02-04 | 2014-03-25 | Varetika International LLLP | Systems and methods for energy management and device automation system |
| US20140039849A1 (en) * | 2011-04-20 | 2014-02-06 | Massachusetts Institute Of Technology | Method for the construction of a water distribution model |
| US9047559B2 (en) | 2011-07-22 | 2015-06-02 | Sas Institute Inc. | Computer-implemented systems and methods for testing large scale automatic forecast combinations |
| US9171339B2 (en) * | 2011-11-03 | 2015-10-27 | International Business Machines Corporation | Behavior change detection |
| US8341106B1 (en) | 2011-12-07 | 2012-12-25 | TaKaDu Ltd. | System and method for identifying related events in a resource network monitoring system |
| US20130166337A1 (en) * | 2011-12-26 | 2013-06-27 | John MacGregor | Analyzing visual representation of data |
| US9053519B2 (en) | 2012-02-13 | 2015-06-09 | TaKaDu Ltd. | System and method for analyzing GIS data to improve operation and monitoring of water distribution networks |
| US9223839B2 (en) | 2012-02-22 | 2015-12-29 | Honeywell International Inc. | Supervisor history view wizard |
| US10088335B2 (en) * | 2012-04-13 | 2018-10-02 | International Business Machines Corporation | Anomaly detection using usage data for metering system |
| US10242414B2 (en) | 2012-06-12 | 2019-03-26 | TaKaDu Ltd. | Method for locating a leak in a fluid network |
| US9244887B2 (en) | 2012-07-13 | 2016-01-26 | Sas Institute Inc. | Computer-implemented systems and methods for efficient structuring of time series data |
| US9087306B2 (en) | 2012-07-13 | 2015-07-21 | Sas Institute Inc. | Computer-implemented systems and methods for time series exploration |
| JP5914281B2 (ja) * | 2012-09-27 | 2016-05-11 | アズビル株式会社 | 予測変数特定装置、方法、およびプログラム |
| US9529349B2 (en) | 2012-10-22 | 2016-12-27 | Honeywell International Inc. | Supervisor user management system |
| EP2901538B1 (de) * | 2012-11-20 | 2018-01-31 | Siemens Aktiengesellschaft | Verfahren und system zum betreiben eines elektrischen energieversorgungsnetzes |
| US9147218B2 (en) | 2013-03-06 | 2015-09-29 | Sas Institute Inc. | Devices for forecasting ratios in hierarchies |
| US20140278165A1 (en) * | 2013-03-14 | 2014-09-18 | Johnson Controls Technology Company | Systems and methods for analyzing energy consumption model data |
| JP2014180187A (ja) * | 2013-03-15 | 2014-09-25 | Toshiba Corp | 電力需要予測装置、方法及びプログラム並びに需要抑制計画策定装置 |
| US9934259B2 (en) | 2013-08-15 | 2018-04-03 | Sas Institute Inc. | In-memory time series database and processing in a distributed environment |
| US9971977B2 (en) | 2013-10-21 | 2018-05-15 | Honeywell International Inc. | Opus enterprise report system |
| JP6134253B2 (ja) * | 2013-11-07 | 2017-05-24 | 東京瓦斯株式会社 | エネルギー消費量予測システムおよびエネルギー消費量予測方法 |
| US10169720B2 (en) | 2014-04-17 | 2019-01-01 | Sas Institute Inc. | Systems and methods for machine learning using classifying, clustering, and grouping time series data |
| US9892370B2 (en) | 2014-06-12 | 2018-02-13 | Sas Institute Inc. | Systems and methods for resolving over multiple hierarchies |
| US9933762B2 (en) | 2014-07-09 | 2018-04-03 | Honeywell International Inc. | Multisite version and upgrade management system |
| JP6560486B2 (ja) * | 2014-08-07 | 2019-08-14 | 株式会社インテック | 平日/非平日推定装置及び平日/非平日推定方法 |
| US9208209B1 (en) | 2014-10-02 | 2015-12-08 | Sas Institute Inc. | Techniques for monitoring transformation techniques using control charts |
| CN104572878B (zh) * | 2014-12-22 | 2017-10-27 | 北京工商大学 | 基于综合分层聚类的湖库、流域的水质监测断面优化布设方法 |
| US9418339B1 (en) | 2015-01-26 | 2016-08-16 | Sas Institute, Inc. | Systems and methods for time series analysis techniques utilizing count data sets |
| US10983682B2 (en) | 2015-08-27 | 2021-04-20 | Sas Institute Inc. | Interactive graphical user-interface for analyzing and manipulating time-series projections |
| US10362104B2 (en) | 2015-09-23 | 2019-07-23 | Honeywell International Inc. | Data manager |
| US10209689B2 (en) | 2015-09-23 | 2019-02-19 | Honeywell International Inc. | Supervisor history service import manager |
| US10515308B2 (en) | 2015-10-30 | 2019-12-24 | Global Design Corporation Ltd. | System, method and cloud-based platform for predicting energy consumption |
| US10600307B2 (en) * | 2015-10-30 | 2020-03-24 | Global Design Corporation Ltd. | Energy consumption alerting method, energy consumption alerting system and platform |
| US10510126B2 (en) | 2015-10-30 | 2019-12-17 | Global Design Corporation Ltd. | Energy consumption alerting system, platform and method |
| EP3376446A1 (de) | 2017-03-18 | 2018-09-19 | Tata Consultancy Services Limited | Verfahren und system zur anomaliedetektion, bewertung von fehlenden daten und verbrauchsvorhersage in energiedaten |
| US11243970B2 (en) * | 2017-06-30 | 2022-02-08 | Paypal, Inc. | Intelligent database connection management |
| US10331490B2 (en) | 2017-11-16 | 2019-06-25 | Sas Institute Inc. | Scalable cloud-based time series analysis |
| US10338994B1 (en) | 2018-02-22 | 2019-07-02 | Sas Institute Inc. | Predicting and adjusting computer functionality to avoid failures |
| US10255085B1 (en) | 2018-03-13 | 2019-04-09 | Sas Institute Inc. | Interactive graphical user interface with override guidance |
| US10685283B2 (en) | 2018-06-26 | 2020-06-16 | Sas Institute Inc. | Demand classification based pipeline system for time-series data forecasting |
| US10560313B2 (en) | 2018-06-26 | 2020-02-11 | Sas Institute Inc. | Pipeline system for time-series data forecasting |
| CN109599895B (zh) * | 2018-12-10 | 2020-09-18 | 国网浙江建德市供电有限公司 | 一种基于聚类分析的分布式光伏接入方法 |
| CN113853623A (zh) * | 2019-05-29 | 2021-12-28 | 西门子股份公司 | 电力负荷的预测方法、装置及存储介质 |
| WO2020252784A1 (zh) * | 2019-06-21 | 2020-12-24 | 西门子股份公司 | 电力负荷数据的预测方法、装置及存储介质 |
| US20210241392A1 (en) * | 2020-02-05 | 2021-08-05 | International Business Machines Corporation | Metrics for energy saving and response behavior |
| US20240427684A1 (en) * | 2023-06-20 | 2024-12-26 | International Business Machines Corporation | Abnormal point simulation |
Family Cites Families (9)
| Publication number | Priority date | Publication date | Assignee | Title |
|---|---|---|---|---|
| US5263120A (en) * | 1991-04-29 | 1993-11-16 | Bickel Michael A | Adaptive fast fuzzy clustering system |
| US5572438A (en) * | 1995-01-05 | 1996-11-05 | Teco Energy Management Services | Engery management and building automation system |
| US5930773A (en) * | 1997-12-17 | 1999-07-27 | Avista Advantage, Inc. | Computerized resource accounting methods and systems, computerized utility management methods and systems, multi-user utility management methods and systems, and energy-consumption-based tracking methods and systems |
| US6366889B1 (en) * | 1998-05-18 | 2002-04-02 | Joseph A. Zaloom | Optimizing operational efficiency and reducing costs of major energy system at large facilities |
| AU6097600A (en) * | 1999-07-15 | 2001-02-05 | Ebidenergy.Com | User interface to facilitate, analyze and manage resource consumption |
| AU2001247336B2 (en) * | 2000-03-10 | 2006-02-02 | Smiths Detection, Inc. | Control for an industrial process using one or more multidimensional variables |
| CA2343468A1 (en) * | 2001-04-05 | 2002-10-05 | Conectiv Solutions, L.L.C. | Computer assisted and/or implemented process and architecture for web-based monitoring of energy related usage, and client accessibility therefor |
| US7089190B2 (en) * | 2001-05-18 | 2006-08-08 | Power Resource Managers, Llp | System and method for managing utility power use |
| US6816811B2 (en) * | 2001-06-21 | 2004-11-09 | Johnson Controls Technology Company | Method of intelligent data analysis to detect abnormal use of utilities in buildings |
-
2001
- 2001-10-30 US US10/021,382 patent/US20030101009A1/en not_active Abandoned
-
2002
- 2002-05-31 EP EP02253862A patent/EP1309062A3/de not_active Withdrawn
- 2002-10-29 JP JP2002313716A patent/JP2003242212A/ja active Pending
Cited By (30)
| Publication number | Priority date | Publication date | Assignee | Title |
|---|---|---|---|---|
| EP1704500B1 (de) * | 2003-12-31 | 2008-07-16 | Nokia Siemens Networks Oy | Cluster-technik für zyklische phänomene |
| US7461037B2 (en) | 2003-12-31 | 2008-12-02 | Nokia Siemens Networks Oy | Clustering technique for cyclic phenomena |
| WO2007103662A1 (en) * | 2006-03-01 | 2007-09-13 | Honeywell International Inc. | Characterization of utility demand using utility demand footprint |
| US7392115B2 (en) | 2006-03-01 | 2008-06-24 | Honeywell International Inc. | Characterization of utility demand using utility demand footprint |
| WO2009005780A1 (en) * | 2007-06-29 | 2009-01-08 | Square D Company | Automatic utility usage rate analysis methodology |
| US7684901B2 (en) | 2007-06-29 | 2010-03-23 | Buettner William L | Automatic utility usage rate analysis methodology |
| US8325637B2 (en) | 2007-07-31 | 2012-12-04 | Johnson Controls Technology Company | Pairing wireless devices of a network using relative gain arrays |
| US8705423B2 (en) | 2007-07-31 | 2014-04-22 | Johnson Controls Technology Company | Pairing wireless devices of a network using relative gain arrays |
| US8204675B2 (en) | 2009-03-24 | 2012-06-19 | International Business Machines Corporation | Portable navigation device point of interest selection based on store open probability |
| US8874623B2 (en) | 2009-11-12 | 2014-10-28 | Onzo Limited | Data storage and transfer |
| GB2477005B (en) * | 2009-11-12 | 2013-02-20 | Onzo Ltd | Method and apparatus for noise reduction and data compression |
| GB2477005A (en) * | 2009-11-12 | 2011-07-20 | Onzo Ltd | Wavelet analysis for noise reduction in data associated with consumption of utilities |
| US8843332B2 (en) | 2009-11-12 | 2014-09-23 | Onzo Limited | Method and apparatus for noise reduction and data compression |
| US8825583B2 (en) | 2009-12-18 | 2014-09-02 | Onzo Limited | Utility data processing system |
| US9612586B2 (en) | 2011-04-21 | 2017-04-04 | Panasonic Intellectual Property Management Co., Ltd. | Energy management apparatus and energy management system |
| CN103477360A (zh) * | 2011-04-21 | 2013-12-25 | 松下电器产业株式会社 | 能量管理装置以及能量管理系统 |
| EP2701116A4 (de) * | 2011-04-21 | 2014-08-27 | Panasonic Corp | Energieverwaltungsvorrichtung und energieverwaltungssystem |
| US9483737B2 (en) | 2011-05-18 | 2016-11-01 | Onzo Limited | Identifying an event associated with consumption of a utility |
| US8781767B2 (en) | 2011-08-19 | 2014-07-15 | General Electric Company | Systems and methods for data anomaly detection |
| WO2013152964A1 (en) * | 2012-04-12 | 2013-10-17 | Thomson Licensing | A method for determining an electricity consumption profile of a facility and a system |
| EP2650831A1 (de) * | 2012-04-12 | 2013-10-16 | Thomson Licensing | Verfahren zur Bestimmung eines Stromverbrauchsprofils einer Einrichtung und eines Systems |
| US10482204B2 (en) | 2015-02-17 | 2019-11-19 | Schneider Electric Industries Sas | System for processing data and modelling for analysis of the energy consumption of a site |
| US10684030B2 (en) | 2015-03-05 | 2020-06-16 | Honeywell International Inc. | Wireless actuator service |
| US11927352B2 (en) | 2015-03-05 | 2024-03-12 | Honeywell International Inc. | Wireless actuator service |
| US9953474B2 (en) | 2016-09-02 | 2018-04-24 | Honeywell International Inc. | Multi-level security mechanism for accessing a panel |
| US10789800B1 (en) | 2019-05-24 | 2020-09-29 | Ademco Inc. | Systems and methods for authorizing transmission of commands and signals to an access control device or a control panel device |
| US10832509B1 (en) | 2019-05-24 | 2020-11-10 | Ademco Inc. | Systems and methods of a doorbell device initiating a state change of an access control device and/or a control panel responsive to two-factor authentication |
| US11854329B2 (en) | 2019-05-24 | 2023-12-26 | Ademco Inc. | Systems and methods for authorizing transmission of commands and signals to an access control device or a control panel device |
| US12511965B2 (en) | 2019-05-24 | 2025-12-30 | Resideo Llc | Systems and methods of a doorbell device initiating a state change of an access control device and/or a control panel responsive to two-factor authentication |
| US12455949B2 (en) | 2021-01-22 | 2025-10-28 | Resideo Llc | Enhanced sequential biometric verification |
Also Published As
| Publication number | Publication date |
|---|---|
| JP2003242212A (ja) | 2003-08-29 |
| US20030101009A1 (en) | 2003-05-29 |
| EP1309062A3 (de) | 2004-03-10 |
Similar Documents
| Publication | Publication Date | Title |
|---|---|---|
| EP1309062A2 (de) | Verfahren und Vorrichtung zur Bestimmung von Wochentagen mit ähnlichen Verbrauchsprofilen | |
| CN110097297B (zh) | 一种多维度窃电态势智能感知方法、系统、设备及介质 | |
| US6816811B2 (en) | Method of intelligent data analysis to detect abnormal use of utilities in buildings | |
| de Souza et al. | Detection and identification of energy theft in advanced metering infrastructures | |
| CN110223196B (zh) | 基于典型行业特征库和反窃电样本库的反窃电分析方法 | |
| Seem | Using intelligent data analysis to detect abnormal energy consumption in buildings | |
| CN118014185A (zh) | 一种基于大数据的市政管网健康度在线监测系统 | |
| CN117196159A (zh) | 基于互联网大数据分析的智慧水务分区计量系统 | |
| CN118839617A (zh) | 一种光伏建设用周期数字孪生辅助管理平台 | |
| US11378415B2 (en) | Method and system for detecting anomalies in energy consumption | |
| CN113111053A (zh) | 一种基于大数据的线损诊断与反窃电系统、方法及模型 | |
| CN109636124A (zh) | 基于大数据的电力行业低压台区线损分析方法及处理系统 | |
| WO2005015366A2 (en) | Real-time performance monitoring and management system | |
| CN120162558A (zh) | 一种线缆的老化诊断监测方法及系统 | |
| US20220004902A1 (en) | Methods for remote building intelligence, energy waste detection, efficiency tracking, utility management and analytics | |
| CN118094262B (zh) | 一种基于空间聚类的负荷异常值检测方法 | |
| CN118378156B (zh) | 基于历史数据分析的厂站关口计量数据缺失拟合优化方法、系统、电子设备及存储介质 | |
| CN117955245A (zh) | 电网的运行状态的确定方法、装置、存储介质和电子设备 | |
| CN119727096A (zh) | 一种分布式光伏逆变器采集调度方法及系统 | |
| CN118312813A (zh) | 一种基于大数据算法台区智能健康诊断方法和系统 | |
| CN113847943A (zh) | 一种智慧水务多功能集成测试环境 | |
| Berres et al. | Evaluating the impact of power outages on occupancy patterns during the 2021 texas power crisis | |
| Zhang et al. | Research on comprehensive diagnosis model of anti-stealing electricity based on big data technology | |
| Lu et al. | The development of a smart distribution grid testbed for integrated information management systems | |
| Qin et al. | An identification method of metering anomaly based on line loss analysis of low voltage station |
Legal Events
| Date | Code | Title | Description |
|---|---|---|---|
| PUAI | Public reference made under article 153(3) epc to a published international application that has entered the european phase |
Free format text: ORIGINAL CODE: 0009012 |
|
| AK | Designated contracting states |
Designated state(s): AT BE CH CY DE DK ES FI FR GB GR IE IT LI LU MC NL PT SE TR |
|
| AX | Request for extension of the european patent |
Extension state: AL LT LV MK RO SI |
|
| PUAL | Search report despatched |
Free format text: ORIGINAL CODE: 0009013 |
|
| AK | Designated contracting states |
Kind code of ref document: A3 Designated state(s): AT BE CH CY DE DK ES FI FR GB GR IE IT LI LU MC NL PT SE TR |
|
| AX | Request for extension of the european patent |
Extension state: AL LT LV MK RO SI |
|
| RIC1 | Information provided on ipc code assigned before grant |
Ipc: 7H 02J 7/16 B Ipc: 7H 02J 7/14 B Ipc: 7G 06F 17/18 A |
|
| AKX | Designation fees paid |
Designated state(s): DE GB |
|
| STAA | Information on the status of an ep patent application or granted ep patent |
Free format text: STATUS: THE APPLICATION IS DEEMED TO BE WITHDRAWN |
|
| 18D | Application deemed to be withdrawn |
Effective date: 20040911 |