EP1323376A2 - Verfahren und Vorrichtung zur EKG-Diagnose - Google Patents
Verfahren und Vorrichtung zur EKG-Diagnose Download PDFInfo
- Publication number
- EP1323376A2 EP1323376A2 EP02027517A EP02027517A EP1323376A2 EP 1323376 A2 EP1323376 A2 EP 1323376A2 EP 02027517 A EP02027517 A EP 02027517A EP 02027517 A EP02027517 A EP 02027517A EP 1323376 A2 EP1323376 A2 EP 1323376A2
- Authority
- EP
- European Patent Office
- Prior art keywords
- data
- average value
- diagnostic
- period
- time
- Prior art date
- Legal status (The legal status is an assumption and is not a legal conclusion. Google has not performed a legal analysis and makes no representation as to the accuracy of the status listed.)
- Withdrawn
Links
- 238000003745 diagnosis Methods 0.000 title claims abstract description 66
- 238000000034 method Methods 0.000 title description 20
- 238000004364 calculation method Methods 0.000 claims abstract description 87
- 238000004891 communication Methods 0.000 claims description 29
- 230000006870 function Effects 0.000 claims description 9
- 238000012545 processing Methods 0.000 abstract description 35
- 238000001514 detection method Methods 0.000 abstract description 23
- 102100024061 Integrator complex subunit 1 Human genes 0.000 abstract description 13
- 101710092857 Integrator complex subunit 1 Proteins 0.000 abstract description 13
- 238000002405 diagnostic procedure Methods 0.000 description 20
- 238000004458 analytical method Methods 0.000 description 17
- 230000008569 process Effects 0.000 description 12
- 102100028043 Fibroblast growth factor 3 Human genes 0.000 description 11
- 108050002021 Integrator complex subunit 2 Proteins 0.000 description 11
- 238000007689 inspection Methods 0.000 description 11
- 208000024891 symptom Diseases 0.000 description 9
- 230000008859 change Effects 0.000 description 8
- 230000005856 abnormality Effects 0.000 description 7
- 238000005516 engineering process Methods 0.000 description 7
- 238000012546 transfer Methods 0.000 description 7
- 230000002159 abnormal effect Effects 0.000 description 5
- 238000013480 data collection Methods 0.000 description 5
- 230000000694 effects Effects 0.000 description 5
- 238000010586 diagram Methods 0.000 description 4
- 208000020446 Cardiac disease Diseases 0.000 description 3
- 208000037265 diseases, disorders, signs and symptoms Diseases 0.000 description 3
- 238000011156 evaluation Methods 0.000 description 3
- 208000019622 heart disease Diseases 0.000 description 3
- 230000009471 action Effects 0.000 description 2
- 238000013459 approach Methods 0.000 description 2
- 206010003119 arrhythmia Diseases 0.000 description 2
- 230000006793 arrhythmia Effects 0.000 description 2
- 230000005540 biological transmission Effects 0.000 description 2
- 230000000747 cardiac effect Effects 0.000 description 2
- 201000010099 disease Diseases 0.000 description 2
- 238000006073 displacement reaction Methods 0.000 description 2
- 238000013399 early diagnosis Methods 0.000 description 2
- 239000000284 extract Substances 0.000 description 2
- 238000005259 measurement Methods 0.000 description 2
- 208000010125 myocardial infarction Diseases 0.000 description 2
- 238000005070 sampling Methods 0.000 description 2
- 238000012935 Averaging Methods 0.000 description 1
- 206010042434 Sudden death Diseases 0.000 description 1
- 238000013461 design Methods 0.000 description 1
- 208000035475 disorder Diseases 0.000 description 1
- 230000008030 elimination Effects 0.000 description 1
- 238000003379 elimination reaction Methods 0.000 description 1
- 238000000605 extraction Methods 0.000 description 1
- 230000000302 ischemic effect Effects 0.000 description 1
- 238000012544 monitoring process Methods 0.000 description 1
- 230000003449 preventive effect Effects 0.000 description 1
- 230000003252 repetitive effect Effects 0.000 description 1
- 230000004044 response Effects 0.000 description 1
- 238000012360 testing method Methods 0.000 description 1
- 230000001052 transient effect Effects 0.000 description 1
- 206010047302 ventricular tachycardia Diseases 0.000 description 1
- 230000000007 visual effect Effects 0.000 description 1
Images



Classifications
-
- A—HUMAN NECESSITIES
- A61—MEDICAL OR VETERINARY SCIENCE; HYGIENE
- A61B—DIAGNOSIS; SURGERY; IDENTIFICATION
- A61B5/00—Measuring for diagnostic purposes; Identification of persons
- A61B5/24—Detecting, measuring or recording bioelectric or biomagnetic signals of the body or parts thereof
- A61B5/316—Modalities, i.e. specific diagnostic methods
- A61B5/318—Heart-related electrical modalities, e.g. electrocardiography [ECG]
- A61B5/346—Analysis of electrocardiograms
- A61B5/349—Detecting specific parameters of the electrocardiograph cycle
- A61B5/366—Detecting abnormal QRS complex, e.g. widening
-
- A—HUMAN NECESSITIES
- A61—MEDICAL OR VETERINARY SCIENCE; HYGIENE
- A61B—DIAGNOSIS; SURGERY; IDENTIFICATION
- A61B5/00—Measuring for diagnostic purposes; Identification of persons
- A61B5/02—Detecting, measuring or recording for evaluating the cardiovascular system, e.g. pulse, heart rate, blood pressure or blood flow
- A61B5/024—Measuring pulse rate or heart rate
- A61B5/02405—Determining heart rate variability
-
- A—HUMAN NECESSITIES
- A61—MEDICAL OR VETERINARY SCIENCE; HYGIENE
- A61B—DIAGNOSIS; SURGERY; IDENTIFICATION
- A61B5/00—Measuring for diagnostic purposes; Identification of persons
- A61B5/24—Detecting, measuring or recording bioelectric or biomagnetic signals of the body or parts thereof
- A61B5/316—Modalities, i.e. specific diagnostic methods
- A61B5/318—Heart-related electrical modalities, e.g. electrocardiography [ECG]
- A61B5/346—Analysis of electrocardiograms
- A61B5/349—Detecting specific parameters of the electrocardiograph cycle
- A61B5/352—Detecting R peaks, e.g. for synchronising diagnostic apparatus; Estimating R-R interval
-
- A—HUMAN NECESSITIES
- A61—MEDICAL OR VETERINARY SCIENCE; HYGIENE
- A61B—DIAGNOSIS; SURGERY; IDENTIFICATION
- A61B5/00—Measuring for diagnostic purposes; Identification of persons
- A61B5/02—Detecting, measuring or recording for evaluating the cardiovascular system, e.g. pulse, heart rate, blood pressure or blood flow
- A61B5/024—Measuring pulse rate or heart rate
- A61B5/0245—Measuring pulse rate or heart rate by using sensing means generating electric signals, i.e. ECG signals
Definitions
- the present invention relates to a method and apparatus for diagnosis and a diagnostic program, and more particularly, to a method and apparatus for diagnosis suitable for diagnosing symptoms of patients through electrocardiogram analysis.
- a doctor reads the record by the naked eye and makes a diagnosis after the recording is finished, or a doctor extracts short-time data that he/she regards as abnormal from the recorded data and subjects the data to an automatic analysis, etc. For this reason, there is a large time delay after measurement until the diagnosis result is obtained, and the prior arts are insufficient in prognosticating changes in a symptom or imminent danger. Furthermore, since the prior arts involve judgments by the naked eye of the doctor, there is a problem that oversight is likely to occur.
- the present invention provides a diagnostic method for performing diagnosis and a diagnostic apparatus to realize the diagnostic method, including the steps of incorporating electrocardiogram data measured by an electrocardiograph apparatus for a given first period as distribution calculation data, detecting characteristic quantities repeatedly appearing in the electrocardiogram data from the distribution calculation data to generate time-series data, generating a difference set whose elements consist of absolute values of differences between neighboring data pieces of this time-series data, generating m subsets each of which consists of randomly collected n elements from this difference set (n, m: positive integers), calculating each average value of the elements of the m each subset to generate an average value set as a set having the ordinary distribution of the difference set, and calculating average value and standard deviation of the average value set by assuming that the average value set has normal distribution, and incorporating the electrocardiogram data measured by the electrocardiograph apparatus for a second period which is shorter than the first period as diagnostic data, detecting characteristic quantities repeatedly appearing in the electrocardiogram data from the diagnostic data to generate time
- the present invention also provides a diagnostic method for performing diagnosis and a diagnostic apparatus to realize the diagnostic method, including the steps of incorporating electrocardiogram data measured by an electrocardiograph apparatus for a given first period as distribution calculation data, detecting characteristic quantities repeatedly appearing in the electrocardiogram data from the distribution calculation data to generate time-series data, generating a difference set whose elements consist of absolute values of differences between neighboring data pieces of this time-series data, generating m subsets each of which consists of randomly collected n elements from this difference set (n, m: positive integers), calculating each average value of the elements of the m each subset to generate an average value set as a set having the ordinary distribution of the difference set, and calculating average value and standard deviation of the average value set by assuming that the average value set has normal distribution, repeatedly setting a second period which is shorter than the first period with the passage of time, incorporating the electrocardiogram data measured by the electrocardiograph apparatus as diagnostic data for every second period, detecting characteristic quantities repeatedly appearing in the electrocardiogram data from each diagnostic data to generate
- the present invention also provides a diagnostic method for performing diagnosis and a diagnostic apparatus to realize the diagnostic method, including the steps of incorporating electrocardiogram data measured by an electrocardiograph apparatus for a given first period as distribution calculation data, detecting characteristic quantities repeatedly appearing in the electrocardiogram data from the distribution calculation data to generate time-series data, generating a difference set whose elements consist of absolute values of differences between neighboring data pieces of this time-series data, generating m subsets each of which consists of randomly collected n elements from this difference set (n, m: positive integers), calculating each average value of the elements of the m each subset to generate an average value set as a set having the ordinary distribution of the difference set, and calculating average value and standard deviation of the average value set by assuming that the average value set has normal distribution, repeatedly setting a second period which is shorter than the first period with the passage of time, incorporating the electrocardiogram data measured by the electrocardiograph apparatus as diagnostic data for every second period, detecting characteristic quantities repeatedly appearing in the electrocardiogram data from each diagnostic data to generate
- the present invention also provides the above-described diagnostic method and diagnostic apparatus characterized in that calculations of an average value and standard deviation of the ordinary distribution from the distribution calculation data are repeated by periodically changing the period of incorporating the distribution calculation data and the average value and the standard deviation of the ordinally distribution are periodically updated.
- the present invention also provides the above-described diagnostic method and diagnostic apparatus characterized in that electrocardiogram data for ordinally distribution calculation and diagnosis is incorporated via a network.
- the present invention also provides a diagnostic apparatus equipped with a center apparatus and one or a plurality of measuring terminal apparatuses connected to this center apparatus via a network, each of the measuring terminal apparatuses including an electrocardiograph apparatus, parameter setting means for setting at least a first period or a second period which is shorter than this first period a positive integer parameter n, a positive integer parameter m and a diagnostic coefficient, ordinally distribution calculating means for incorporating electrocardiogram data measured by the electrocardiograph apparatus as distribution calculation data for the first period set in the parameter setting means, detecting characteristic quantities repeatedly appearing in the electrocardiogram from the distribution calculation data to generate time-series data, generating a difference set whose elements consist of absolute values of differences between neighboring data pieces of this time-series data, generating as many subsets as parameter m set in the parameter setting means each of which consists of n elements randomly collected from the difference set where n is the parameter set in the parameter setting means, calculating each average value of the elements of the each subset to generate an average value set as a set having the
- the present invention also provides a diagnostic program for allowing a computer to execute:
- the present invention also provides a diagnostic program for allowing a computer to execute:
- the present invention also provides a diagnostic program for allowing a computer to execute:
- the present invention provides the above-described diagnostic program characterized in that the first step includes the steps of repeating calculations of an average value and standard deviation of the ordinary distribution using the distribution calculation data by periodically changing the period of incorporating the distribution calculation data, and periodically updating the average value and the standard deviation of the ordinary distribution.
- the present invention also provides a diagnostic method for performing diagnosis of an object including the steps of:
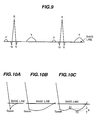
- FIG. 9 is a schematic view of a basic electrocardiogram waveform in which P, Q, R, S and T waves are observed as waves expressing states of various apparatuses of a heart.
- characteristic quantities of such waveforms are often used for an electrocardiogram analysis. Examples of these characteristic quantities include an R-R interval indicating a distance between peaks of neighboring R waves (heart beat interval), an ST falling apparatus area indicating an area of the S wave, an evaluation value W indicating a characteristic of the waveform of this ST falling apparatus, or a QS interval indicating the width from the start of the Q wave to the end of the S wave, etc.
- Each of the characteristic quantities of the electrocardiogram waveform illustrated above construct time-series data that takes one value per one heart beat.
- This time-series data itself generally has different values, which differs, from one patient to another.
- the average R-R interval may vary from one person to another; for example, it may be 1 sec (heart rate per minute of 60) for one person, while it may be 6/7 sec (heart rate per minute of 70) for another person.
- the R-R interval per beat is not completely constant but varying minutely.
- the average value of R-R interval as well as its minute variation may change.
- the present invention is intended to detect changes in a symptom by detecting changes in such characteristic quantities.
- the present invention collects digitalized electrocardiogram data of a target patient for a long period of time, for example, for several days. This collection period is denoted by INT1, and the collected electrocardiogram data between the period INT1 is expressed as a set A.
- INT1 digitalized electrocardiogram data of a target patient for a long period of time, for example, for several days.
- This collection period is denoted by INT1
- the collected electrocardiogram data between the period INT1 is expressed as a set A.
- a signal from an electrocardiogram monitor is sampled every 1 ms and each sampled value is digitalized into a code of 12 bits.
- the number of data Na (number of samples) per 1 sec is 1000
- This means the number of data Na is 86.4 millions and the amount of information Ma is approximately 130 MB per one day. Therefore, the amount of information Ma of the set A is about several hundreds of MB when
- and this difference set is expressed as C ⁇ y j ⁇ , j 1, 2, ⁇ .
- the number of data Nc of this set is 100,800 per day when the heart rate is 70/min and the amount of information Mc is approximately 1.5 MB per day assuming that a difference data y j has 12 bits.
- the distribution of the set C(d.h. distribution of the elements of the set C) is calculated, assuming this is the ordinary distribution representing ordinary state of a patient.
- the distribution ND ( ⁇ , ⁇ ) of the average value e ⁇ calculated as shown above can be considered to express an average state of the cardiac activity of the patient if the electrocardiogram data set A is large enough and the data size n of subset C ⁇ and the number of subsets m are sufficiently large. Therefore the distribution ND is regarded as the ordinary distribution mentioned above, an can be used as the reference for detecting variations of the cardiac activity. By the way, it is desirable to calculate and update this ordinary distribution for the period INT1 until that time point, such as once every few days or once a week and the length of the period INT1 at every update time point can be changed.
- Such a change can be detected by calculating the set BT k of characteristic quantities from the electrocardiogram data AT of the period INT2, calculating the difference set CT k thereof, and then calculating average value deviation Z k through calculations of (Formula 6) and (Formula 7) and comparing this with the standard deviation ⁇ of the ordinary distribution, and this series of calculations can be executed in an extremely short time. Therefore, if the above detection is carried out, for example, every one minute, it is possible to quickly detect a change of symptom of a patient every one minute.
- the above-described diagnostic method using electrocardiogram data is intended to make a diagnosis by expressing a ordinary state of the patient with a ordinary (normal) distribution calculated from electrocardiogram data acquired over a long period INT1 and evaluating at every inspection time point the difference between the average value ⁇ k of the difference set CT k calculated from the electrocardiogram data of the relatively shorter period INT2 or average values ⁇ k1 , ⁇ k2 ⁇ of a plurality of difference sets CT k1 , CT k2 , ⁇ and the average value ⁇ of the ordinary distribution. Furthermore, since calculation processing at every inspection time point can be performed virtually in real time, it is possible to monitor the heart condition of the patient all the time and automatically detect any abnormality at an early stage.
- this diagnostic result allows the doctor, etc. to clearly comprehend the change in the heart condition even if the change is transient and carry out appropriate examinations and cure in consideration of the heart condition of the relevant patient. This is useful to make an early diagnosis, give advice to the patient or recommend preventive actions based on the diagnostic results for not only patients who are considered to already have cardiac disease but also people who are considered healthy.
- the inspection data acquisition period INT2 is a period of time during which a characteristic quantity of, for example, 1000 can be obtained (when the heart rate is 60, INT2 is approximately 17 minutes), even if there is some error in the detection of the characteristic quantity, the influence of the error on the average value ⁇ k calculated is extremely small and the influence on the diagnostic result is likewise small unless the probability of the error detection is significantly high. The same applies to the ordinary distribution calculated by statistical handling of a larger set.
- the present invention can provide a diagnostic method applicable to an environment in which there is a certain degree of noise.
- the above-described analysis method is likewise applicable to a diagnosis of structures, etc. that produce vibration accompanied by complicated swinging.
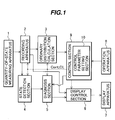
- FIG. 1 is a block diagram showing a configuration example of a diagnostic apparatus according to the present invention, which is constructed of a quantity of state measuring apparatus 1 that measures quantities of state of an object consecutively, digitalizes and outputs the quantities of state, a recording apparatus 2 capable of recording the quantities of state from the apparatus 1 for a period of at least INT1, an ordinary distribution calculation apparatus 3 that calculates an average value ⁇ and standard deviation ⁇ of the aforementioned ordinary distribution ND from the quantities of state stored in the recording apparatus 2, a state detection apparatus 4 that calculates a differential set CT k and average value ⁇ k of the characteristic quantities, a diagnosis apparatus 5 that makes a diagnosis of the state at that time using the average value ⁇ k calculated by the detection apparatus 4 and parameters ⁇ and ⁇ of the ordinary distribution ND, a display control apparatus 6 that controls displays of the diagnostic result of the diagnosis apparatus 5 and the quantities of state data on the recording apparatus 2, etc., a display apparatus 7, an operation apparatus
- the quantity-of-state measuring apparatus 1 when a quantity of state is electrocardiogram data, can be an electrocardiograph apparatus which can provide with A/D-converted digital quantities of analog electrocardiogram data measured by the apparatus consecutively for a long period of time.
- the quantity-of-state measuring apparatus 1 when a quantity of state is a displacement at a measuring point of a mechanical structure, the quantity-of-state measuring apparatus 1 is a vibration gauge which measures the displacement and outputs it as digital data.
- the measuring apparatus 1 incorporates a clock generator supplying clock signals for data sampling and coding.
- All of the recording apparatus 2, normal distribution calculation apparatus 3, state detection apparatus 4, display control apparatus 6 and control apparatus 9 are devices that carry out digital processing and it is possible to construct each of these devices with a DSP, etc. or with a general-purpose processing apparatus such as a personal computer executing a suitable program.
- Control apparatus 9 is provided with a control parameter setting apparatus 10 to control operations of various apparatuses.
- This control parameter setting apparatus 10 allows the operation apparatus 8 to set an ordinary distribution ND calculation cycle T1, data acquisition period INT1 used for one calculation of the ordinary distribution, number m of subsets C ⁇ extracted from characteristic quantity difference set C ⁇ y j ⁇ , size n of each subset, electrocardiogram data acquisition cycle T2 and acquisition period INT2 by the state detection apparatus 4, diagnostic coefficient for determining one or a plurality of diagnostic levels as references to display alarms, etc.
- the control apparatus 9 has a function of generating and supplying a clock CL necessary to operate various apparatuses.
- the control apparatus 9 not only gives parameters set in the control parameter setting apparatus 10 to various apparatuses but also controls operations of various apparatuses according to a start instruction from the operation apparatus 8 based on a control signal "cont" and the clock CL.
- the recording apparatus 2 needs to be controlled so that a data write from the quantity of state measuring apparatus 1 does not collide with a data read from the ordinary distribution calculation section 3, quantity of state detection section 4 and display control section 6.
- the sampling clock of the quantity of state measuring apparatus 1 and the clock CL from the control section 9 are usually independent of each other and may have quite different clock frequencies.
- the recording apparatus 2 is constructed of a hard disk apparatus and its control circuit, the amount of information to be read or written is sufficiently small considering the read/write speed of the recording apparatus, and therefore it is easy to avoid the above-described collision by providing a buffer for the control circuit incorporated in the recording apparatus 2 to control the read/write.
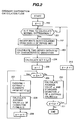
- FIG. 2 is a flow chart showing the processing in the ordinary distribution calculating section 3.
- a control variable ⁇ is set to 1 (step 200)
- This calculation time corresponds to the time at which a first start instruction is given from the operation apparatus 8 or when the calculation cycle T1 set in the control parameter setting section 10 has passed from the previous calculation time.
- the electrocardiogram data (set A) for the period INT1 set in the control parameter setting section 10 before that time point is incorporated from the recording apparatus 2 (step 202), and the time-series data B ⁇ x j ⁇ of the characteristic quantities as analysis target is calculated from this set A (step 203).
- the characteristic quantity is R-R interval
- this calculation processing consists of detecting a peak points of R waves and calculating their intervals. Such calculation for any characteristic quantity of electrocardiogram is performed easily by using a known method.
- (Formula 1) and (Formula 2), etc. can also be used, but details thereof will be omitted here.
- the number of parameters m set in the control parameter setting section 10 is compared with the above-described control variable ⁇ and if ⁇ m (when the comparison result in step 206 is YES), n elements are randomly extracted from the set C ⁇ y i ⁇ to make a subset C ⁇ (y ⁇ 1 , y ⁇ 2 , ⁇ y ⁇ n ) (step 207) and an average value e ⁇ of the n elements is calculated according to (Formula 4) (step 208). Then, the control variable ⁇ is incremented by +1 (step 209) and the process moves back to step 206.
- control variable ⁇ is smaller than the parameter Q1 set in the control parameter setting section 10 (when the comparison result in step 211 is Yes)
- ⁇ is incremented by +1 (step 212) and the process moves back to step 201, but if ⁇ Q1 (when the comparison result in step 211 is NO), the process ends here.
- the control variable Q1 is set to 1, this means that only one time calculation of the ordinary distribution is specified from the operation apparatus 8, and this is effective for a system check or preliminary comprehension of the condition of the patient by changing parameters m, n, INT1, etc.
- the function strand ( ⁇ ) provided in the C programming language or the logic equivalent thereto for example, is available. If each pseudo-random number series between 1 to NC (number of data pieces of differential set C ⁇ y j ⁇ ) is generated by: [Formula 8] strand (time (null)) where the CPU clock that time is used as an argument time (null), and if the n elements y j s having suffix j which belongs to the pseudo-random number series are extracted from the set C ⁇ y j ⁇ , there is almost no correlation in the way of selection of elements between any two subsets C ⁇ and C ⁇ ( ⁇ ) generated at different CPU time.
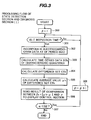
- FIG. 3 is a flow chart showing the processing in the state detection section 4 and diagnosis section 5.
- a control variable ⁇ is set to 1 (step 300)
- this time also corresponds to the time at which the first start instruction is given from the operation apparatus 8 or the time at which the calculation cycle T2 set in the control parameter setting section 10 has passed after the previous detection.
- a diagnosis is made for every one difference set CT k , but when a diagnosis is made by calculating an average value for a plurality of difference sets and detecting the number of those average values that exceed a predetermined number of times, the processing in the flow chart shown in FIG. 4 is carried out.
- three control variables ⁇ , ⁇ , ⁇ 1 and ⁇ 0 counter variables ⁇ 1 to ⁇ ⁇ 0 are used.
- the control variables ⁇ , ⁇ are set to 1 and all the counter variables ⁇ 1 to ⁇ ⁇ 0 are initialized to 0 (steps 400 and 401).
- the electrocardiogram data for the period INT2 is incorporated, the time-series data BT k ⁇ of the characteristic quantity is calculated, then a subset CT k ⁇ is calculated from the time-series data BT k ⁇ and an average ⁇ k ⁇ is calculated (steps 402 to 406).
- the processing in these steps 402 to 406 is the same as the processing in steps 301 to 305 in FIG. 3, but since different data for the period INT2 at a different inspection time is treated every time the control variable ⁇ changes, the sets BT k ⁇ , CT k ⁇ and average value ⁇ k ⁇ differ from one value of control variable ⁇ to another and a subscript ⁇ is affixed to indicate it.
- is calculated (step 407). Then, for a comparison of Z k ⁇ with each of the diagnostic levels L1 to L ⁇ 0 (product of the set diagnostic coefficient and standard deviation), the processes of setting the control variable ⁇ 1 to 1 (step 408) and incrementing the counter variable ⁇ ⁇ 1 by +1 when the deviation Z k ⁇ is greater than the diagnostic level L ⁇ 1 are carried out for ⁇ 1 1 to ⁇ 0 (steps 409 to 412). When these processes are completed (when the comparison result in step 411 is Yes), it is checked whether the control variable ⁇ has exceeded the number r of the differential sets as the inspection targets (step 413).
- control variable ⁇ is incremented by +1 (step 414), the process returns to step 402, and if the control variable ⁇ has exceeded the number r, a diagnosis is made according to the values of the respective counter variables ⁇ 1 to ⁇ ⁇ 0 , and the result is sent to the display control section 6 (step 415). Then, the overall process is repeated until the control variable ⁇ exceeds the parameter Q2 (steps 416 and 417).
- the sum of elements on the overlapped section of adjacent two periods is available to calculate average values in step 305 or step 406 for the two corresponding different sets commonly, therefore when the overlapped section is large, use of the common sum can drastically improve the efficiency of the average value calculation processing.
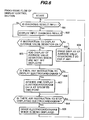
- step 602 the processing of the display control section 6 will be explained using the flow chart in FIG. 6.
- the input result is displayed (step 602). Seceding processes after step 602 are carried out to make it possible to comprehend the condition of the patient self-explanatorily. In either case of FIG. 3 or FIG.
- the difference set CT k is calculated at, for example, every 1-minute interval and an average value deviation Z k which is a difference between the average value of the elements of the set CT k and the average value of the ordinary distribution is calculated, and therefore by incorporating these into a buffer in the display control section, displaying them along the time axis and displaying the electrocardiogram data itself as required, it is possible to observe not only the diagnostic result but also a time variation of the state of the patient.
- the average value deviation Z k which is a difference between the average value of the elements of the set CT k and the average value of the ordinary distribution is calculated, and therefore by incorporating these into a buffer in the display control section, displaying them along the time axis and displaying the electrocardiogram data itself as required, it is possible to observe not only the diagnostic result but also a time variation of the state of the patient.
- the average value deviations are displayed on the display apparatus 7 so far, the displayed data are erased (step 604) and the process returns to step 601.
- the average value deviations which are yet not displayed are added to the displayed data.
- the average value deviations are shown on the vertical axis and a representative time indicating the period during which the average value deviation is calculated (e.g., inspection time in FIG. 3 and FIG. 4) are shown on the horizontal axis, and standard deviations of the ordinary distribution ⁇ , or 2 ⁇ , ⁇ or the set decision levels, etc. on the vertical axis together.
- a new value of average value deviation is input every inspection cycle T2, for example, every one minute, if there is still an display area on the horizontal axis, the new value is added there and if there is no display area, the screen is scrolled so that the oldest data is removed and a new value is added. Furthermore, the display can be updated not only one data piece at a time but also a block of data pieces together. Such display of average value deviation allows the doctor to observe the condition of the patient in more detail.
- any apparent abnormality is appreciated on the display data in step 605 by the doctor, and if the abnormal point on the screen is pointed by the mouse, it is interpreted as an instruction to display the electrocardiogram (step 606).
- this instruction is given, the electrocardiogram data before and after the abnormal point are extracted from the recording apparatus 2 and displayed on the screen (step 607).
- This display time width may be preset in the control parameter setting section 10 or the display time width or time zone may be input when the screen is clicked.
- an instruction for stopping the display of the electrocardiogram is given by clicking the operation apparatus 8 or a command box set on the screen (when the decision result in step 608 is Yes)
- the electrocardiogram which is being displayed is erased (step 609).
- This electrocardiogram display function allows the doctor to know the condition of the patient in further detail.
- the use of the diagnostic apparatus of the present invention shown in FIG. 1 should make it possible to monitor changes in characteristic quantities appearing in an electrocardiogram of the patient all the time, to detect abnormalities at an early stage automatically and to take necessary actions quickly to the changes in the condition of the disease.
- waveform analyses of an R wave, P wave, etc. cannot always be automatically performed with 100% accuracy and misjudges sometimes occur in individual waveform analyses though the frequency of misjudges is sufficiently small.
- the apparatus of the present invention makes a diagnosis only by using statistical averaging about characteristic quantities, infrequent misjudges in waveform analyses will not affect the result, and the present invention makes it possible to make a diagnosis with much higher accuracy than the conventional arts which use short-time analyses.
- the apparatus in FIG. 1 is shown as an apparatus in which all components are put together as a single apparatus, but an electrocardiograph is used for measurement attached to the body of the patient all the time, while the display apparatus 7 and operation apparatus 8 need to be installed in places easily accessible to doctors, nurses or laboratory technicians, etc. Furthermore, since the ordinally distribution calculation section 3 need not always operate, installing the ordinary distribution calculation section 3 near each patient is not efficient, and the ordinary distribution calculation section 3 may be designed to be a program on a personal computer commonly available to a plurality of patients. The situation is similar for diagnoses of mechanical structures, etc.
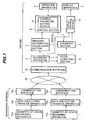
- FIG. 7 shows a system configuration example when these points are taken into consideration.
- Each measuring terminal of the system is provided with quantity of state measuring apparatuses 71a or 71b ⁇ , communication interface 73a or 73b ⁇ and data collection/transfer apparatus 72a or 72b ⁇ .
- the collection/transfer apparatus 72a or 72b collects measured values, applies processing such as noise elimination to these measured values if necessary, combine them into transmission data and send it to the communication interface 73a or 73b ⁇ .
- the communication interface 73a or 73b send data to the center via a network 70.
- the quantity of state measuring apparatus and corresponding data collection/transfer apparatus may be connected via cables, but when a quantity of state measuring apparatus is always attached to patients as in the case of an electrocardiograph apparatus, they may be connected using a radio communication path.
- the communication interfaces 73a, 73b, ⁇ interfaces connectable to the network 70 such as PHS terminals or modems for personal computers are used. In view of communication costs and the amount of data transferred, it is desirable to use stable and economical interfaces.
- the data collection/transfer apparatuses 72a, 72b, ⁇ for example, personal computers can be used and when the quantity of state measuring apparatuses output analog measured values, it is also possible to design the data collection/transfer apparatuses in such a way as to digitize the analog values and incorporate the digital data.
- the communication interfaces 73a, 73b, ⁇ and the network 70 have sufficient transmission capacities and at the same time communication fees depend on connect time, it is possible to combine collected data into files at certain intervals and transfer the files in burst transfer mode and thereby reduce communication costs.
- the network 70 a PHS channel network, public telephone network or the Internet can be used, or in the case of a system in a hospital, the LAN in the hospital may be used.
- a recording apparatus 2 a ordinary distribution calculation section 3, a quantity of state detection section 4, a diagnosis section 5, a display control section 6, a display apparatus 7, an operation apparatus 8 and a control section 9 have functions similar to those in FIG. 1 and are installed in a center where doctors stay full time and connected to the network 70 via a communication interface 74.
- a control parameter setting section 10 performs settings such as timing for various measuring terminals.
- the ordinary distribution calculation section 3, the quantity of state detection section 4 and the diagnosis section 5, etc. need to be able to handle data from a plurality of measuring terminals.
- Each of these components can be constructed by a single unit if it allows time-sharing processing, but if time-sharing processing is not possible, each component may be constructed of a plurality of units and processing may be distributed.
- the communication interface 74 needs to have a function of receiving all data from a plurality of measuring terminals. This function can be realized by providing a plurality of addresses corresponding to the network 70, or the function of sending a busy signal to let the communication partner wait, with providing an appropriate buffer.
- the configuration shown in FIG. 7 allows an accurate, early diagnosis of the condition of the patient staying at home who has a cardiac disease.
- FIG. 7 assumes that the digitalized quantity of state data itself is sent to the center via a network. This is preferable when it is desirable to observe the quantity of state data (hereinafter referred to as "electrocardiogram data") itself on the center side all the time. However, when full-time observation of the electrocardiogram data itself or its full-time application to other purposes is not performed on the center side, it is possible to prevent the electrocardiogram data from being sent all the time so as to alleviate the load of communications.
- FIG. 8 shows another configuration of the diagnostic apparatus of the present invention with these points taken into consideration. In this configuration, a measuring terminal 81 is provided with the functions of a quantity of state measuring apparatus 811, recording apparatus 812, ordinary distribution calculation section 813, state detection section 814 and diagnosis section 815. Other measuring terminals also have the same configuration.
- the doctor, etc. uses an operation apparatus 801 of the center 80 to set control parameters of the measuring terminals 81, 82, ⁇ in a parameter setting section 808 of a control section 802. Then, through the control of the control section 802, the parameters of the measuring terminal 81, for example, are set in a control parameter setting section 818 of the control section 816 via a communication interface 803, network 83, communication interface 817. The same applied to the other measuring terminals. In each measuring terminal, ordinary distribution is calculated periodically, characteristic quantities are detected, and diagnosis according to these set parameters is made under the control of the control section 816, and the diagnostic result is sent to the center 80 via the network.
- the a diagnosis may be made every time one diagnostic data AT is processed as shown in FIG. 3.
- the diagnosis can also be made using a plurality of diagnostic data pieces as shown in FIG. 4.
- the data indicating the diagnostic result sent via the network is stored in a buffer 804 temporarily, read by a display control section 806 as appropriate and displayed on a display apparatus 807.
- the display apparatus in this case can be a display screen, a lamp which shoots errors or alarms or a speaker/buzzer, etc. which outputs an alarm sound.
- the diagnostic result data is saved in a recording apparatus 805 of the center 80 so that it may be traced later.
- the doctor, etc. can input a command into the operation apparatus 801 so that the measuring terminal sends the electrocardiogram data itself or time-series data ⁇ Z k ⁇ of an average value deviation detected by the state detection section to the center.
- this command is sent through the network 83 to the control section 816 of the measuring terminal 81, then one or both of the electrocardiogram data from the recording apparatus 812 and time-series data ⁇ Z k ⁇ of an average value deviation from the state detection section 814 are extracted for a specified period under the control of the control section 816, sent through the communication interface 817, network 83, communication interface 803 and buffer 804 to the center 80, and stored into the recording apparatus 805.
- an average value ⁇ and standard deviation ⁇ of the ordinary distribution calculated by the ordinary distribution calculation section 813 are also sent to the center 80 simultaneously and stored in the recording apparatus 805.
- This display is a time-series display of the electrocardiogram data or average value deviation explained in steps 607 and 605 in FIG. 6. This allows the doctor, etc. to directly observe desired data and know a more detailed condition of the patient.
- the electrocardiogram data is sent to the center only when some abnormality occurs or when the doctor, etc. inputs a command, which allows the amount of information sent via a network to be reduced drastically.
- each measuring terminal calculates a ordinary distribution, detects the state or carries out diagnostic processing, and therefore there is no need to worry about the data processing capacity of the center even if the number of measuring terminals increases.
- the present invention calculates a ordinary distribution indicating a variation in a quantity of state of an object, for example, a characteristic quantity of an electrocardiogram from data measured for many hours as a normal distribution, and compares, during a diagnosis, a difference between an average value of variations in an appropriate quantity of state, for example, a characteristic quantity of the electrocardiogram and the average value of the ordinary distribution with the standard deviation of the ordinary distribution automatically in a short time, and then makes a diagnosis, and can thereby obtain the following effects:
- a diagnostic method for performing diagnosis comprises the steps of incorporating electrocardiogram data measured by an electrocardiograph apparatus as for a given first period distribution calculation data, detecting characteristic quantities repeatedly appearing in the electrocardiogram data from said distribution calculation data to generate time-series data, generating a difference set whose elements consist of absolute values of differences between neighboring data pieces of said time-series data, generating m subsets each of which consists of randomly collected n elements from said difference set (n, m: positive integers), calculating each average value of the elements of each subset to generate an average value set as a set having the ordinary distribution of said difference set, and calculating average value and standard deviation of said average value set by assuming that said average value set has normal distribution, and incorporating the electrocardiogram data measured by the electrocardiograph apparatus for a second period which is shorter than said first period as diagnostic data, detecting characteristic quantities repeatedly appearing in the electrocardiogram data from said diagnostic data to generate time-series data, generating a difference set whose elements consist of absolute values of differences between neighboring data pieces of
- Another diagnostic method for performing diagnosis comprises the steps of incorporating electrocardiogram data measured by an electrocardiograph apparatus as for a given first period distribution calculation data, detecting characteristic quantities repeatedly appearing in the electrocardiogram data from said distribution calculation data to generate time-series data, generating a difference set whose elements consist of absolute values of differences between neighboring data pieces of said time-series data, generating m subsets each of which consists of randomly collected n elements from said difference set (n, m: positive integers), calculating each average value of the elements of each subset to generate an average value set as a set having the ordinary distribution of said difference set, and calculating average value and standard deviation of said average value set by assuming that said average value set has normal distribution repeatedly setting a second period which is shorter than said first period with the passage of time, incorporating the electrocardiogram data measured by the electrocardiograph apparatus as diagnostic data for every second period, detecting characteristic quantities repeatedly appearing in the electrocardiogram data from each diagnostic data for to generate time-series data respectively, and generating difference sets each of which consists
- Another diagnostic method for performing diagnosis comprises the steps of incorporating electrocardiogram data measured by an electrocardiograph apparatus as for a given first period distribution calculation data, detecting characteristic quantities repeatedly appearing in the electrocardiogram data from said distribution calculation data to generate time-series data, generating a difference set whose elements consist of absolute values of differences between neighboring data pieces of said time-series data, generating m subsets each of which consists of randomly collected n elements from said difference set (n, m: positive integers), calculating each average value of the elements of each subset to generate an average value set as a set having the ordinary distribution of said difference set, and calculating average value and standard deviation of said average value set by assuming that said average value set has normal distribution, repeatedly setting a second period which is shorter than said first period with the passage of time, incorporating the electrocardiogram data measured by the electrocardiograph apparatus as diagnostic data for every second period, detecting characteristic quantities repeatedly appearing in the electrocardiogram data from each diagnostic data to generate time-series data respectively, and generating difference sets each of which consists
- Another diagnostic method for performing diagnosis of an object comprises the steps of incorporating measured quantity of state of said object for a given first period as distribution calculation data, detecting characteristic quantities repeatedly appearing in said quantity of state from said distribution calculation data to generate time-series data, generating a difference set whose elements consist of absolute values of differences between neighboring data pieces of said time-series data, generating m subsets each of which consists of randomly collected n elements from said difference set (n, m: positive integers), calculating each average value of the elements of each subset to generate an average value set as a set having the ordinary distribution of said difference set, and calculating average value and standard deviation of said average value set by assuming that said average value set has normal distribution; and incorporating measured quantity of state of said object for a second period which is shorter than said first period as diagnostic data, detecting characteristic quantities repeatedly appearing in said quantity of state from said diagnostic data to generate time-series data, generating a difference set whose elements consist of absolute values of differences between neighboring data pieces of said time-series data, and
Landscapes
- Health & Medical Sciences (AREA)
- Life Sciences & Earth Sciences (AREA)
- Cardiology (AREA)
- Biomedical Technology (AREA)
- Medical Informatics (AREA)
- Biophysics (AREA)
- Pathology (AREA)
- Engineering & Computer Science (AREA)
- Veterinary Medicine (AREA)
- Heart & Thoracic Surgery (AREA)
- Physics & Mathematics (AREA)
- Molecular Biology (AREA)
- Surgery (AREA)
- Animal Behavior & Ethology (AREA)
- General Health & Medical Sciences (AREA)
- Public Health (AREA)
- Physiology (AREA)
- Measurement And Recording Of Electrical Phenomena And Electrical Characteristics Of The Living Body (AREA)
- Measuring And Recording Apparatus For Diagnosis (AREA)
Applications Claiming Priority (4)
| Application Number | Priority Date | Filing Date | Title |
|---|---|---|---|
| JP2001397263A JP2003275187A (ja) | 2001-12-27 | 2001-12-27 | 診断方法とその装置、診断用プログラム |
| JP2001397263 | 2001-12-27 | ||
| JP2002066782A JP2003260035A (ja) | 2002-03-12 | 2002-03-12 | 診断方法とその装置、診断用プログラム |
| JP2002066782 | 2002-03-12 |
Publications (2)
| Publication Number | Publication Date |
|---|---|
| EP1323376A2 true EP1323376A2 (de) | 2003-07-02 |
| EP1323376A3 EP1323376A3 (de) | 2004-01-21 |
Family
ID=26625331
Family Applications (1)
| Application Number | Title | Priority Date | Filing Date |
|---|---|---|---|
| EP02027517A Withdrawn EP1323376A3 (de) | 2001-12-27 | 2002-12-06 | Verfahren und Vorrichtung zur EKG-Diagnose |
Country Status (4)
| Country | Link |
|---|---|
| US (1) | US20030125632A1 (de) |
| EP (1) | EP1323376A3 (de) |
| KR (1) | KR20030057357A (de) |
| CN (1) | CN1428130A (de) |
Cited By (1)
| Publication number | Priority date | Publication date | Assignee | Title |
|---|---|---|---|---|
| EP1790285A4 (de) * | 2004-05-20 | 2009-08-12 | Kiyoshi Takizawa | Diagnostisches verfahren und gerät dafür und diagnoseprogramm |
Families Citing this family (14)
| Publication number | Priority date | Publication date | Assignee | Title |
|---|---|---|---|---|
| US7702526B2 (en) * | 2002-01-24 | 2010-04-20 | George Mason Intellectual Properties, Inc. | Assessment of episodes of illness |
| US7779025B2 (en) * | 2004-12-13 | 2010-08-17 | The United States Of America As Represented By The Secretary Of The Army | System and method for evaluating data sets over a communications network |
| US8005694B1 (en) | 2005-12-28 | 2011-08-23 | United Services Automobile Association | Systems and methods of automating consideration of low cholesterol risk |
| US7945462B1 (en) | 2005-12-28 | 2011-05-17 | United Services Automobile Association (Usaa) | Systems and methods of automating reconsideration of cardiac risk |
| US8019628B1 (en) | 2005-12-28 | 2011-09-13 | United Services Automobile Association | Systems and methods of automating determination of hepatitis risk |
| US8024204B1 (en) | 2005-12-28 | 2011-09-20 | United Services Automobile Association | Systems and methods of automating determination of low body mass risk |
| US10468139B1 (en) | 2005-12-28 | 2019-11-05 | United Services Automobile Association | Systems and methods of automating consideration of low body mass risk |
| US20120157792A1 (en) * | 2010-12-17 | 2012-06-21 | Chia-Chi Chang | Cardiovascular health status evaluation system and method |
| US10387412B1 (en) * | 2015-02-12 | 2019-08-20 | Cloud & Stream Gears Llc | Incremental Z-score calculation for big data or streamed data using components |
| JP6620056B2 (ja) * | 2016-03-31 | 2019-12-11 | 三菱日立パワーシステムズ株式会社 | 機器の異常診断方法及び機器の異常診断装置 |
| CN110236524B (zh) * | 2019-06-17 | 2021-12-28 | 深圳市善行医疗科技有限公司 | 一种女性生理周期的监测方法、装置及终端 |
| CN111631683B (zh) * | 2020-05-07 | 2023-10-17 | 林伟 | 心电数据或脑电数据的处理及检测方法、存储介质 |
| US11523766B2 (en) * | 2020-06-25 | 2022-12-13 | Spacelabs Healthcare L.L.C. | Systems and methods of analyzing and displaying ambulatory ECG data |
| CN119184707B (zh) * | 2024-11-26 | 2025-05-09 | 中国人民解放军联勤保障部队第九八〇医院 | 一种伤病人员的体征数据采集方法、终端设备及存储介质 |
Citations (7)
| Publication number | Priority date | Publication date | Assignee | Title |
|---|---|---|---|---|
| JPH0654815A (ja) | 1992-08-07 | 1994-03-01 | Fukuda Denshi Co Ltd | Rr間隔スペクトル分析方法及びその装置 |
| JPH0856914A (ja) | 1994-08-25 | 1996-03-05 | Tochigi Nippon Denki Kk | 心電図解析方法 |
| US5560368A (en) | 1994-11-15 | 1996-10-01 | Berger; Ronald D. | Methodology for automated QT variability measurement |
| US5609158A (en) | 1995-05-01 | 1997-03-11 | Arrhythmia Research Technology, Inc. | Apparatus and method for predicting cardiac arrhythmia by detection of micropotentials and analysis of all ECG segments and intervals |
| JPH09201344A (ja) | 1996-01-29 | 1997-08-05 | Tochigi Nippon Denki Kk | 心電図解析装置 |
| US5755671A (en) | 1995-10-05 | 1998-05-26 | Massachusetts Institute Of Technology | Method and apparatus for assessing cardiovascular risk |
| JPH10225443A (ja) | 1997-02-13 | 1998-08-25 | Nippon Telegr & Teleph Corp <Ntt> | 心電図データ解析装置 |
Family Cites Families (2)
| Publication number | Priority date | Publication date | Assignee | Title |
|---|---|---|---|---|
| EP1007983A4 (de) * | 1997-03-13 | 2000-07-12 | Wavecrest Corp | Geräuschanalyse in repetitiven wellenformen |
| US6480733B1 (en) * | 1999-11-10 | 2002-11-12 | Pacesetter, Inc. | Method for monitoring heart failure |
-
2002
- 2002-12-03 CN CN02154882A patent/CN1428130A/zh active Pending
- 2002-12-06 EP EP02027517A patent/EP1323376A3/de not_active Withdrawn
- 2002-12-19 US US10/322,638 patent/US20030125632A1/en not_active Abandoned
- 2002-12-24 KR KR1020020083485A patent/KR20030057357A/ko not_active Ceased
Patent Citations (7)
| Publication number | Priority date | Publication date | Assignee | Title |
|---|---|---|---|---|
| JPH0654815A (ja) | 1992-08-07 | 1994-03-01 | Fukuda Denshi Co Ltd | Rr間隔スペクトル分析方法及びその装置 |
| JPH0856914A (ja) | 1994-08-25 | 1996-03-05 | Tochigi Nippon Denki Kk | 心電図解析方法 |
| US5560368A (en) | 1994-11-15 | 1996-10-01 | Berger; Ronald D. | Methodology for automated QT variability measurement |
| US5609158A (en) | 1995-05-01 | 1997-03-11 | Arrhythmia Research Technology, Inc. | Apparatus and method for predicting cardiac arrhythmia by detection of micropotentials and analysis of all ECG segments and intervals |
| US5755671A (en) | 1995-10-05 | 1998-05-26 | Massachusetts Institute Of Technology | Method and apparatus for assessing cardiovascular risk |
| JPH09201344A (ja) | 1996-01-29 | 1997-08-05 | Tochigi Nippon Denki Kk | 心電図解析装置 |
| JPH10225443A (ja) | 1997-02-13 | 1998-08-25 | Nippon Telegr & Teleph Corp <Ntt> | 心電図データ解析装置 |
Cited By (2)
| Publication number | Priority date | Publication date | Assignee | Title |
|---|---|---|---|---|
| EP1790285A4 (de) * | 2004-05-20 | 2009-08-12 | Kiyoshi Takizawa | Diagnostisches verfahren und gerät dafür und diagnoseprogramm |
| AU2005244694B2 (en) * | 2004-05-20 | 2011-01-27 | Kiyoshi Takizawa | Diagnostic method and its apparatus, and program for diagnosis |
Also Published As
| Publication number | Publication date |
|---|---|
| EP1323376A3 (de) | 2004-01-21 |
| US20030125632A1 (en) | 2003-07-03 |
| KR20030057357A (ko) | 2003-07-04 |
| CN1428130A (zh) | 2003-07-09 |
Similar Documents
| Publication | Publication Date | Title |
|---|---|---|
| EP1897028B1 (de) | Verfahren und vorrichtung zur unterscheidung zwischen klinisch signifikanten änderungen und artefakten in physiologischen patienteninformationen | |
| US12243624B2 (en) | Discovering novel features to use in machine learning techniques, such as machine learning techniques for diagnosing medical conditions | |
| EP1323376A2 (de) | Verfahren und Vorrichtung zur EKG-Diagnose | |
| CN102316792B (zh) | 用于自动获取和存档临床上有意义的体征的系统和方法 | |
| US20030135130A1 (en) | Method and apparatus for uterine contraction monitoring using linear predictive modeling of abdominal surface EMG signals | |
| CN101637384A (zh) | Ecg监视系统中信号质量指示和假警报减少的系统和方法 | |
| EP3225159A1 (de) | Mit einem kardiovaskulären gesundheitszustands überwachungsmodul koordinierter blutdruckmonitor | |
| WO2005041778A1 (en) | Analysis of auscultatory sounds using single value decomposition | |
| AU2023315782A1 (en) | Method and apparatus for detecting conditions from physiology data | |
| CN114639478A (zh) | 一种基于心脏瓣膜病的超声监测系统 | |
| CN114246569A (zh) | 检测早搏类型的方法、装置及介质 | |
| US8301230B2 (en) | Method for reducing baseline drift in a biological signal | |
| JP2003260035A (ja) | 診断方法とその装置、診断用プログラム | |
| JP4369955B2 (ja) | 診断システム、診断用プログラム | |
| JP2007526029A (ja) | データ拡散及び仮説検定によるicu患者の記録においてアーチファクトを検出する方法及びシステム | |
| JP2003275187A (ja) | 診断方法とその装置、診断用プログラム | |
| JP2020146140A (ja) | 心臓異常検出方法及び検出装置 | |
| CN119184707B (zh) | 一种伤病人员的体征数据采集方法、终端设备及存储介质 | |
| RU25991U1 (ru) | Устройство для диагностики состояния организма | |
| CN118266945A (zh) | 一种房颤异常检测系统、方法及装置 | |
| Kristiyana et al. | Design of heart rate monitoring system using mobile telecardiac and showing the patient’s position | |
| WO2023237758A1 (en) | Method for determining a neurological condition in a subject | |
| Palhalmi | The Effect of Expanded Measurement Uncertainty on the Outcome of Blood Pressure Measurement Validation Protocol Based on the ISO81060-2: 2018 Guideline-A Monte Carlo Simulation Approach | |
| Ghule et al. | Design of HMI for multipurpose electrocardiography using higher level language (Visual C++) | |
| JP2023120778A (ja) | 医用情報処理装置、医用情報処理方法、およびプログラム |
Legal Events
| Date | Code | Title | Description |
|---|---|---|---|
| PUAI | Public reference made under article 153(3) epc to a published international application that has entered the european phase |
Free format text: ORIGINAL CODE: 0009012 |
|
| AK | Designated contracting states |
Designated state(s): AT BE BG CH CY CZ DE DK EE ES FI FR GB GR IE IT LI LU MC NL PT SE SI SK TR |
|
| AX | Request for extension of the european patent |
Extension state: AL LT LV MK RO |
|
| PUAL | Search report despatched |
Free format text: ORIGINAL CODE: 0009013 |
|
| AK | Designated contracting states |
Kind code of ref document: A3 Designated state(s): AT BE BG CH CY CZ DE DK EE ES FI FR GB GR IE IT LI LU MC NL PT SE SI SK TR |
|
| AX | Request for extension of the european patent |
Extension state: AL LT LV MK RO |
|
| 17P | Request for examination filed |
Effective date: 20040512 |
|
| AKX | Designation fees paid |
Designated state(s): DE FR GB |
|
| STAA | Information on the status of an ep patent application or granted ep patent |
Free format text: STATUS: THE APPLICATION IS DEEMED TO BE WITHDRAWN |
|
| 18D | Application deemed to be withdrawn |
Effective date: 20050701 |