EP1336084B1 - Procede d'analyse de spectres d'echelles - Google Patents
Procede d'analyse de spectres d'echelles Download PDFInfo
- Publication number
- EP1336084B1 EP1336084B1 EP01993819A EP01993819A EP1336084B1 EP 1336084 B1 EP1336084 B1 EP 1336084B1 EP 01993819 A EP01993819 A EP 01993819A EP 01993819 A EP01993819 A EP 01993819A EP 1336084 B1 EP1336084 B1 EP 1336084B1
- Authority
- EP
- European Patent Office
- Prior art keywords
- detector
- function
- intensity
- echelle
- orders
- Prior art date
- Legal status (The legal status is an assumption and is not a legal conclusion. Google has not performed a legal analysis and makes no representation as to the accuracy of the status listed.)
- Expired - Lifetime
Links
- 238000001228 spectrum Methods 0.000 title claims abstract description 68
- 238000000034 method Methods 0.000 title claims abstract description 25
- 238000004458 analytical method Methods 0.000 title description 2
- 239000006185 dispersion Substances 0.000 claims description 32
- 238000000926 separation method Methods 0.000 claims description 7
- 230000001419 dependent effect Effects 0.000 claims description 3
- 230000008878 coupling Effects 0.000 claims 1
- 238000010168 coupling process Methods 0.000 claims 1
- 238000005859 coupling reaction Methods 0.000 claims 1
- 230000003595 spectral effect Effects 0.000 abstract description 27
- 230000003287 optical effect Effects 0.000 abstract description 8
- 238000003705 background correction Methods 0.000 abstract description 3
- 238000001514 detection method Methods 0.000 abstract 1
- 230000001105 regulatory effect Effects 0.000 abstract 1
- 239000002184 metal Substances 0.000 description 26
- 229910052751 metal Inorganic materials 0.000 description 26
- 230000005855 radiation Effects 0.000 description 7
- 230000000694 effects Effects 0.000 description 5
- 230000006641 stabilisation Effects 0.000 description 5
- 238000011105 stabilization Methods 0.000 description 5
- 229910001369 Brass Inorganic materials 0.000 description 4
- 229910001374 Invar Inorganic materials 0.000 description 4
- 238000005452 bending Methods 0.000 description 4
- 239000010951 brass Substances 0.000 description 4
- 238000006073 displacement reaction Methods 0.000 description 4
- 238000013461 design Methods 0.000 description 3
- 238000009499 grossing Methods 0.000 description 3
- 238000004519 manufacturing process Methods 0.000 description 3
- 239000013078 crystal Substances 0.000 description 2
- 238000009826 distribution Methods 0.000 description 2
- 238000000295 emission spectrum Methods 0.000 description 2
- 230000005484 gravity Effects 0.000 description 2
- 239000011159 matrix material Substances 0.000 description 2
- 238000005259 measurement Methods 0.000 description 2
- 229910052756 noble gas Inorganic materials 0.000 description 2
- BASFCYQUMIYNBI-UHFFFAOYSA-N platinum Chemical compound [Pt] BASFCYQUMIYNBI-UHFFFAOYSA-N 0.000 description 2
- 241001136792 Alle Species 0.000 description 1
- 240000006829 Ficus sundaica Species 0.000 description 1
- 230000006978 adaptation Effects 0.000 description 1
- 238000004364 calculation method Methods 0.000 description 1
- 238000012512 characterization method Methods 0.000 description 1
- 238000010276 construction Methods 0.000 description 1
- 238000012937 correction Methods 0.000 description 1
- 230000007613 environmental effect Effects 0.000 description 1
- 238000011156 evaluation Methods 0.000 description 1
- 230000001678 irradiating effect Effects 0.000 description 1
- 238000000608 laser ablation Methods 0.000 description 1
- 229910052754 neon Inorganic materials 0.000 description 1
- GKAOGPIIYCISHV-UHFFFAOYSA-N neon atom Chemical compound [Ne] GKAOGPIIYCISHV-UHFFFAOYSA-N 0.000 description 1
- 229910052697 platinum Inorganic materials 0.000 description 1
- 238000005096 rolling process Methods 0.000 description 1
- 238000004611 spectroscopical analysis Methods 0.000 description 1
- 230000000087 stabilizing effect Effects 0.000 description 1
- 238000013519 translation Methods 0.000 description 1
Images


Classifications
-
- G—PHYSICS
- G01—MEASURING; TESTING
- G01J—MEASUREMENT OF INTENSITY, VELOCITY, SPECTRAL CONTENT, POLARISATION, PHASE OR PULSE CHARACTERISTICS OF INFRARED, VISIBLE OR ULTRAVIOLET LIGHT; COLORIMETRY; RADIATION PYROMETRY
- G01J3/00—Spectrometry; Spectrophotometry; Monochromators; Measuring colours
- G01J3/28—Investigating the spectrum
- G01J3/2803—Investigating the spectrum using photoelectric array detector
-
- G—PHYSICS
- G01—MEASURING; TESTING
- G01J—MEASUREMENT OF INTENSITY, VELOCITY, SPECTRAL CONTENT, POLARISATION, PHASE OR PULSE CHARACTERISTICS OF INFRARED, VISIBLE OR ULTRAVIOLET LIGHT; COLORIMETRY; RADIATION PYROMETRY
- G01J3/00—Spectrometry; Spectrophotometry; Monochromators; Measuring colours
- G01J3/02—Details
- G01J3/0202—Mechanical elements; Supports for optical elements
-
- G—PHYSICS
- G01—MEASURING; TESTING
- G01J—MEASUREMENT OF INTENSITY, VELOCITY, SPECTRAL CONTENT, POLARISATION, PHASE OR PULSE CHARACTERISTICS OF INFRARED, VISIBLE OR ULTRAVIOLET LIGHT; COLORIMETRY; RADIATION PYROMETRY
- G01J3/00—Spectrometry; Spectrophotometry; Monochromators; Measuring colours
- G01J3/02—Details
- G01J3/06—Scanning arrangements arrangements for order-selection
-
- G—PHYSICS
- G01—MEASURING; TESTING
- G01J—MEASUREMENT OF INTENSITY, VELOCITY, SPECTRAL CONTENT, POLARISATION, PHASE OR PULSE CHARACTERISTICS OF INFRARED, VISIBLE OR ULTRAVIOLET LIGHT; COLORIMETRY; RADIATION PYROMETRY
- G01J3/00—Spectrometry; Spectrophotometry; Monochromators; Measuring colours
- G01J3/12—Generating the spectrum; Monochromators
- G01J3/18—Generating the spectrum; Monochromators using diffraction elements, e.g. grating
- G01J3/1809—Echelle gratings
-
- G—PHYSICS
- G01—MEASURING; TESTING
- G01J—MEASUREMENT OF INTENSITY, VELOCITY, SPECTRAL CONTENT, POLARISATION, PHASE OR PULSE CHARACTERISTICS OF INFRARED, VISIBLE OR ULTRAVIOLET LIGHT; COLORIMETRY; RADIATION PYROMETRY
- G01J3/00—Spectrometry; Spectrophotometry; Monochromators; Measuring colours
- G01J3/28—Investigating the spectrum
- G01J2003/2866—Markers; Calibrating of scan
Definitions
- the invention relates to an echelle spectrometer according to the preamble of claim 1.
- the invention further relates to a method for compensating for shifts of an echelle spectrum in the exit plane of an echelle spectrometer.
- a small spectral range is selected from the spectrum of a low-resolution spectrometer by means of an exit slit and detected by means of diode rows or the like.
- pointwise recording of the spectra is limited either to a certain number of points or spectral regions, which are detected by respective detectors, or the spectrum is pushed by rotation of the grid and / or prism on the detector.
- Newer spectrometers are equipped with area detectors. These allow the simultaneous recording of the entire spectrum or at least large areas thereof.
- DE 197 08 462 A1 describes an echelle spectrometer which has an internal order separation and thus produces a two-dimensional spectrum.
- an emission spectrum is generated by laser ablation. This emission spectrum consists of scattered lines between which there are large areas to which no light falls. These areas are not needed. In order to accelerate read-out, these areas are binned in hardware, ie summarized and discarded. Then only the "interesting" areas need to be read out and saved.
- the determination of these so-called binning regions for determining the intensity value for a respective spectral line can thus be carried out not only by determining the height of the slit image in the transverse dispersion direction, but must take into account the curvature of the orders. This depends in particular on the design of the spectrometer geometry and the properties of the optical components and can be determined by exact calculation of the geometric beam path only with great effort.
- the mathematical determination of the order curvature also does not take into account drifts or other changes in the line positions in the exit plane due to environmental influences.
- the object is achieved by the characterizing part of independent claims 1 and 6.
- a spectrometer it is possible to determine the binning areas to which radiation is incident and to combine them by hardware or software. This improves the signal-to-noise ratio of the spectra and produces a "straight" spectrum.
- the orders in the two-dimensional spectrum in the exit plane of an Echelle spectrometer are curved by the second dispersion, which is necessary for order separation.
- the orders are completely detectable.
- the minimum between two adjacent orders can be determined at each point in the exit plane, which is not possible in a line spectrum in this form.
- the geometric course of this minimum can then be described by means of a function and enables the determination of the binning areas.
- the intensity measured with selectable, adjacent detector elements can be summarized in terms of hardware to an intensity value. But it is also possible to add up the intensity values by means of software.
- the order separation is preferably just so great that the minuteness minima between the orders are no more than two detector elements across the Distribute orders. This achieves a high fill factor, ie optimum utilization of the detector surface. The number of pixels that are not used to acquire the spectrum is low. At the same time, however, the minimum between the orders is sufficient to use it to determine the binning ranges. With a good fill factor, the detector can be kept as small as possible, which reduces costs.
- the object of the invention is achieved in particular by a method according to claim 1.
- the binning regions along at least one order can be easily determined.
- the result is a spectrum with "straight" orders.
- This method operates in a similar way to a rolling ball in a gutter: starting from a starting value in a selected detector column and a selected order, the closest adjacent pixel with an intensity minimum is selected.
- the picture elements considered for the selection are the picture element immediately adjacent in the column direction, as well as the picture element above and below, which each adjoin the start value with a corner.
- the minima on the picture elements thus selected correspond essentially to the course of the minimum between two orders.
- the fit function may be, for example, a second degree or third degree polynomial.
- the function is preferably stored for each order, for polynomials, for example, in terms of the coefficients of the polynomial for each order.
- a order-dependent secondary function is formed from the mutually corresponding coefficients of the polynomial of each order, and this function is optimized by means of a fit function.
- the functions which describe the course of the orders change from order to order not abruptly but steadily. By fitting this set of functions, the accuracy in digitization errors, noise, and other errors can be further improved.
- the secondary fit function can again be formed by a polynomial. Then the polynomial coefficients of the secondary fit function can be stored. This reduces the amount of data to be stored for the evaluation of the order of the orders.
- the columns of the detector are substantially perpendicular to the dispersion direction of the echelle grating. Instead detector columns but also detector lines can be used when the geometry of the spectrometer is designed such that the spectrum is rotated substantially 90 degrees.
- the detector column selected after step (a1) is substantially centered in the spectrum. Then the function is determined on both sides of the column.
- the binning regions take into account the intensities of detector elements of a column belonging to the same order, preferably proportionately, if the value of the fit function on a detector element does not assume an integer value in the middle of the detector element in the row direction. This avoids a digitizing effect in the spectrum.
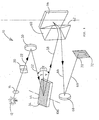
- FIG.1 an inventive Echelle spectrometer 10 is shown schematically.
- the light of a light source 12 is focused by means of a lens 14 or a mirror on an entrance slit 20.
- the optical axis is indicated by a line 22 in FIG Fig.1 shown.
- the light passes through the entrance slit 20 and is parallelized by means of a spherical concave mirror 30.
- the parallel bundle 32 then strikes an Echelle grating 34 where it is dispersed.
- the grid grooves 44 are horizontal. The dispersion is perpendicular to the grid grooves, ie vertically in Fig.1 ,
- Fig.2 the echelle grating 34 is again shown in detail.
- the spacing of the grid grooves is denoted by d.
- the angle of the incident beam 32 with the normal 46 on the grid is denoted by ⁇ .
- the angle of the diffracted beam 58 with the vertical 46 on the grating is denoted by ⁇ .
- ⁇ B denotes the blaze angle of the grooves 44 of the Echelle grating 34.
- the parallel light beam 32 in Fig.1 With respect to the dispersion plane, it falls on the echelle grating 34 at a very shallow angle.
- the angle corresponds approximately to 90 degrees minus the blaze angle of the echelle grating.
- the intensity of the diffraction image is concentrated to high diffraction orders in a typical range between the thirtieth and one hundredth thirtieth order for the wavelengths to be measured.
- a large diffraction angle which in the present case is 76 degrees, causes a high dispersion.
- the Echelle grating 34 has a small number of lines of 75 lines per millimeter in order to achieve the highest possible angular dispersion for wavelengths in the range of 190 nm to 852 nm. Typically, counts of 25 to 250 strokes per millimeter are used. Due to the large angle of incidence, the grid 34 must be correspondingly long, if the entire radiation is to impinge on the grid.
- the parallel bundle 32 falls with respect to a plane perpendicular to the lattice grooves at an angle 2 ⁇ , the so-called off-plane angle, on the grid 34. This is in Figure 3 again clearly shown. There, the bundle is reflected in the plane parallel to the grid grooves 44 and diffracted in the perpendicular dispersion plane.
- the reflected and dispersed beam 58 is directed through a prism 60 with roof edge 62.
- the roof edge 62 of the prism 60 is perpendicular.
- the beam 58 is dispersed in the prism 60, meets behind it on a plane mirror 64 and is reflected back into the prism 60.
- There the jet is redispersed.
- the jet is dispersed twice in the horizontal direction, ie perpendicular to the grating dispersion direction (main dispersion direction) (transverse dispersion).
- the overlapping orders in the main dispersion direction are pulled apart and curved by the considerably lower transverse dispersion at the prism 60 in a direction perpendicular to the main dispersion direction, compared to the main dispersion.
- FIG Fig. 4 A typical spectrum of a continuous radiator is shown schematically in FIG Fig. 4 shown.
- the wavelengths are distributed in the main dispersion direction in the direction of the arrow 74.
- the various orders are pulled apart in the transverse dispersion direction, represented by arrow 76. So is the 100th order 78, for example, next to the 99th order, which is designated 80.
- a charge-coupled-device (CCD) detector 82 of conventional design is arranged in the exit plane.
- the CCD detector is provided with pixels 84 arranged in a rectangular grid in horizontal detector rows 94 and vertical detector columns 92.
- the detector is oriented so that the Detector lines 94 extend substantially along the diffraction orders of Echelle grating 34. Due to the prism dispersion, however, the diffraction orders 78, 80 are slightly curved, not parallel and not equidistant. In Figure 4 this is somewhat exaggerated for better illustration.
- Each pixel can be assigned a pair (x, y) that uniquely describes its location.
- the x-value corresponds to the x-th detector column seen from the left and the y-value corresponds to the y-th detector row counted from below.
- the grid 34 is movable about an axis 106 which is parallel to the grid grooves 44.
- the axis 106 extends along a bend 112 (see FIG. Figure 5 ).
- the bend 112 connects an upper metal plate 110 to a lower metal plate 114.
- the grid 34 rests on the upper metal plate 110 and is glued to it.
- the lower metal plate 114 rests on a wedge 122 whose angle is substantially 90 degrees minus the blaze angle of the grating.
- a piezo element 116 protrudes laterally from the grid through the upper metal plate 110 and exerts a pressure on the lower metal plate 114 at its end.
- the rotation takes place by means of a computer-controlled stepping motor and an associated fine spindle.
- the displacement of a line of a selected wavelength takes place substantially in the direction of the main dispersion in the exit plane, ie in the direction of the arrow 74 in FIG Figure 4 or in the opposite direction.
- FIG. 6 the prism arrangement is shown.
- a brass rod 126 is connected at the attachment point 127 to an invar housing 128.
- the Invar housing 128 is attached to a metal housing 130.
- the brass rod 126 extends through the metal housing 130 and protrudes with its free end 132 beyond.
- the metal housing 130 fixedly connected to the mechanical structure of the spectrometer is connected to a metal block 136 via a bending point 134.
- the prism 60 is glued to the metal block. As the ambient temperature increases, the prism dispersion increases. At a temperature increase but also the brass rod 126 expands.
- the Invar housing 128 does not expand or only negligibly due to the properties of Invar.
- the expansion of the brass rod exerts pressure on a pressure point 140 on the surface of the metal block 136.
- the distance 138 of the metal housing 130 from the metal block 136 then changes at that location such that rotation of the metal block 136 about the bend occurs.
- the bending point 134 forms the axis of rotation.
- the prism 60 is rotatable about an axis parallel to the roof edge 62. This rotation can also be stepper motor or piezo controlled.
- the prism 60 is attached to a rotatable table.
- two piezoelectric crystals are provided, which are controlled by a computer and a power supply.
- the piezos are mounted on the camera mirror so that it can be rotated about two axes by means of the piezo. As a result, the entire spectrum in the exit plane can be displaced in the vertical and horizontal directions without significant distortion.
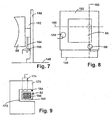
- Fig.7 and Fig.8 the structure of the camera mirror 68 is shown in detail.
- a vertical plate 150 is screwed on the base plate 148 of the spectrometer.
- the camera mirror 68 is mounted with its rear side movable on this plate 150, wherein between the back of the camera mirror 68 and the plate 150, a gap 152 is provided.
- Another plate 154 is seated in this space 152 and is connected to the plate 150 by a hinge member movable in two mutually perpendicular directions. Through this plate 154 projecting two piezo elements 156 and 158.
- the piezo elements 156 and 158 are fixedly connected to the plate 154.
- the area detector 82 in the exit plane 72 of the spectrometer is also rotatably mounted. This is in Fig. 9 shown.
- the axis of rotation 164 is perpendicular to the detector surface 166.
- a further piezoelectric crystal which is also supplied computer-controlled with a voltage, the detector 82 can be rotated by a defined angle.
- the detector 82 is arranged on an inner metal block 168, which is connected to an outer metal block 170 via a bending point, which coincides with the axis of rotation 164.
- the outer metal block 170 is fixedly connected to the spectrometer base plate.
- the outer metal block 170 extends on three sides around the inner metal block, forming a gap 172 between the blocks.
- Through the outer metal block 170 protrudes a piezoelectric element 174, which extends over the gap 172 and presses on the inner metal block 168.
- the pressure point between the piezo element 174 and the inner metal block 168 is located at a distance from the bending point 164. If the piezo element due to a Voltage change expands / contracts, then the inner metal block 168 with the detector located thereon is rotated about the axis 164.
- the device is subject to temperature or pressure fluctuations or other changes in the device environment of a drift, ie a mechanical displacement or rotation of all optical components from their desired positions.
- This drift may cause the spectral lines at the detector to be shifted, distorted or rotated.
- the distance between two spectral lines can change as well.
- the device is first adjusted. For this, the order history and the position of the orders are compared with a reference.
- the adjusting elements on the grating, prism, camera mirror and detector must be readjusted regularly. In an air-conditioned laboratory, an adjustment is generally sufficient during the day, while in arrangements, for example, outside in mobile use, an adjustment must be made practically before each measurement.
- the adjusting elements are moved, which have the greatest effect on the spectrum, regardless of the cause of the original shift from the reference position.
- the cause of the shift is often no longer noticeable. If, for example, the detector has shifted linearly from its position, an adjustment is nevertheless made by means of the piezo elements on the camera mirror.
- a reference light source which emits line radiation over wide areas of the spectrum, is coupled in front of the entrance slit of the spectrometer and adjusted so that sharp lines appear on the detector.
- a reference light source for example, a noble gas pen-ray lamp is suitable.
- the position of the spectral lines in this state is then stored as a reference position. This is done in the form of x and y values for describing the detector pixel and the associated intensity in relative units.
- manipulated variable combinations are then determined with which the reference spectrum is obtained. The manipulated variable combinations must be determined experimentally, since manufacturing tolerances, deviations of the position of the axes from one device to another and other differences between the corresponding components of different spectrometers lead to different manipulated variable combinations. Once this has been determined, it can be used as long as the same components are used.
- the manipulated variables are interdependent. For example, if the distance between two spectral lines in an order is too large compared to the distance between the same lines in the reference spectrum, this can not be easily compensated for by rotation of the grating. A rotation of the grid is in fact associated with a displacement of both lines, which then has to be compensated with a tilt or rotation of the camera tracking. Such rotation may also cause rotation of the entire spectrum in the exit plane. This is then compensated by rotation of the detector.
- spectral line positions are characterized by the values for x and y position, wavelength, half width and intensity of the spectral line.
- X and Y denote the position of a picture element.
- the position of the spectral lines of the reference light source is determined and compared with the stored reference spectrum. Thereafter, the control elements operated according to the stored assignment. In a further step, the position of the spectral lines is then checked again. If the spectral lines lie around the reference position within a predetermined interval, then the spectrometer is in the "reference state". The assignment may not be perfect. This may be due to nonlinearities or because the axes of rotation are not in their optimum position. Then the spectral lines are closer to their reference position, but not directly to it. The adjustment process is therefore repeated until all spectral lines are at their reference positions. Depending on the quality of the assignment rule and the control elements, only one or even up to 100 repetitions are necessary. After that all spectral lines are in their reference positions. The spectrometer then has a very definable resolution. The arrangement is also suitable for "online" stabilization by computer control. An adjustment is made at regular intervals.
- the intensities of those detector elements which are irradiated with light of the same wavelength are added up (binning).
- the associated detector elements are first determined. These "binning regions" each run approximately perpendicular to the orders that are curved due to the prism dispersion.
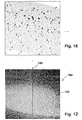
- a detector column 180 is selected approximately at the center of the detector 184 which is substantially transverse to the orders 182 ( Figure 12 ). If the orders are substantially along the columns, a detector row is selected.
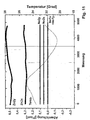
- the light of a continuum radiator, which radiates a continuous spectrum over the entire area under consideration, is coupled into the spectrometer and the intensities I on the detector elements of the detector column 180 are determined.
- the intensity curve as a function of the y-value along the detector column is in Figure 13 shown.
- the order centers lie approximately at the maxima 184, the minima 186 represent the centers between the orders.
- the exact order profile of each order of interest has to be determined. This can be done by describing the minima between the orders or by describing the maxima. The minima are sharper in the present case than the maxima and are therefore selected. With large order separation, the maxima are better suited.
- the course of the minimum along the order must be tracked and described.
- the picture element of these three picture elements with the lowest intensity is assumed to be the minimum between the two orders considered for this adjacent detector column. In turn, it serves as the initial value for the selection of the next three neighboring picture elements from which in turn the one with the lowest intensity is selected.
- the process is repeated on both sides of the original column for each order until all minima are determined for each column.
- the totality of all selected pixels then run along the minimum between two orders. Three pixels are sufficient for the determination of the minima, since there are no jumps in the course of the orders.
- the binning regions are then all detector elements of a column between any two adjacent fitted functions.
- the functions can also accept non-integer values.
- the functions across the width of a detector element are set to its center value.
- the intensity at this detector element is correspondingly taken into account only proportionally during binning. This compensates for the digitizing effect that usually occurs during binning.
- the result is a set of functions that can be stored as such in the form of the coefficients.
- the set of functions was also matched by a secondary fit of the coefficients.
- the coefficients were represented by a matrix: a 0 . 1 . a 0 . 2 ... a 0 . m a 1 . 1 . a 1 . 2 ... a 1 . m a 2 . 1 . a 2 . 2 ... a 2 . m and the corresponding coefficients of each order, eg the constant terms a 0,1 , a 0,2 ... a 0, m , again described by a fit function. There are then 3 coefficients left for each of the secondary fit functions.
- the pixels are considered proportionately, but discreetly in columns.
- the binning area represents the area between two minima and the intensity values are added up accordingly.
- I ( ⁇ ) In order to obtain the interesting function I ( ⁇ ) for the spectroscopists, I m (x) must be calibrated. For this purpose, each position x of the binned spectrum must be assigned a wavelength ⁇ . We are looking for the function ⁇ m (x).
- the calibration is performed by comparing the measured spectrum with a reference spectrum recorded by a line source with a high number of spectral lines.
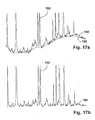
- a section of such a spectrum is in Fig. 16 and in Fig. 17 shown.
- the platinum lines are particularly well suited.
- the line data is already available as a file (atlas). This file stores the wavelengths of the line centers and the relative intensities.
- the noble gas lines are suitable for Pen-Ray lamps, in which the spectra were added up with the software.
- the recorded spectrum must first be corrected with respect to broadband background.
- the underground is designated 190.
- the spectral lines are labeled 192.
- the broadband background is formed, for example, by stray light, unresolved rotational vibration bands of molecules, or the like.
- the background is first determined and then subtracted from the original spectrum.
- each value where the value of the original curve is above the value of the smoothed curve is then set to the value of the smoothed curve.
- the curve modified in this way is then smoothed again with moving average. Even after this repeated smoothing of the modified curve, the curve is again modified by setting the values above the value of the smoothed curve to the value of the smoothed curve.
- the result of the 2-fold smoothing is in Figure 16 a shown. It can be seen that the peaks are shrinking while the rest of the smoothed curve snugly fits the original curve.
- Figure 17 a is the background 190 and the original curve 194 is shown with peaks 192.
- the correction is performed by subtracting the background from the original curve.
- the difference curve 196 is in Figure 17 b shown. It can be seen that, with the exception of noise, only peaks 192 are present in the spectrum. The binned and ground corrected curve is then used for further calibration.
- a start value is determined. This is a line well known to the spectroscopist. Examples include: Lines that appear in several orders, Na double line, Hg253, etc., which have a particularly prominent profile or are otherwise well known to the spectroscopist. These known first lines are assigned the known, exact wavelength and the known ordinal number m 0 .
- ⁇ m x a 0 m 0 + a 1 m 0 ⁇ x + a 2 m 0 ⁇ x 2 It is advantageous if the known first order is in the middle of the spectrum. The value of the order can be determined from the nominal data of the grid.
- the preliminary wavelength scale is sufficient to identify the reference lines that are in this order.
- the wavelengths of the reference lines are taken from the exact wavelength (atlas) file and assigned. From the atlas values and the exact centroid positions of the reference lines, a polynomial fit again determines an accurate wavelength scale. Only those reference lines are considered, for which the atlas value coincides with the centroid wavelength of the preliminary wavelength scale within a predetermined tolerance range.
- the coefficients form a matrix.
- the corresponding coefficients show an order dependency.
- This order dependency can again be described by a fit function.
- the wavelength function ⁇ (x) can be described and stored by means of fewer coefficients.
- FIG. 18 An echelle spectrometer according to another embodiment is shown.
- the radiation represented by its optical axis 200, is pre-decomposed before entering the spectrometer.
- an arrangement consisting of an entrance slit 202, UV-coated toroidal mirrors 204 and 206, and a prism 208 is provided.
- the radiation then passes through an entrance slit assembly 210 having two crossed, offset entrance slits 212 and 214.
- a spherical mirror collimator mirror 216 reflects the beam toward the Echelle grating 218.
- a prism 220 Between Echelle grating 218 and collimator mirror 216 is a prism 220 arranged for transverse dispersion. After dispersion at the grating 218, the radiation again passes through the prism and is incident on a camera mirror 222.
- the camera mirror 222 focuses the dispersed light in the exit plane 224.
- the grid is rotatably mounted about an axis 226.
- the prism is rotatably mounted about an axis 228.
- the camera mirror is rotatably mounted about two axes 230 and 232 and the detector (not shown) is rotatably mounted about an axis 234.
Landscapes
- Physics & Mathematics (AREA)
- Spectroscopy & Molecular Physics (AREA)
- General Physics & Mathematics (AREA)
- Spectrometry And Color Measurement (AREA)
- Investigating Or Analysing Materials By Optical Means (AREA)
- Analysing Materials By The Use Of Radiation (AREA)
- Investigating, Analyzing Materials By Fluorescence Or Luminescence (AREA)
- Semiconductor Lasers (AREA)
- Processing Of Color Television Signals (AREA)
- Image Processing (AREA)
- Image Analysis (AREA)
- Photoreceptors In Electrophotography (AREA)
Claims (8)
- Procédé pour la détermination de zones de binning d'un détecteur de surface pour des spectres échelle bidimensionnels dans le plan d'émergence d'un spectromètre échelle, caractérisé par les étapes de(a) Calcul de la position (x,ymin,m) de l'élément détecteur pour chaque colonne x sur lequel l'intensité I d'un émetteur à spectre continu revêt un minimum Imin=I(x, ymin,m) entre deux degrés m et m+1,(b) Calcul d'une fonction constante ymin,m(x) qui représente, sous forme de fonction du nombre de colonnes x, le tracé du minimum d'intensité Imin entre les deux degrés m et m+1,(c) Réitération des étapes (a) et (b) pour le tracé ymin,m-1(x) d'au moins un minimum d'intensité entre les deux degrés voisins suivants m-1 et m,(d) Détermination de zones de binning pour un degré m se composant de tous les éléments détecteurs (x,y), pour lesquelles on a:
 (e) la fonction selon l'étape (b) étant formée par une fonction de fit tmin,m(x)=ym(x) par les éléments détecteurs calculés selon l'étape (a), et(f) les zones de binning prennent en compte les parts d'intensité d'éléments détecteurs lorsque la valeur de la fonction de fit sur un élément détecteur ne revête pas de valeur entière au centre de l'élément détecteur dans le sens x.
 - Procédé pour la détermination de zones de binning d'un détecteur de surface pour des spectres échelle bidimensionnels dans le plan d'émergence d'un spectromètre échelle, caractérisé par les étapes de(a) Calcul de la position (x,ymax,m) de l'élément détecteur pour chaque colonne x sur lequel l'intensité I d'un émetteur à spectre continu revêt un minimum Imax=I(x, ymax,m) entre deux degrés m et m+1,(b) Calcul d'une fonction constante ymax,m(x) qui représente, sous forme de fonction du nombre de colonnes x, le tracé du maximum d'intensité Imax entre les deux degrés m et m+1,(c) Réitération des étapes (a) et (b) pour le tracé ymax,m-1(x) d'au moins un minimum d'intensité entre les deux degrés voisins suivants m-1 et m,(d) Détermination de zones de binning pour un degré m se composant de tous les éléments détecteurs (x,y), pour lesquelles on a:

Δym,m±1 désignant l'écart entre le maximum du degré m et le maximum du degré m+1,(e) la fonction selon l'étape (b) étant formée par une fonction de fit ymax,m(x)=ym(x) par les éléments détecteurs calculés selon l'étape (a), et(f) les zones de binning prennent en compte les parts d'intensité d'éléments détecteurs lorsque la valeur de la fonction de fit sur un élément détecteur ne revêt pas de valeur entière au centre de l'élément détecteur dans le sens x. - Procédé selon la revendication 1 ou 2, caractérisé en ce que la position de l'élément détecteur selon l'étape (a) est calculée par les étapes suivantes(a1) Sélection d'une colonne de détecteur x,(a2) Irradiation de la lumière d'un émetteur à spectre continu dans le spectromètre,(a3) Détermination de l'élément détecteur dans la colonne sélectionnée x sur lequel se trouve le minimum d'intensité entre deux degrés ou le maximum d'intensité pour un degré sélectionné m,(a4) Détermination de l'élément détecteur de la colonne voisine suivante x+1 sur lequel se trouve le minimum d'intensité ou le maximum d'intensité des trois éléments détecteurs adjacents les uns aux autres qui jouxtent l'élément détecteur déterminé à l'étape (a3) et(a5) Réitération de l'étape (a4) pour toutes les colonnes x.
- Procédé selon la revendication 3, caractérisé en ce que la fonction de fit est un polynôme, notamment un polynôme de second ou troisième degré et seuls les coefficients du polynôme sont mémorisés pour chaque degré.
- Procédé selon la revendication 4, caractérisé en ce qu'une fonction secondaire est formée à partir des coefficients du polynôme de chaque degré correspondant les uns avec les autres et que cette fonction est optimisée au moyen d'une fonction de fit formée elle aussi par un polynôme, et que seuls les coefficients de polynômes de la fonction de fit secondaire sont mémorisés.
- Spectromètre échelle muni d'un réseau échelle et d'un autre élément de dispersion pour séparer les degrés du spectre échelle diagonalement par rapport au sens de dispersion du réseau échelle, d'un détecteur de surface muni de nombreux éléments détecteurs dans le plan d'émergence du spectromètre afin de saisir le spectre échelle bidimensionnel, d'un émetteur, de moyens de couplage de la lumière dudit émetteur dans le spectromètre et de moyens de calcul, caractérisé en ce que(a) l'émetteur émet un spectre continu sur toute la zone considérée,(b) sont prévus des moyens de détermination d'éléments détecteurs sur lesquels la lumière de l'émetteur à spectre continu revêt un minimum entre deux degrés voisins, et(c) sont prévus des moyens de calcul pour déterminer une fonction Im(x), m désignant un degré et x et y les coordonnées d'un point sur le détecteur représentant un tracé d'intensité unidimensionnel, à partir de nombreux points (x, y) sur le détecteur et de la répartition de l'intensité associée I(x,y), et(d) des moyens pour la mise en oeuvre des étapes de procédé d'après l'une quelconque des revendications précédentes.
- Spectromètre échelle selon la revendication 6, caractérisé en ce que les éléments détecteurs voisins sélectionnables d'intensité mesurable peuvent se résumer du point de vue du hardware en une seule valeur d'intensité.
- Spectromètre échelle selon l'une quelconque des revendications 6 ou 7, caractérisé en ce que la séparation des degrés est telle que les minima d'intensité entre les degrés se répartissent seulement sur deux éléments détecteurs au maximum diagonalement par rapport aux degrés.
Priority Applications (2)
| Application Number | Priority Date | Filing Date | Title |
|---|---|---|---|
| EP09156127A EP2068134B1 (fr) | 2000-11-13 | 2001-11-03 | Procédé de détermination et de correction de bruit de fond à large bande |
| EP07100392A EP1783468B1 (fr) | 2000-11-13 | 2001-11-03 | Procédé d'analyse de spectres d'échelles |
Applications Claiming Priority (3)
| Application Number | Priority Date | Filing Date | Title |
|---|---|---|---|
| DE10055905A DE10055905B4 (de) | 2000-11-13 | 2000-11-13 | Verfahren zur Auswertung von Echelle-Spektren |
| DE10055905 | 2000-11-13 | ||
| PCT/EP2001/012750 WO2002039077A2 (fr) | 2000-11-13 | 2001-11-03 | Procede d'analyse de spectres d'echelles |
Related Child Applications (2)
| Application Number | Title | Priority Date | Filing Date |
|---|---|---|---|
| EP09156127A Division EP2068134B1 (fr) | 2000-11-13 | 2001-11-03 | Procédé de détermination et de correction de bruit de fond à large bande |
| EP07100392A Division EP1783468B1 (fr) | 2000-11-13 | 2001-11-03 | Procédé d'analyse de spectres d'échelles |
Publications (2)
| Publication Number | Publication Date |
|---|---|
| EP1336084A2 EP1336084A2 (fr) | 2003-08-20 |
| EP1336084B1 true EP1336084B1 (fr) | 2009-12-23 |
Family
ID=7662923
Family Applications (3)
| Application Number | Title | Priority Date | Filing Date |
|---|---|---|---|
| EP09156127A Expired - Lifetime EP2068134B1 (fr) | 2000-11-13 | 2001-11-03 | Procédé de détermination et de correction de bruit de fond à large bande |
| EP01993819A Expired - Lifetime EP1336084B1 (fr) | 2000-11-13 | 2001-11-03 | Procede d'analyse de spectres d'echelles |
| EP07100392A Expired - Lifetime EP1783468B1 (fr) | 2000-11-13 | 2001-11-03 | Procédé d'analyse de spectres d'échelles |
Family Applications Before (1)
| Application Number | Title | Priority Date | Filing Date |
|---|---|---|---|
| EP09156127A Expired - Lifetime EP2068134B1 (fr) | 2000-11-13 | 2001-11-03 | Procédé de détermination et de correction de bruit de fond à large bande |
Family Applications After (1)
| Application Number | Title | Priority Date | Filing Date |
|---|---|---|---|
| EP07100392A Expired - Lifetime EP1783468B1 (fr) | 2000-11-13 | 2001-11-03 | Procédé d'analyse de spectres d'échelles |
Country Status (6)
| Country | Link |
|---|---|
| US (2) | US7319519B2 (fr) |
| EP (3) | EP2068134B1 (fr) |
| AT (2) | ATE453105T1 (fr) |
| AU (1) | AU2002220680A1 (fr) |
| DE (3) | DE10055905B4 (fr) |
| WO (1) | WO2002039077A2 (fr) |
Families Citing this family (36)
| Publication number | Priority date | Publication date | Assignee | Title |
|---|---|---|---|---|
| CN100365400C (zh) * | 2004-09-09 | 2008-01-30 | 中国科学院上海技术物理研究所 | 成像光谱仪的像面检校装置 |
| US7495761B2 (en) * | 2006-02-03 | 2009-02-24 | Foster-Miller, Inc. | Array detector coupled spectroanalytical system and graded blaze angle grating |
| TWI345050B (en) * | 2007-08-03 | 2011-07-11 | Oto Photonics Inc | Optical system and method of manufacturing the same |
| US9146155B2 (en) * | 2007-03-15 | 2015-09-29 | Oto Photonics, Inc. | Optical system and manufacturing method thereof |
| EP2304400A1 (fr) * | 2008-06-25 | 2011-04-06 | Bioptigen, Inc. | Spectromètres à réseau de phase tridimensionnel et procédés et systèmes associés |
| WO2010056668A1 (fr) * | 2008-11-11 | 2010-05-20 | Bae Systems Information And Electronic Systems Integration Inc. | Multiplexeur/démultiplexeur optique |
| DE102009003413B4 (de) | 2009-01-30 | 2022-01-20 | Leibniz - Institut Für Analytische Wissenschaften - Isas - E.V. | Echelle-Spektrometeranordnung mit interner Vordispersion |
| KR101556866B1 (ko) * | 2011-10-21 | 2015-10-01 | 엘지전자 주식회사 | 거리 측정 장치 |
| EP2783193A4 (fr) | 2011-11-03 | 2015-08-26 | Verifood Ltd | Système de spectrométrie à faible coût pour analyse d'aliments d'utilisateur final |
| FR2984490B1 (fr) * | 2011-12-14 | 2014-05-16 | IFP Energies Nouvelles | Methode d'analyse chimique comportant un lissage de diagramme par filtre localement auto adaptatif |
| DE102012101019B4 (de) | 2012-02-08 | 2015-03-12 | Leibniz-Institut für Analytische Wissenschaften-ISAS-e.V. | Spektrometer-Anordnung für UV-VIS |
| JP5448224B1 (ja) * | 2013-03-12 | 2014-03-19 | 日本分光株式会社 | クロマトグラフィーシステム、信号処理装置、クロマトグラフィー・データ処理端末およびプログラム |
| GB2529070B (en) | 2013-08-02 | 2017-07-12 | Verifood Ltd | Spectrometer comprising a plurality of isolated optical paths |
| GB2517706B (en) * | 2013-08-28 | 2016-03-09 | Thermo Electron Mfg Ltd | Background correction in emission spectra |
| EP3090239A4 (fr) | 2014-01-03 | 2018-01-10 | Verifood Ltd. | Systèmes de spectrométrie, procédés, et applications associées |
| EP3209983A4 (fr) | 2014-10-23 | 2018-06-27 | Verifood Ltd. | Accessoires pour spectromètre portatif |
| WO2016125165A2 (fr) | 2015-02-05 | 2016-08-11 | Verifood, Ltd. | Système de spectrométrie comprenant un faisceau de visée visible |
| WO2016125164A2 (fr) | 2015-02-05 | 2016-08-11 | Verifood, Ltd. | Applications d'un système de spectrométrie |
| WO2016162865A1 (fr) | 2015-04-07 | 2016-10-13 | Verifood, Ltd. | Détecteur pour système de spectrométrie |
| DE102015105239A1 (de) | 2015-04-07 | 2016-10-13 | Analytik Jena Ag | Verfahren zur Korrektur von Untergrundsignalen in einem Spektrum |
| DE102015107942A1 (de) | 2015-05-20 | 2016-11-24 | Sick Ag | Spektrometer und Gasanalysator |
| US10066990B2 (en) | 2015-07-09 | 2018-09-04 | Verifood, Ltd. | Spatially variable filter systems and methods |
| US11953427B2 (en) * | 2015-08-03 | 2024-04-09 | Endress+Hauser Optical Analysis, Inc. | Reconstruction of frequency registration for quantitative spectroscopy |
| US10203246B2 (en) | 2015-11-20 | 2019-02-12 | Verifood, Ltd. | Systems and methods for calibration of a handheld spectrometer |
| CN105628649B (zh) * | 2015-12-24 | 2018-03-16 | 山东省科学院激光研究所 | 气体现场监测特征吸收峰提取方法 |
| US10254215B2 (en) | 2016-04-07 | 2019-04-09 | Verifood, Ltd. | Spectrometry system applications |
| TWI715599B (zh) | 2016-07-12 | 2021-01-11 | 台灣超微光學股份有限公司 | 光譜儀模組及其製作方法 |
| WO2018015951A1 (fr) | 2016-07-20 | 2018-01-25 | Verifood, Ltd. | Accessoires pour spectromètre portatif |
| US10791933B2 (en) | 2016-07-27 | 2020-10-06 | Verifood, Ltd. | Spectrometry systems, methods, and applications |
| DE102017213419A1 (de) * | 2017-08-02 | 2019-02-07 | Deere & Company | Spektrometeranordnung |
| EP3864384A4 (fr) | 2018-10-08 | 2022-06-29 | Verifood Ltd. | Accessoires pour spectromètres optiques |
| GB2586046B (en) * | 2019-07-31 | 2021-12-22 | Thermo Fisher Scient Bremen Gmbh | Peak determination in two-dimensional optical spectra |
| GB2589884B (en) * | 2019-12-11 | 2022-08-03 | Thermo Fisher Scient Bremen Gmbh | Processing optical spectra |
| GB2601182B (en) | 2020-11-23 | 2022-12-28 | Thermo Fisher Scient Bremen Gmbh | Diagnostic testing method for a spectrometer |
| GB2634760A (en) | 2023-10-19 | 2025-04-23 | Thermo Fisher Scient Bremen Gmbh | Optical emission spectrometer and method of optical emission spectrometry |
| CN119203858B (zh) * | 2024-11-28 | 2025-01-28 | 吉林大学 | 基于流体模型分析的光谱仪结构优化方法、装置及光谱仪 |
Family Cites Families (18)
| Publication number | Priority date | Publication date | Assignee | Title |
|---|---|---|---|---|
| DE256060C (fr) | ||||
| US3658424A (en) * | 1971-01-14 | 1972-04-25 | Spectra Metrics Inc | Method of focusing the horizontal and vertical components from an echelle grating |
| DD210753A1 (de) * | 1982-10-01 | 1984-06-20 | Zeiss Jena Veb Carl | Anordnung zur auswahl von spektrenabschnitten aus einem gesamtspektrum |
| DD256060A3 (de) * | 1984-08-20 | 1988-04-27 | Zeiss Jena Veb Carl | Echelle-spektrometer |
| DD260326B5 (de) * | 1987-05-04 | 1993-11-25 | Zeiss Carl Jena Gmbh | Justierbare echelle-spektrometer-anordnung und verfahren zu dessen justage |
| DE3777191D1 (de) * | 1987-12-18 | 1992-04-09 | Hewlett Packard Gmbh | Spektrometer mit photodiodenanordnung. |
| US5253183A (en) * | 1988-01-06 | 1993-10-12 | Hitachi, Ltd. | Obtaining a spectrogram from a single scanning of interference fringes |
| JPH0254130A (ja) * | 1988-08-17 | 1990-02-23 | Anritsu Corp | 分光器 |
| US4995721A (en) * | 1990-03-05 | 1991-02-26 | Imo Industries, Inc. | Two-dimensional spectrometer |
| DE4017317C2 (de) * | 1990-05-30 | 2000-02-17 | Bodenseewerk Perkin Elmer Co | Anodnung zur Verbesserung der Auflösung eines Spektrometers |
| DE4128506A1 (de) * | 1991-08-28 | 1993-03-04 | Zeiss Carl Fa | Verfahren zum betreiben eines spektrometers |
| GB9320261D0 (en) * | 1993-10-01 | 1993-11-17 | Unicam Ltd | Spectrophotometer |
| DE4413096B4 (de) * | 1994-04-15 | 2004-09-09 | Berthold Gmbh & Co. Kg | Multielement-Atomabsorptionsspektrometer sowie Meßverfahren unter Nutzung eines solchen Atomabsorptionsspektrometers |
| US5596407A (en) * | 1995-06-07 | 1997-01-21 | Varian Associates, Inc | Optical detector for echelle spectrometer |
| US5672869A (en) * | 1996-04-03 | 1997-09-30 | Eastman Kodak Company | Noise and background reduction method for component detection in chromatography/spectrometry |
| DE19708462A1 (de) * | 1997-02-17 | 1998-08-27 | Lla Umwelttechnische Analytik | Verfahren und Vorrichtung zur zeitaufgelösten optischen Spektralanalyse von laserinduzierten Mikroplasmen |
| US5739905A (en) * | 1997-02-26 | 1998-04-14 | Lucid Technologies, Inc. | Spectrophotometer with electronic temperature stabilization |
| US6529531B1 (en) * | 1997-07-22 | 2003-03-04 | Cymer, Inc. | Fast wavelength correction technique for a laser |
-
2000
- 2000-11-13 DE DE10055905A patent/DE10055905B4/de not_active Expired - Lifetime
-
2001
- 2001-11-03 AT AT07100392T patent/ATE453105T1/de not_active IP Right Cessation
- 2001-11-03 AU AU2002220680A patent/AU2002220680A1/en not_active Abandoned
- 2001-11-03 AT AT01993819T patent/ATE453104T1/de not_active IP Right Cessation
- 2001-11-03 DE DE50115281T patent/DE50115281D1/de not_active Expired - Lifetime
- 2001-11-03 WO PCT/EP2001/012750 patent/WO2002039077A2/fr not_active Ceased
- 2001-11-03 EP EP09156127A patent/EP2068134B1/fr not_active Expired - Lifetime
- 2001-11-03 US US10/416,566 patent/US7319519B2/en not_active Expired - Lifetime
- 2001-11-03 EP EP01993819A patent/EP1336084B1/fr not_active Expired - Lifetime
- 2001-11-03 EP EP07100392A patent/EP1783468B1/fr not_active Expired - Lifetime
- 2001-11-03 DE DE50115274T patent/DE50115274D1/de not_active Expired - Lifetime
-
2008
- 2008-01-14 US US11/985,798 patent/US7876435B2/en not_active Expired - Lifetime
Also Published As
| Publication number | Publication date |
|---|---|
| DE10055905A1 (de) | 2002-05-23 |
| AU2002220680A1 (en) | 2002-05-21 |
| DE10055905B4 (de) | 2004-05-13 |
| ATE453105T1 (de) | 2010-01-15 |
| DE50115274D1 (de) | 2010-02-04 |
| EP1783468A2 (fr) | 2007-05-09 |
| US20080106735A1 (en) | 2008-05-08 |
| EP1783468B1 (fr) | 2009-12-23 |
| EP1783468A3 (fr) | 2008-10-01 |
| EP2068134B1 (fr) | 2013-03-20 |
| EP1336084A2 (fr) | 2003-08-20 |
| DE50115281D1 (de) | 2010-02-04 |
| EP2068134A2 (fr) | 2009-06-10 |
| EP2068134A3 (fr) | 2009-07-15 |
| US7319519B2 (en) | 2008-01-15 |
| US7876435B2 (en) | 2011-01-25 |
| WO2002039077A3 (fr) | 2002-10-17 |
| US20040114139A1 (en) | 2004-06-17 |
| ATE453104T1 (de) | 2010-01-15 |
| WO2002039077A2 (fr) | 2002-05-16 |
Similar Documents
| Publication | Publication Date | Title |
|---|---|---|
| EP1336084B1 (fr) | Procede d'analyse de spectres d'echelles | |
| EP3891465B1 (fr) | Dispositif de mesure optique | |
| EP1472512B1 (fr) | Procede d'etalonnage en longueur d'onde d'un spectrometre echelle | |
| EP0778459B1 (fr) | Appareil de spectrométrie | |
| EP2516975B1 (fr) | Appareil spectrometrique | |
| DE68913359T2 (de) | Verfahren zur Driftfehlerkompensierung in einem Monochromator. | |
| EP1754032B1 (fr) | Spectrometre-echelle a mise en valeur amelioree du detecteur par l'utilisation de deux ensembles spectrometres | |
| EP2943760B1 (fr) | Spectrometre | |
| WO2008043457A1 (fr) | Unité spectroscopique ultrasensible | |
| DE19961908C2 (de) | Hochauflösendes Littrow-Spektrometer und Verfahren zur quasi-simultanen Bestimmung einer Wellenlänge und eines Linienprofils | |
| DE102016005386B4 (de) | Optomechanisch kompensiertes Spektrometer | |
| EP0442596B1 (fr) | Polychromateur échelle | |
| DD260326B5 (de) | Justierbare echelle-spektrometer-anordnung und verfahren zu dessen justage | |
| DE102017130772B4 (de) | Spektrometeranordnung, Verfahren zur Erzeugung eines zweidimensionalen Spektrums mittels einer solchen | |
| EP1825234B1 (fr) | Procede pour la transmission entierement automatique d'etalonnages entre des spectrometres | |
| DE102015108818B4 (de) | Anordnung zur Spektroskopie und Verfahren zur Herstellung der Anordnung | |
| DE10011462C2 (de) | Optisches Spektrometer mit Astigmatismuskompensation | |
| DE102007046504A1 (de) | Spektrometer | |
| DE102019211665B4 (de) | Verfahren zur Ermittlung eines Gesamtspektrums einer Probe und Verfahren zur Aufnahme eines Gesamtspektrums einer Probe mittels eines Fourier-Transform-Spektrometers | |
| DE102015109340A1 (de) | Spektrometer und Analysevorrichtung | |
| DE10247742B4 (de) | Hochauflösendes Spektrometer | |
| DE102018205857B4 (de) | Vorrichtung zur interferentiellen Abstandsmessung | |
| DE112014007078B4 (de) | Gitterspektrometer mit verbesserter auflösung |
Legal Events
| Date | Code | Title | Description |
|---|---|---|---|
| PUAI | Public reference made under article 153(3) epc to a published international application that has entered the european phase |
Free format text: ORIGINAL CODE: 0009012 |
|
| 17P | Request for examination filed |
Effective date: 20030613 |
|
| AK | Designated contracting states |
Designated state(s): AT BE CH CY DE DK ES FI FR GB GR IE IT LI LU MC NL PT SE TR |
|
| AX | Request for extension of the european patent |
Extension state: AL LT LV MK RO SI |
|
| RAP1 | Party data changed (applicant data changed or rights of an application transferred) |
Owner name: GESELLSCHAFT ZUR FOERDERUNG DER ANALYTISCHEN WISSE Owner name: GESELLSCHAFT ZUR FOERDERUNG ANGEWANDTER OPTIK, O |
|
| 17Q | First examination report despatched |
Effective date: 20060227 |
|
| GRAP | Despatch of communication of intention to grant a patent |
Free format text: ORIGINAL CODE: EPIDOSNIGR1 |
|
| GRAS | Grant fee paid |
Free format text: ORIGINAL CODE: EPIDOSNIGR3 |
|
| GRAA | (expected) grant |
Free format text: ORIGINAL CODE: 0009210 |
|
| AK | Designated contracting states |
Kind code of ref document: B1 Designated state(s): AT BE CH CY DE DK ES FI FR GB GR IE IT LI LU MC NL PT SE TR |
|
| REG | Reference to a national code |
Ref country code: GB Ref legal event code: FG4D Free format text: NOT ENGLISH |
|
| REG | Reference to a national code |
Ref country code: CH Ref legal event code: EP |
|
| REG | Reference to a national code |
Ref country code: IE Ref legal event code: FG4D |
|
| REF | Corresponds to: |
Ref document number: 50115274 Country of ref document: DE Date of ref document: 20100204 Kind code of ref document: P |
|
| PG25 | Lapsed in a contracting state [announced via postgrant information from national office to epo] |
Ref country code: FI Free format text: LAPSE BECAUSE OF FAILURE TO SUBMIT A TRANSLATION OF THE DESCRIPTION OR TO PAY THE FEE WITHIN THE PRESCRIBED TIME-LIMIT Effective date: 20091223 Ref country code: SE Free format text: LAPSE BECAUSE OF FAILURE TO SUBMIT A TRANSLATION OF THE DESCRIPTION OR TO PAY THE FEE WITHIN THE PRESCRIBED TIME-LIMIT Effective date: 20091223 |
|
| REG | Reference to a national code |
Ref country code: NL Ref legal event code: SD Effective date: 20100512 |
|
| PG25 | Lapsed in a contracting state [announced via postgrant information from national office to epo] |
Ref country code: PT Free format text: LAPSE BECAUSE OF FAILURE TO SUBMIT A TRANSLATION OF THE DESCRIPTION OR TO PAY THE FEE WITHIN THE PRESCRIBED TIME-LIMIT Effective date: 20100423 Ref country code: ES Free format text: LAPSE BECAUSE OF FAILURE TO SUBMIT A TRANSLATION OF THE DESCRIPTION OR TO PAY THE FEE WITHIN THE PRESCRIBED TIME-LIMIT Effective date: 20100403 |
|
| REG | Reference to a national code |
Ref country code: FR Ref legal event code: TP |
|
| PG25 | Lapsed in a contracting state [announced via postgrant information from national office to epo] |
Ref country code: GR Free format text: LAPSE BECAUSE OF FAILURE TO SUBMIT A TRANSLATION OF THE DESCRIPTION OR TO PAY THE FEE WITHIN THE PRESCRIBED TIME-LIMIT Effective date: 20100324 Ref country code: CY Free format text: LAPSE BECAUSE OF FAILURE TO SUBMIT A TRANSLATION OF THE DESCRIPTION OR TO PAY THE FEE WITHIN THE PRESCRIBED TIME-LIMIT Effective date: 20091223 |
|
| PLBE | No opposition filed within time limit |
Free format text: ORIGINAL CODE: 0009261 |
|
| STAA | Information on the status of an ep patent application or granted ep patent |
Free format text: STATUS: NO OPPOSITION FILED WITHIN TIME LIMIT |
|
| 26N | No opposition filed |
Effective date: 20100924 |
|
| PG25 | Lapsed in a contracting state [announced via postgrant information from national office to epo] |
Ref country code: DK Free format text: LAPSE BECAUSE OF FAILURE TO SUBMIT A TRANSLATION OF THE DESCRIPTION OR TO PAY THE FEE WITHIN THE PRESCRIBED TIME-LIMIT Effective date: 20091223 |
|
| PG25 | Lapsed in a contracting state [announced via postgrant information from national office to epo] |
Ref country code: IT Free format text: LAPSE BECAUSE OF FAILURE TO SUBMIT A TRANSLATION OF THE DESCRIPTION OR TO PAY THE FEE WITHIN THE PRESCRIBED TIME-LIMIT Effective date: 20091223 |
|
| BERE | Be: lapsed |
Owner name: G.- ZUR FORDERUNG DER ANALYTISCHEN WISSENSCHAFTEN Effective date: 20101130 Owner name: G.- ZUR FORDERUNG ANGEWANDTER OPTIK, OPTOELEKTRON Effective date: 20101130 |
|
| PG25 | Lapsed in a contracting state [announced via postgrant information from national office to epo] |
Ref country code: MC Free format text: LAPSE BECAUSE OF NON-PAYMENT OF DUE FEES Effective date: 20101130 |
|
| REG | Reference to a national code |
Ref country code: CH Ref legal event code: PL |
|
| PG25 | Lapsed in a contracting state [announced via postgrant information from national office to epo] |
Ref country code: LI Free format text: LAPSE BECAUSE OF NON-PAYMENT OF DUE FEES Effective date: 20101130 Ref country code: CH Free format text: LAPSE BECAUSE OF NON-PAYMENT OF DUE FEES Effective date: 20101130 |
|
| PG25 | Lapsed in a contracting state [announced via postgrant information from national office to epo] |
Ref country code: BE Free format text: LAPSE BECAUSE OF NON-PAYMENT OF DUE FEES Effective date: 20101130 |
|
| REG | Reference to a national code |
Ref country code: AT Ref legal event code: MM01 Ref document number: 453104 Country of ref document: AT Kind code of ref document: T Effective date: 20101103 |
|
| PG25 | Lapsed in a contracting state [announced via postgrant information from national office to epo] |
Ref country code: AT Free format text: LAPSE BECAUSE OF NON-PAYMENT OF DUE FEES Effective date: 20101103 |
|
| PG25 | Lapsed in a contracting state [announced via postgrant information from national office to epo] |
Ref country code: LU Free format text: LAPSE BECAUSE OF NON-PAYMENT OF DUE FEES Effective date: 20101103 |
|
| PG25 | Lapsed in a contracting state [announced via postgrant information from national office to epo] |
Ref country code: TR Free format text: LAPSE BECAUSE OF FAILURE TO SUBMIT A TRANSLATION OF THE DESCRIPTION OR TO PAY THE FEE WITHIN THE PRESCRIBED TIME-LIMIT Effective date: 20091223 |
|
| REG | Reference to a national code |
Ref country code: DE Ref legal event code: R082 Ref document number: 50115274 Country of ref document: DE Representative=s name: WEISSE, RENATE, DIPL.-PHYS. DR.-ING., DE |
|
| REG | Reference to a national code |
Ref country code: FR Ref legal event code: PLFP Year of fee payment: 15 |
|
| REG | Reference to a national code |
Ref country code: FR Ref legal event code: PLFP Year of fee payment: 16 |
|
| REG | Reference to a national code |
Ref country code: FR Ref legal event code: PLFP Year of fee payment: 17 |
|
| PGFP | Annual fee paid to national office [announced via postgrant information from national office to epo] |
Ref country code: NL Payment date: 20201125 Year of fee payment: 20 |
|
| PGFP | Annual fee paid to national office [announced via postgrant information from national office to epo] |
Ref country code: GB Payment date: 20201222 Year of fee payment: 20 Ref country code: IE Payment date: 20201130 Year of fee payment: 20 Ref country code: FR Payment date: 20201125 Year of fee payment: 20 |
|
| PGFP | Annual fee paid to national office [announced via postgrant information from national office to epo] |
Ref country code: DE Payment date: 20210125 Year of fee payment: 20 |
|
| REG | Reference to a national code |
Ref country code: DE Ref legal event code: R071 Ref document number: 50115274 Country of ref document: DE Ref country code: NL Ref legal event code: MK Effective date: 20211102 |
|
| REG | Reference to a national code |
Ref country code: GB Ref legal event code: PE20 Expiry date: 20211102 |
|
| REG | Reference to a national code |
Ref country code: IE Ref legal event code: MK9A |
|
| PG25 | Lapsed in a contracting state [announced via postgrant information from national office to epo] |
Ref country code: IE Free format text: LAPSE BECAUSE OF EXPIRATION OF PROTECTION Effective date: 20211103 Ref country code: GB Free format text: LAPSE BECAUSE OF EXPIRATION OF PROTECTION Effective date: 20211102 |