EP1448092B1 - Diaphanoscopie optique et spectroscopie par reflectance pour quantifier le risque de developper une maladie - Google Patents
Diaphanoscopie optique et spectroscopie par reflectance pour quantifier le risque de developper une maladie Download PDFInfo
- Publication number
- EP1448092B1 EP1448092B1 EP02779076A EP02779076A EP1448092B1 EP 1448092 B1 EP1448092 B1 EP 1448092B1 EP 02779076 A EP02779076 A EP 02779076A EP 02779076 A EP02779076 A EP 02779076A EP 1448092 B1 EP1448092 B1 EP 1448092B1
- Authority
- EP
- European Patent Office
- Prior art keywords
- tissue
- disease
- light
- spectral
- spectrum
- Prior art date
- Legal status (The legal status is an assumption and is not a legal conclusion. Google has not performed a legal analysis and makes no representation as to the accuracy of the status listed.)
- Expired - Lifetime
Links
- 201000010099 disease Diseases 0.000 title claims abstract description 68
- 208000037265 diseases, disorders, signs and symptoms Diseases 0.000 title claims abstract description 68
- 230000003287 optical effect Effects 0.000 title description 37
- 238000001055 reflectance spectroscopy Methods 0.000 title description 2
- 238000001228 spectrum Methods 0.000 claims abstract description 106
- 230000003595 spectral effect Effects 0.000 claims abstract description 85
- 238000000034 method Methods 0.000 claims abstract description 55
- 241000124008 Mammalia Species 0.000 claims abstract description 23
- 210000001519 tissue Anatomy 0.000 claims description 127
- 210000000481 breast Anatomy 0.000 claims description 48
- 238000012546 transfer Methods 0.000 claims description 24
- 238000004458 analytical method Methods 0.000 claims description 23
- 238000001514 detection method Methods 0.000 claims description 21
- 208000026310 Breast neoplasm Diseases 0.000 claims description 20
- 206010006187 Breast cancer Diseases 0.000 claims description 19
- 239000000835 fiber Substances 0.000 claims description 11
- 230000001965 increasing effect Effects 0.000 claims description 10
- 238000009607 mammography Methods 0.000 claims description 8
- 230000001419 dependent effect Effects 0.000 claims description 7
- 238000002595 magnetic resonance imaging Methods 0.000 claims description 7
- 238000012545 processing Methods 0.000 claims description 7
- 230000009467 reduction Effects 0.000 claims description 7
- 238000002604 ultrasonography Methods 0.000 claims description 7
- 239000013307 optical fiber Substances 0.000 claims description 6
- 230000036961 partial effect Effects 0.000 claims description 5
- 230000008859 change Effects 0.000 claims description 4
- 208000024827 Alzheimer disease Diseases 0.000 claims description 3
- 208000023275 Autoimmune disease Diseases 0.000 claims description 3
- 201000006417 multiple sclerosis Diseases 0.000 claims description 3
- 230000004770 neurodegeneration Effects 0.000 claims description 3
- 208000015122 neurodegenerative disease Diseases 0.000 claims description 3
- 239000004814 polyurethane Substances 0.000 claims description 3
- 208000018737 Parkinson disease Diseases 0.000 claims description 2
- 208000000236 Prostatic Neoplasms Diseases 0.000 claims description 2
- 208000015634 Rectal Neoplasms Diseases 0.000 claims description 2
- 208000024313 Testicular Neoplasms Diseases 0.000 claims description 2
- 210000003484 anatomy Anatomy 0.000 claims description 2
- 238000002591 computed tomography Methods 0.000 claims description 2
- 238000007408 cone-beam computed tomography Methods 0.000 claims description 2
- 238000000157 electrochemical-induced impedance spectroscopy Methods 0.000 claims description 2
- 229910052736 halogen Inorganic materials 0.000 claims description 2
- 150000002367 halogens Chemical class 0.000 claims description 2
- 230000003100 immobilizing effect Effects 0.000 claims description 2
- 210000002307 prostate Anatomy 0.000 claims description 2
- 206010039073 rheumatoid arthritis Diseases 0.000 claims description 2
- 239000000463 material Substances 0.000 claims 2
- 238000005286 illumination Methods 0.000 claims 1
- 238000005259 measurement Methods 0.000 abstract description 23
- 230000005865 ionizing radiation Effects 0.000 abstract description 6
- 230000002596 correlated effect Effects 0.000 abstract description 2
- 230000009466 transformation Effects 0.000 abstract description 2
- 238000000844 transformation Methods 0.000 abstract description 2
- 238000000513 principal component analysis Methods 0.000 description 28
- 239000013598 vector Substances 0.000 description 22
- 238000012549 training Methods 0.000 description 21
- 238000007781 pre-processing Methods 0.000 description 13
- 238000010521 absorption reaction Methods 0.000 description 12
- 239000000470 constituent Substances 0.000 description 11
- 238000004611 spectroscopical analysis Methods 0.000 description 11
- XLYOFNOQVPJJNP-UHFFFAOYSA-N water Substances O XLYOFNOQVPJJNP-UHFFFAOYSA-N 0.000 description 11
- 238000012502 risk assessment Methods 0.000 description 10
- 206010028980 Neoplasm Diseases 0.000 description 9
- 201000011510 cancer Diseases 0.000 description 9
- 239000011159 matrix material Substances 0.000 description 9
- 238000010200 validation analysis Methods 0.000 description 9
- 238000012937 correction Methods 0.000 description 8
- 150000002632 lipids Chemical class 0.000 description 7
- 238000000149 argon plasma sintering Methods 0.000 description 6
- 238000004422 calculation algorithm Methods 0.000 description 6
- 238000013178 mathematical model Methods 0.000 description 6
- 230000002265 prevention Effects 0.000 description 6
- 238000012360 testing method Methods 0.000 description 6
- 230000005693 optoelectronics Effects 0.000 description 5
- 230000010363 phase shift Effects 0.000 description 5
- 238000003745 diagnosis Methods 0.000 description 4
- 230000004069 differentiation Effects 0.000 description 4
- 229910000530 Gallium indium arsenide Inorganic materials 0.000 description 3
- 235000005911 diet Nutrition 0.000 description 3
- 230000003902 lesion Effects 0.000 description 3
- 229920001690 polydopamine Polymers 0.000 description 3
- 238000011002 quantification Methods 0.000 description 3
- 230000005855 radiation Effects 0.000 description 3
- 230000002829 reductive effect Effects 0.000 description 3
- 238000012216 screening Methods 0.000 description 3
- 230000035945 sensitivity Effects 0.000 description 3
- 239000000126 substance Substances 0.000 description 3
- 102000001554 Hemoglobins Human genes 0.000 description 2
- 108010054147 Hemoglobins Proteins 0.000 description 2
- 238000001069 Raman spectroscopy Methods 0.000 description 2
- 238000000862 absorption spectrum Methods 0.000 description 2
- 238000013459 approach Methods 0.000 description 2
- 230000002146 bilateral effect Effects 0.000 description 2
- 239000000090 biomarker Substances 0.000 description 2
- 239000008280 blood Substances 0.000 description 2
- 210000004369 blood Anatomy 0.000 description 2
- 238000007621 cluster analysis Methods 0.000 description 2
- 238000009795 derivation Methods 0.000 description 2
- 238000010586 diagram Methods 0.000 description 2
- 230000037213 diet Effects 0.000 description 2
- 230000000694 effects Effects 0.000 description 2
- 210000000981 epithelium Anatomy 0.000 description 2
- 238000003384 imaging method Methods 0.000 description 2
- 230000001976 improved effect Effects 0.000 description 2
- 239000007788 liquid Substances 0.000 description 2
- 230000003211 malignant effect Effects 0.000 description 2
- 210000000056 organ Anatomy 0.000 description 2
- 229920002635 polyurethane Polymers 0.000 description 2
- 238000012628 principal component regression Methods 0.000 description 2
- 238000000611 regression analysis Methods 0.000 description 2
- 230000000284 resting effect Effects 0.000 description 2
- 238000012935 Averaging Methods 0.000 description 1
- 208000009458 Carcinoma in Situ Diseases 0.000 description 1
- 206010058314 Dysplasia Diseases 0.000 description 1
- 241000282412 Homo Species 0.000 description 1
- XUIMIQQOPSSXEZ-UHFFFAOYSA-N Silicon Chemical compound [Si] XUIMIQQOPSSXEZ-UHFFFAOYSA-N 0.000 description 1
- 238000002441 X-ray diffraction Methods 0.000 description 1
- 230000002159 abnormal effect Effects 0.000 description 1
- 210000000577 adipose tissue Anatomy 0.000 description 1
- 230000003466 anti-cipated effect Effects 0.000 description 1
- 230000003190 augmentative effect Effects 0.000 description 1
- 230000009286 beneficial effect Effects 0.000 description 1
- 230000008901 benefit Effects 0.000 description 1
- 230000005540 biological transmission Effects 0.000 description 1
- 210000004556 brain Anatomy 0.000 description 1
- 230000001413 cellular effect Effects 0.000 description 1
- 239000003795 chemical substances by application Substances 0.000 description 1
- 230000002113 chemopreventative effect Effects 0.000 description 1
- 230000001684 chronic effect Effects 0.000 description 1
- 230000006835 compression Effects 0.000 description 1
- 238000007906 compression Methods 0.000 description 1
- 238000001816 cooling Methods 0.000 description 1
- 238000010219 correlation analysis Methods 0.000 description 1
- 238000002790 cross-validation Methods 0.000 description 1
- 238000000354 decomposition reaction Methods 0.000 description 1
- 230000003111 delayed effect Effects 0.000 description 1
- 238000011161 development Methods 0.000 description 1
- 230000018109 developmental process Effects 0.000 description 1
- 238000002405 diagnostic procedure Methods 0.000 description 1
- 235000021045 dietary change Nutrition 0.000 description 1
- 230000000378 dietary effect Effects 0.000 description 1
- 238000004141 dimensional analysis Methods 0.000 description 1
- 208000022602 disease susceptibility Diseases 0.000 description 1
- 238000005516 engineering process Methods 0.000 description 1
- 238000002795 fluorescence method Methods 0.000 description 1
- PCHJSUWPFVWCPO-UHFFFAOYSA-N gold Chemical compound [Au] PCHJSUWPFVWCPO-UHFFFAOYSA-N 0.000 description 1
- 239000010931 gold Substances 0.000 description 1
- 229910052737 gold Inorganic materials 0.000 description 1
- 230000036541 health Effects 0.000 description 1
- 201000004933 in situ carcinoma Diseases 0.000 description 1
- 238000001727 in vivo Methods 0.000 description 1
- 230000001939 inductive effect Effects 0.000 description 1
- 230000031700 light absorption Effects 0.000 description 1
- 230000000670 limiting effect Effects 0.000 description 1
- 235000008528 macronutrient intake Nutrition 0.000 description 1
- 239000003550 marker Substances 0.000 description 1
- 230000000873 masking effect Effects 0.000 description 1
- 230000009245 menopause Effects 0.000 description 1
- 239000000203 mixture Substances 0.000 description 1
- 238000012544 monitoring process Methods 0.000 description 1
- 210000003205 muscle Anatomy 0.000 description 1
- 238000010606 normalization Methods 0.000 description 1
- 238000012634 optical imaging Methods 0.000 description 1
- 230000027758 ovulation cycle Effects 0.000 description 1
- 230000001575 pathological effect Effects 0.000 description 1
- 230000000886 photobiology Effects 0.000 description 1
- 230000000704 physical effect Effects 0.000 description 1
- 239000004033 plastic Substances 0.000 description 1
- 229920003023 plastic Polymers 0.000 description 1
- 230000005180 public health Effects 0.000 description 1
- 238000011160 research Methods 0.000 description 1
- 230000004044 response Effects 0.000 description 1
- 229910052710 silicon Inorganic materials 0.000 description 1
- 239000010703 silicon Substances 0.000 description 1
- 208000017520 skin disease Diseases 0.000 description 1
- 239000007787 solid Substances 0.000 description 1
- 238000010183 spectrum analysis Methods 0.000 description 1
- 230000008093 supporting effect Effects 0.000 description 1
- 230000006032 tissue transformation Effects 0.000 description 1
- 238000002834 transmittance Methods 0.000 description 1
- 230000002792 vascular Effects 0.000 description 1
- 210000001835 viscera Anatomy 0.000 description 1
Images



Classifications
-
- A—HUMAN NECESSITIES
- A61—MEDICAL OR VETERINARY SCIENCE; HYGIENE
- A61B—DIAGNOSIS; SURGERY; IDENTIFICATION
- A61B5/00—Measuring for diagnostic purposes; Identification of persons
- A61B5/43—Detecting, measuring or recording for evaluating the reproductive systems
- A61B5/4306—Detecting, measuring or recording for evaluating the reproductive systems for evaluating the female reproductive systems, e.g. gynaecological evaluations
- A61B5/4312—Breast evaluation or disorder diagnosis
-
- A—HUMAN NECESSITIES
- A61—MEDICAL OR VETERINARY SCIENCE; HYGIENE
- A61B—DIAGNOSIS; SURGERY; IDENTIFICATION
- A61B5/00—Measuring for diagnostic purposes; Identification of persons
- A61B5/0059—Measuring for diagnostic purposes; Identification of persons using light, e.g. diagnosis by transillumination, diascopy, fluorescence
- A61B5/0082—Measuring for diagnostic purposes; Identification of persons using light, e.g. diagnosis by transillumination, diascopy, fluorescence adapted for particular medical purposes
- A61B5/0091—Measuring for diagnostic purposes; Identification of persons using light, e.g. diagnosis by transillumination, diascopy, fluorescence adapted for particular medical purposes for mammography
Definitions
- the present invention relates to the use of optical transillumination/reflectance spectroscopy as a diagnostic for determination of the risk for diseases.
- Non-ionizing radiation was employed in various optical mammography approaches, usually in attempts to image the breast, and to detect breast lesions (5,6) commonly using frequency domain technologies at only a few specialized wavelengths, or as spectroscopic approaches for the determining the tissue optical properties of normal versus malignant breast tissue (7).
- These spectroscopic applications including an article by Egan and Dolen (8) are rather intended for determination of the probability for the presence of cancer, but do not address the concept of risk assessment, e.g. as a pre-screening tool.
- United States Patent No. 6,121,775 is directed to an MRI imaging method and apparatus and provides a physical interrogation methods related to detecting small changes in tissue.
- United States Patent No. 5,079,698 is directed to a transillumination method and apparatus for the diagnosis of breast tumors and other breast lesions by normalization of an electronic image of the breast.
- Unites States Patent No. 6,002,958 is directed to a method and apparatus for diagnostics of internal organs. This patent teaches the use of NIR radiation in the 0.6-1.5 um wavelength range and adds ultrasound to the analysis tools. These two patents specifically create images of the organ
- United States Patent No. 6,095,982 discloses a spectroscopic method and apparatus for optically detecting abnormal mammalian epithelial tissue' covers only Raman and fluorescence methods.
- United States Patent No. 6,069,689 discloses an apparatus and methods relating to optical systems for diagnosis of skin diseases while very generally written and addressing, reflectance, fluorescence and Raman, using a plurality of light emitting diodes. While some changes in the tissue (skin) are mentioned the idea of risk assessment is not included in this or any other patent related to the use of non-ionizing radiation.
- the present invention uses spectroscopic tissue volume measurements using non-ionizing radiation to detect pre-disease transformations in the tissue, which increase the individuals risk for this disease.
- a method for assessing susceptibility of a mammal, free of a pre-selected disease for developing a pre-selected disease comprising:
- an apparatus for assessing susceptibility of a mammal, free of a preselected disease, for developing a pre-selected disease comprising:
- Spectra can be corrected for the wavelength dependent transfer function of the instrument and the physical interoptode distance. It will be understood that this is not required as it can also be convoluted into the numerical correlation analysis.
- the optical fibre 14, the tissue support and the optical fibre bundle is optional.
- the wavelength selective device can be either prior to or post the interrogated tissue.
- the light source 12 was a 12 Watt halogen lamp (Welch Allyn) with stabilized power supply serving as a broadband light source.
- the ultraviolet to green and mid infrared radiation were eliminated using a cut-off filter (at 500 nm) and a heat filter, respectively.
- the remaining light was coupled into a 5mm diameter liquid light guide, which served as the source fiber in contact with the skin on the top of the breast.
- the holder of the source fiber and the plate in which the detector fiber was embedded were made of black plastic to absorb reemitted photons .
- the source fiber was in firm contact with the tissue and slightly compressed it by 5mm.
- the source and detector fibers were held coaxially, pointing towards each other, via a custom-made calliper attached to the resting platform.
- the calliper allowed the measurement of the inter-optode distance (cm) and hence, the physical thickness of the interrogated tissue.
- Transmitted light was collected via a custom-made 7 mm diameter fiber bundle (P&P Optical Kitchener, Ontario, Canada).
- Wavelength resolved detection in the visible-near infrared was achieved using a holographic transillumination grating (15.7 rules/mm blazed at 850 nm) (Kaiser, California, USA) and a 2D, cryogenically-cooled silicon CCD (Photometrics, New Jersey, USA) at a spectral resolution of less than 3 nm between 625 nm and 1060 nm. This spectral resolution was achieved by positioning a 0.5 mm slit between the distal end of the collection fiber and the spectral grating. The peak quantum efficiency (>0.8) of the detector was at 780 nm, falling to 0.2 at 1100 nm.
- a wavelength dispersing medium in the preferred embodiment a grating
- an opto-electronic detector here a Si based (0.65 ⁇ m to 1.5 ⁇ m) photodiode array (PDAs)
- PDAs photodiode array
- the PDA's information is transferred directly or delayed to the computer containing a numerical analysis program to quantify the disease risk using a previously trained algorithm.
- the correlation between spectral data and disease risk is based on the spectral attenuation, through photon absorption and scattering, only.
- the particular disease risk assessment system comprises in its current version a continuous optical spectrum with wavelength in the 550 nm to 1000 nm range.
- Different embodiments of the apparatus may include an InGaAs based (0.9 ⁇ m to 1.7 ⁇ m), or equivalent opto-electronic detector to cover also the longer wavelength range which is transmitted through tissue, or can comprise also only various wavelengths or wavelength bands within the VIS/NIR range, such as attainable with filters of direct emission devices with limited bandwidth such as laser, LED or similar.
- InGaAs based 0.9 ⁇ m to 1.7 ⁇ m
- equivalent opto-electronic detector to cover also the longer wavelength range which is transmitted through tissue, or can comprise also only various wavelengths or wavelength bands within the VIS/NIR range, such as attainable with filters of direct emission devices with limited bandwidth such as laser, LED or similar.
- the apparatus there is included at least a single (whereas three is preferred) wavelength, frequency domain transillumination system, spanning most of the steady state wavelength range for transillumination.
- the three wavelengths may be 785, 808, 905 nm.
- the lasers in the frequency domain system need to be modulated between 10 to 400 MHz (215MHz in the present system) to obtain a good phase shift resolution for 5 cm physical pathlength between delivery and detection optode.
- the system should provide a phase shift resolution of better than 2°.
- the lasers used here provide ⁇ 200 mW average power at the distal end of the delivery fibers in contact with the patient.
- Intensity modulation is achieved by modulating the driving current of the lasers via a biased-T, a method to recapture the transmitted light and guide it to the PMT with fast time response, a preamplifier filtered to the appropriate modulation frequency, a lock-in detection to quantify the demodulation and the phase shift compared to a standard either from the laser driver current or a portion of the light prior to entering the tissue, and a data transfer system to a computer to translate the phase shift and demodulation data into a differential path length factor and scattering coefficient.
- various modi operandi can be employed one being heterodyne detection technique, which can use also very lower power lasers.
- Other methods to quantify the optical pathlength are described (10, 11) and include time resolved detection or time resolved single photon detection.
- the ability to quantify disease risk and hence the population members at risk can be increased through additional measurements such as skin reflectance measurements to be able to subtract the skin contribution to the optical transillumination spectrum, so clearly this information may not be required.
- additional components such as anatomical supports may be included, for example if the breasts are being studied, a support stand for the breast, and a holder for the liquid light guide and optical fibres for light delivery, and a random fibre bundle for light collection.
- the latter may be a trifurcated fibre bundle to deliver transmitted photons to the PMT (frequency domain measurements), Si-based and InGaAs-based PDAs respectively.
- the spectral volume measurements can be augmented by adding extended long wavelength (comprising the NIR range transmitted through tissue, e.g. up to 1.7 ⁇ m) and frequency domain measurements.
- extended long wavelength comprising the NIR range transmitted through tissue, e.g. up to 1.7 ⁇ m
- frequency domain measurements comprising the NIR range transmitted through tissue, e.g. up to 1.7 ⁇ m
- the former providing more information about vibrational bands of the biomolecules in the interrogated volume.
- the latter enables by using a limited number of wavelengths (3 or more), to determine the differential pathlength factors of the tissue (6). Combining this with the transillumination spectra allows one to obtain absolute absorption spectra and subsequently derivation of the contributions of various chromophores responsible for the absorption spectra measured providing additional information for the identification of the population at risk and also insight into the molecular changes associated with or resulting from the tissue transformation.
- component spectra that resemble the constituent spectra within the sample, and can later be used to predict the concentrations of constituents from new sample spectra.
- these component spectra may not have direct physical meaning but can represent the spectral features of the pure constituent spectra.
- Correlation between the x-ray mammography and the spectral transillumination information can be established and quantified by a variety of different numerical methods, among which are principal component analysis or linear discriminate analysis when the breast density based on mammographic analysis is provided as classification (nominal data) or using partial least squares or principle component regression when the mammographic analysis is provided as % dense tissue (interval data).
- principal component analysis or linear discriminate analysis when the breast density based on mammographic analysis is provided as classification (nominal data) or using partial least squares or principle component regression when the mammographic analysis is provided as % dense tissue (interval data).
- other methods which may be used to obtain the parenchymal breast tissue density may include ultrasound, computed tomography, cone beam computed tomography, electrical impedance spectroscopy and magnetic resonance imaging.
- PCA Principal Component Analysis
- LDA Linear Discriminant Analysis
- PCA is optimized for comparison of vectors with nominal data, in this case correlating spectra to the density classification, thereby making use of the complete spectral information while reducing the dataset size. For this, PCA determines the amount of variance within the test group of spectra and uses it to iteratively reduce the dataset to representative spectra, called components.
- the spectral data are represented by a smaller number of vectors in a lower dimensional space while still including the maximum amount of variance within the data set. (15).
- the scores can be graphically plotted against one another to show any potential clustering of spectra that are related.
- PCA was calculated on the test set (2/3 of available spectra) and the same mathematical model, e.g. retaining the p i was used to predict the scores t i on the validation set (1/3 spectra).
- LDA Linear Discriminant Analysis
- HDM high density measure
- LDM low density measure
- PCA LDA Input data Spectral vector Requires PCA scores as input Result space size e.g. classifications Undefined since # of PC's is undefined Defined by training procedures Data reduction Vector->scalar Scalar->scalar Training or Density readings needed No Yes Presentation of output data Relationship of scalars by cluster analysis Relationship of scalars by categories or cluster analysis What variance is used Those captured in principal components The variance between the defined groups Additional output information Component vectors contain physical meaning Discriminant rule no apparent physical meaning
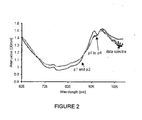
- Figure 2 shows a reconstruction of an experimentally obtained spectrum by either only two or four principle components.
- PCR and PLS are analysis techniques are optimized for comparison of vector inputs with interval target data. For this case the spectra are compared to the percent density readings. Statistical significance was established using the Pearson correlation coefficient as well as the slope and intercept of the regression line. Both PCR and PLS analysis require training and perform regression analysis on the dataset, but use different types of variance identification to predict the target variable, in this study the percent density read from the mammogram, see Table 2.
- the regression vector b is the least squares solution for T, where T are scores from the PCA and T is a ( n x k) matrix, where n is the number of spectra and k is the number of factors used in the model.
- Y is the ( n x 1) vector of targets, in this case percent density of the region of interest of the mammogram (17).
- W is a weighting vector that relates the target set (prediction values) with the variance in the dataset during the decomposition into factors.
- b is used in subsequent predictions of spectra.
- This b vector is selected by calculating the predicted residual error sum of squares (PRESS) value for each b i using the training set.
- the chosen b vector has the fewest number of iterations (lowest value of i ) and the lowest PRESS value when the training set is used to establish the model.
- Table 2 Properties of Principal Component Regression and Partial Least Squares Analysis.
- PRESS values were calculated for both PCR and PLS for the training sets, using the built-in cross-validation function in Matlab 6.0 PLS toolbox.
- the b vector with the lowest PRESS value was selected.
- the training set was randomized and split into four sections, the respective algorithms were then trained by a Venetian blind method with four repeats.
- the subsequent b vectors were then averaged and used to predict the tissue density for entire training set and subsequently the validation set.
- Transillumination spectroscopy measurements were taken in a dark room with the volunteer seated comfortably, and the breast resting on a horizontal support ( Figure 1 ). Total data acquisition time was approximately 15 minutes allowing measurements at all 8 positions and necessary repositioning of the optodes. There was little discomfort to the volunteers due to point compression of the breast by the source optode.
- Figure 3 shows an example of a typical set of measurements comprised of eight spectra from the volunteer. Spectra from the respective bilateral positions of the breast show symmetry, as expected in women with healthy breast tissue. In previous studies, this criterion of spectral symmetry in the same position of both breasts was used, by Egan and Dolan, to indicate absence of breast cancer in the examined areas (8). The reproducibility of the optical transillumination measurements within one visit was analyzed by recruiting a volunteer to undergo multiple procedures.
- spectra were collected per volunteer representing the four quadrants (medial, distal, lateral and central) of both breasts. These spectra can be further pre-processed by correcting for tissue thickness (OD/cm) and/or auto-scaling prior to development and testing of the mathematical models used to then correlate with tissue density. In general for Principal Component Analysis and similar models, scaling is used if the input variables have different units or if there are large deviations in some input variables compared to other variables within the data set.
- HDM high density measure
- LDM low density measure
- HDM was used to assess the quality of the prediction model defined as the ratio of women predicted to have high density tissue to those who were categorized as having high tissue density by the radiologist.
- LDM is a measure of the ability to correctly identify those spectra that do not have high density.
- Figure 4 shows the correlation of the t 1 and t 2 scores from the spectra that were repeatedly measured.
- Figure 4 also shows acceptable reproducibility with slopes of the regression and the R 2 values close to one. There is a spread in the component scores ( t 1 and t 2 ), but there is a clustering of the position related data.
- the cluster plot of the scores for t 1 and t 2 is shown in Figure 6 . This plot illustrates discrimination of the breast tissue areas across a diagonal line in the t 1 vs. t 2 space.
- Non-thickness corrected spectra were used to determine the effect of thickness on the robustness of the PCA model prediction.
- the component spectra for p 1 - p 4 are very similar to the thickness-corrected component plot; see Figures 5 and 7 respectively.
- the t 1 vs. t 2 plot, Figure 8 for this data shows discrimination as a function of t 2 only.
- component spectra can be seen in Figure 9 for thickness and transfer function corrected data that were additionally autoscaled, with the t 1 vs. t 2 cluster plot shown in Figure 10 .
- the scores for both t 1 and t 2 are centered on zero as expected but show similar clusters as Figure 8 .
- HDM and LDM were determined to compare which spectral pre-processing option best differentiates the high and low density spectra in cluster plots according to Figure 6 , 8 and 10 .
- HDM and LDM data shown in the Table 4 were calculated from the same training and validation data sets separately.
- Table 4 HDM and LDM of Principal Component Analysis results for test and validation set measurements.
- the scores t 1 and t 2 resulting from thickness corrected and non - corrected component spectra demonstrated that it is possible to differentiate between the subjects having low or high breast tissue density subjects ( Figures 8 and 10 ). While mathematical models derived for thickness or non-thickness corrected optical spectra differentiate high and low breast tissue densities, their t 1 vs. t 2 cluster plots differ. One explanation for the difference in the thickness corrected vs. non-corrected cluster plots is the effect of the physical tissue thickness on the overall variance within the spectral data set and therefore the determination of the components by the PCA algorithm. Thickness of the tissue contributes non-uniformly to individual spectra as larger breasts tend to contain more fatty tissue.
- p 1 did not differentiate between high and low density tissue. This can also be seen in the magnitude of the t 1 in Figure 5 versus the non-thickness corrected component spectra in Figure 7 . This indicates that the thickness values contribute to the magnitude of p 1 masking other contributions that do differentiate between tissue densities, such as light scattering. This leaves t 2 as the only component to preserve information to distinguish the density of the breast.
- Component spectra 1 ( p 1 ) and 2 ( p 2 ) are the most important cover the highest amount of variance in the data set. While components 3 and 4 have similar or inverse shape as component 2 they take less variance into account.
- Principal component 1 ( p 1 ) has a small dependence on wavelength and has negative values in each prepared model.
- the spectrally flat characteristics resulting from thickness corrected spectra can be attributed to attenuation due to absorption, scattering, and, therefore optical pathlength and losses at the tissue boundary.
- the surprisingly flat spectral shape of the scattering contribution is due to the derivation of OD used here, based on the wavelength dependent transfer function calibration by a polyurethane block which exhibits also high Mie scattering, e.g. Mie scattering is present in the spectrum and hence cancels itself out.
- p 1 carries optical pathlength information despite not showing the typical ⁇ -1 dependency, (18) but contains information to determine breast density through the overall scattering power.
- the other component enabling differentiation between low and high tissue densities p2, has a more complex shape when compared to p1.
- haemoglobin Spectral feature contributions by haemoglobin can be seen between 625 and 850 nm within p 2 where the negative slope and inflection points of the haemoglobin curve are apparent.
- Dense breast tissue has large negative scores ( t 2 ) compared to the low density tissue.
- Haemoglobin contributes to the variance in p 2 , with elevated contribution of blood related absorption for high water absorption seen in the higher density tissue. This simultaneous appearance of water and haemoglobin absorption can be explained physiologically, as tissues with higher water content and hence cellular content, require improved vascular supply and, thereby, increased blood volume.
- Figure 13 shows an example of representing the parenchymal tissue density on an interval scale (% dense area in the mammogram) rather than a nominal scale (low, medium, high density).
- the % dense area can be determined using a computer assisted imaging program by a trained observer such as for example a radiologist. In the case presented here no trained person was utilized and hence the percent density from the mammograms contained a large error in the repeat measure which ultimately limits the accuracy of the presented correlation. However, it serves to indicate that the variance reduction programs employed are capable of providing a single integer number to the physician monitoring his patients' health.
- transillumination spectroscopy is a technically feasible method and capable of predicting breast tissue densities with acceptable correlation to mammographic densities as an indirect method of cancer risk assessment.
- transillumination spectroscopy may offer a novel "first step" in the risk assessment of healthy women regardless of menstrual cycle, age, ethnic background or menopausal status as the data here was not stratified by either event.
- HDM and LDM values close to or above 90 % are encouraging to distinguish between low and high density tissues. These HDM and LDM values are higher compared with other physical examinations, such as ultrasound (23) and magnetic resonance imaging, (21) reported to be between 70-80 %.
- Optical transillumination spectroscopy offers the potential of a real-time and cost-effective method compared with ultrasound and has the ability to quantify a large range of tissue densities for breasts that are up to 6 cm in thickness.
- An added advantage of transillumination spectroscopy over ultrasound and MRI is the fact that results are derived from preset mathematical models and, hence, no additional highly trained personnel are required for assessment. This reduces the overall cost to the healthcare system for this risk-assessment technique. A painless procedure and the inherent safety of this method will likely contribute to a high compliance rate.
- X-ray mammography uses ionizing radiation and is considered unacceptable as a tool to assess breast density for women less than forty years of age and for frequent measurement.
- transillumination spectroscopy is safe for women of all ages. This allows risk assessment to commence at a much younger age when the life style and diet are perhaps easier to influence have more time to exert their beneficial effects to reduce the risk and could ultimately lead to reduced incidence rates.
- optical transillumination spectroscopy is a promising tool to monitor the effectiveness of chemopreventive, dietary or lifestyle studies for the reduction of breast cancer risk, its ability to detect physical changes over a period of time in the breast tissue of a given individual needs to be demonstrated in a prospective longitudinal study.
- the predictive value of optical spectroscopy for disease susceptibility quantification can be increased through additional measurements which can include extending the optical waveband, obtain optical information of interrogated tissue not contributing to the disease risk and obtaining information separately for light scattering.
- the first option includes the use of wavelength up to 1.7 ⁇ m which contain among others additional water and lipid absorption bands using an InGaAs based opto-electronic detector or an equivalent system. This is particular of interest for large tissue volumes. If the optically interrogated tissue volume is small, that is in the range of several mm 3 , the short wavelength band using light of approximately 360 nm to 600 nm may provide the relevant information.
- frequency or time domain reflectance and transillumination measurements can provide an effective optical path length through phase shift or lifetime measurements.
- the optical path length relative to the physical path length between the optodes is related to the light scattering power of the tissue.
- Figure 15 shows an example of an embodiment of a system comprised of three diode lasers to measure the breast tissue light scattering power. The remaining part of the spectrum can be interpolated as shown in the paper by Cerussi et al (24).
- the present method and apparatus disclosed herein has been exemplified using breast cancer as the disease of interest which involves correlating the associated scalar coefficient of the basis spectral component(s) with the pre-selected property of parenchymal breast tissue density known to be indicative of susceptibility of breast tissue for breast cancer.
- this invention is not restricted to use in assessing risk for breast cancer but many other diseases as well.
- the method disclosed herein is contemplated to be applicable for correlating optical information of other mammalian tissue with risk factors associated with diseases such as neurodegenerative diseases including Multiple Sclerosis, Alzheimer's and Parkinson's diseases; oncology including, prostate, rectal and testicular cancers, autoimmune diseases including Sinustisus, rheumatoid arthritis, and Chron's disease.
- the relevant tissues are optically sampled and the basis spectral component(s) are obtained using other techniques such as ultrasound, X-ray analysis, magnetic resonance imaging, potential molecular markers indicating initial changes in the tissue, or epidemiologically derived questionnaires proven to correlate with the disease of interest as just a couple of examples.
- the present invention is applicable to mammals in general and is not restricted to humans.
- the terms “comprises”, “comprising”, “includes” and “including” are to be construed as being inclusive and open ended, and not exclusive. Specifically, when used in this specification including claims, the terms “comprises”, “comprising”, “includes” and “including” and variations thereof mean the specified features, steps or components are included. These terms are not to be interpreted to exclude the presence of other features, steps or components.
Landscapes
- Health & Medical Sciences (AREA)
- Life Sciences & Earth Sciences (AREA)
- Surgery (AREA)
- Biophysics (AREA)
- Pathology (AREA)
- Engineering & Computer Science (AREA)
- Biomedical Technology (AREA)
- Heart & Thoracic Surgery (AREA)
- Medical Informatics (AREA)
- Molecular Biology (AREA)
- Physics & Mathematics (AREA)
- Animal Behavior & Ethology (AREA)
- General Health & Medical Sciences (AREA)
- Public Health (AREA)
- Veterinary Medicine (AREA)
- Gynecology & Obstetrics (AREA)
- Reproductive Health (AREA)
- Investigating Or Analysing Materials By Optical Means (AREA)
- Glass Compositions (AREA)
- Endoscopes (AREA)
Claims (25)
- Procédé pour évaluer la prédisposition d'un mammifère, exempt d'une maladie prédéterminée à développer cette maladie comprenant les étapes consistant à :a) irradier un volume de tissu exempt de la maladie prédéterminée d'un mammifère avec de la lumière ayant des longueurs d'onde couvrant une plage spectrale prédéterminée,b) détecter la lumière transmise au travers ou réfléchie par ce volume de tissu exempt de la maladie prédéterminée, et obtenir un spectre de la lumière ainsi détectée,c) représenter le spectre de la lumière détectée par un ensemble de composants spectraux de base, un terme d'erreur et un coefficient scalaire associé à chacun des composants spectraux de base de l'ensemble, l'ensemble de composants spectraux de base renfermant au moins un composant spectral de base, le coefficient scalaire associé à chacun des composants spectraux de base étant calculé en minimisant le terme d'erreur, etd) établir une corrélation entre les coefficients scalaires associés à chaque composant spectral de base et une propriété prédéterminée du tissu choisi connue pour être indicatrice de la prédisposition du tissu exempt de maladie à la maladie prédéterminée de façon à obtenir la prédisposition du mammifère à développer la maladie prédéfinie.
- Procédé conforme à la revendication 1,
selon lequel
l'ensemble de composants spectraux de base est obtenu par les étapes consistant à :- obtenir une plage de valeurs de la propriété prédéterminée à partir d'un échantillon de population qui est représentatif de la population de mammifère dans son ensemble, mais qui n'exprime pas la maladie prédéterminée,- pour chacun des mammifères membres de cet échantillon de population, obtenir au moins un spectre en irradiant un volume de tissu choisi avec de la lumière ayant des longueurs d'onde couvrant la plage spectrale prédéterminée et détecter la lumière transmise au travers ou réfléchie par le volume de tissu choisi,- extraire des éléments de spectre communs du ou des spectre(s) de chacun des membres de cet échantillon de population et produire au moins un ensemble de spectres de composants à partir des éléments de spectres communs extraits, le ou les ensemble(s) de spectres de composants comportant au moins un spectre de composants,- identifier un ensemble de spectres de composants qui donne la valeur de prédiction la plus élevée pour la propriété déterminée du tissu choisi connue pour être indicatrice de la prédisposition à la maladie prédéterminée, et- utiliser cet ensemble de spectres de composants qui donne la valeur de prédiction la plus élevée pour la propriété prédéterminée du tissu choisi connue pour être indicatrice de la prédisposition à la maladie prédéterminée en tant qu'ensemble de composants spectraux de base dans l'étape c) de la revendication 1. - Procédé conforme à la revendication 1 ou 2,
selon lequel
l'étape consistant à extraire les éléments de spectre communs du ou des spectre(s) de chacun des membres de l'échantillon de population et à produire au moins un ensemble de spectres de composants à partir des éléments de spectre communs extraits comporte l'utilisation de l'analyse en composante principale, l'analyse de régression des moindres carrés partiels (PLS) et la régression en composantes principales. - Procédé conforme à l'une des revendications précédentes,
selon lequel
l'étape de calcul du coefficient scalaire associé en minimisant le terme d'erreur comporte l'utilisation de l'ajustement du chi carré pour réduire le terme d'erreur au minimum. - Procédé conforme à l'une des revendications précédentes, comportant la répétition périodique des étapes a) à d) incluse pour un mammifère particulier, pendant une période prédéterminée de durée de vie du mammifère et la mise en mémoire des prédispositions calculées périodiquement pour détecter un taux de modification de la prédisposition correspondant à un risque augmenté pour la maladie prédéterminée.
- Procédé conforme à l'une des revendications précédentes,
selon lequel
le mammifère est une femelle humaine post-pubère, la maladie prédéterminée est le cancer du sein, et la propriété prédéterminée est la densité du tissu parenchymal mammaire. - Procédé conforme à la revendication 6,
selon lequel
la densité du tissu mammaire est mesurée par l'une des techniques suivantes :
mammographie aux rayons X, ultrasons, tomographie calculée, tomographie calculée à faisceau conique, spectroscopie d'impédance électrique et imagerie par résonnance magnétique. - Procédé conforme à la revendication 1,
selon lequel
le spectre de la lumière détectée est un spectre continu. - Procédé conforme aux revendications précédentes,
selon lequel
le spectre de la lumière détectée est un spectre discret. - Procédé conforme à l'une des revendications 1 à 8,
selon lequel
l'étape d'irradiation d'un volume de tissu choisi d'un mammifère avec de la lumière ayant des longueurs d'onde couvrant une plage spectrale prédéterminée, comporte une étape d'irradiation avec une bande de lumière large, des longueurs d'onde discrètes ou des bandes de longueurs d'onde. - Procédé conforme à l'une des revendications précédentes,
selon lequel
les étapes consistant à irradier un volume de tissu choisi et à détecter la lumière transmise au travers ou réfléchie par ce volume de tissu choisi, comportent une étape d'ajustement d'un angle et d'une distance entre une position sur la surface du tissu qui est irradiée et une position sur cette surface où la lumière transmise ou réfléchie, provenant de celle-ci est détectée. - Procédé conforme à l'une des revendications précédentes,
selon lequel
la maladie prédéterminée est choisie dans le groupe formé par les maladies neurodégénératives, les maladies du domaine de l'oncologie et les maladies auto-immunes. - Procédé conforme à la revendication 12,
selon lequel
les maladies neurodégénératives renferment la sclérose multiple, les maladies d'Alzheimer et de Parkinson, selon lequel les maladies du domaine de l'oncologie renferment les cancers de la prostate, du rectum et des testicules, et selon lequel les maladies auto-immunes renferment le sinustisus, l'arthrite rhumatoïde et la maladie de Chron. - Procédé conforme à la revendication 2,
selon lequel
l'ensemble de composants spectraux de base renferme au moins deux spectres de composants. - Procédé conforme à la revendications 1,
selon lequel
l'étape d) comporte une étape consistant à utiliser un modèle mathématique effectif de réduction de variance pour identifier les composants spectraux de base qui révèlent, à partir du coefficient scalaire associé, la meilleure corrélation avec la propriété prédéterminée du tissu choisi connue pour être indicatrice de la prédisposition du tissu à développer la maladie présélectionnée. - Appareil d'évaluation optique de la prédisposition d'un mammifère exempt d'une maladie prédéterminée à développer cette maladie comprenant :a) des moyens de maintien pour maintenir et immobiliser une partie de l'anatomie d'un mammifère contenant un tissu exempt de la maladie devant être analysé optiquement,b) des moyens de source lumineuse pour irradier un volume du tissu choisi d'un mammifère avec de la lumière ayant des longueurs d'onde couvrant une plage spectrale prédéterminée,c) des moyens de détection de la lumière transmise au travers ou réfléchie par ce volume de tissu choisi exempt de la maladie,d) des moyens de commande par calculateur reliés aux moyens de détection pour produire un spectre de la lumière détectée à la sortie des moyens de détection, ces moyens de commande par ordinateur comportant des moyens de traitement pour représenter le spectre de lumière détectée par un ensemble de composants spectraux de base, un terme d'erreur et un coefficient scalaire associé à chacun des composants spectraux dans cet ensemble, l'ensemble de composants spectraux de base renfermant au moins un composant spectral de base, le coefficient scalaire associé à chacun des composants spectraux de base, étant calculé en minimisant le terme d'erreur, les moyens de traitement comportant des moyens pour établir une corrélation entre le coefficient scalaire associé à chaque composant spectral de base et une propriété prédéterminée du tissu choisi connue pour être indicatrice de la prédisposition du tissu exempt de maladie à la maladie présélectionnée de façon à obtenir la prédisposition du mammifère à développer la maladie prédéterminée, les moyens de commande par ordinateur comportant des moyens d'affichage pour afficher la prédisposition.
- Appareil conforme à la revendication 16, dans lequel- les moyens de traitement sont conformés pour traiter le ou les composant(s) spectral(aux) de base obtenus par les étapes consistant à :- obtenir une plage de valeurs de la propriété prédéterminée à partir d'un échantillon de population qui est représentatif de la population de mammifère dans son ensemble, mais qui n'exprime pas la maladie prédéterminée,- pour chacun des mammifères membres de cet échantillon de population, obtenir au moins un spectre en irradiant un volume de tissu choisi avec de la lumière ayant des longueurs d'onde couvrant la plage spectrale prédéterminée et détecter la lumière transmise au travers ou réfléchie par le volume de tissu choisi,- extraire des éléments de spectre communs du ou des spectre(s) de chacun des membres de cet échantillon de population et produire au moins un ensemble de spectres de composants à partir des éléments de spectre communs extraits, le ou les ensemble(s) de spectres de composants comportant au moins un spectre de composants,- identifier un ensemble de spectres de composants qui donne la valeur de prédiction la plus élevée pour la propriété prédéterminée du tissu choisi connue pour être indicatrice de la prédisposition à la maladie prédéterminée, et- utiliser cet ensemble de spectres de composants qui donne la valeur de prédiction la plus élevée pour la propriété prédéterminée du tissu choisi connue pour être indicatrice de la prédisposition à la maladie présélectionnée en tant qu'ensemble de composants spectraux de base dans la revendication 16.
- Appareil conforme à la revendication 16 ou 17,
dans lequel
les moyens de source de lumière comportent soit une source de lumière blanche telle qu'une lampe halogène filtrée, soit une série de diodes électroluminescentes à largeur de bande limitée (LEDs) soit plusieurs sources de lumière laser émettant toutes dans la plage spectrale prédéterminée. - Appareil conforme à l'une des revendications 16 à 18,
dans lequel
les moyens de détection comportent soit des moyens sélectifs à la longueur d'onde associés à un dispositif à transfert de charge, soit un ensemble de photodiodes toutes pour la détection en parallèle de la bande de longueurs d'onde prédéterminée, soit une photodiode à avalanche, soit un photo détecteur de point pour effecteur la détection séquentielle de la bande de longueurs d'onde prédéterminée. - Appareil conforme à l'une des revendications 16 à 19,
dans lequel
les moyens de traitement comportent des moyens de calibrage pour mesurer une fonction de transfert d'instrument dépendant de la longueur d'onde, et des moyens pour éliminer l'effet de l'instrument sur le spectre de la lumière détectée. - Appareil conforme à la revendication 19,
dans lequel,
les moyens de calibrage pour mesurer une fonction de transfert d'instrument dépendant de la longueur d'onde, comportent un volume prédéterminée d'un matériau qui disperse de préférence la lumière au lieu de l'absorber, positionné à la place du tissu prédéterminé. - Appareil conforme à la revendication 1,
dans lequel
le matériau qui disperse de préférence la lumière au lieu de l'absorber est du polyuréthane haute densité. - Appareil conforme à l'une des revendications 16 à 22,
dans lequel
les moyens de détection sont positionnés pour détecter la lumière réfléchie par le tissu irradié et il est prévu des moyens pour régler l'angle et la distance entre les moyens de source lumineuse et les moyens de détection. - Appareil conforme à l'une des revendications 16 à 23,
dans lequel
les moyens de source de lumière comportent une source de lumière et une fibre optique ayant une extrémité proximale positionnée pour rassembler la lumière dans cette fibre optique et une extrémité distale d'où de la lumière provient de la fibre, et qui est positionnée pour diriger la lumière sur le tissu prédéterminé. - Appareil conforme à l'une des revendications 16 à 23,
dans lequel
le mammifère est une femelle humaine post-pubère, la maladie prédéterminée est le cancer du sein, et les moyens de maintien comportent un support mammaire comportant au moins un moyen d'irradiation et au moins un moyen de détection pour chaque sein.
Applications Claiming Priority (3)
| Application Number | Priority Date | Filing Date | Title |
|---|---|---|---|
| US33163301P | 2001-11-20 | 2001-11-20 | |
| US331633P | 2001-11-20 | ||
| PCT/CA2002/001771 WO2003043492A1 (fr) | 2001-11-20 | 2002-11-20 | Diaphanoscopie optique et spectroscopie par reflectance pour quantifier le risque de developper une maladie |
Publications (2)
| Publication Number | Publication Date |
|---|---|
| EP1448092A1 EP1448092A1 (fr) | 2004-08-25 |
| EP1448092B1 true EP1448092B1 (fr) | 2010-01-13 |
Family
ID=23294738
Family Applications (1)
| Application Number | Title | Priority Date | Filing Date |
|---|---|---|---|
| EP02779076A Expired - Lifetime EP1448092B1 (fr) | 2001-11-20 | 2002-11-20 | Diaphanoscopie optique et spectroscopie par reflectance pour quantifier le risque de developper une maladie |
Country Status (7)
| Country | Link |
|---|---|
| US (1) | US8224426B2 (fr) |
| EP (1) | EP1448092B1 (fr) |
| AT (1) | ATE454847T1 (fr) |
| AU (1) | AU2002342477A1 (fr) |
| CA (1) | CA2467407C (fr) |
| DE (1) | DE60235110D1 (fr) |
| WO (1) | WO2003043492A1 (fr) |
Families Citing this family (21)
| Publication number | Priority date | Publication date | Assignee | Title |
|---|---|---|---|---|
| AU2003214166A1 (en) * | 2002-03-13 | 2003-09-29 | Tufts University | Optical imaging and oximetry of tissue |
| ITBO20020164A1 (it) * | 2002-03-28 | 2003-09-29 | Alessandro Barducci | Apparecchiature per il rilevamento e l'elaborazione a scopo diagnostico di radiazioni provenienti dalla pelle umana |
| AU2003901589A0 (en) * | 2003-04-04 | 2003-05-01 | Griffith University | Novel photoelectrichemical oxygen demand assay |
| NZ546918A (en) | 2003-10-03 | 2009-01-31 | Amc Amsterdam | System and method for imaging the reflectance of a substrate |
| JP4721144B2 (ja) * | 2004-02-24 | 2011-07-13 | 学校法人早稲田大学 | 測定方法および測定装置 |
| US9131861B2 (en) | 2004-11-30 | 2015-09-15 | Academisch Medisch Centrum | Pulsed lighting imaging systems and methods |
| US7298488B2 (en) * | 2005-09-20 | 2007-11-20 | National Taipei University Of Technology | Surface-plasmon-resonance sensing technique using electro-optic modulation |
| US20110073495A1 (en) * | 2006-12-22 | 2011-03-31 | Aqua Diagnostic Pty Ltd | Water analysis |
| US20090076396A1 (en) * | 2007-09-17 | 2009-03-19 | The General Hospital Corporation | Optical wavelength range for high contrast imaging of cancer |
| EP2217143A4 (fr) * | 2007-12-11 | 2015-04-15 | Epi Sci Llc | Analyse de la bioimpédance électrique comme biomarqueur de la densité du sein et/ou du risque du cancer du sein |
| US8045678B2 (en) * | 2008-03-21 | 2011-10-25 | Mxisystems, Inc. | Dynamically-varied beam energy using a tunable monochromatic X-ray beam |
| JP5541662B2 (ja) * | 2008-09-12 | 2014-07-09 | キヤノン株式会社 | 被検体情報取得装置およびその制御方法 |
| CN103476321B (zh) * | 2011-04-18 | 2017-02-08 | 皇家飞利浦有限公司 | 具有个性化阈值的肿瘤组织分类 |
| WO2014183387A1 (fr) * | 2013-05-13 | 2014-11-20 | 执鼎医疗科技江苏有限公司 | Système de positionnement d'une image vasculaire |
| US8912512B1 (en) | 2013-06-26 | 2014-12-16 | General Electric Company | System and method for optical biopsy tissue characterization |
| US9913628B2 (en) * | 2013-06-26 | 2018-03-13 | General Electric Company | System and method for attaching a biopsy collecting device to a spectroscopy system |
| US11035789B2 (en) * | 2019-04-03 | 2021-06-15 | Picomole Inc. | Cavity ring-down spectroscopy system and method of modulating a light beam therein |
| US12201402B2 (en) | 2019-07-28 | 2025-01-21 | Holovisions LLC | Wearable device (smart bra) with compressive chambers and optical sensors for analyzing breast tissue |
| US11950881B2 (en) | 2019-07-28 | 2024-04-09 | Holovsions LLC | Smart bra for optical scanning of breast tissue to detect abnormal tissue with selectively-expandable components to reduce air gaps |
| US11304456B2 (en) | 2019-07-28 | 2022-04-19 | Holovisions LLC | Smart bra with optical sensors to detect abnormal breast tissue |
| US20220022806A1 (en) * | 2020-07-22 | 2022-01-27 | Translational Research Institute Pty Ltd As Trustee For Translational Research Institute Trust | System and method to detect and track cellular changes in healthy breast tissue associated with breast density, menopausal status and age |
Family Cites Families (5)
| Publication number | Priority date | Publication date | Assignee | Title |
|---|---|---|---|---|
| US5079698A (en) | 1989-05-03 | 1992-01-07 | Advanced Light Imaging Technologies Ltd. | Transillumination method apparatus for the diagnosis of breast tumors and other breast lesions by normalization of an electronic image of the breast |
| US6002958A (en) | 1992-12-24 | 1999-12-14 | Dynamics Imaging, Inc. | Method and apparatus for diagnostics of internal organs |
| US5697373A (en) | 1995-03-14 | 1997-12-16 | Board Of Regents, The University Of Texas System | Optical method and apparatus for the diagnosis of cervical precancers using raman and fluorescence spectroscopies |
| US6008889A (en) | 1997-04-16 | 1999-12-28 | Zeng; Haishan | Spectrometer system for diagnosis of skin disease |
| US6121775A (en) | 1998-06-16 | 2000-09-19 | Beth Israel Deaconess Medical Center, Inc. | MRI imaging method and apparatus |
-
2002
- 2002-11-20 US US10/496,108 patent/US8224426B2/en not_active Expired - Fee Related
- 2002-11-20 AT AT02779076T patent/ATE454847T1/de not_active IP Right Cessation
- 2002-11-20 AU AU2002342477A patent/AU2002342477A1/en not_active Abandoned
- 2002-11-20 DE DE60235110T patent/DE60235110D1/de not_active Expired - Lifetime
- 2002-11-20 WO PCT/CA2002/001771 patent/WO2003043492A1/fr not_active Ceased
- 2002-11-20 CA CA2467407A patent/CA2467407C/fr not_active Expired - Fee Related
- 2002-11-20 EP EP02779076A patent/EP1448092B1/fr not_active Expired - Lifetime
Also Published As
| Publication number | Publication date |
|---|---|
| EP1448092A1 (fr) | 2004-08-25 |
| US8224426B2 (en) | 2012-07-17 |
| US20060173352A1 (en) | 2006-08-03 |
| ATE454847T1 (de) | 2010-01-15 |
| AU2002342477A1 (en) | 2003-06-10 |
| WO2003043492A1 (fr) | 2003-05-30 |
| CA2467407C (fr) | 2012-09-25 |
| DE60235110D1 (de) | 2010-03-04 |
| CA2467407A1 (fr) | 2003-05-30 |
Similar Documents
| Publication | Publication Date | Title |
|---|---|---|
| EP1448092B1 (fr) | Diaphanoscopie optique et spectroscopie par reflectance pour quantifier le risque de developper une maladie | |
| US7570988B2 (en) | Method for extraction of optical properties from diffuse reflectance spectra | |
| CN101137322B (zh) | 用于根据内窥镜成像期间获得的反射光谱测量测量癌变的方法和装置 | |
| Santos et al. | Improving clinical diagnosis of early-stage cutaneous melanoma based on Raman spectroscopy | |
| US20080009748A1 (en) | method and apparatus for the determination of intrinsic spectroscopic tumor markers by broadband-frequency domain technology | |
| US7962187B2 (en) | Optical imaging and oximetry of tissue | |
| Sharwani et al. | Assessment of oral premalignancy using elastic scattering spectroscopy | |
| Simick et al. | Non-ionizing near-infrared radiation transillumination spectroscopy for breast tissue density and assessment of breast cancer risk | |
| Anderson et al. | Broadband optical mammography: chromophore concentration and hemoglobin saturation contrast in breast cancer | |
| US20060264760A1 (en) | Near infrared transrectal probes for prostate cancer detection and prognosis | |
| US20110059016A1 (en) | Optical assay system with a multi-probe imaging array | |
| JPH10513088A (ja) | 生体組織の分光検査方法 | |
| JP2009504303A (ja) | 皮膚上の癌前駆体、母斑及び腫瘍を検知するとともに識別し、早期診断に利用可能な視覚光学と受動赤外線を用いた複合技術およびそのシステム | |
| EP2661615B1 (fr) | Appareil pour l'analyse optique d'un tissu associé | |
| JP2010504763A (ja) | 乳癌の早期診断に適した、赤外線による受動的及び能動的断層撮像方法 | |
| Shirkavand et al. | Application of optical spectroscopy in diagnosing and monitoring breast cancers: A technical review | |
| Blyschak et al. | Classification of breast tissue density by optical transillumination spectroscopy: optical and physiological effects governing predictive value | |
| Vasudevan et al. | Broadband diffuse optical spectroscopy of absolute methemoglobin concentration can distinguish benign and malignant breast lesions | |
| Petruk et al. | Spectrophotometric method for differentiation of human skin melanoma. II. Diagnostic characteristics | |
| Petruk et al. | Spectrophotometric method for differentiation of human skin melanoma. I. Optical diffuse reflection coefficient | |
| Bratchenko et al. | In vivo hyperspectral imaging of skin malignant and benign tumors in visible spectrum | |
| Kukreti et al. | Intrinsic Near‐Infrared Spectroscopic Markers of Breast Tumors | |
| WO2012127378A1 (fr) | Appareil d'analyse optique d'un échantillon de tissu associé | |
| Blackmore et al. | Estimation of mammographic density on an interval scale by transillumination breast spectroscopy | |
| Calin et al. | 640 A hyperspectral index-based approach for in vivo automatic detection of skin tumors from hyperspectral images |
Legal Events
| Date | Code | Title | Description |
|---|---|---|---|
| PUAI | Public reference made under article 153(3) epc to a published international application that has entered the european phase |
Free format text: ORIGINAL CODE: 0009012 |
|
| 17P | Request for examination filed |
Effective date: 20040618 |
|
| AK | Designated contracting states |
Kind code of ref document: A1 Designated state(s): AT BE BG CH CY CZ DE DK EE ES FI FR GB GR IE IT LI LU MC NL PT SE SK TR |
|
| AX | Request for extension of the european patent |
Extension state: AL LT LV MK RO SI |
|
| RIN1 | Information on inventor provided before grant (corrected) |
Inventor name: NIELSEN, MICHELLE, K. Inventor name: LILGE, LOTHAR Inventor name: WILSON, BRIAN, C. |
|
| RAP1 | Party data changed (applicant data changed or rights of an application transferred) |
Owner name: UNIVERSITY HEALTH NETWORK |
|
| 17Q | First examination report despatched |
Effective date: 20070413 |
|
| GRAP | Despatch of communication of intention to grant a patent |
Free format text: ORIGINAL CODE: EPIDOSNIGR1 |
|
| GRAL | Information related to payment of fee for publishing/printing deleted |
Free format text: ORIGINAL CODE: EPIDOSDIGR3 |
|
| GRAS | Grant fee paid |
Free format text: ORIGINAL CODE: EPIDOSNIGR3 |
|
| GRAA | (expected) grant |
Free format text: ORIGINAL CODE: 0009210 |
|
| AK | Designated contracting states |
Kind code of ref document: B1 Designated state(s): AT BE BG CH CY CZ DE DK EE ES FI FR GB GR IE IT LI LU MC NL PT SE SK TR |
|
| REG | Reference to a national code |
Ref country code: GB Ref legal event code: FG4D |
|
| REG | Reference to a national code |
Ref country code: CH Ref legal event code: EP |
|
| REG | Reference to a national code |
Ref country code: IE Ref legal event code: FG4D |
|
| REF | Corresponds to: |
Ref document number: 60235110 Country of ref document: DE Date of ref document: 20100304 Kind code of ref document: P |
|
| REG | Reference to a national code |
Ref country code: NL Ref legal event code: VDEP Effective date: 20100113 |
|
| PG25 | Lapsed in a contracting state [announced via postgrant information from national office to epo] |
Ref country code: AT Free format text: LAPSE BECAUSE OF FAILURE TO SUBMIT A TRANSLATION OF THE DESCRIPTION OR TO PAY THE FEE WITHIN THE PRESCRIBED TIME-LIMIT Effective date: 20100113 |
|
| PG25 | Lapsed in a contracting state [announced via postgrant information from national office to epo] |
Ref country code: NL Free format text: LAPSE BECAUSE OF FAILURE TO SUBMIT A TRANSLATION OF THE DESCRIPTION OR TO PAY THE FEE WITHIN THE PRESCRIBED TIME-LIMIT Effective date: 20100113 Ref country code: PT Free format text: LAPSE BECAUSE OF FAILURE TO SUBMIT A TRANSLATION OF THE DESCRIPTION OR TO PAY THE FEE WITHIN THE PRESCRIBED TIME-LIMIT Effective date: 20100513 Ref country code: ES Free format text: LAPSE BECAUSE OF FAILURE TO SUBMIT A TRANSLATION OF THE DESCRIPTION OR TO PAY THE FEE WITHIN THE PRESCRIBED TIME-LIMIT Effective date: 20100424 |
|
| PG25 | Lapsed in a contracting state [announced via postgrant information from national office to epo] |
Ref country code: FI Free format text: LAPSE BECAUSE OF FAILURE TO SUBMIT A TRANSLATION OF THE DESCRIPTION OR TO PAY THE FEE WITHIN THE PRESCRIBED TIME-LIMIT Effective date: 20100113 |
|
| PG25 | Lapsed in a contracting state [announced via postgrant information from national office to epo] |
Ref country code: GR Free format text: LAPSE BECAUSE OF FAILURE TO SUBMIT A TRANSLATION OF THE DESCRIPTION OR TO PAY THE FEE WITHIN THE PRESCRIBED TIME-LIMIT Effective date: 20100414 Ref country code: EE Free format text: LAPSE BECAUSE OF FAILURE TO SUBMIT A TRANSLATION OF THE DESCRIPTION OR TO PAY THE FEE WITHIN THE PRESCRIBED TIME-LIMIT Effective date: 20100113 Ref country code: CY Free format text: LAPSE BECAUSE OF FAILURE TO SUBMIT A TRANSLATION OF THE DESCRIPTION OR TO PAY THE FEE WITHIN THE PRESCRIBED TIME-LIMIT Effective date: 20100113 Ref country code: BE Free format text: LAPSE BECAUSE OF FAILURE TO SUBMIT A TRANSLATION OF THE DESCRIPTION OR TO PAY THE FEE WITHIN THE PRESCRIBED TIME-LIMIT Effective date: 20100113 Ref country code: SE Free format text: LAPSE BECAUSE OF FAILURE TO SUBMIT A TRANSLATION OF THE DESCRIPTION OR TO PAY THE FEE WITHIN THE PRESCRIBED TIME-LIMIT Effective date: 20100113 |
|
| PLBE | No opposition filed within time limit |
Free format text: ORIGINAL CODE: 0009261 |
|
| STAA | Information on the status of an ep patent application or granted ep patent |
Free format text: STATUS: NO OPPOSITION FILED WITHIN TIME LIMIT |
|
| PG25 | Lapsed in a contracting state [announced via postgrant information from national office to epo] |
Ref country code: SK Free format text: LAPSE BECAUSE OF FAILURE TO SUBMIT A TRANSLATION OF THE DESCRIPTION OR TO PAY THE FEE WITHIN THE PRESCRIBED TIME-LIMIT Effective date: 20100113 Ref country code: BG Free format text: LAPSE BECAUSE OF FAILURE TO SUBMIT A TRANSLATION OF THE DESCRIPTION OR TO PAY THE FEE WITHIN THE PRESCRIBED TIME-LIMIT Effective date: 20100413 Ref country code: CZ Free format text: LAPSE BECAUSE OF FAILURE TO SUBMIT A TRANSLATION OF THE DESCRIPTION OR TO PAY THE FEE WITHIN THE PRESCRIBED TIME-LIMIT Effective date: 20100113 |
|
| 26N | No opposition filed |
Effective date: 20101014 |
|
| PG25 | Lapsed in a contracting state [announced via postgrant information from national office to epo] |
Ref country code: DK Free format text: LAPSE BECAUSE OF FAILURE TO SUBMIT A TRANSLATION OF THE DESCRIPTION OR TO PAY THE FEE WITHIN THE PRESCRIBED TIME-LIMIT Effective date: 20100113 |
|
| PG25 | Lapsed in a contracting state [announced via postgrant information from national office to epo] |
Ref country code: IT Free format text: LAPSE BECAUSE OF FAILURE TO SUBMIT A TRANSLATION OF THE DESCRIPTION OR TO PAY THE FEE WITHIN THE PRESCRIBED TIME-LIMIT Effective date: 20100113 |
|
| PG25 | Lapsed in a contracting state [announced via postgrant information from national office to epo] |
Ref country code: MC Free format text: LAPSE BECAUSE OF NON-PAYMENT OF DUE FEES Effective date: 20101130 |
|
| REG | Reference to a national code |
Ref country code: CH Ref legal event code: PL |
|
| PG25 | Lapsed in a contracting state [announced via postgrant information from national office to epo] |
Ref country code: CH Free format text: LAPSE BECAUSE OF NON-PAYMENT OF DUE FEES Effective date: 20101130 Ref country code: LI Free format text: LAPSE BECAUSE OF NON-PAYMENT OF DUE FEES Effective date: 20101130 |
|
| PG25 | Lapsed in a contracting state [announced via postgrant information from national office to epo] |
Ref country code: IE Free format text: LAPSE BECAUSE OF NON-PAYMENT OF DUE FEES Effective date: 20101120 |
|
| PG25 | Lapsed in a contracting state [announced via postgrant information from national office to epo] |
Ref country code: LU Free format text: LAPSE BECAUSE OF NON-PAYMENT OF DUE FEES Effective date: 20101120 |
|
| PG25 | Lapsed in a contracting state [announced via postgrant information from national office to epo] |
Ref country code: TR Free format text: LAPSE BECAUSE OF FAILURE TO SUBMIT A TRANSLATION OF THE DESCRIPTION OR TO PAY THE FEE WITHIN THE PRESCRIBED TIME-LIMIT Effective date: 20100113 |
|
| REG | Reference to a national code |
Ref country code: FR Ref legal event code: PLFP Year of fee payment: 14 |
|
| PGFP | Annual fee paid to national office [announced via postgrant information from national office to epo] |
Ref country code: DE Payment date: 20151127 Year of fee payment: 14 Ref country code: GB Payment date: 20151127 Year of fee payment: 14 |
|
| PGFP | Annual fee paid to national office [announced via postgrant information from national office to epo] |
Ref country code: FR Payment date: 20151127 Year of fee payment: 14 |
|
| REG | Reference to a national code |
Ref country code: DE Ref legal event code: R119 Ref document number: 60235110 Country of ref document: DE |
|
| GBPC | Gb: european patent ceased through non-payment of renewal fee |
Effective date: 20161120 |
|
| REG | Reference to a national code |
Ref country code: FR Ref legal event code: ST Effective date: 20170731 |
|
| PG25 | Lapsed in a contracting state [announced via postgrant information from national office to epo] |
Ref country code: FR Free format text: LAPSE BECAUSE OF NON-PAYMENT OF DUE FEES Effective date: 20161130 |
|
| PG25 | Lapsed in a contracting state [announced via postgrant information from national office to epo] |
Ref country code: GB Free format text: LAPSE BECAUSE OF NON-PAYMENT OF DUE FEES Effective date: 20161120 Ref country code: DE Free format text: LAPSE BECAUSE OF NON-PAYMENT OF DUE FEES Effective date: 20170601 |