EP1492052A2 - Verfahren und Anordnung zur Kontrastverbesserung eines Digitalvideos - Google Patents
Verfahren und Anordnung zur Kontrastverbesserung eines Digitalvideos Download PDFInfo
- Publication number
- EP1492052A2 EP1492052A2 EP04102948A EP04102948A EP1492052A2 EP 1492052 A2 EP1492052 A2 EP 1492052A2 EP 04102948 A EP04102948 A EP 04102948A EP 04102948 A EP04102948 A EP 04102948A EP 1492052 A2 EP1492052 A2 EP 1492052A2
- Authority
- EP
- European Patent Office
- Prior art keywords
- histogram
- picture
- mapping function
- contrast
- stretch
- Prior art date
- Legal status (The legal status is an assumption and is not a legal conclusion. Google has not performed a legal analysis and makes no representation as to the accuracy of the status listed.)
- Withdrawn
Links
Images



Classifications
-
- G—PHYSICS
- G06—COMPUTING OR CALCULATING; COUNTING
- G06T—IMAGE DATA PROCESSING OR GENERATION, IN GENERAL
- G06T5/00—Image enhancement or restoration
- G06T5/90—Dynamic range modification of images or parts thereof
- G06T5/92—Dynamic range modification of images or parts thereof based on global image properties
-
- G—PHYSICS
- G06—COMPUTING OR CALCULATING; COUNTING
- G06T—IMAGE DATA PROCESSING OR GENERATION, IN GENERAL
- G06T5/00—Image enhancement or restoration
- G06T5/40—Image enhancement or restoration using histogram techniques
-
- G—PHYSICS
- G06—COMPUTING OR CALCULATING; COUNTING
- G06T—IMAGE DATA PROCESSING OR GENERATION, IN GENERAL
- G06T2207/00—Indexing scheme for image analysis or image enhancement
- G06T2207/10—Image acquisition modality
- G06T2207/10016—Video; Image sequence
Definitions
- the present invention relates to a method and system for enhancing the overall picture contrast of digital video signals by using an automatically configurable mapping function that is automatically selected from a predetermined set of mapping functions based on set criteria.
- the need for video contrast enhancement may arise due to the picture contrast distortions caused by transmission limitations or the limitations of video capturing devices or media.
- Examples of video signals requiring contrast enhancement are video pictures that are too dark, too bright, too low in contrast or are over contrast.
- Mapping functions are normally used to map the original luminance values for each respective pixel in a picture or video frame into new respective values.
- Figures 1 to 4 illustrate different examples of such mapping functions.
- the horizontal axis represents the original luminance values of those pixels in a picture and the vertical axis represents the adjusted pixel luminance values using each mapping function based on each pixel's original lumination value.
- the mapped output picture generally improves the contrast of the picture, and give a better subjective quality.
- mapping functions generated are based on the normalised Cumulative Density Function ("CDF") of the picture histogram.
- CDF Cumulative Density Function
- mapping functions are generated by comparing the histogram for the current picture being processed with the CDF of previously processed histograms corresponding to earlier field pictures.
- the original picture is first quantised and then the CDF of the quantised picture histogram is used to generate the mapping functions.
- some pre-determined types of mapping curves are used, and the average brightness level in the video input signal is used to decide the type of curve to be used.
- each picture is divided into blocks and the average luminance level of each block, determined over a series of frames or pictures, is used to select an appropriate mapping function for that block, and an enhancer maps each pixel in that block according to both the selected mapping function for that block and the mapping functions selected for adjacent areas, and the mapping results are combined by a weighted-average processor.
- mapping functions generated by the CDF of the picture histogram tend to over-enhance or over-correct the contrast, resulting in over-contrast pictures.
- Mapping functions that are generated by picture pre-processing, for example performing quantisation or filtering may involve complex processing which can be slow to process.
- mapping curves using only the average brightness of blocks in each picture
- the technique may be too simplistic and lack the accuracy required for determining the most appropriate mapping function to be used.
- Methods that divide a picture into blocks and select mapping functions for each block according to its difference with the average block luminance level can be highly complex and flickering could also result.
- mapping function selection method For any existing system that has selectable or switchable mapping functions in place but lack an automatic mapping functions selection mechanism, the existing techniques described above either require too complex design changes to such a system or the mapping function selection method is too simplistic and lacks accuracy.
- An object of the invention is to enhance the overall picture contrast of digital video signal so that it gives a better subjective quality, without introducing artefacts that degrade the picture quality.
- Another object of the invention is to enhance the picture contrast without introducing flickering.
- the present invention provides a method for enhancing the contrast of video pictures including the steps of:
- step (v) the step of step (v)(a) for determining whether said picture is part of a smooth scene sequence.
- step (v)(a) the step of step (v)(b) preventing the selection of a new mapping function where said picture is part of a smooth scene sequence.
- step (iii) determines said active window for said picture by including only pixels from said picture that do not form part of any black bars at the boundaries of said picture.
- step (v) includes the step of calculating the weighted difference between the value of each said bin of said histogram and the corresponding value in the same said bin of an earlier histogram relating to an earlier processed picture.
- step (vi) includes the step of determining from said histogram, whether said picture is low in contrast, and if said picture is determined to be low in contrast, determining whether a Grey Stretch mapping function is suitable for correcting said contrast, and where said picture is not low in contrast, determining whether said picture is over contrast.
- a Grey Stretch mapping function is selected and associated parameters for said Grey Stretch mapping function are determined and applied to said Grey Stretch mapping function, and wherein if said Grey Stretch mapping function is not suitable, determining whether a White Stretch mapping function is suitable for correcting said contrast.
- a White Stretch mapping function is selected and associated parameters for said White Stretch mapping function are determined and applied to said White Stretch mapping function, and wherein if said White Stretch mapping function is not suitable, a Black Stretch mapping function is selected and associated parameters for said Black Stretch mapping function are determined and applied to said Black Stretch mapping function.
- a Black and White Stretch mapping function is selected and associated mapping parameters are determined and applied to said Black and White Stretch mapping function, and wherein if said Black and White Stretch mapping function is not suitable, a Black Stretch mapping function is selected and associated parameters for said Black Stretch mapping function are determined and applied to said Black Stretch mapping function.
- FIG. 5 is a block diagram of a contrast enhancement device showing the main components thereof as indicated as Contrast Enhancer 59.
- the Contrast Enhancer 59 has a Histogram Data Circuit 51, Black Bars Detector Module 56, Scene Change Detector 57, a Mapping Functions Decision Module 58 and a Picture Mapping Circuit 55.
- the Histogram Data Circuit 51 receives a digital input video signal 50 and generates a histogram corresponding to each picture or frame extracted from the digital input video signal 50. The generated histogram represents the varying degrees of luminance of the pixels in each picture.
- the generated histogram may be of higher complexity for greater accuracy, for example representing the 8-bit grey-level output of the current picture using a 256-band histogram, or alternatively be of lower complexity allowing faster processing, for example using a 16-band histogram similar to the one shown in Figure 6.
- each band 60 (or bin) in the histogram has equal thickness and spreads across the full range of brightness (or the respective input gray level for each pixel) as represented by the horizontal axis 61 (or the brightness axis).
- the height of each band represents the proportion of pixels in a picture having luminance intensities within the different predefined ranges for each respective band.
- the region 62 to the left of the generated histogram represents the darkest portions or pixels of a picture while the region 63 to the right of the generated histogram represents the brightest portions of a picture.
- the Histogram Data Circuit 51 passes the histogram bin values to the Mapping Functions Decision Module 58.
- the Histogram Data Circuit 51 generates a 16-band histogram (or a histogram with 16 bins), where the first bin is labelled as bin 0 and the last bin is labelled as bin 15.
- the Black Bars Detector 56 also receives the digital input video signals 50 and processes the signal to detect any horizontal or vertical black bars which may occur at the boundaries of each picture, for example, the black bars caused by the letter-boxing effect.
- the Black Bars Detector 56 extracts the active window information, or those pixels of each picture representing the actual image to the exclusion of those pixels representing the black bars contained in the picture.
- the active window information is passed to the Histogram Data Circuit 51 to serve as the raw data for generating a histogram for that picture.
- the exclusion of pixels corresponding to the black bars enables a more accurate histogram to be generated to reflect the true luminance of those pixels in the picture comprising the actual image.
- the Mapping Functions Decision Module 58 includes a Temporal Filtering Block 52, Histogram Analysis Block 53 and a Curve & Parameter Decision Block 54. Active window information for each picture is also passed to both the Temporal Filtering Block 52 and Histogram Analysis Block 53 in the Mapping Functions Decision Module 58.
- the Scene Change Detector 57 also receives the digital input video signal 50 and processes the signal to trigger a flag (the "Scene Change Flag") to be set, thus to indicate whether a scene change is occurring in the current picture being processed
- a flag the "Scene Change Flag"
- the status of the Scene Change Flag is used by the Curve & Parameters Decision Block 54 in the Mapping Function Decision Module 58 to decide whether a new type of mapping function should be selected for enhancing the picture being processed.
- the Temporal Filtering Block 52 filters the histogram data (or the bin values from one histogram) provided by the Histogram Data Circuit 51 to reduce fluctuations in the histogram data that will lead to flickering.
- the fluctuations of the histogram refers to the fluctuations in the time domain (or otherwise known as temporal fluctuations), for example, the histogram data of the current field picture can be quite different from the previous field pictures even though the overall contrast of these field pictures looks similar. Note that it is not the fluctuation of the histogram data that causes flickering, but the fast changes in the selection of mapping functions in response to the fast changes (or fluctuations) in the histograms for field pictures.
- the Histogram Analysis Block 53 computes some statistical information (as described further below) based on the field picture being processed, which is then used by the algorithm in the Curve & Parameters Decision Block 54 to decide which type of mapping curve to use on the field picture and also to determine the values of the different parameters for the selected mapping curve.
- the Curve & Parameters Decision Block 54 passes the mapping curve selection together with the associated parameter settings to the Picture Mapping Circuit 55.
- the Picture Mapping Circuit 55 then uses those selections and settings to generate a specifically calibrated mapping curve and applies that mapping to the field picture derived from the digital input video signal 50 to create a new mapped field picture released as the output video signal 510.
- the histogram data received from the Histogram Data Circuit 51 is temporally filtered to prevent any rapid fluctuations of the range and gain settings corresponding to the selected mapping curve, which may result in flickering.
- An adaptive filter is used so that it can quickly adapt to sudden changes of the histogram and also to permit only small or no changes to the parameter settings for the selected mapping curve (or mapping function) for minor changes in the histogram.
- Only large variations in histograms will result in an emphasis on the current histogram of the current (or incoming) field picture, whereas small histogram variations will result in an emphasis on the filtered histograms of the previously processed field pictures.
- the adaptive filter is implemented by adjusting the weighting of both the previous filtered histogram (being the histogram corresponding to a previous field picture processed immediately before the current field picture) and histogram corresponding to the current field picture according to the differences between the two histograms.
- a preferred implementation of the adaptive weighting computation according to the histogram differences can be described by way of the following pseudo-code: where i is the bin number in the histogram numbered from 0 to 15 (assumed to be 16 for the above example); ABS () is an absolute function; curr_histobin ( i ) is the input bin value corresponding to the i th bin of the picture histogram for the current field picture; histobin ( i ) is the filtered output bin value corresponding to the i th bin from the temporally filtered histogram of the most recently processed field picture; num_pixels_per_win is the number of pixels per active field window passed into the Histogram Data Circuit 51; diff is the absolute value of the difference between the value in each bin in the current picture histogram and the value of the corresponding bin of the filtered histogram bin output; weight is the estimated weighting or emphasis to be given to the histogram data of the current or incoming field picture; and WEIGHT_MAX defines the maximum value of weight for
- the term (num_pixels_per_win * 2 ) defines the maximum range of diff, and the rounding-up of weight is done by adding num_pixels_per_win in the equation.
- the value of WEIGHT_MAX it is preferable to set the value of WEIGHT_MAX to 50 and the value of weight to be any integer between 0 and 50.
- a higher value of WEIGHT_MAX means a larger number of previous field picture histogram data will be taken into the filtering process. If the value of WEIGHT_MAX is set too high, this results in high latency or slowness in adapting to the changes in contrast in the field picture.
- WEIGHT_MAX may be set within the values 20 to 100 inclusive.
- the range of values for weight depends on the value for WEIGHT_MAX. The computed weight value will always be within 0 to WEIGHT_MAX inclusive.
- Listing 1 is to compute the estimated weight value and is the first part of the filtering process.
- the second (or main) part of this filtering process is provided in Listing 2, which makes use of the weight value to perform the required filtering.
- the variables referred to in Listing 2 correspond to the same variables in Listing 1.
- the Histogram Analysis Block 53 receives the values corresponding to each of the bins in the input histogram from the Temporal Filtering Block 52. Each input bin value represents the number of pixels in each respective bin. The Histogram Analysis Block 53 performs certain statistical calculations on the current histogram bin values to determine the approximate shape and distribution of the histogram.
- the first step of the calculations in the Histogram Analysis Block 53 involves calculating the sum of the values in consecutive histogram bins.
- the summation process starts from calculating the sum of two consecutive bins, denoted as Hist_sum2 ( i ), and preferably stops after the completion of calculating the sum of seven consecutive bins, denoted as Hist _sum 7(i). More than seven bins may be summed if desired, but this would be more appropriate for higher complexity histograms.
- the process of calculating the sum of two consecutive bins involves adding the value from a first bin (e.g. bin 0) to the value of a second bin (e.g. bin 1) being the next consecutive bin immediately adjacent to the aforementioned first bin.
- the process begins from the lowest bin number (i.e. bin 0) and is repeated for each consecutive bin (i.e. for bins 1, 2, 3... and so on) until the sum has been calculated for the second last bin (i.e. bin 14).
- the sum of two consecutive bins means that every addition must be between two consecutive and immediately adjacent bins (e.g.
- the process for calculating the sum of two consecutive bins preferably starts from bin 0 and then proceeds in a sequential pattern starting from bins 1, 2 and 3 and so on until the sum has been calculated for the second last bin (i.e. bin 14), which corresponds to the last possible bin that the sum of two consecutive bins can be calculated.
- the value from a first bin (e.g. bin 0) is added to the value of a second bin (e.g. bin 1) and the total between the first bin and second bin is then added to a third bin (e.g. bin 2).
- the sum of three consecutive bins means that every addition must be between three consecutive bins, each of the bins in the set of three bins being immediately adjacent to at least one of the other bins in the same set. For example, a sum of three consecutive bins may be made between bins 0, 1 and 2. Another example is the sum between bins 1, 2 and 3.
- the process for calculating the sum of three consecutive bins preferably starts from bin 0 and then proceeds in a sequential pattern starting from bins 1, 2 and 3 and so on until the sum has been calculated for the third last bin (i.e. bin 13), which corresponds to the last possible bin that the sum of three consecutive bins can be calculated.
- the input histogram has a maximum number of M bins, where M is an integer, and each of the bins are sequentially numbered according to the pattern n , n +1, n +2 and so on, where n is a positive integer starting from zero
- Hist_sum 7 ( i ) the algorithm calculates the sum of seven consecutive histogram bins, starting from the first bin (i.e. bin 0) for each consecutive bin (i.e. bins 1, 2, 3 and so on) and not stopping until after the sum starting from the first bin to the tenth bin (i.e. bin 9).
- Hist_sum7 ( i ) represents the sum of the bin values for bins 0 to 6; 1 to 7; 2 to 8; 3 to 9; 4 to 10; 5 to 11; 6 to 12; 7 to 13; 8 to 14; and 9 to 15.
- the second step of the calculations performed by the Histogram Analysis Block 53 involves identifying whether the input histogram is heavily concentrated around particular bins, or whether there are any narrowly and heavily concentrated histogram bins. This is done by checking all the sets of Hist_sumN ( i ), where preferably N in this step satisfies the condition 2 ⁇ N ⁇ 7.
- the threshold value is also referred to as the contrast-sensitivity associated with the value of N.
- the highest threshold value corresponding to the highest value of integer N is preferably calculated in accordance with Equation 1.
- the threshold values corresponding to smaller values of N can be determined by pegging to the contrast-sensitivity of a threshold value corresponding to the highest value of N.
- the corresponding thresholds for each value of N are set according to Listing 4.
- the threshold values corresponding to values of N smaller than the largest value of N become s progressively smaller as the value of N decreases.
- the third step of the calculations performed by the Histogram Analysis Block 53 involves estimating the average brightness of the field picture using the bin inputs from the corresponding picture histogram which is later used in the Curve & Parameters Decision Block 54.
- Certain parameters calculated by the Histogram Analysis Block 53 are passed to the Curve & Parameters Decision Block 54 for deciding whether the histogram belongs to one of the "histogram distorted" pictures which can be corrected or enhanced using one of the four predetermined types of mapping curves.
- the Curve & Parameters Decisions Block 54 also determines the strength or the steepness of each of the chosen type of mapping curve.
- Figure 7 is a diagram showing the algorithm used for processing a picture histogram and for selecting a suitable mapping curve based on the picture histogram.
- the algorithm reflects the processing performed by the Mapping Functions Decision Process 58.
- Step 70 in Figure 7 corresponds to the processing performed by the Temporal Filtering Block 52 and step 71 corresponds to the processing performed by the Histogram Analysis Block 53.
- the Histogram Analysis Block 53 calculates and passes to the Curve & Parameters Decision Block 54 a set of sums for N consecutive bin values, Hist_sumN ( i ), the largest total in each of the consecutive sums corresponding to each value of N, maxN_sum, and the band where the maximum sum occurs, maxN_position.
- the Curve & Parameters Decision Block 54 decides whether to allow a change in the type of mapping curve being used to enhance the current picture, and also determines any changes to the parameter settings for each mapping curve.
- the difference (denoted as diff), in the histograms between the current and previous field picture (denoted as curr_histobin () and prev_histobin () respectively) is first calculated according to the pseudo-code shown in Listing 6 and normalised (denoted as Norm_Diff) within a range of 0 to 50 inclusive (which correspond to the range of values for WEIGHT_MAX): where num_pixels_per_win represents the number of pixels in each window.
- the difference, diff represents the actual difference between the current and previous non-filtered field picture histogram, rather than the difference between the current and previous filtered field picture histogram as was computed for the weighting in the picture histogram by the Temporal Filtering Block 52 (see Listing 1).
- a change of the range (or gain) or of the type of mapping curve used is not allowed during a smooth scene transition.
- a smooth scene transition is normally indicated by a Norm_Diff value this is less than WEIGHT_MAX / 4 and where there is no associated scene-change detected by the Scene Change Detector 57, as indicated by the status of the Scene Change Flag.
- the computed value of Norm_Diff in Listing 6 has a range from 0 to WEIGHT_MAX.
- a higher value of Norm_Diff i.e. close to the value of WEIGHT_MAX indicates a large difference between the current picture and previous pictures (i.e. the scene transition is not smooth).
- the threshold value is preferably set at WEIGHT_MAX / 4.
- the Scene Change Detector 57 detects a change in scene in the current field picture, the Scene Change Flag is set the boolean value of "TRUE". Where no scene change has been detected, the Scene Change Flag is set the boolean value of "FALSE".
- a decision on whether the field picture histogram is low in contrast is made in step 73.
- a low-contrast picture will have a narrow-shaped histogram.
- the algorithm first decides whether the histogram is low in contrast.
- Figure 8 shows a typical narrow-shaped histogram.
- the histogram is said to be in low-contrast if any one of the nine sums calculated for Hist_sum7 ( i ) exceeds the contrast-sensitivity threshold value.
- a histogram is in low-contrast if any of the sums calculated for Hist_sumN ( i ) , for the largest value of N, exceeds the corresponding contrast-sensitivity threshold value.
- the picture may be enhanced by using one of either the Grey Stretch ("GS”), Black Stretch (“BS”) or White Stretch (“WS”) enhancement curves.
- GS Grey Stretch
- BS Black Stretch
- WS White Stretch
- the decision depends on where the narrow-shaped histogram is found on the horizontal axis (or brightness axis) of the histogram (item 61 in Figure 6).
- the position of the maximum sum value for Hist_sumN ( i ) that exceeds the contrast-sensitivity threshold value, or the value maxN_position for the greatest value of N, is used to decide which enhancement curves is to be used.
- step 74 if the narrowly concentrated histogram is located at the middle region of the horizontal axis (i.e. it is not near the extreme dark and extreme bright area of the histogram), the GS curve is chosen to spread the histogram in an attempt to improve the contrast level of the picture.
- the GS curve is chosen if the max7_position (range from 0 to 9) is between the values 2 to 4 inclusive.
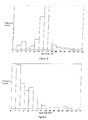
- Figure 9 shows a typical histogram example of a sequence for which the GS curve will be chosen at step 75.
- the GS curve is selected and associated parameters for the GS curve is calculated in step 75.
- one of the parameter settings is the steepness of the slope of the middle segment 11 of the GS mapping curve. A steeper slope will stretch the histogram wider apart to increase the contrast. Therefore the range setting depends on the "narrowness" or concentration of the histogram. In the current example, this can be decided by looking at the values of the Hist_sum2 ( i ), Hist_sum3 ( i ) and Hist _sum4 ( i ) measured by the Histogram Analysis Block 53.
- one or more of the nine sums for Hist_sum7 ( i ) has exceeded the contrast-sensitivity threshold level.
- An example of a very low-contrast picture (having a narrowly concentrated histogram) such as that shown in Figure 8, is when max2_sum > 0 (i.e. any one of the Hist_sum2 ( i ) exceeds sum2_thres).
- max2_sum > 0 i.e. any one of the Hist_sum2 ( i ) exceeds sum2_thres.
- a steeper middle-segment slope of the curve can then be used.
- the cross-over point 13 of the middle-segment slope is preferred to occur at the average luminance value of the picture on the horizontal axis 14.
- the average picture brightness can be estimated ( est_avg_brightness ) by the algorithm in the Histogram Analysis Block 53.
- Another GS curve parameter setting to be decided is the left-segment 10 and right-segment 12 slopes of the GS curve.
- This setting is defined as the gain setting, and depends on the histogram levels at both ends of the brightness axis (e.g. item 61 in Figure 6).
- the three extreme left bins (found by Hist_sum3 ( 0 )) and the three extreme right bins (found by Hist_sum3 ( 13 )) can be used to determine the steepness of the left-segment slope 10 and right segment slope 12 respectively.
- Hist_sum3 ( 0 ) which indicates a small quantity of dark pixels in the picture, a less steep left-segment slope would be set.
- step 74 If according to step 74 a GS curve is not appropriate for the current picture, the next step is to try to use a WS curve for correction in step 76.
- step 76 if the narrowly shaped histogram is located very close to the dark area (i.e. near the extreme left), the WS curve is chosen to improve the visibility of dark area details.
- a WS curve is used if the condition in Listing 8 is satisfied:
- the next criteria checked is whether the sum of the first 2 bins is more than 50% of the histogram. This means that most of the pixels are heavily concentrated very closely to the dark area, and an example of such a histogram is shown in Figure 9.
- the WS curve is selected and associated parameters for the WS curve is calculated in step 77.
- the inflection point 31 of the WS curve occurs preferably at the average brightness 33.
- the gain setting of the WS curve decides how high the inflection point 31 of the curve should be.
- the estimated average brightness of the histogram (est_avg_brightness) calculated by the Histogram Analysis Block 53 can be used to decide the gain settings. For example, typically when a WS curve is chosen, the value of est_avg_brightness is generally quite low. Thus, a very low value of est_avg_brightness results in a higher gain setting.
- est_avg_brightness results in a lower gain setting. Minimal gain is achieved for a high value of est_avg_brightness.
- An example of a very low value of est_avg_brightness is a value less than 30, and a very high value of est_avg_brightness is a value higher than 100.
- step 78 the algorithm detects any heavily concentrated histogram at the far left and right areas, which indicates that the sequence is over-contrast.
- Figure 10 is an example of an over-contrast histogram.
- the value of Hist_sum4 ( 0 ) (corresponding to the low brightness area) and the value of Hist_sum4 ( 12 ) (corresponding to the high brightness area) are preferably used in making the decision in step 78.
- Hist_sum4 ( 0 ) and Hist_sum4 ( P ) are used to make the decision in step 78, where P is fourth last term in a picture histogram containing at least four bins.
- Hist_sum4 ( 0 ) and Hist_sum4 ( 12 ) are used for a 16-band histogram. If, for example, the histogram has 32 bands (or bins), then it would be preferable to use Hist_sum8 ( 0 ) and Hist_sum8 ( 24 ), being the respective sums taken at the lowest and highest luminance extremes of histogram.
- B&WS_sensitivity a predefined threshold
- B&WS_diff_thres the absolute difference between the two
- B&WS_diff_thres the difference threshold
- Example values of B&WS_sensitivity and B&WS_diff_thres are set at 90% and 25% of the number of pixels per window respectively.
- Figure 10 shows an example of histogram that is over contrast.
- the B&WS curve is selected and associated parameters for the B&WS curve is calculated in step 79.
- the range of the B&WS curve defines the positions of the corresponding inflections points of the left segment 40 and right segment 43. The position of the left 40, centre 42 and right 44 segments fall into place upon determine the two inflection points 41 43. A higher range means that the inflection points occur more towards the centre and a lower range means the inflection points occur more towards the far ends (or away from the centre). Therefore the range setting determines where the maximum stretch (i.e. the inflection points 41 and 43) will occur.
- the gain indicates how high or low each of the two inflection points 41 43 should be (i.e. to determine how steep should the slopes of the left 40, centre 42 and right 44 segments should be).
- the positions of the most concentrated areas of brightness at the far left and right of the histogram is first determined.
- the maximum value from either of Hist_sum2 ( 0 ), Hist_sum2 ( 1 ), Hist_sum2 ( 2 ) and Hist_sum2 ( 3 ) is used to determine the position of the maximum concentrated area at the far left of the histogram, and is further used to set the position of the left-segment inflection point 41.
- the maximum value from either of Hist_sum2 ( 11 ), Hist_sum2 ( 12 ), Hist_sum2 ( 13 ) and Hist_sum2 ( 14 ) is used to determine the position of the maximum concentrated area at the far right of the histogram, and is further used to set the position of the right-segment inflection point 43.
- the inflection points 41 43 will typically occur at the most concentrated areas of the histogram, which also provides the basis for determining the maximum stretch.
- the gain of the curve may depend on the amount of dark or bright pixels at the 2 heavily concentrated area.
- a high gain can set if the percentage amount of dark or bright pixels is high. With reference to Figure 4, the gain indicates how high or low each of the two inflection points 41 43 should be.
- a high gain means the inflection points 41 43 are further away from the dotted line 45. Therefore if the percentage amount of dark pixels is high, the inflection point 41 will be placed higher (i.e. more vertically upwards compared to the current indicated position in Figure 4). If the percentage amount of bright pixels is high, the inflection point 43 will be placed lower (i.e. more vertically downwards compared to the current indicated position in Figure 4).
- step 76 decides that the WS curve is not suitable for correcting the histogram, and likewise, step 78 decides that the B&WS curve is also not suitable for correcting the histogram
- the BS curve is selected by default and the associated parameters for the BS curve is calculated in step 710.
- the BS curve is the default curve, chosen when no other curve has been chosen, and can be effectively used to make the dark pixels darker to increase the contrast of pictures.
- the inflection point 21 of the curve is preferred to occur at the average brightness position (represented by est_avg_brightness ) 23 on the input brightness axis 24.
- the inflection point 21 is also preferably limited to a maximum value, BS_Average_upper_limit, which is preferably set at 100. It is preferable that the value of BS_Average_upper_limit is set a value with 70 to 120, inclusive.
- Figure 11 shows an example of a histogram that a BS curve can be used to improve the contrast.
- the steepness of the left-segment slope 20, defined as the gain setting is to be set in step 79.
- a high gain means a steeper slope 20 is set.
- the BS curve is targeted for sequences with a high overall brightness or has few dark areas.
- the quantity of dark pixels in the field picture is used to determine the range and gain settings, which preferably depends on the percentage of dark pixels in the picture.
- the gain settings may be decided based on the percentage amount of Hist_sum4 ( 0 ) compared to all pixels in the histogram ranging between 2 predefined percentage thresholds, the BS_th_low and BS_th_high.
- the maximum gain can be set (i.e. a steepest slope is set).
- the minimum gain or zero gain is set (which means no inflection at all).
- a minimum gain setting means the mapping curve has no inflection at all (i.e. slope 20 coincides with the dotted line 25 in Figure 2 and forms a straight line with slope 22). This straight line 22 24 is at an angle of 45 degrees to the horizontal X-axis.
- maximum gain is where slope 20 is at an angle of 65 degrees to the horizontal X-axis.
- percentage values of Hist_sum4 ( 0 ) compared to all pixels in the histogram which fall within the BS_th_low and BS_th_high thresholds, a plurality of discrete gain setting positions are provided to correspond to each discrete and evenly spaced threshold intervals between the BS_th_low and BS_th_high thresholds.
- the number of discrete gain settings can be any number between 15 and 50, inclusive.
- Hist _ sum4 ( 0 ) indicates a lower percentage of dark pixels within the threshold range which falls within the range of one of the intervals closer to the BS_th_low threshold, this translates into a particular discrete low gain setting corresponding to that interval.
- Hist_sum4 ( 0 ) indicates a higher percentage value of dark pixels within the threshold range which falls within the range of one of the intervals closer to the BS_th_high threshold, this translates into a particular discrete high gain setting corresponding to that interval.
- Example values of BS_th_low and BS_th_high may be 0 percent and 10 percent respectively.
- the low complexity algorithm for the Mapping Functions Decision Process 58 be implemented in software made to run on a simple programmable controller or processor.
- the algorithm in Figure 7 can be flexibly applied a software add-on to any existing systems with switchable/selectable mapping functions.
- This invention could also be applied to digital still pictures.
Landscapes
- Physics & Mathematics (AREA)
- General Physics & Mathematics (AREA)
- Engineering & Computer Science (AREA)
- Theoretical Computer Science (AREA)
- Picture Signal Circuits (AREA)
- Facsimile Image Signal Circuits (AREA)
- Image Processing (AREA)
Applications Claiming Priority (2)
| Application Number | Priority Date | Filing Date | Title |
|---|---|---|---|
| SG200303729 | 2003-06-27 | ||
| SG200303729A SG118191A1 (en) | 2003-06-27 | 2003-06-27 | Method and system for contrast enhancement of digital video |
Publications (2)
| Publication Number | Publication Date |
|---|---|
| EP1492052A2 true EP1492052A2 (de) | 2004-12-29 |
| EP1492052A3 EP1492052A3 (de) | 2006-09-27 |
Family
ID=33414925
Family Applications (1)
| Application Number | Title | Priority Date | Filing Date |
|---|---|---|---|
| EP04102948A Withdrawn EP1492052A3 (de) | 2003-06-27 | 2004-06-24 | Verfahren und Anordnung zur Kontrastverbesserung eines Digitalvideos |
Country Status (3)
| Country | Link |
|---|---|
| US (1) | US7424148B2 (de) |
| EP (1) | EP1492052A3 (de) |
| SG (1) | SG118191A1 (de) |
Cited By (3)
| Publication number | Priority date | Publication date | Assignee | Title |
|---|---|---|---|---|
| CN100345160C (zh) * | 2005-08-22 | 2007-10-24 | 上海广电(集团)有限公司中央研究院 | 一种控制平均亮度的直方图均衡方法 |
| EP3091505A1 (de) * | 2015-05-08 | 2016-11-09 | JEOL Ltd. | Bildprozessor, elektronenmikroskop und bildverarbeitungsverfahren |
| EP1918875A3 (de) * | 2006-10-25 | 2016-12-07 | Samsung Electronics Co., Ltd. | Anzeigevorrichtung und Verfahren zur Flimmerverminderung des Bildes |
Families Citing this family (58)
| Publication number | Priority date | Publication date | Assignee | Title |
|---|---|---|---|---|
| US6950211B2 (en) * | 2001-07-05 | 2005-09-27 | Corel Corporation | Fine moire correction in images |
| JP2005348237A (ja) * | 2004-06-04 | 2005-12-15 | Brother Ind Ltd | 画像濃度調整装置及びこの装置を備えた画像読取装置 |
| US8295541B2 (en) * | 2004-06-30 | 2012-10-23 | Vision Fire & Security Pty Ltd | System and method for detecting a change in an object scene |
| US8031969B1 (en) * | 2004-09-07 | 2011-10-04 | Nvidia Corporation | Fourier transform optimized anisotropic filtering |
| US8131108B2 (en) * | 2005-04-22 | 2012-03-06 | Broadcom Corporation | Method and system for dynamic contrast stretch |
| CN100407765C (zh) * | 2005-09-07 | 2008-07-30 | 逐点半导体(上海)有限公司 | 图像对比度增强装置及增强方法 |
| US7684639B2 (en) * | 2005-10-20 | 2010-03-23 | Sharp Laboratories Of America, Inc. | Methods and systems for automatic digital image enhancement |
| KR101128454B1 (ko) * | 2005-11-10 | 2012-03-23 | 삼성전자주식회사 | 콘트라스트 향상 방법 및 장치 |
| US8295596B1 (en) | 2005-12-07 | 2012-10-23 | Marvell International Ltd. | Adaptive histogram-based video contrast enhancement |
| US8089433B2 (en) * | 2006-01-11 | 2012-01-03 | Tte Technology, Inc. | Contrast ratio enhancement system using black detector |
| US7692612B2 (en) * | 2006-02-08 | 2010-04-06 | Moxair, Inc. | Video enhancement and display power management |
| KR101225058B1 (ko) * | 2006-02-14 | 2013-01-23 | 삼성전자주식회사 | 콘트라스트 조절 방법 및 장치 |
| US7991225B2 (en) * | 2006-03-03 | 2011-08-02 | University Of Alaska | Methods and systems for dynamic color equalization |
| JP5196731B2 (ja) * | 2006-04-20 | 2013-05-15 | キヤノン株式会社 | 画像処理装置及び画像処理方法 |
| CN100568926C (zh) * | 2006-04-30 | 2009-12-09 | 华为技术有限公司 | 自动曝光控制参数的获得方法及控制方法和成像装置 |
| US8369646B2 (en) * | 2006-05-17 | 2013-02-05 | Sony Corporation | Image correction circuit, image correction method and image display |
| US8369645B2 (en) * | 2006-05-17 | 2013-02-05 | Sony Corporation | Image correction circuit, image correction method and image display |
| JP2007329700A (ja) * | 2006-06-08 | 2007-12-20 | Sony Corp | 映像信号処理装置、映像表示装置および映像表示方法 |
| KR20080015626A (ko) * | 2006-08-16 | 2008-02-20 | 삼성전자주식회사 | 영상처리장치 및 영상처리방법 |
| JP4854431B2 (ja) * | 2006-08-31 | 2012-01-18 | キヤノン株式会社 | 画像処理装置およびその方法 |
| KR100849845B1 (ko) * | 2006-09-05 | 2008-08-01 | 삼성전자주식회사 | 영상 보정 방법 및 장치 |
| US8009907B1 (en) | 2006-11-08 | 2011-08-30 | Marvell International Ltd. | Localized, adaptive video contrast enhancement using controlled histogram equalization |
| US8115967B2 (en) * | 2006-11-28 | 2012-02-14 | Silverbrook Research Pty Ltd | Localized signal data preservation within signal bandwidth |
| US7667739B2 (en) * | 2006-12-15 | 2010-02-23 | Mediatek Inc. | Brightness adjusting methods for video frames of video sequence by applying scene change detection and/or blinking detection and brightness adjusting devices thereof |
| US20080247665A1 (en) * | 2007-04-04 | 2008-10-09 | Silicon Integrated Systems Corp. | Method and apparatus for dynamic contrast enhancement |
| KR100944595B1 (ko) * | 2007-04-24 | 2010-02-25 | 가부시끼가이샤 르네사스 테크놀로지 | 표시 장치, 표시 장치 구동 회로, 화상 표시 방법, 전자기기 및 화상 표시 장치 구동 회로 |
| US8285071B2 (en) * | 2007-09-10 | 2012-10-09 | Himax Technologies Limited | Content-adaptive contrast improving method and apparatus for digital image |
| US8107756B2 (en) * | 2007-10-11 | 2012-01-31 | Himax Technologies Limited | Digital image tone remapping method and apparatus |
| US9398314B2 (en) * | 2008-02-05 | 2016-07-19 | Microsoft Technology Licensing, Llc | Entropy coding efficiency enhancement utilizing energy distribution remapping |
| US20090274383A1 (en) * | 2008-05-02 | 2009-11-05 | Jonathan Yen | System and method for global image enhancement of darkened image |
| JP5180916B2 (ja) * | 2008-06-25 | 2013-04-10 | 株式会社半導体エネルギー研究所 | 画像処理システム、及び画像処理方法 |
| US8483508B2 (en) * | 2008-08-19 | 2013-07-09 | Kabushiki Kaisha Toshiba | Digital image tone adjustment |
| WO2010033539A2 (en) * | 2008-09-16 | 2010-03-25 | Second Sight Medical Products | Digital image filters and related methods for image contrast enhancement |
| US8436914B2 (en) * | 2008-11-07 | 2013-05-07 | Cisco Technology, Inc. | Method for automatic exposure control within a video capture device |
| US8125569B2 (en) * | 2008-12-03 | 2012-02-28 | Sony Corporation | Dynamic contrast on displays using average picture level and histogram analysis |
| JP4575501B2 (ja) * | 2009-02-26 | 2010-11-04 | 株式会社東芝 | 映像信号処理装置及びその制御方法及びテレビジョン信号受信装置 |
| JP5436020B2 (ja) * | 2009-04-23 | 2014-03-05 | キヤノン株式会社 | 画像処理装置および画像処理方法 |
| JP2010278724A (ja) * | 2009-05-28 | 2010-12-09 | Olympus Corp | 画像処理装置、画像処理方法及び画像処理プログラム |
| CN101990045B (zh) * | 2009-07-29 | 2014-02-19 | 鸿富锦精密工业(深圳)有限公司 | 数字图像检测系统及方法 |
| JP5424921B2 (ja) * | 2009-08-31 | 2014-02-26 | キヤノン株式会社 | 画像処理装置及びその制御方法 |
| US20110110589A1 (en) * | 2009-11-06 | 2011-05-12 | Kabushiki Kaisha Toshiba | Image Contrast Enhancement |
| US9473792B2 (en) | 2009-11-06 | 2016-10-18 | Texas Instruments Incorporated | Method and system to improve the performance of a video encoder |
| TWI399985B (zh) * | 2009-12-16 | 2013-06-21 | Micro Star Int Co Ltd | 影像調校方法 |
| US8698961B2 (en) * | 2010-05-21 | 2014-04-15 | Vixs Systems, Inc. | Enhanced histogram equalization |
| US8599318B2 (en) * | 2010-05-21 | 2013-12-03 | Vixs Systems, Inc. | Contrast control device and method therefor |
| CN103119924A (zh) * | 2010-10-15 | 2013-05-22 | 夏普株式会社 | 图像处理装置、图像处理方法、图像处理程序、记录媒体 |
| US8463037B2 (en) * | 2011-03-31 | 2013-06-11 | Sony Corporation | Detection of low contrast for image processing |
| US9241153B2 (en) | 2013-04-03 | 2016-01-19 | Stmicroelectronics Asia Pacific Pte. Ltd. | Contrast adjusted anaglyph for reducing ghosting artifacts |
| US8885105B1 (en) | 2013-06-17 | 2014-11-11 | Cyberlink Corp. | Systems and methods for performing region-based local contrast enhancement |
| JP2015230411A (ja) * | 2014-06-05 | 2015-12-21 | 株式会社ジャパンディスプレイ | 表示装置 |
| WO2016195927A1 (en) * | 2015-06-02 | 2016-12-08 | Life Technologies Corporation | Systems and methods for calibrating a structured illumination imaging system and for capturing a structured illumination image |
| EP3459043A4 (de) * | 2016-06-21 | 2019-04-24 | Zhejiang Dahua Technology Co., Ltd | Systeme und verfahren zur bildverarbeitung |
| JP6684971B2 (ja) * | 2017-01-18 | 2020-04-22 | ドルビー ラボラトリーズ ライセンシング コーポレイション | ハイダイナミックレンジ映像を符号化するためのセグメントベース再構成 |
| US11120104B2 (en) * | 2017-03-01 | 2021-09-14 | Stmicroelectronics (Research & Development) Limited | Method and apparatus for processing a histogram output from a detector sensor |
| CN107403422B (zh) * | 2017-08-04 | 2020-03-27 | 上海兆芯集成电路有限公司 | 用以增强图像对比度的方法及其系统 |
| WO2019133986A1 (en) * | 2017-12-30 | 2019-07-04 | Wu Yecheng | Printing white features of an image using a print device |
| KR102584198B1 (ko) * | 2019-07-31 | 2023-10-04 | 엘지전자 주식회사 | 디스플레이 장치 및 그의 동작 방법 |
| CN113763294B (zh) * | 2021-09-26 | 2023-08-08 | 上海航天精密机械研究所 | 基于动态clahe的焊缝图像快速预处理方法及系统 |
Family Cites Families (23)
| Publication number | Priority date | Publication date | Assignee | Title |
|---|---|---|---|---|
| WO2002091302A2 (en) * | 2001-05-04 | 2002-11-14 | Legend Films, Llc | Image sequence enhancement system and method |
| CA2008819A1 (en) * | 1989-02-14 | 1990-08-14 | Dimitris Manolakis | Regionally adaptive imaging techniques |
| JPH0799862B2 (ja) * | 1991-03-22 | 1995-10-25 | 松下電器産業株式会社 | 階調補正装置 |
| US5383168A (en) | 1993-04-01 | 1995-01-17 | Eastman Kodak Company | Actively athermalized optical head assembly |
| KR0142290B1 (ko) | 1993-11-24 | 1998-06-15 | 김광호 | 장면적응 영상개선방법 및 그 회로 |
| US5982926A (en) * | 1995-01-17 | 1999-11-09 | At & T Ipm Corp. | Real-time image enhancement techniques |
| JP3501252B2 (ja) * | 1995-06-16 | 2004-03-02 | 三菱電機株式会社 | 階調補正装置 |
| KR100189922B1 (ko) | 1996-06-20 | 1999-06-01 | 윤종용 | 히스토그램 등화를 이용한 동영상의 콘트라스트개선회로 및 그 방법 |
| JP3280888B2 (ja) | 1996-08-19 | 2002-05-13 | 三星電子株式会社 | 量子化された平均−マッチングヒストグラム等化を用いた画質改善方法及びその回路 |
| FI104521B (fi) | 1997-01-30 | 2000-02-15 | Nokia Multimedia Network Termi | Menetelmä kuvasekvenssien kontrastin parantamiseksi |
| KR100261214B1 (ko) * | 1997-02-27 | 2000-07-01 | 윤종용 | 영상처리 시스템의 콘트라스트 확장장치에서 히스토그램 등화방법 및 장치 |
| US6198845B1 (en) * | 1997-07-01 | 2001-03-06 | Xerox Corporation | Method for determining document background for adjusting the dynamic range of an image of the document |
| US6236751B1 (en) * | 1998-09-23 | 2001-05-22 | Xerox Corporation | Automatic method for determining piecewise linear transformation from an image histogram |
| DE50001023D1 (de) * | 1999-06-15 | 2003-02-06 | Infineon Technologies Ag | Verfahren und schaltungsanordnung zur kontrastverbesserung eines bildes |
| US6983083B2 (en) * | 2001-02-13 | 2006-01-03 | Eastman Kodak Company | Image specific perceived overall contrast prediction |
| US6826310B2 (en) * | 2001-07-06 | 2004-11-30 | Jasc Software, Inc. | Automatic contrast enhancement |
| EP1308891B1 (de) * | 2001-10-31 | 2009-01-21 | Sony Deutschland GmbH | Verfahren zum Verbessern der Qualität eines Bildes |
| CA2365893A1 (en) * | 2001-12-21 | 2003-06-21 | Jaldi Semiconductor Corp. | System and method for dynamically enhanced colour space |
| KR100456017B1 (ko) * | 2002-02-06 | 2004-11-08 | 삼성전자주식회사 | 히스토그램 매칭을 이용한 콘트라스트 향상 장치 및 방법 |
| EP1345172A1 (de) * | 2002-02-26 | 2003-09-17 | Sony International (Europe) GmbH | Kontrastverbesserung in digitalen Bildern |
| US7079686B2 (en) * | 2002-08-20 | 2006-07-18 | Lexmark International, Inc. | Systems and methods for content-based document image enhancement |
| US7058234B2 (en) * | 2002-10-25 | 2006-06-06 | Eastman Kodak Company | Enhancing the tonal, spatial, and color characteristics of digital images using expansive and compressive tone scale functions |
| US7149358B2 (en) * | 2002-11-27 | 2006-12-12 | General Electric Company | Method and system for improving contrast using multi-resolution contrast based dynamic range management |
-
2003
- 2003-06-27 SG SG200303729A patent/SG118191A1/en unknown
-
2004
- 2004-06-24 EP EP04102948A patent/EP1492052A3/de not_active Withdrawn
- 2004-06-28 US US10/878,981 patent/US7424148B2/en active Active
Cited By (3)
| Publication number | Priority date | Publication date | Assignee | Title |
|---|---|---|---|---|
| CN100345160C (zh) * | 2005-08-22 | 2007-10-24 | 上海广电(集团)有限公司中央研究院 | 一种控制平均亮度的直方图均衡方法 |
| EP1918875A3 (de) * | 2006-10-25 | 2016-12-07 | Samsung Electronics Co., Ltd. | Anzeigevorrichtung und Verfahren zur Flimmerverminderung des Bildes |
| EP3091505A1 (de) * | 2015-05-08 | 2016-11-09 | JEOL Ltd. | Bildprozessor, elektronenmikroskop und bildverarbeitungsverfahren |
Also Published As
| Publication number | Publication date |
|---|---|
| US7424148B2 (en) | 2008-09-09 |
| EP1492052A3 (de) | 2006-09-27 |
| SG118191A1 (en) | 2006-01-27 |
| US20050031201A1 (en) | 2005-02-10 |
Similar Documents
| Publication | Publication Date | Title |
|---|---|---|
| US7424148B2 (en) | Method and system for contrast enhancement of digital video | |
| EP0856813B1 (de) | Verfahren zur Kontrastverbesserung von Bildsequenzen | |
| CN106846270B (zh) | 一种图像边缘增强方法及装置 | |
| JP3862140B2 (ja) | ピクセル化されたイメージをセグメント化する方法および装置、並びに記録媒体、プログラム、イメージキャプチャデバイス | |
| KR100782845B1 (ko) | 비로그 도메인 조도 수정을 이용한 디지털 영상 개선방법과 시스템 | |
| US20020012065A1 (en) | Exposure control apparatus and method thereof | |
| US7292734B2 (en) | Black and white stretching system and method for improving contrast of a picture | |
| JP2004048773A (ja) | 画面間の相関度を用いた画質改善回路及び方法 | |
| KR100429858B1 (ko) | 적응적 필터를 이용한 촛점 조절장치 및 방법 | |
| JP3267200B2 (ja) | 画像処理装置 | |
| EP1439490A2 (de) | Schwingungsbeseitigung in der Bildverbesserung | |
| EP2372638B1 (de) | Schwarz-Weiss-Spannverfahren zur dynamischen Bereichserweiterung | |
| KR100949403B1 (ko) | 화상 노이즈 저감 방법 및 장치 | |
| CN113905194B (zh) | 一种曝光比处理方法、终端设备及计算机存储介质 | |
| US20070041636A1 (en) | Apparatus and method for image contrast enhancement using RGB value | |
| NL1016523C2 (nl) | Zwartniveau-uitrekinrichting en werkwijze, die in staat zijn flikkering tot een minimum te beperken. | |
| JP2000188768A (ja) | 自動階調補正方法 | |
| CN118338131B (zh) | 一种动态亮度稳定方法 | |
| KR101761947B1 (ko) | 카메라 영상의 블루밍 저감 방법 및 장치 | |
| KR20090019657A (ko) | 영상상태 판단 및 그 영상 상태 판단에 따른 노광 제어방법 | |
| EP4623404A1 (de) | Adaptive anpassung der gesichtshelligkeit für bilder und video | |
| JP2003179779A (ja) | ノイズリダクション装置および方法 | |
| JP2006180267A (ja) | 画質補正回路 | |
| US20100171884A1 (en) | Video processing apparatus | |
| JPH1132201A (ja) | 画像処理装置 |
Legal Events
| Date | Code | Title | Description |
|---|---|---|---|
| PUAI | Public reference made under article 153(3) epc to a published international application that has entered the european phase |
Free format text: ORIGINAL CODE: 0009012 |
|
| AK | Designated contracting states |
Kind code of ref document: A2 Designated state(s): AT BE BG CH CY CZ DE DK EE ES FI FR GB GR HU IE IT LI LU MC NL PL PT RO SE SI SK TR |
|
| AX | Request for extension of the european patent |
Extension state: AL HR LT LV MK |
|
| RIC1 | Information provided on ipc code assigned before grant |
Ipc: 7H 04N 5/14 B Ipc: 7H 04N 5/57 B Ipc: 7H 04N 1/407 B Ipc: 7G 06T 5/40 A |
|
| PUAL | Search report despatched |
Free format text: ORIGINAL CODE: 0009013 |
|
| RIC1 | Information provided on ipc code assigned before grant |
Ipc: G06T 5/00 20060101ALI20060801BHEP Ipc: H04N 5/14 20060101ALI20060801BHEP Ipc: H04N 5/57 20060101ALI20060801BHEP Ipc: H04N 1/407 20060101ALI20060801BHEP Ipc: G06T 5/40 20060101AFI20050602BHEP |
|
| AK | Designated contracting states |
Kind code of ref document: A3 Designated state(s): AT BE BG CH CY CZ DE DK EE ES FI FR GB GR HU IE IT LI LU MC NL PL PT RO SE SI SK TR |
|
| AX | Request for extension of the european patent |
Extension state: AL HR LT LV MK |
|
| 17P | Request for examination filed |
Effective date: 20070323 |
|
| AKX | Designation fees paid |
Designated state(s): DE FR GB IT |
|
| 17Q | First examination report despatched |
Effective date: 20070509 |
|
| STAA | Information on the status of an ep patent application or granted ep patent |
Free format text: STATUS: THE APPLICATION IS DEEMED TO BE WITHDRAWN |
|
| 18D | Application deemed to be withdrawn |
Effective date: 20100105 |