EP1498070A1 - Nichtinvasives blutbestandteile- messinstrument und verfahren - Google Patents
Nichtinvasives blutbestandteile- messinstrument und verfahren Download PDFInfo
- Publication number
- EP1498070A1 EP1498070A1 EP03712898A EP03712898A EP1498070A1 EP 1498070 A1 EP1498070 A1 EP 1498070A1 EP 03712898 A EP03712898 A EP 03712898A EP 03712898 A EP03712898 A EP 03712898A EP 1498070 A1 EP1498070 A1 EP 1498070A1
- Authority
- EP
- European Patent Office
- Prior art keywords
- light
- blood
- spectrum
- blood glucose
- glucose concentration
- Prior art date
- Legal status (The legal status is an assumption and is not a legal conclusion. Google has not performed a legal analysis and makes no representation as to the accuracy of the status listed.)
- Withdrawn
Links
Images

Classifications
-
- A—HUMAN NECESSITIES
- A61—MEDICAL OR VETERINARY SCIENCE; HYGIENE
- A61B—DIAGNOSIS; SURGERY; IDENTIFICATION
- A61B5/00—Measuring for diagnostic purposes; Identification of persons
- A61B5/14—Devices for taking samples of blood ; Measuring characteristics of blood in vivo, e.g. gas concentration within the blood, pH-value of blood
-
- A—HUMAN NECESSITIES
- A61—MEDICAL OR VETERINARY SCIENCE; HYGIENE
- A61B—DIAGNOSIS; SURGERY; IDENTIFICATION
- A61B5/00—Measuring for diagnostic purposes; Identification of persons
- A61B5/145—Measuring characteristics of blood in vivo, e.g. gas concentration or pH-value ; Measuring characteristics of body fluids or tissues, e.g. interstitial fluid or cerebral tissue
- A61B5/1455—Measuring characteristics of blood in vivo, e.g. gas concentration or pH-value ; Measuring characteristics of body fluids or tissues, e.g. interstitial fluid or cerebral tissue using optical sensors, e.g. spectral photometrical oximeters
-
- A—HUMAN NECESSITIES
- A61—MEDICAL OR VETERINARY SCIENCE; HYGIENE
- A61B—DIAGNOSIS; SURGERY; IDENTIFICATION
- A61B5/00—Measuring for diagnostic purposes; Identification of persons
- A61B5/145—Measuring characteristics of blood in vivo, e.g. gas concentration or pH-value ; Measuring characteristics of body fluids or tissues, e.g. interstitial fluid or cerebral tissue
- A61B5/14532—Measuring characteristics of blood in vivo, e.g. gas concentration or pH-value ; Measuring characteristics of body fluids or tissues, e.g. interstitial fluid or cerebral tissue for measuring glucose, e.g. by tissue impedance measurement
-
- A—HUMAN NECESSITIES
- A61—MEDICAL OR VETERINARY SCIENCE; HYGIENE
- A61B—DIAGNOSIS; SURGERY; IDENTIFICATION
- A61B5/00—Measuring for diagnostic purposes; Identification of persons
- A61B5/145—Measuring characteristics of blood in vivo, e.g. gas concentration or pH-value ; Measuring characteristics of body fluids or tissues, e.g. interstitial fluid or cerebral tissue
- A61B5/14546—Measuring characteristics of blood in vivo, e.g. gas concentration or pH-value ; Measuring characteristics of body fluids or tissues, e.g. interstitial fluid or cerebral tissue for measuring analytes not otherwise provided for, e.g. ions, cytochromes
-
- G—PHYSICS
- G01—MEASURING; TESTING
- G01N—INVESTIGATING OR ANALYSING MATERIALS BY DETERMINING THEIR CHEMICAL OR PHYSICAL PROPERTIES
- G01N21/00—Investigating or analysing materials by the use of optical means, i.e. using sub-millimetre waves, infrared, visible or ultraviolet light
- G01N21/17—Systems in which incident light is modified in accordance with the properties of the material investigated
- G01N21/25—Colour; Spectral properties, i.e. comparison of effect of material on the light at two or more different wavelengths or wavelength bands
- G01N21/31—Investigating relative effect of material at wavelengths characteristic of specific elements or molecules, e.g. atomic absorption spectrometry
- G01N21/35—Investigating relative effect of material at wavelengths characteristic of specific elements or molecules, e.g. atomic absorption spectrometry using infrared light
- G01N21/359—Investigating relative effect of material at wavelengths characteristic of specific elements or molecules, e.g. atomic absorption spectrometry using infrared light using near infrared light
-
- G—PHYSICS
- G01—MEASURING; TESTING
- G01N—INVESTIGATING OR ANALYSING MATERIALS BY DETERMINING THEIR CHEMICAL OR PHYSICAL PROPERTIES
- G01N33/00—Investigating or analysing materials by specific methods not covered by groups G01N1/00 - G01N31/00
- G01N33/48—Biological material, e.g. blood, urine; Haemocytometers
- G01N33/483—Physical analysis of biological material
- G01N33/487—Physical analysis of biological material of liquid biological material
- G01N33/49—Blood
- G01N33/491—Blood by separating the blood components
-
- G—PHYSICS
- G01—MEASURING; TESTING
- G01N—INVESTIGATING OR ANALYSING MATERIALS BY DETERMINING THEIR CHEMICAL OR PHYSICAL PROPERTIES
- G01N2201/00—Features of devices classified in G01N21/00
- G01N2201/12—Circuits of general importance; Signal processing
- G01N2201/122—Kinetic analysis; determining reaction rate
- G01N2201/1228—Reading time being controlled, e.g. by microprocessor
-
- G—PHYSICS
- G01—MEASURING; TESTING
- G01N—INVESTIGATING OR ANALYSING MATERIALS BY DETERMINING THEIR CHEMICAL OR PHYSICAL PROPERTIES
- G01N2201/00—Features of devices classified in G01N21/00
- G01N2201/12—Circuits of general importance; Signal processing
- G01N2201/123—Conversion circuit
- G01N2201/1232—Log representation, e.g. for low transmittance
-
- G—PHYSICS
- G01—MEASURING; TESTING
- G01N—INVESTIGATING OR ANALYSING MATERIALS BY DETERMINING THEIR CHEMICAL OR PHYSICAL PROPERTIES
- G01N2201/00—Features of devices classified in G01N21/00
- G01N2201/12—Circuits of general importance; Signal processing
- G01N2201/129—Using chemometrical methods
Definitions
- the present invention relates to an instrument and a method for measuring blood biochemical constituent including blood glucose concentration and, more particularly, to a non-invasive blood constituent measuring instrument and a method for measuring blood glucose concentration without sampling blood from a living body.
- this method is to measure glucose in blood serum using the PLS method (partial least squares analysis) that is one of chemometrics by measuring infrared spectrum with lights in two wavelength ranges of 1325 ⁇ 1800 nm and 2035 ⁇ 2375 nmapplied to glucose sample melted in blood serum.
- PLS method partial least squares analysis
- the glucose absorption band overlaps the absorption ranges of other biological tissues in living bodies such as bones, veins, muscles and it is difficult to separate the ranges and the accurate measurement is not feasible and is therefore not put in practical use.
- an objective of the present invention is to provide a non-invasive blood glucose measuring instrument and a measuring method by solving the above-mentioned problems to allow the blood glucose concentration measurement with a simple way as well as with high accuracy.
- a non-invasive blood constituent measuring instrument includes a light source to irradiate a light having plural wavelengths to a living body; a light detector to detect the light transmitted through a living body or reflected therefrom; an instantaneous spectrum analyzer to analyze spectrum of light transmitted through or reflected on the living body at different times when the output signal of the light receiver is supplied; a spectrum subtraction generator to generate spectrum subtraction from light spectrum at the different times measured by the spectrum analyzer; and a blood constituent predictor into which output data of the spectrum subtraction is input and blood constituent is output.
- a blood constituent predictor is provided with a multi-regression analyzing model using plural spectrum data of whole blood constituent of which is known as an explanatory variable and using the blood constituent as an objective variable, wherein being input the spectrum subtraction data obtained from the blood of which blood constituent is known as the explanatory variable, the multi-regression analyzing model computes the object variable and outputs this objective variable as a blood constituent.
- the non-invasive blood glucose concentration measuring instrument is composed of a light source to irradiate a light containing plural wavelengths; a light detector to detect the light transmitted through a living body or reflected therefrom; an instantaneous spectrum analyzer to which the output signal of the light receiver is supplied and which analyzes spectrum of the light transmitted through the living body or reflected therefrom at different times; a spectrum subtraction generator to generate spectrum subtraction from the spectrum of the light measured by the spectrum analyzer at the different times; and a blood glucose concentration predictor into which the output data of the spectrum subtraction generator is input and which outputs the blood glucose concentration.
- the blood glucose concentration predictor is constructed with a multi-regression analyzing model into which spectrum subtraction data of plural whole blood samples of known blood constituent is input as the explanatory variable and in which the blood glucose concentration is computed as an objective variable and output as blood glucose concentration.
- a non-invasive blood constituent measuring method includes the steps of irradiating a light containing plural wavelengths to a living body; detecting light transmitted through or reflected from the living body and converting it into an electric signal; analyzing spectrum of the light transmitted through the living body or reflected therefrom at different times using the converted electric signal; generating spectrum subtraction from the spectrum of the light at the different times; and predicting corresponding blood constituents from the spectrum subtraction.
- the blood constituent predicting step futher includes the steps of preparing a multi-regression analyzing model, into which spectrum data of plural whole blood samples having known blood constituent is input as an explanatory variable and blood constituent is output as an objective variable, inputting the spectrum subtraction data obtained from blood of which blood constituent is not known as an explanatory variable, and outputting the blood constituent as an objective variable.
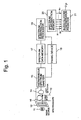
- FIG. 1 is a block diagram showing a non-invasive blood glucose concentration measuring instrument of the present invention.
- the light source 11 to emit a light having a near infrared wavelength range of, for example, 800 ⁇ 2400 nm wave length has been installed in a non-invasive blood glucose concentration measuring instrument.
- the light emitted from the light source 11 is irradiated to a living body 13 such as a fingertip, an ear lobule, etc. through an active spectroscope 12.
- the active spectroscope 12 separates light emitted from the light source 11 sequentially over its whole wavelength range at an interval of, for example, 3 nm and sequentially outputs about 530 number of lights having a diferent wavelength.
- the scanning of the wavelength by the active spectroscope 12 in the above-mentioned wavelength range is executed repeatedly about 20 times or more in one cycle time of the arterial volume waveform in the living body 13.
- the active spectroscope 12 transmits the lights in a near infrared range sequentially at an interval of about 50 ms or less and irradiates them to the living body 13.
- the light passed through the living body 13 is detected by a light detector arranged at the opposite side of the light source 11 and is converted into an electric signal.
- An output signal of the light detector 14 is supplied to an instantaneous spectrum analyzer 15, wherein an absorption spectrum obtained as an output of the light detector 14 for each wavelength of the light source 11 is produced. That is, the output from a sensor 16 that detects an intensity of the light incident to the living body 13 from the light source 11, that is, an intensity of the incident light I ⁇ o with each wavelength ( ⁇ ) is supplied with the output signal of the light detector 14 to the spectrum analyzer 15.
- the intensity of light (I ⁇ ) with each wavelength( ⁇ ) passed through the living body 13, that is, an absorbance(OD ⁇ ) which is a ratio of the logarithmic intensity of passed light I ⁇ to that of the incident light I ⁇ o (OD ⁇ log I ⁇ o / I ⁇ ) is computed here and an absorption spectrum is produced. Twenty(20) number of the absorption spectrums are produced per second by twenty (20) times of scanning per second of the active spectroscope 12 as described above.
- the absorption spectrum data obtained by the spectrum analyzer 15 is stored in a spectrum data memory 17.
- the spectrum data memory 17 stores and maintains output data for several seconds of the spectrum analyzer 15 sequentially on the first-in first-out basis.
- the subtraction data ( ⁇ OD ⁇ ti ) include only information of arterial blood without the other biological tissue components such as skin, bones, muscles etc, as also described later.
- the spectrum analyzer 15, the spectrum data memory 17 and the subtraction processor 18 are operated in sync with the 20 times scanning per second of the active analyzer 12.
- the synchronization between these units is made by a timing device 19 to supply a synchronizing signal to them.
- the spectrum subtraction data ( ⁇ OD ⁇ ti ) produced by the subtraction processor 18 is stored in a spectrum subtraction memory 20.
- the spectrum subtraction memory 20 also stores the output data of the subtraction processor 18 for several seconds sequentially on the first-in first-out basis.
- the spectrum subtraction data read out of this spectrum subtraction memory 20 is input into a blood glucose predictor 21.
- the blood glucose predictor 21 is a device to predict blood glucose concentration through the multi-regression analysis using the PLS (Partial Least Squares Regression) method that is one of multi-regression analyses from input spectrum subtraction data. That is, the blood glucose predictor 21 is constructed as a software model to compute the blood glucose concentration according to the PLS method using whole blood samples that have many known blood glucose concentrations.
- PLS Partial Least Squares Regression
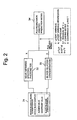
- FIG. 2 is a flow chart showing a method for constructing the blood glucose predictor 21 as the software model shown in FIG. 1.
- Known blood glucose concentration samples 31 are the whole blood samples filled in plural quartz photo-cells whose glucose concentrations are known and are slightly differrnt from each other. These samples 31 were taken directly from, for example, seven healthy adult males and were made the plural whole blood samples having different albumin or hematocrit concentrations from other blood samples by 18 mg/dl like 36, 54, ... 486 mg/dl in the glucose concentration range 30 - 450 mg. These samples. 31 are analyzed by a spectroscopic analyzer composed of the light source 11, the spectroscope 12, the lightdetector 14 and the spectrum analyzer 15, and thus a absorption spectrum 32 is prepared.
- a PLS regression analysis prediction model 34 is determined by data X consisting of these absorption spectrum 32, together with corresponding known n number of blood glucose concentrations(yn) 33. That is, data X consisting of the absorption spectrum 32 is an absorbance for different m (about 530 waves) number of the spectroscopic waveforms. Expressing these absorbance with x 1 , x 2 , ..., x m , the known n number of blood glucose concentrations y1, y2, ..., yn are approximated by the following determinant using these variables:
- a coefficient of this determinant is determined using the PLS method by substituting the absorption spectrum data using the above-mentioned sample solution into the determinant.
- a blood glucose prediction model formula is thus obtained.
- the PLS method is a technique to consider the correlation of potential variables T PLS as explanatory variables and to utilize data contained in X as many as possible.
- P of the determinant 2 and regression coefficient q of potential variable T are determined by inputting blood glucose y 1 , y 2 , ⁇ y n of n known blood glucose samples into a regression analytical computer application software (for example, Trade Name: MATLAB) according to the PLS method available in the market.
- a regression analysis prediction model blood glucose computing model
- a new T is computed based on P that is determined when a model is prepared, when new absorbance of respective spectroscopic wavelengths x 1 , x 2 ,..., x m obtained from blood of which blood glucose concentration is unknown are input as data.
- the light emitted from the light source 11 is spectroscopically scanned over the wavelength range by the active spectroscope 12 at a rate of, for example, 20 times per second and is irradiated to the living body 13.
- the light transmitted through the living body 13 is detected by the light detector 14 and each absorption spectrum is measured by the spectrum analyzer 15 at an intervals of 40 ⁇ 50 ms.
- the spectrum data thus measured is stored in the spectrum memory 20 until the next spectrum measuring time.
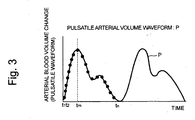
- FIG. 3 shows the arterial pulsatile volume waveform in the living body 13, the horizontal axis shows time and the vertical axis shows arterial blood volume change (pulsatile volume waveform). Time t 1 , t 2 , ..., t n in FIG.
- FIG. 3 show the time when the scanning of the wavelength starts by the active spectroscope 12, where n is 20 in this case.
- the spectrum subtraction processor 18 shown in FIG. 1 produces a spectrum subtraction from absorption spectrums at two any optional times, for example, a time t 1 and a peak time t m in the arterial pulsatile volume waveform selected from the times t 1 , t 2 , ..., t n .
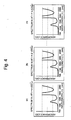
- FIG. 5 is a diagram for explaining an operation of the blood glucose predictor 21 shown in FIG. 1.
- One example. of the above-mentioned spectrum subtraction is shown in FIG. 5(a).
- the horizontal axis in FIG. 5 shows the wavelength( ⁇ ) and the vertical axis shows a difference in the absorbance ( ⁇ OD ⁇ ti ).
- the curved line indicating the spectrum subtraction is a plotted difference in the absorbance at respective wavelengths of absorption spectrum, for example, at t 3 and t 6 in this case
- Graphes (S1), (S2), ..., (Sm) in FIG. 5 show absorption spectrums of m number of whole blood samples of known blood glucose concentration.
- Spectrum subtraction data shown in FIG. 5 (a) are input to the blood glucose concentration predictor 21. Further, a PLS regression analytical model is incorporated in the blood glucose concentration predictor 21.
- the PLS regression analytical model is a numerical expression showing the relation between absorption spectrums of m number of whole blood samples (S1) , (S2), ..., (Sm) shown in FIG. 5 each having known blood glucose concentration and the known blood glucose concentrations corresponding to the samples.
- the blood glucose concentration predictor 21 compares the spectrum subtraction given from the spectrum subtraction memory 20 as input data with each of the absorption spectrums of the sample solutions and outputs the blood glucose concentration of the sample solution having the most similar absorption spectrum as a predicted blood glucose concentration.
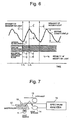
- FIG. 6 is a schematic diagram showing the relation of the intensity of incident light I ⁇ o , the intensities of transmitted lights I ⁇ 1 , I ⁇ 2 and absorption amount in the living body 13 at the wavelength ⁇ .
- the arterial blood volume waveform P as shown in FIG. 3 is also shown in FIG. 6.
- FIG. 6 is a schematic diagram showing the relation of the intensity of incident light I ⁇ o , the intensities of transmitted lights I ⁇ 1 , I ⁇ 2 and absorption amount in the living body 13 at the wavelength ⁇ .
- the arterial blood volume waveform P as shown in FIG. 3 is also shown in FIG. 6.
- the absorption light spectrum in the spectrum analyzer 15 or the spectrum data memory 17 shown in FIG. 1 contains the absorption light element in the venous blood and biological tissues excluding blood
- the spectrum subtraction ( ⁇ OD ⁇ ) generated in the spectrum subtraction processor 18 becomes the light absorption spectrum depending on the light absorption element of arterial blood absorption element only.
- the measured result easy to look by inputting the result into the blood glucose concentration predictor 21 by executing the time series average of these spectrum subtractions or by smoothing successively computed blood glucose concentrations through the statistical procedure such as the time average or moving average by the blood glucose concentration predictor 21.
- the transmitted light spectrum from the living body 13 is measured but the reflected light from the living body 13 may be measured other than the transmitted light.
- FIG. 7 is a partial explanatory diagram showing this embodiment, in which the same composed elements as those in FIG. 1 are assigned with the same reference numerals and the detailed explanation thereof will be omitted.
- the light detector 14 is arranged at the same side as the light source 11 to the living body 13 as illustrated and detects the reflected light from the living body 13.
- the spectrum analyzer 15 By supplying the output signal of the light detector 14 to the spectrum analyzer 15 shown in FIG. 1, it is possible to measure blood glucose concentration likewise the embodiment described above.
- the light from the light source 11 is separated by the active spectroscope 12 and then irradiated to the living body 13.
- the transmitted light or reflected light may be separated for spectrum analysis after the light from the light source 11 is irradiated to the living body 13.
- the light can be separated by an array of plural light detectors each having a sensitivity only for specific wavelengths ( ⁇ ).
- a model applied with the PLS method is used as the blood glucose concentration predictor 21.
- a model according to the principal constituents regression shown in Formula 3, which is one of multi-regression analyses may be used.
- the regression analysis blood glucose concentration computing model that is constructed using the PCR method is expressed by the following Formula 3. where,
- a multi-regression analysis blood glucose concentration computing model is constructed by corresponding a known blood glucose concentration of the whole blood sample 31 to an objective variable y, applying spectrum data of the whole blood sample 31 to an explanatory variable x and deciding a multi-regression analysis blood glucose concentration computing model.
- spectrum subtraction data of an unknown blood glucose concentration is input into the blood glucose concentration predictor 21 in which this principal constituents score regression coefficient b is set, a blood glucose concentration predict value ya is computed and output.
- the sample 31 having a known blood glucose concentration is filled in plural quartz cells and absorption spectrum data X1, X2, ... Xm are developed with a spectroscopic analyzer comprising the light source 11, the spectroscope 12, the light receiver 14 and the spectrum analyzer 15.
- absorption spectrum data X1, X2, ..., Xm spectrum subtraction data obtained with units ranging from the light source 11 to the spectrum subtraction memory shown in FIG. 1 using plural living bodies of which blood glucose concentrations are known can be used.
- the measurement of blood glucose concentration is shown.
- concentration of another material having absorption characteristics and scatter reflection characteristics existing in the arterial blood it is possible to predict and compute the concentration of that material existing in the arterial blood similarly. That is, it is possible to predict and compute the concentration by measuring spectrum of wavelength band corresponding to the absorption characteristics or the reflecting characteristics of the material and deciding the regression coefficient of the multi-regression analyzing model using the PLS method or the PCR method referring to a concentration of a sample of that is the standard of that material using the same system and procedures shown in the above embodiment.
- the non-invasive blood constituent measuring instrument and the method according to the embodiment of the present invention it is possible to measure blood constituents in a living body by irradiating near infrared light to a finger tip, etc. quickly and highly precisely without feeling pain and burden involved in the blood drawing.
- spectrum subtraction using the arterial blood beat is used as described above.
- the spectrum subtraction analysis may be made by generating the venous blood volume change in the biological tissues using such a method as the venous occlus ion method, for example.
- the adverse effect of other biological tissue constituents is eliminated and blood constituent can be measured at a highly precise and sensitive level.
Landscapes
- Health & Medical Sciences (AREA)
- Life Sciences & Earth Sciences (AREA)
- Physics & Mathematics (AREA)
- Engineering & Computer Science (AREA)
- Biomedical Technology (AREA)
- General Health & Medical Sciences (AREA)
- Pathology (AREA)
- Biophysics (AREA)
- Molecular Biology (AREA)
- Heart & Thoracic Surgery (AREA)
- Veterinary Medicine (AREA)
- Public Health (AREA)
- Animal Behavior & Ethology (AREA)
- Surgery (AREA)
- Medical Informatics (AREA)
- Chemical & Material Sciences (AREA)
- Optics & Photonics (AREA)
- Spectroscopy & Molecular Physics (AREA)
- Hematology (AREA)
- Immunology (AREA)
- General Physics & Mathematics (AREA)
- Biochemistry (AREA)
- Analytical Chemistry (AREA)
- Ecology (AREA)
- Urology & Nephrology (AREA)
- Medicinal Chemistry (AREA)
- Food Science & Technology (AREA)
- Emergency Medicine (AREA)
- Measurement Of The Respiration, Hearing Ability, Form, And Blood Characteristics Of Living Organisms (AREA)
Applications Claiming Priority (3)
| Application Number | Priority Date | Filing Date | Title |
|---|---|---|---|
| JP2002083587 | 2002-03-25 | ||
| JP2002083587 | 2002-03-25 | ||
| PCT/JP2003/003587 WO2003079900A1 (en) | 2002-03-25 | 2003-03-25 | Noninvasive blood component value measuring instrument and method |
Publications (2)
| Publication Number | Publication Date |
|---|---|
| EP1498070A1 true EP1498070A1 (de) | 2005-01-19 |
| EP1498070A4 EP1498070A4 (de) | 2007-05-02 |
Family
ID=28449186
Family Applications (1)
| Application Number | Title | Priority Date | Filing Date |
|---|---|---|---|
| EP03712898A Withdrawn EP1498070A4 (de) | 2002-03-25 | 2003-03-25 | Nichtinvasives blutbestandteile- messinstrument und verfahren |
Country Status (8)
| Country | Link |
|---|---|
| US (2) | US20060063983A1 (de) |
| EP (1) | EP1498070A4 (de) |
| JP (1) | JPWO2003079900A1 (de) |
| KR (1) | KR100762659B1 (de) |
| CN (1) | CN1327812C (de) |
| AU (1) | AU2003221086A1 (de) |
| CA (1) | CA2481981C (de) |
| WO (1) | WO2003079900A1 (de) |
Families Citing this family (41)
| Publication number | Priority date | Publication date | Assignee | Title |
|---|---|---|---|---|
| JP4563075B2 (ja) * | 2004-05-14 | 2010-10-13 | 日本分光株式会社 | 血糖値測定装置 |
| US20070224126A1 (en) * | 2004-06-01 | 2007-09-27 | Therese Dufresne | Index and Method of use of Adapted Food Compositions for Dysphagic Persons |
| DE602005022388D1 (de) * | 2004-08-25 | 2010-09-02 | Panasonic Elec Works Co Ltd | Quantitatives Analysegerät, das eine Kalibrierungskurve benutzt |
| JP4586680B2 (ja) * | 2004-08-25 | 2010-11-24 | パナソニック電工株式会社 | 体内成分の定量分析用検量線の作成方法、および同検量線を用いた定量分析装置 |
| KR100694598B1 (ko) * | 2005-10-28 | 2007-03-13 | 삼성전자주식회사 | 혈당 측정에서 헤모글로빈의 영향을 보상하는 비침습적생체 측정 시스템 및 방법 |
| WO2008017981A2 (en) * | 2006-08-08 | 2008-02-14 | Koninklijke Philips Electronics N.V. | Method and device for monitoring a physiological parameter |
| JP4872536B2 (ja) * | 2006-08-28 | 2012-02-08 | パナソニック電工株式会社 | 生体成分濃度測定方法 |
| WO2008116835A1 (de) * | 2007-03-23 | 2008-10-02 | Enverdis Gmbh | Verfahren zur kontinuierlichen nichtinvasiven bestimmung der konzentration von blutbestandteilen |
| US7961304B2 (en) * | 2007-09-13 | 2011-06-14 | The Curators Of The University Of Missouri | Optical device components |
| AU2008307505B2 (en) * | 2007-10-04 | 2013-01-31 | St. Louis Medical Devices, Inc. | Optical device components |
| US7961305B2 (en) | 2007-10-23 | 2011-06-14 | The Curators Of The University Of Missouri | Optical device components |
| US10542919B2 (en) * | 2008-03-25 | 2020-01-28 | St. Louis Medical Devices, Inc. | Method and system for non-invasive blood glucose detection utilizing spectral data of one or more components other than glucose |
| RU2566920C2 (ru) | 2008-05-22 | 2015-10-27 | Дзе Кьюрейторз Оф Дзе Юниверсити Оф Миссури | Способ и система для неинвазивного оптического определения глюкозы крови, используя спектральный анализ данных |
| WO2010114736A1 (en) | 2009-04-01 | 2010-10-07 | The Curators Of The University Of Missouri | Optical spectroscopy device for non-invasive blood glucose detection and associated method of use |
| CN102018517A (zh) * | 2009-09-17 | 2011-04-20 | 林紫谊 | 非侵入式血糖仪 |
| DE112010004184B4 (de) * | 2009-10-29 | 2017-10-12 | Hoya Corp. | Hilfsdiagnoseeinrichtung und Hilfsdiagnoseverfahren |
| KR101656746B1 (ko) * | 2010-10-26 | 2016-09-12 | 엘지전자 주식회사 | 혈당농도 보정 장치 및 방법 |
| CN106796144A (zh) * | 2014-08-20 | 2017-05-31 | 国家健康与医学研究院 | 用于确定吸收谱带的方法 |
| CN104257390B (zh) * | 2014-09-04 | 2016-04-20 | 深圳市前海安测信息技术有限公司 | 无创血糖测定方法及系统 |
| WO2016054079A1 (en) | 2014-09-29 | 2016-04-07 | Zyomed Corp. | Systems and methods for blood glucose and other analyte detection and measurement using collision computing |
| KR102395773B1 (ko) * | 2014-11-07 | 2022-05-09 | 삼성전자주식회사 | 생체 시료의 분석 시스템 및 이를 이용한 분석 방법 |
| ES2928760T3 (es) * | 2015-03-13 | 2022-11-22 | Univ Shinshu | Dispositivo de medición no invasiva del nivel de glucosa en sangre |
| CN107924715A (zh) * | 2016-01-25 | 2018-04-17 | 普雷迪科特医疗有限公司 | 使用多个非侵入式传感器估计物质浓度 |
| US10393652B2 (en) * | 2016-01-26 | 2019-08-27 | Tubitak | Portable optical apparatus for diffuse reflectance spectroscopy |
| US9554738B1 (en) | 2016-03-30 | 2017-01-31 | Zyomed Corp. | Spectroscopic tomography systems and methods for noninvasive detection and measurement of analytes using collision computing |
| KR102610590B1 (ko) | 2016-07-25 | 2023-12-07 | 삼성전자주식회사 | 생체 내 물질 추정 장치 및 방법, 단위 스펙트럼 획득 장치 및 웨어러블 기기 |
| EP3613345A4 (de) * | 2017-04-18 | 2021-01-06 | Kowa Company Ltd. | Informationsverarbeitungsverfahren zur berechnung des absorptionsspektrums von blut, informationsverarbeitungsvorrichtung und programm |
| CN107334477A (zh) * | 2017-05-02 | 2017-11-10 | 北京理工大学深圳研究院 | 一种双光谱无创血糖检测装置 |
| KR102522202B1 (ko) | 2017-05-05 | 2023-04-14 | 삼성전자주식회사 | Nir 분광학 데이터를 이용하여 혈당 레벨을 예측하는 장치 및 방법 |
| JP6813848B2 (ja) * | 2017-06-26 | 2021-01-13 | 日本電信電話株式会社 | 成分濃度測定装置及び方法 |
| CN107374646B (zh) * | 2017-07-31 | 2020-10-30 | 中国科学院半导体研究所 | 基于近红外技术的血糖检测装置及方法、电子装置 |
| CN107941741B (zh) * | 2017-10-23 | 2025-01-03 | 苏州市中心血站 | 利用近红外光谱检测血浆灭活袋中亚甲蓝释放量的方法 |
| CN108152244A (zh) * | 2017-12-15 | 2018-06-12 | 京东方科技集团股份有限公司 | 一种血糖检测装置和血糖检测方法 |
| WO2020017028A1 (ja) * | 2018-07-20 | 2020-01-23 | 桐生電子開発合同会社 | 非破壊検査装置 |
| US11089981B2 (en) | 2018-07-23 | 2021-08-17 | Samsung Electronics Co., Ltd. | Methods and systems for performing universal calibration to non-invasively determine blood glucose concentration |
| KR102638310B1 (ko) | 2018-10-04 | 2024-02-19 | 삼성전자주식회사 | 분석 물질의 농도 추정 장치 및 방법 |
| CN110327058A (zh) | 2019-07-31 | 2019-10-15 | 清华大学 | 一种无创血糖仪及血糖检测方法 |
| CN111603151B (zh) * | 2020-06-17 | 2023-05-16 | 深圳智领人工智能健康科技有限公司 | 一种基于时频联合分析的无创血液成分检测方法及系统 |
| JP6873307B2 (ja) * | 2020-12-22 | 2021-05-19 | 京セラ株式会社 | 電子機器、推定システム、推定方法及び推定プログラム |
| WO2023224176A1 (en) * | 2022-05-19 | 2023-11-23 | Samsung Electronics Co., Ltd. | Device and method for measuring blood constituents |
| CN119632553A (zh) * | 2024-11-05 | 2025-03-18 | 深圳优美创新科技有限公司 | 光谱数据分析方法、设备、系统、存储介质及程序产品 |
Family Cites Families (17)
| Publication number | Priority date | Publication date | Assignee | Title |
|---|---|---|---|---|
| US5068536A (en) * | 1989-01-19 | 1991-11-26 | Futrex, Inc. | Method for providing custom calibration for near infrared instruments for measurement of blood glucose |
| US4975581A (en) * | 1989-06-21 | 1990-12-04 | University Of New Mexico | Method of and apparatus for determining the similarity of a biological analyte from a model constructed from known biological fluids |
| US5571723A (en) * | 1991-02-07 | 1996-11-05 | Evans; Cody A. | Method of testing for diabetes that reduces the effect of interfering substances |
| AU2245092A (en) * | 1991-12-31 | 1993-07-28 | Vivascan Corporation | Blood constituent determination based on differential spectral analysis |
| US5355880A (en) * | 1992-07-06 | 1994-10-18 | Sandia Corporation | Reliable noninvasive measurement of blood gases |
| US5348003A (en) * | 1992-09-03 | 1994-09-20 | Sirraya, Inc. | Method and apparatus for chemical analysis |
| US6172743B1 (en) * | 1992-10-07 | 2001-01-09 | Chemtrix, Inc. | Technique for measuring a blood analyte by non-invasive spectrometry in living tissue |
| JP3114441B2 (ja) | 1993-07-23 | 2000-12-04 | 富士電機株式会社 | 電子写真用感光体 |
| JP3345481B2 (ja) * | 1993-09-22 | 2002-11-18 | 興和株式会社 | 脈波分光計 |
| US5747806A (en) | 1996-02-02 | 1998-05-05 | Instrumentation Metrics, Inc | Method and apparatus for multi-spectral analysis in noninvasive nir spectroscopy |
| WO2000001295A1 (en) | 1998-07-07 | 2000-01-13 | Lightouch Medical, Inc. | Tissue modulation process for quantitative noninvasive in vivo spectroscopic analysis of tissues |
| CA2337097C (en) * | 1998-07-13 | 2008-12-23 | James L. Lambert | Non-invasive glucose monitor |
| JP2000023947A (ja) * | 1998-07-14 | 2000-01-25 | Hitachi Ltd | 生体光計測方法 |
| JP2000060826A (ja) * | 1998-08-19 | 2000-02-29 | Omron Corp | 非侵襲生体成分測定装置 |
| US6280381B1 (en) | 1999-07-22 | 2001-08-28 | Instrumentation Metrics, Inc. | Intelligent system for noninvasive blood analyte prediction |
| DE10027100C2 (de) * | 2000-05-31 | 2002-08-08 | Klaus Mueller-Dethlefs | Verfahren und Vorrichtung zum Nachweisen von Substanzen in Körperflüssigkeiten |
| JP3952044B2 (ja) | 2004-06-21 | 2007-08-01 | 松下電工株式会社 | 静電霧化装置 |
-
2003
- 2003-03-25 CN CNB038069598A patent/CN1327812C/zh not_active Expired - Fee Related
- 2003-03-25 KR KR1020047015167A patent/KR100762659B1/ko not_active Expired - Fee Related
- 2003-03-25 WO PCT/JP2003/003587 patent/WO2003079900A1/ja not_active Ceased
- 2003-03-25 AU AU2003221086A patent/AU2003221086A1/en not_active Abandoned
- 2003-03-25 EP EP03712898A patent/EP1498070A4/de not_active Withdrawn
- 2003-03-25 JP JP2003577737A patent/JPWO2003079900A1/ja active Pending
- 2003-03-25 CA CA2481981A patent/CA2481981C/en not_active Expired - Fee Related
- 2003-03-25 US US10/508,833 patent/US20060063983A1/en not_active Abandoned
-
2007
- 2007-06-26 US US11/819,324 patent/US8275433B2/en not_active Expired - Fee Related
Also Published As
| Publication number | Publication date |
|---|---|
| CN1327812C (zh) | 2007-07-25 |
| KR100762659B1 (ko) | 2007-10-01 |
| CN1642478A (zh) | 2005-07-20 |
| CA2481981A1 (en) | 2003-10-02 |
| EP1498070A4 (de) | 2007-05-02 |
| JPWO2003079900A1 (ja) | 2005-07-21 |
| AU2003221086A1 (en) | 2003-10-08 |
| US8275433B2 (en) | 2012-09-25 |
| US20060063983A1 (en) | 2006-03-23 |
| CA2481981C (en) | 2012-02-07 |
| WO2003079900A1 (en) | 2003-10-02 |
| US20080027297A1 (en) | 2008-01-31 |
| KR20050002892A (ko) | 2005-01-10 |
Similar Documents
| Publication | Publication Date | Title |
|---|---|---|
| EP1498070A1 (de) | Nichtinvasives blutbestandteile- messinstrument und verfahren | |
| US7343185B2 (en) | Measurement of body compounds | |
| Heise et al. | Noninvasive blood glucose sensors based on near‐infrared spectroscopy | |
| US5222495A (en) | Non-invasive blood analysis by near infrared absorption measurements using two closely spaced wavelengths | |
| US5222496A (en) | Infrared glucose sensor | |
| US5974337A (en) | Method and apparatus for rapid non-invasive determination of blood composition parameters | |
| CA2382113A1 (en) | Method of calibrating a spectroscopic device | |
| JPH06178767A (ja) | 高信頼非侵入式血液ガス測定方法 | |
| US20060234386A1 (en) | Method and system for measuring lactate levels in vivo | |
| US6919566B1 (en) | Method of calibrating a spectroscopic device | |
| KR100464324B1 (ko) | 목적물의 성분농도 측정방법 및 장치 | |
| US8406839B2 (en) | Method and apparatus for determining blood analytes | |
| US5246004A (en) | Infrared cholesterol sensor | |
| AU4366800A (en) | Method for improving calibration of a blood monitoring instrument | |
| WO2019208561A1 (ja) | 血液成分の血中濃度測定方法、血中濃度測定装置およびプログラム | |
| JP2007502681A (ja) | レシオメトリック絶対パルス分光法を用いて血中成分を決定するための方法と装置 | |
| JP5536337B2 (ja) | 体液中の物質濃度を推定するためのシステムおよび方法 | |
| Céelleri et al. | Non-invasive blood sugar measurement system | |
| WO2023145810A1 (ja) | 体液に含まれる成分の濃度を測定するシステムおよび方法 |
Legal Events
| Date | Code | Title | Description |
|---|---|---|---|
| PUAI | Public reference made under article 153(3) epc to a published international application that has entered the european phase |
Free format text: ORIGINAL CODE: 0009012 |
|
| 17P | Request for examination filed |
Effective date: 20040924 |
|
| AK | Designated contracting states |
Kind code of ref document: A1 Designated state(s): AT BE BG CH CY CZ DE DK EE ES FI FR GB GR HU IE IT LI LU MC NL PT RO SE SI SK TR |
|
| AX | Request for extension of the european patent |
Extension state: AL LT LV MK |
|
| RAP1 | Party data changed (applicant data changed or rights of an application transferred) |
Owner name: TYT INSTITUTE OF TECHNOLOGY CORPORATION Owner name: YAMAKOSHI, KEN-ICHI |
|
| RAP1 | Party data changed (applicant data changed or rights of an application transferred) |
Owner name: TYT INSTITUTE OF TECHNOLOGY CORPORATION |
|
| A4 | Supplementary search report drawn up and despatched |
Effective date: 20070330 |
|
| 17Q | First examination report despatched |
Effective date: 20070627 |
|
| RAP1 | Party data changed (applicant data changed or rights of an application transferred) |
Owner name: TYT INSTITUTE OF TECHNOLOGY CORPORATION |
|
| RAP1 | Party data changed (applicant data changed or rights of an application transferred) |
Owner name: YU.SYS.CORPORATION |
|
| GRAP | Despatch of communication of intention to grant a patent |
Free format text: ORIGINAL CODE: EPIDOSNIGR1 |
|
| INTG | Intention to grant announced |
Effective date: 20140120 |
|
| STAA | Information on the status of an ep patent application or granted ep patent |
Free format text: STATUS: THE APPLICATION IS DEEMED TO BE WITHDRAWN |
|
| 18D | Application deemed to be withdrawn |
Effective date: 20140531 |