EP1522860A1 - Verfahren und Vorrichtung zum Vorhersagen von haemostatischer Funktionsstörung in Patientenproben - Google Patents
Verfahren und Vorrichtung zum Vorhersagen von haemostatischer Funktionsstörung in Patientenproben Download PDFInfo
- Publication number
- EP1522860A1 EP1522860A1 EP04025887A EP04025887A EP1522860A1 EP 1522860 A1 EP1522860 A1 EP 1522860A1 EP 04025887 A EP04025887 A EP 04025887A EP 04025887 A EP04025887 A EP 04025887A EP 1522860 A1 EP1522860 A1 EP 1522860A1
- Authority
- EP
- European Patent Office
- Prior art keywords
- time
- aptt
- profile
- dependent measurement
- optical
- Prior art date
- Legal status (The legal status is an assumption and is not a legal conclusion. Google has not performed a legal analysis and makes no representation as to the accuracy of the status listed.)
- Withdrawn
Links
- 238000000034 method Methods 0.000 title claims abstract description 53
- 229940030225 antihemorrhagics Drugs 0.000 title claims abstract description 40
- 230000000025 haemostatic effect Effects 0.000 title claims abstract description 40
- 230000004064 dysfunction Effects 0.000 title claims abstract description 39
- 239000013610 patient sample Substances 0.000 title claims description 5
- 238000005259 measurement Methods 0.000 claims abstract description 46
- 230000036962 time dependent Effects 0.000 claims abstract description 38
- 230000035602 clotting Effects 0.000 claims abstract description 28
- 230000002051 biphasic effect Effects 0.000 claims abstract description 17
- 208000009190 disseminated intravascular coagulation Diseases 0.000 claims description 77
- 238000003556 assay Methods 0.000 claims description 69
- 230000003287 optical effect Effects 0.000 claims description 61
- 239000000523 sample Substances 0.000 claims description 49
- 238000012360 testing method Methods 0.000 claims description 49
- 230000002159 abnormal effect Effects 0.000 claims description 18
- 239000003153 chemical reaction reagent Substances 0.000 claims description 14
- 230000005540 biological transmission Effects 0.000 claims description 13
- 230000000977 initiatory effect Effects 0.000 claims description 11
- 208000007536 Thrombosis Diseases 0.000 claims description 9
- 230000036961 partial effect Effects 0.000 claims description 7
- PGOHTUIFYSHAQG-LJSDBVFPSA-N (2S)-6-amino-2-[[(2S)-5-amino-2-[[(2S)-2-[[(2S)-2-[[(2S)-2-[[(2S)-4-amino-2-[[(2S)-2-[[(2S)-2-[[(2S)-2-[[(2S)-2-[[(2S)-5-amino-2-[[(2S)-5-amino-2-[[(2S)-2-[[(2S)-2-[[(2S)-2-[[(2S,3R)-2-[[(2S)-5-amino-2-[[(2S)-2-[[(2S)-2-[[(2S,3R)-2-[[(2S)-2-[[(2S)-2-[[(2S)-2-[[(2S)-2-[[(2S)-5-amino-2-[[(2S)-1-[(2S,3R)-2-[[(2S)-2-[[(2S)-2-[[(2R)-2-[[(2S)-2-[[(2S)-2-[[2-[[(2S)-2-[[(2S)-2-[[(2S)-2-[[(2S)-1-[(2S)-2-[[(2S)-2-[[(2S)-2-[[(2S)-2-amino-4-methylsulfanylbutanoyl]amino]-3-(1H-indol-3-yl)propanoyl]amino]-5-carbamimidamidopentanoyl]amino]propanoyl]pyrrolidine-2-carbonyl]amino]-3-methylbutanoyl]amino]-4-methylpentanoyl]amino]-4-methylpentanoyl]amino]acetyl]amino]-3-hydroxypropanoyl]amino]-4-methylpentanoyl]amino]-3-sulfanylpropanoyl]amino]-4-methylsulfanylbutanoyl]amino]-5-carbamimidamidopentanoyl]amino]-3-hydroxybutanoyl]pyrrolidine-2-carbonyl]amino]-5-oxopentanoyl]amino]-3-hydroxypropanoyl]amino]-3-hydroxypropanoyl]amino]-3-(1H-imidazol-5-yl)propanoyl]amino]-4-methylpentanoyl]amino]-3-hydroxybutanoyl]amino]-3-(1H-indol-3-yl)propanoyl]amino]-5-carbamimidamidopentanoyl]amino]-5-oxopentanoyl]amino]-3-hydroxybutanoyl]amino]-3-hydroxypropanoyl]amino]-3-carboxypropanoyl]amino]-3-hydroxypropanoyl]amino]-5-oxopentanoyl]amino]-5-oxopentanoyl]amino]-3-phenylpropanoyl]amino]-5-carbamimidamidopentanoyl]amino]-3-methylbutanoyl]amino]-4-methylpentanoyl]amino]-4-oxobutanoyl]amino]-5-carbamimidamidopentanoyl]amino]-3-(1H-indol-3-yl)propanoyl]amino]-4-carboxybutanoyl]amino]-5-oxopentanoyl]amino]hexanoic acid Chemical compound CSCC[C@H](N)C(=O)N[C@@H](Cc1c[nH]c2ccccc12)C(=O)N[C@@H](CCCNC(N)=N)C(=O)N[C@@H](C)C(=O)N1CCC[C@H]1C(=O)N[C@@H](C(C)C)C(=O)N[C@@H](CC(C)C)C(=O)N[C@@H](CC(C)C)C(=O)NCC(=O)N[C@@H](CO)C(=O)N[C@@H](CC(C)C)C(=O)N[C@@H](CS)C(=O)N[C@@H](CCSC)C(=O)N[C@@H](CCCNC(N)=N)C(=O)N[C@@H]([C@@H](C)O)C(=O)N1CCC[C@H]1C(=O)N[C@@H](CCC(N)=O)C(=O)N[C@@H](CO)C(=O)N[C@@H](CO)C(=O)N[C@@H](Cc1cnc[nH]1)C(=O)N[C@@H](CC(C)C)C(=O)N[C@@H]([C@@H](C)O)C(=O)N[C@@H](Cc1c[nH]c2ccccc12)C(=O)N[C@@H](CCCNC(N)=N)C(=O)N[C@@H](CCC(N)=O)C(=O)N[C@@H]([C@@H](C)O)C(=O)N[C@@H](CO)C(=O)N[C@@H](CC(O)=O)C(=O)N[C@@H](CO)C(=O)N[C@@H](CCC(N)=O)C(=O)N[C@@H](CCC(N)=O)C(=O)N[C@@H](Cc1ccccc1)C(=O)N[C@@H](CCCNC(N)=N)C(=O)N[C@@H](C(C)C)C(=O)N[C@@H](CC(C)C)C(=O)N[C@@H](CC(N)=O)C(=O)N[C@@H](CCCNC(N)=N)C(=O)N[C@@H](Cc1c[nH]c2ccccc12)C(=O)N[C@@H](CCC(O)=O)C(=O)N[C@@H](CCC(N)=O)C(=O)N[C@@H](CCCCN)C(O)=O PGOHTUIFYSHAQG-LJSDBVFPSA-N 0.000 claims description 6
- 108010000499 Thromboplastin Proteins 0.000 claims description 6
- 102000002262 Thromboplastin Human genes 0.000 claims description 6
- 208000014674 injury Diseases 0.000 claims description 6
- 108010094028 Prothrombin Proteins 0.000 claims description 4
- 102100027378 Prothrombin Human genes 0.000 claims description 4
- 208000019423 liver disease Diseases 0.000 claims description 4
- 229940039716 prothrombin Drugs 0.000 claims description 4
- 230000008733 trauma Effects 0.000 claims description 4
- 238000011161 development Methods 0.000 claims description 3
- 208000015181 infectious disease Diseases 0.000 claims description 3
- 238000001356 surgical procedure Methods 0.000 claims description 3
- 206010061818 Disease progression Diseases 0.000 claims description 2
- 206010028980 Neoplasm Diseases 0.000 claims description 2
- 201000011510 cancer Diseases 0.000 claims description 2
- 230000001419 dependent effect Effects 0.000 claims description 2
- 230000005750 disease progression Effects 0.000 claims description 2
- 230000036210 malignancy Effects 0.000 claims description 2
- 208000010444 Acidosis Diseases 0.000 claims 1
- 206010021143 Hypoxia Diseases 0.000 claims 1
- WHXSMMKQMYFTQS-UHFFFAOYSA-N Lithium Chemical compound [Li] WHXSMMKQMYFTQS-UHFFFAOYSA-N 0.000 claims 1
- 206010052779 Transplant rejections Diseases 0.000 claims 1
- 230000007950 acidosis Effects 0.000 claims 1
- 208000026545 acidosis disease Diseases 0.000 claims 1
- 230000035606 childbirth Effects 0.000 claims 1
- 230000007954 hypoxia Effects 0.000 claims 1
- 229910052744 lithium Inorganic materials 0.000 claims 1
- 230000035935 pregnancy Effects 0.000 claims 1
- 238000013528 artificial neural network Methods 0.000 description 51
- 238000012549 training Methods 0.000 description 50
- 238000002834 transmittance Methods 0.000 description 40
- 238000005345 coagulation Methods 0.000 description 38
- 108010049003 Fibrinogen Proteins 0.000 description 37
- 102000008946 Fibrinogen Human genes 0.000 description 37
- 229940012952 fibrinogen Drugs 0.000 description 37
- 229920000669 heparin Polymers 0.000 description 35
- HTTJABKRGRZYRN-UHFFFAOYSA-N Heparin Chemical compound OC1C(NC(=O)C)C(O)OC(COS(O)(=O)=O)C1OC1C(OS(O)(=O)=O)C(O)C(OC2C(C(OS(O)(=O)=O)C(OC3C(C(O)C(O)C(O3)C(O)=O)OS(O)(=O)=O)C(CO)O2)NS(O)(=O)=O)C(C(O)=O)O1 HTTJABKRGRZYRN-UHFFFAOYSA-N 0.000 description 34
- 230000015271 coagulation Effects 0.000 description 34
- 230000007812 deficiency Effects 0.000 description 34
- 229960002897 heparin Drugs 0.000 description 34
- 230000035945 sensitivity Effects 0.000 description 32
- 230000002950 deficient Effects 0.000 description 28
- 238000002790 cross-validation Methods 0.000 description 26
- 239000013598 vector Substances 0.000 description 21
- 230000000694 effects Effects 0.000 description 18
- 238000004422 calculation algorithm Methods 0.000 description 16
- 230000005856 abnormality Effects 0.000 description 15
- 210000002569 neuron Anatomy 0.000 description 15
- 210000002381 plasma Anatomy 0.000 description 15
- 239000003146 anticoagulant agent Substances 0.000 description 13
- 238000003745 diagnosis Methods 0.000 description 12
- 230000001225 therapeutic effect Effects 0.000 description 12
- 238000002560 therapeutic procedure Methods 0.000 description 12
- 238000002474 experimental method Methods 0.000 description 11
- 102100026735 Coagulation factor VIII Human genes 0.000 description 10
- 101000911390 Homo sapiens Coagulation factor VIII Proteins 0.000 description 10
- 238000004458 analytical method Methods 0.000 description 10
- 229940127219 anticoagulant drug Drugs 0.000 description 9
- 238000006243 chemical reaction Methods 0.000 description 9
- 238000009826 distribution Methods 0.000 description 9
- 206010053567 Coagulopathies Diseases 0.000 description 8
- 239000003154 D dimer Substances 0.000 description 8
- 230000003247 decreasing effect Effects 0.000 description 8
- 108010052295 fibrin fragment D Proteins 0.000 description 8
- 230000006870 function Effects 0.000 description 8
- 238000007423 screening assay Methods 0.000 description 8
- 206010010356 Congenital anomaly Diseases 0.000 description 7
- 210000004369 blood Anatomy 0.000 description 7
- 239000008280 blood Substances 0.000 description 7
- 230000008859 change Effects 0.000 description 7
- 238000013139 quantization Methods 0.000 description 7
- 101800004937 Protein C Proteins 0.000 description 6
- 102000017975 Protein C Human genes 0.000 description 6
- 101800001700 Saposin-D Proteins 0.000 description 6
- 230000004913 activation Effects 0.000 description 6
- 238000001994 activation Methods 0.000 description 6
- 238000013459 approach Methods 0.000 description 6
- 210000004205 output neuron Anatomy 0.000 description 6
- 230000008569 process Effects 0.000 description 6
- 229960000856 protein c Drugs 0.000 description 6
- 102000004411 Antithrombin III Human genes 0.000 description 5
- 108090000935 Antithrombin III Proteins 0.000 description 5
- 108010054218 Factor VIII Proteins 0.000 description 5
- 102000001690 Factor VIII Human genes 0.000 description 5
- 108010073385 Fibrin Proteins 0.000 description 5
- 102000009123 Fibrin Human genes 0.000 description 5
- BWGVNKXGVNDBDI-UHFFFAOYSA-N Fibrin monomer Chemical compound CNC(=O)CNC(=O)CN BWGVNKXGVNDBDI-UHFFFAOYSA-N 0.000 description 5
- 206010040047 Sepsis Diseases 0.000 description 5
- 229960005348 antithrombin iii Drugs 0.000 description 5
- 229960000301 factor viii Drugs 0.000 description 5
- 229950003499 fibrin Drugs 0.000 description 5
- 230000023597 hemostasis Effects 0.000 description 5
- 239000000047 product Substances 0.000 description 5
- 230000002035 prolonged effect Effects 0.000 description 5
- 102000004169 proteins and genes Human genes 0.000 description 5
- 108090000623 proteins and genes Proteins 0.000 description 5
- 230000002829 reductive effect Effects 0.000 description 5
- 230000000946 synaptic effect Effects 0.000 description 5
- 108010051456 Plasminogen Proteins 0.000 description 4
- 102000013566 Plasminogen Human genes 0.000 description 4
- 229940096437 Protein S Drugs 0.000 description 4
- 102000029301 Protein S Human genes 0.000 description 4
- 108010066124 Protein S Proteins 0.000 description 4
- VYPSYNLAJGMNEJ-UHFFFAOYSA-N Silicium dioxide Chemical compound O=[Si]=O VYPSYNLAJGMNEJ-UHFFFAOYSA-N 0.000 description 4
- 108090000190 Thrombin Proteins 0.000 description 4
- 239000000539 dimer Substances 0.000 description 4
- 208000037265 diseases, disorders, signs and symptoms Diseases 0.000 description 4
- 238000012417 linear regression Methods 0.000 description 4
- 238000007726 management method Methods 0.000 description 4
- 238000012216 screening Methods 0.000 description 4
- 229960004072 thrombin Drugs 0.000 description 4
- 206010067787 Coagulation factor deficiency Diseases 0.000 description 3
- 108010014173 Factor X Proteins 0.000 description 3
- 238000007792 addition Methods 0.000 description 3
- 238000001514 detection method Methods 0.000 description 3
- 208000035475 disorder Diseases 0.000 description 3
- 238000005516 engineering process Methods 0.000 description 3
- RAXXELZNTBOGNW-UHFFFAOYSA-N imidazole Natural products C1=CNC=N1 RAXXELZNTBOGNW-UHFFFAOYSA-N 0.000 description 3
- 230000006872 improvement Effects 0.000 description 3
- 230000010355 oscillation Effects 0.000 description 3
- 230000004044 response Effects 0.000 description 3
- 210000000225 synapse Anatomy 0.000 description 3
- 206010003658 Atrial Fibrillation Diseases 0.000 description 2
- 102000015081 Blood Coagulation Factors Human genes 0.000 description 2
- 108010039209 Blood Coagulation Factors Proteins 0.000 description 2
- UXVMQQNJUSDDNG-UHFFFAOYSA-L Calcium chloride Chemical compound [Cl-].[Cl-].[Ca+2] UXVMQQNJUSDDNG-UHFFFAOYSA-L 0.000 description 2
- 108010090444 Innovin Proteins 0.000 description 2
- 206010051379 Systemic Inflammatory Response Syndrome Diseases 0.000 description 2
- 208000027418 Wounds and injury Diseases 0.000 description 2
- 230000001133 acceleration Effects 0.000 description 2
- 238000000149 argon plasma sintering Methods 0.000 description 2
- 230000008901 benefit Effects 0.000 description 2
- 239000003114 blood coagulation factor Substances 0.000 description 2
- 238000007820 coagulation assay Methods 0.000 description 2
- 238000012937 correction Methods 0.000 description 2
- 230000006378 damage Effects 0.000 description 2
- 230000007423 decrease Effects 0.000 description 2
- 238000002405 diagnostic procedure Methods 0.000 description 2
- 238000010586 diagram Methods 0.000 description 2
- 238000000338 in vitro Methods 0.000 description 2
- 239000003999 initiator Substances 0.000 description 2
- 239000003550 marker Substances 0.000 description 2
- 239000000463 material Substances 0.000 description 2
- 239000011159 matrix material Substances 0.000 description 2
- 238000012544 monitoring process Methods 0.000 description 2
- 230000008383 multiple organ dysfunction Effects 0.000 description 2
- 238000010606 normalization Methods 0.000 description 2
- 230000007170 pathology Effects 0.000 description 2
- 238000012545 processing Methods 0.000 description 2
- 238000011084 recovery Methods 0.000 description 2
- 239000000377 silicon dioxide Substances 0.000 description 2
- 239000001509 sodium citrate Substances 0.000 description 2
- 229940126585 therapeutic drug Drugs 0.000 description 2
- 230000000007 visual effect Effects 0.000 description 2
- 101100129500 Caenorhabditis elegans max-2 gene Proteins 0.000 description 1
- 208000027205 Congenital disease Diseases 0.000 description 1
- 208000029767 Congenital, Hereditary, and Neonatal Diseases and Abnormalities Diseases 0.000 description 1
- KCXVZYZYPLLWCC-UHFFFAOYSA-N EDTA Chemical compound OC(=O)CN(CC(O)=O)CCN(CC(O)=O)CC(O)=O KCXVZYZYPLLWCC-UHFFFAOYSA-N 0.000 description 1
- 238000002965 ELISA Methods 0.000 description 1
- 108090000790 Enzymes Proteins 0.000 description 1
- 102000004190 Enzymes Human genes 0.000 description 1
- 241000588724 Escherichia coli Species 0.000 description 1
- 208000037273 Pathologic Processes Diseases 0.000 description 1
- 239000004743 Polypropylene Substances 0.000 description 1
- 239000002253 acid Substances 0.000 description 1
- 208000037919 acquired disease Diseases 0.000 description 1
- 230000001154 acute effect Effects 0.000 description 1
- 238000011366 aggressive therapy Methods 0.000 description 1
- 230000004075 alteration Effects 0.000 description 1
- 230000003321 amplification Effects 0.000 description 1
- 239000003242 anti bacterial agent Substances 0.000 description 1
- 229940088710 antibiotic agent Drugs 0.000 description 1
- 239000004019 antithrombin Substances 0.000 description 1
- 238000013473 artificial intelligence Methods 0.000 description 1
- 239000010836 blood and blood product Substances 0.000 description 1
- 230000023555 blood coagulation Effects 0.000 description 1
- 208000015294 blood coagulation disease Diseases 0.000 description 1
- 229960000182 blood factors Drugs 0.000 description 1
- 229940125691 blood product Drugs 0.000 description 1
- 239000001110 calcium chloride Substances 0.000 description 1
- 229910001628 calcium chloride Inorganic materials 0.000 description 1
- 238000004364 calculation method Methods 0.000 description 1
- 230000015556 catabolic process Effects 0.000 description 1
- 239000007795 chemical reaction product Substances 0.000 description 1
- 230000002860 competitive effect Effects 0.000 description 1
- 238000012790 confirmation Methods 0.000 description 1
- 230000002596 correlated effect Effects 0.000 description 1
- 229940072645 coumadin Drugs 0.000 description 1
- 239000007857 degradation product Substances 0.000 description 1
- 238000013461 design Methods 0.000 description 1
- 201000010099 disease Diseases 0.000 description 1
- 229940079593 drug Drugs 0.000 description 1
- 239000003814 drug Substances 0.000 description 1
- 239000012636 effector Substances 0.000 description 1
- 229940088598 enzyme Drugs 0.000 description 1
- 230000001747 exhibiting effect Effects 0.000 description 1
- 210000003754 fetus Anatomy 0.000 description 1
- 238000007667 floating Methods 0.000 description 1
- 239000004023 fresh frozen plasma Substances 0.000 description 1
- 238000013168 hemostasis test Methods 0.000 description 1
- 238000001727 in vivo Methods 0.000 description 1
- 230000010365 information processing Effects 0.000 description 1
- 210000002364 input neuron Anatomy 0.000 description 1
- 206010022694 intestinal perforation Diseases 0.000 description 1
- 238000001990 intravenous administration Methods 0.000 description 1
- 238000012804 iterative process Methods 0.000 description 1
- 238000009533 lab test Methods 0.000 description 1
- 230000004807 localization Effects 0.000 description 1
- 206010025135 lupus erythematosus Diseases 0.000 description 1
- 238000004519 manufacturing process Methods 0.000 description 1
- 238000013507 mapping Methods 0.000 description 1
- 238000013178 mathematical model Methods 0.000 description 1
- 230000007246 mechanism Effects 0.000 description 1
- 230000001537 neural effect Effects 0.000 description 1
- 238000003199 nucleic acid amplification method Methods 0.000 description 1
- 238000005457 optimization Methods 0.000 description 1
- 229940127216 oral anticoagulant drug Drugs 0.000 description 1
- 230000008506 pathogenesis Effects 0.000 description 1
- 230000009054 pathological process Effects 0.000 description 1
- 230000037361 pathway Effects 0.000 description 1
- 238000003909 pattern recognition Methods 0.000 description 1
- 206010034674 peritonitis Diseases 0.000 description 1
- 210000002826 placenta Anatomy 0.000 description 1
- -1 polypropylene Polymers 0.000 description 1
- 229920001155 polypropylene Polymers 0.000 description 1
- 230000031915 positive regulation of coagulation Effects 0.000 description 1
- 201000011461 pre-eclampsia Diseases 0.000 description 1
- 208000037920 primary disease Diseases 0.000 description 1
- 238000004393 prognosis Methods 0.000 description 1
- 239000011541 reaction mixture Substances 0.000 description 1
- 208000013223 septicemia Diseases 0.000 description 1
- 238000012882 sequential analysis Methods 0.000 description 1
- NLJMYIDDQXHKNR-UHFFFAOYSA-K sodium citrate Chemical compound O.O.[Na+].[Na+].[Na+].[O-]C(=O)CC(O)(CC([O-])=O)C([O-])=O NLJMYIDDQXHKNR-UHFFFAOYSA-K 0.000 description 1
- 235000011083 sodium citrates Nutrition 0.000 description 1
- 238000007619 statistical method Methods 0.000 description 1
- 230000004083 survival effect Effects 0.000 description 1
- 230000002459 sustained effect Effects 0.000 description 1
- 230000009885 systemic effect Effects 0.000 description 1
- 206010043554 thrombocytopenia Diseases 0.000 description 1
- 230000001052 transient effect Effects 0.000 description 1
- HRXKRNGNAMMEHJ-UHFFFAOYSA-K trisodium citrate Chemical compound [Na+].[Na+].[Na+].[O-]C(=O)CC(O)(CC([O-])=O)C([O-])=O HRXKRNGNAMMEHJ-UHFFFAOYSA-K 0.000 description 1
- 235000019263 trisodium citrate Nutrition 0.000 description 1
- 229940038773 trisodium citrate Drugs 0.000 description 1
- 238000011179 visual inspection Methods 0.000 description 1
- PJVWKTKQMONHTI-UHFFFAOYSA-N warfarin Chemical compound OC=1C2=CC=CC=C2OC(=O)C=1C(CC(=O)C)C1=CC=CC=C1 PJVWKTKQMONHTI-UHFFFAOYSA-N 0.000 description 1
Images


Classifications
-
- G—PHYSICS
- G01—MEASURING; TESTING
- G01N—INVESTIGATING OR ANALYSING MATERIALS BY DETERMINING THEIR CHEMICAL OR PHYSICAL PROPERTIES
- G01N33/00—Investigating or analysing materials by specific methods not covered by groups G01N1/00 - G01N31/00
- G01N33/48—Biological material, e.g. blood, urine; Haemocytometers
- G01N33/50—Chemical analysis of biological material, e.g. blood, urine; Testing involving biospecific ligand binding methods; Immunological testing
- G01N33/86—Chemical analysis of biological material, e.g. blood, urine; Testing involving biospecific ligand binding methods; Immunological testing involving blood coagulating time or factors, or their receptors
Definitions
- Blood clots are the end product of a complex chain reaction where proteins form an enzyme cascade acting as a biologic amplification system. This system enables relatively few molecules of initiator products to induce sequential activation of a series of inactive proteins, known as factors, culminating in the production of the fibrin clot. Mathematical models of the kinetics of the cascade's pathways have been previously proposed.
- Thrombosis and hemostasis testing is the in vitro study of the ability of blood to form clots and to break clots in vivo .
- Coagulation (hemostasis) assays began as manual methods where clot formation was observed in a test tube either by tilting the tube or removing fibrin strands by a wire loop. The goal was to determine if a patient's blood sample would clot after certain materials were added. It was later determined that the amount of time from initiation of the reaction to the point of clot formation in vitro is related to congenital disorders, acquired disorders, and therapeutic monitoring.
- Two assays are widely used to screen for abnormalities in the coagulation system, although several other screening assays can be used, e.g. protein C, fibrinogen, protein S and/or thrombin time. If screening assays show an abnormal result, one or several additional tests are needed to isolate the exact source of the abnormality.
- the PT and APTT assays rely primarily upon measurement of time required for clot time, although some variations of the PT also use the amplitude of the change in optical signal in estimating fibrinogen concentration.
- Blood coagulation is affected by administration of drugs, in addition to the vast array of internal factors and proteins that normally influence clot formation.
- heparin is a widely-used therapeutic drug that is used to prevent thrombosis following surgery or under other conditions, or is used to combat existing thrombosis.
- the administration of heparin is typically monitored using the APTT assay, which gives a prolonged clot time in the presence of heparin. Clot times for PT assays are affected to a much smaller degree. Since a number of other plasma abnormalities may also cause prolonged APTT results, the ability to discriminate between these effectors from screening assay results may be clinically significant.
- Baumann, et al [4] showed that a ratio of two coefficients was unique for a select group of blood factor deficiencies when fibrinogen was artificially maintained by addition of exogenous fibrinogen to a fixed concentration, and that same ratio also correlates heparin to FII deficiency and FXa deficiencies.
- the requirement for artificially fixed fibrinogen makes this approach inappropriate for analysis of clinical specimens.
- the present invention makes it possible to predict haemostatic dysfunction for clinical samples from a time-dependent measurement profile without artificial manipulation of samples.
- the present invention was conceived of and developed for predicting haemostatic dysfunction in an unknown sample based on one or more time-dependent measurement profiles, such as optical time-dependent measurement profiles, where one or more predictor variables are provided which define characteristics of profile, and where in turn a model is derived that represents the relationship between the haemostatic dysfunction and the one or more predictor variables (so as to, in turn, utilize this model to predict the haemostatic dysfunction in the unknown sample).
- the present invention is directed to predicting the presence of Disseminated Intravascular Coagulation in a patient based on a time-dependent profile, such as an optical transmission profile, from a clotting assay run on the patient's blood or plasma sample.
- the present invention is directed to a method and apparatus for predicting haemostatic dysfunction from at least one time-dependent measurement profile.
- the present invention is also directed to such a method and apparatus for predicting Disseminated Intravascular Coagulation (DIC).
- the method and apparatus include a) performing at least one assay on an unknown sample and measuring a respective property over time so as to derive a time-dependent measurement profile, b) defining one or more predictor variables (one of which is slope prior to clot formation) which sufficiently define the data of the time-dependent profile, c) deriving a model that represents the relationship between a diagnostic output and the set of predictor variables, and d) utilizing the model to predict the existence of a haemosatic condition (e.g.
- training data is provided by performing a plurality of assays on known samples
- the model is a multilayer perceptron
- the relationship between the diagnostic output and the one or more predictor variable is determined by at least one algorithm
- the at least one algorithm is a back propagation learning algorithm.
- the relationship between the diagnostic output and the at least one predictor variable is derived by a set of statistical equations.
- time-dependent measurement profiles are derived, which time-dependent measurement profiles can be optical time-dependent measurement profiles such as ones provided by a automated analyzer for thrombosis and'hemostasis, where a plurality of optical (e.g. optical transmission) measurements are taken over time, and where the plurality of optical measurements are normalized.
- the optical profiles can include one or more of a PT profile, a fibrinogen profile, an APTT profile, a TT profile, a protein C profile, a protein S profile and a plurality of other assays associated with haemostatic dysfunction.
- time-dependent measurement is referred to herein to include measurements derived from assays (e.g. PT, APTT, fibrinogen, protein C, protein S, TT, ATIII, plasminogen and factor assays).
- assays e.g. PT, APTT, fibrinogen, protein C, protein S, TT, ATIII, plasminogen and factor assays.
- unknown sample and “clinical sample” refer to a sample, such as one from a medical patient (100), where haemostatic dysfunction associated with thrombosis/hemostasis is not known (or, if suspected, has not been confirmed).
- a coagulation property is measured over time so as to derive a time-dependent measurement profile.
- the time-dependent measurement is an optical measurement for deriving an optical profile.
- a PT profile, a fibrinogen profile, a TT profile, an APTT profile and/or variations thereof can be provided where, an unknown sample is analyzed for clot formation based on light transmittance over time through the unknown sample.
- two (or more) optical profiles are provided, such as both a PT profile and an APTT profile.
- a set of predictor variables are defined (110) which sufficiently define the data of the time-dependent profile.
- One or more predictor.variables comprise the set. And, in one' embodiment, three or more, and in a preferred embodiment, four or more predictor variables were found to desirably make up the set.
- the characteristics of the time-dependent measurement profile could best be defined by one or more predictor variables, including the minimum of the first derivative of the optical profile, the time index of this minimum, the minimum of the second derivative of the optical profile, the time index of this minimum, the maximum of the second derivative, the time index of this maximum, the overall change in transmittance during the time-dependent measurement, clotting time, slope of the optical profile prior to clot formation, and slope of the optical profile after clot formation.
- a model (113) is derived which represents the relationship between a congenital or acquired imbalance or therapeutic condition and the set of predictor variables.
- This model can be derived from a neural network in one embodiment of the present invention. In another embodiment, the model is derived via a set of statistical equations.
- Neural networks represent a branch of artificial intelligence that can be used to learn and model complex, unknown systems given some known data (115) from which it can train.
- neural networks that make them an attractive alternative for modeling complex systems are :
- Neural networks are formed from multiple layers of interconnected neurons like that shown in Figure 1. Each neuron has one output and receives input i 1 ... i n from multiple other neurons over connecting links, or synapses . Each synapse is associated with a synaptic weight, w j .
- An adder ⁇ or linear combiner sums the products of the input signals and synaptic weights i j *w j .
- the linear combiner output sum 1 and ⁇ 1 (a threshold which lowers or a bias which raises the output) are the input to the activation function f() .
- the synaptic weights are learned by adjusting their values through a learning algorithm.
- the model is utilized to predict (120) the existence of a congenital or acquired imbalance or therapeutic condition in the unknown sample relative to the time-dependent measurement profile(s).
- a congenital or acquired imbalance or therapeutic condition can be predicted.
- Conditions which can be predicted as being abnormal in the present invention can include, among others, a) factor deficiencies, e.g. fibrinogen, Factors II, V, VII, VIII, IX, X, XI and XII, as well as ATIII, plasminogen, protein C, protein S, etc., b) therapeutic conditions, e.g.
- the method is performed on an automated analyzer (90).
- the time-dependent measurement profile such as an optical data profile, can be provided automatically by the automated analyzer, where the unknown sample is automatically removed by an automated probe from a sample container to a test well, one or more reagents are automatically added to the test well so as to initiate the reaction within the sample.
- a property over time is automatically optically monitored so as to derive the optical profile.
- the predicted congenital or therapeutic condition (120) can be automatically stored in a memory (122) of an automated analyzer and/or displayed (124) on the automated analyzer, such as on a computer monitor, or printed out on paper.
- the predicted congenital or acquired imbalance or therapeutic condition (128) is an abnormal condition
- one or more assays for confirming the existence of the abnormal condition are performed on the automated analyzer.
- the one or more confirming assays are automatically ordered and performed on the analyzer once the predicted condition is determined, with the results of the one or more confirming assays being stored in a memory (131) of the automated analyzer and/or displayed (133) on the analyzer.
- This example shows a set of predictor variables that adequately describe screening assay optical profiles, develops an optimal neural network design, and determines the predictive capabilities of an abnormal condition associated with thrombosis/hemostasis (in this case for the detection of heparin) with a substantial and well-quantified test data set.
- SimplastinTM L, PlatelinTM L, calcium chloride solution (0.025 M), imidazole buffer were obtained from Organon Teknika Corporation, Durham, NC, 27712, USA. All plasma specimens were collected in 3.2% or 3.8% sodium citrate in the ratio of one part anticoagulant to nine parts whole blood. The tubes were centrifuged at 2000 g for 30 minutes and then decanted into polypropylene tubes and stored at -80°C until evaluated. 757 specimens were prepared from 200 samples. These specimens were tested by the following specific assays: FII, FV, FVII, FVIII, FIX, FX, FXI, FXII, heparin, fibrinogen, plasminogen, protein C, and AT-III.
- Samples represented normal patients, a variety of deficiencies, and therapeutic conditions. Of the specimen population 216 were positive 'for heparin determined by a heparin concentration greater than 0.05 units/ml measured with a chromogenic assay specific for heparin. The remaining specimens, classified as heparin-negative, included normal specimens, a variety of single or multiple factor deficiencies, and patients receiving other therapeutic drugs. Positive heparin samples ranged to 0.54 units/ml.
- PT and APTT screening assays were performed on each specimen five days.
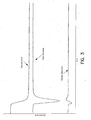
- clot-based coagulation assays are performed by an automated optically-based analyzer such as the MDA 180, data are collected over time that represents the normalized level of light transmission through a sample as a clot forms (the optical profile). As the fibrin clot forms, the transmission of light is decreased. The optical profile was stored from each test.
- M condition The network configuration chosen, a multilayer perceptron (M condition.
- M condition A similar network was also employed for PT-only variables and APTT-only variables.
- This specific MLP consists of three layers: the input layer, one hidden layer, and the output layer.
- a normal optical profile is shown in Figure 3.
- the set of predictor variables were chosen with the intent of describing optical profiles as completely as possible with a minimum number of variables. They are summarized in Table 1 where t is time from initiation of reaction, T is normalized light transmission through the reaction mixture, and pv jk is the k th predictor variable of assay j .
- the input variable set includes i 1...7 for both a PT assay and APTT assay for each specimen.
- heparin samples with results of greater than 0.05 units/ml were considered positive and assigned a value of 1 while negative samples were assigned a value of 0.
- the error-correction learning rule is an iterative process used to update the synaptic weights by a method of gradient descent in which the network minimizes the error as pattern associations (known input-output pairs) in the training set are presented to the network.
- Each cycle through the training set is known as an epoch.
- the order or presentation of the pattern associations was the same for all epochs.
- a training error tolerance of 0.1 was used in all experiments unless otherwise specified.
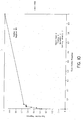
- the forward pass and backward pass are repeated for all of the pattern associations in the training set, referred to as an epoch, 1000 times. At the end of each epoch, the trained network is applied to the cross-validation set.
- Error, E for each input set was defined as The learning curve is defined as the plot of E versus epoch.
- the percent classification ⁇ describes the percent of the total test set (training and cross-validation) that is correctly classified based on some defined decision boundary, ⁇ .
- Receiver-Operating Characteristic (ROC) plots have also been utilized to describe trained networks' ability to discriminate between the alternative possible outcome states. In these plots, measures of sensitivity and specificity are shown for a complete range of decision boundaries.
- experiments were performed to determine if the presence of heparin could be predicted with this method.
- experiments were conducted to determine optimal error-correction backpropagation learning parameters: (1) hidden layer size, (2) learning rate, and (3) momentum. Additional experiments were also conducted to compare the performance of networks based on PT and APTT assays alone with that of one combining the results of both, the effect of the training error tolerance, and the decision boundary selection.
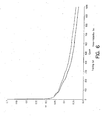
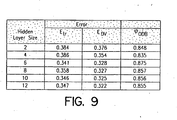
- Figure 9 shows the effect of the hidden layer size on the training and cross validation error and the percent correct classification for the optimal decision boundary, defined as the decision boundary which yielded the lowest total number of false positives and false negatives from the total test set.
- the hidden layer size As the hidden layer size is increased, the error is decreased. However, the ability to generalize does not increase after a hidden layer size of 6. The most significant benefit in terms of both error and percentage correct classification is between 4 and 6. A hidden layer size of 6 was'used for the remainder of the experiments.
- Figure 4 shows the learning curves for two of the best combinations of parameters.
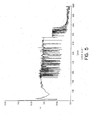
- Figure 5 shows an example learning curve when the learning rate is so high it leads to oscillations and convergence to a higher E.
- ⁇ ⁇ 0 the network converged to a lower E and as ⁇ ⁇ 1, the rate of convergence improved.
- ⁇ ⁇ 1 the value of E converged too increased and oscillations increased.
- ⁇ ⁇ 1 ⁇ ⁇ 1 exacerbated the oscillations.
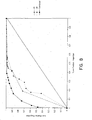
- Figure 8 shows the ROC plot for networks trained with the predictor variables from each of the two screening assays with that of them combined.
- the hidden layer size was 3. While using the data from one assay does lead to some success, using the information from both assays makes a significant improvement in the ability of the network to correctly predict the presence of heparin.
- FIG. 10 is a receiver operator characteristic plot related to predicting an abnormality in relation to Factor VIII.
- everything below 30% activity was indicated as positive, and everything above 30% was indicated as negative. Cutoff values other than 30% could also be used.
- the activity percentage has a known accuracy of approximately + or - 10%.
- the actual percent activity was utilized as the output.
- Clot-based parameters such as clot time, slope in the section prior to the initiation of clot formation, and afterwards, are often available, but not always (because in some samples, the clot time is hot detectable). The successful results observed indicate that the set of predictor variables used are effective for predicting congenital or acquired imbalances or therapeutic conditions.
- Duplicate APTT and PT screening assays were performed on each specimen with two MDA 180s using single lots of APTT and PT reagents. These specimens were also analyzed using specific assays for FII, FV, FVII, FVIII, FIX, FX, FXI, FXII, heparin, fibrinogen, plasminogen, protein C and antithrombin-III.
- Optical profile data files were exported from the MDA 180s and processed off-line. A set of nine parameters was derived to describe the timing, rate and magnitude of coagulation events. These parameters were calculated for all APTT and PT tests. The parameter set is modified slightly from that for Example 1. In this approach, the optical data for a PT or APTT assay was divided into three segments (a pre-coagulation segment, a coagulation segment and a post-coagulation segment) using divisions based on the minimum and maximum value of the second derivative for changes in optical signal with respect to time.
- Each neural network was trained for 1000 epochs. Training parameters were learning rate, 0.01; momentum, 0.5; learning tolerance, 0.10; decay, 0.05; input layer size, 18 (or 9 for single assays); hidden layer size, 9 (or 5 for single assays); and output layer size, 1.
- Three types of networks were trained. These included networks that classified specimens as deficient or non-deficient based on a single diagnostic cut-off, sets of networks that used diagnostic cut-offs at different levels of the same factor, and networks trained to estimate the actual concentration of a specific factor.
- neural networks were trained to classify plasma samples into two groups, positive (factor-deficient) and negative (non-deficient), and results were compared to classification based on the measured factor concentration for the specimens.
- the diagnostic cut-off for defining factor deficiencies was set as 30%; that is, specimens with a measured concentration of less that 30% of normal for a specific factor were defined as deficient and those with greater than 30% activity were defined as non-deficient. These diagnostic cut-off levels were arbitrarily defined, but are based. on clinical requirements and 'reagent sensitivity.
- FIG. 22 shows the constituency of the training and cross-validation sets with regard to each factor deficiency. Classification of specimens was evaluated at varying "decision boundaries" that divided the neural network outputs into positive and negative groups. This positive or negative classification was then compared to the desired output (the known classification) for each input data set. Results were plotted as nonparametric receiver-operating characteristic (ROC) curves and the areas under the curves were computed along with their associated standard errors. ROC curves were also derived for APTT and PT clot time values for comparison.
- ROC receiver-operating characteristic
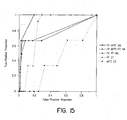
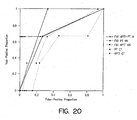
- ROC curves represent the proportion of true-positive and false-positive classifications at various decision boundaries. Optimum results are obtained as the true-positive proportion approaches 1.0 and the false-positive proportion approaches 0.0 (upper-left corner of graph). The optimum global measure of the ROC curve is an area of 1.0.
- a second set of networks was trained for FX classification in a similar manner to the first set except that the diagnostic cut-off level was varied (10%, 30%, and 50%). FX was chosen for this experiment because the data set contained a greater number of positive samples at all cut-off levels than other factors.
- a third set of networks were trained to approximate actual specific factor activities (FII, FV, FVII, FVIII, FIX, FX, FXI and FXII) and fibrinogen levels from combined PT and APTT parameters from unknown samples.
- the desired output of the training and cross-validation sets was the measured activity for a specific factor for each specimen and the actual output of the neural network was a predicted concentration for this specific factor activity.
- the coefficients of linear regressions using the desired outputs versus the actual neural network outputs for the cross-validation set were used to describe the performance of these networks.
- the Pearson product moment correlation coefficient, r was used to estimate the correlation between the two data sets.
- ROC receiver-operating curves
- an ROC plot for diagnosis of FII deficiencies using PT clot time was generated by varying the decision boundary (value of PT clot time) used to differentiate between deficient and non-deficient specimens.
- the decision boundary value of PT clot time
- most deficient specimens can be identified but a significant proportion of non-deficient specimens may also be flagged (false-positives).
- the proportion of false-positives decreases, but the number of true-positive specimens that are not diagnosed may also increase.
- a decision boundary can be identified from an ROC curve that produces a very high proportion of true-positives and a very low proportion of false-positives.
- sensitivity refers to the ability to detect positive specimens and corresponds to the y-axis of the ROC plots.
- Specificity refers to the proportion of specimens diagnosed as negative which are correctly identified.
- the ROC x-axis equals (1-specificity).
- Visual assessment of the ROC curves is one 'method used to evaluate the performance of the neural networks and compare them to the diagnostic power of PT and APTT clot times. Another method is to measure the diagnostic performance by using the area under the ROC curves.
- the area under the ROC curve is equivalent to an estimate of the probability that a randomly chosen positive specimen will have a more positive result than a randomly chosen negative specimen.
- ROC curves overlap, the shape of the curves as well as the areas beneath them becomes important.
- An ROC curve encompassing a smaller area may be preferable to an overlapping curve with greater area depending on the desired performance for a given diagnostic system.
- Figures 14 - 21 show ROC curves for neural networks trained to predict FII, FV, FVII, FVIII, FIX, FX, FXI, and FXII deficiencies from PT parameters alone, from APTT parameters alone, or from combined APTT and PT parameters. ROC plots based on classification using APTT and PT clot times are included for comparison. Figure 23 shows the area under these curves and their associated standard errors.
- Results from classification of FV deficiencies showed somewhat different characteristics ( Figures 15 and 23). Best results were observed for classification from a neural network using APTT data parameters, based on visual inspection and area under the ROC curve. Less successful classification were obtained from neural networks using PT data parameters alone or combined with APTT data, and from PT clot time, as judged from areas under ROC curves. Classification based on PT clot time was qualitatively different from neural networks using PT data, however, and tended toward higher sensitivity rather than specificity. This type of pattern was observed for classification of several coagulation factors, especially factors VIII, X and XI. In situations where overlapping ROC curves were obtained, consideration of the relative value of specificity and sensitivity, as well as the area under ROC curves, becomes important in comparing diagnostic results.
- misclassified positive specimens were clustered in several categories: 1) Specimens with "no clot" APTT or PT results (specimens with very prolonged or very weak coagulation reaction for which no clot time can be reliably calculated); 2) specimens with multiple deficiencies or abnormalities; 3) specimens with borderline deficiencies (factor activity marginally lower than the diagnostic cut-off of 30%); and 4) specimens with atypically steep slope during the pre-coagulation phase for APTT assays that were not characteristic of other specimens in the same classification (FX deficiencies were not detected for two specimens exhibiting this characteristic with FX activities of 26.8% and 16.8%, respectively).
- Neural networks were also trained to estimate actual protein concentrations (as opposed to a positive/negative classification at a defined cut-off) for FII, FV, FVII, FVIII, FIX, FX, FXI, FXII and fibrinogen. Linear correlation coefficients for the estimated and measured concentrations are shown in Figure 25 for all experiments, and plots of the correlation data are shown in Figure 26 for fibrinogen and Figure 27 for FX. Correlation data between PT and APTT clot time and measured concentrations are also shown in Figure 25 for comparison.
- Neural networks using self-organizing feature maps and learning vector quantization were used to analyze optical data from clinical coagulation tests.
- Self-organizing feature maps using an unsupervised learning algorithm were trained with data from normal donors, patients with abnormal levels of coagulation proteins and patients undergoing anticoagulant therapy. Specimen categories were distinguishable in these maps with varying levels of resolution.
- a supervised neural network method, learning vector quantization was used to train maps to classify coagulation data.
- Self-organizing feature maps contain layers of input and output neurons only and contain no hidden layers. Training is based on competitive learning where the output neurons compete with one another to be activated and only one output neuron is activated for any given set of inputs. Output neurons become selectively tuned to certain input patterns, and data with similar features tend to be grouped together spatially.
- This type of neural network may use either an unsupervised or supervised learning algorithm. When an unsupervised method is used, such as the self-organizing map (SOM) algorithm, unidentified input patterns are presented to the network during training and the output for each input pattern is the coordinates of the winning neuron in the output layer, or map.
- SOM self-organizing map
- LVQ learning vector quantization
- MDA Simplastin L (PT reagent), MDA Platelin L (APTT reagent) and other reagents were obtained from Organon Teknika Corporation, Durham, NC 27712, USA, unless otherwise indicated.
- Factor-deficient plasmas for factor assays were obtained from Organon Teknika and George King Bio-Medical Corporation, Overland Park, Kansas 66210, USA. Additional factor-deficient plasmas were obtained from HRF, Raleigh, NC 27612, USA. Random samples, specimens from patients receiving heparin or oral anticoagulant therapy, and other specimens were obtained from Duke University Medical Center Coagulation Laboratory.
- coagulation factors FII, FV, FVII, FVIII, FIX, FX, FXI, FXII
- the diagnostic cut-off for defining factor deficiencies was set at 30%; that is, specimens with a measured concentration of less that 30% of normal for a specific factor were defined as deficient and those with greater than 30% activity were defined as non-deficient. Samples were defined as positive for heparin if the measured heparin concentration was greater than 0.05 IU/ml.
- Optical profile data files were exported from MDA 180s and processed off-line. A set of nine parameters was derived to describe the timing, rate and magnitude of coagulation events for PT and APTT tests, as described previously. In this approach, the optical data for a PT or APTT assay was divided into three segments (a pre-coagulation segment, a coagulation segment and a post-coagulation segment) using divisions based on the minimum and maximum value of the second derivative for changes in optical signal with respect to time.
- a self-organizing feature map neural network consists of input and output layers of neurons.
- the self-organizing map (SOM) algorithm transforms an input vector (a set of data parameters from PT or APTT optical data for a single test) to an individual output neuron whose location in the output layer, or map, corresponds to features of the input data. These features tend to be spatially correlated in the map.
- SOM learning process There are five steps in the SOM learning process:
- the SOM tests were performed using the Self-Organizing Map Program Package (SOM_PAK) available from the Helsinki University of Technology, Laboratory of Computer Sciences. Two different sets of parameters were used as input to the SOMs: (1) the nine parameters from a PT assay, and (2) the nine parameters from the APTT assay. All data sets (786) were used to train the SOMs.
- a 10x10 map ' was trained using a hexagonal neighborhood in two stages. In the first stage, the map was trained for 1000 epochs (an epoch is one cycle through all data sets) with an initial learning rate parameter of 0.5 (decreasing linearly to zero during training) and a neighborhood radius of 10 (decreasing linearly to 1 during training). In the second stage, the map was trained for 10000 epochs using a learning rate parameter of 0.1 and a radius of 3.
- SOM_PAK Self-Organizing Map Program Package
- LVQ Learning vector quantization
- the LVQ tests were performed using the Learning Vector Quantization Program Package (LVQ_PAK), also available from the Helsinki University of Technology, Laboratory of Computer Sciences.
- LVQ_PAK Learning Vector Quantization Program Package
- the sets of parameters from the APTT assay or PT assays were used for the LVQ networks.
- the data parameter sets were divided evenly into training and cross-validation sets randomly by specimen, where all replicates for a given specimen were grouped either in the cross-validation set or training set. The same training and cross-validation sets were used throughout this study.
- the LVQ networks were trained to classify plasma samples into two categories, positive (factor-deficient specimens or specimens from patients undergoing anticoagulant therapy) and negative (non-deficient or no anticoagulant therapy), and results were compared to classification based on the measured factor concentration or therapeutic condition for the specimens.
- LVQ training was performed using 200 weight vectors, 10000 epochs, initial learning rate parameter of 0.5 (decreasing linearly to 0), and 7 neighbors used in knn-classification.
- LVQ networks were' evaluated using sensitivity (the proportion of known positive specimens that were correctly classified as positive by the network), specificity (the proportion of known negative specimens that were correctly classified as negative by the network), positive predictive value (PPV), negative predictive value (NPV) and efficiency. These terms are defined below, where TP, TN, FP and FN correspond to true positive, true negative,' false positive and false negative classifications, respectively.
- PPV TP TP + FP
- Self-organizing feature maps were trained using optical data parameters from either PT or APTT data for 200 specimens as input.
- Network output consisted of map coordinates for each specimen.
- Contour plots were constructed for six categories of known specimen classifications: normal donors, specimens with heparin > 0.05 IU/ml, fibrinogen >600mg/dl, fibrinogen ⁇ 200 mg/dl, patients receiving oral anticoagulants, and factor-deficient specimens (specimens with ⁇ 30% of normal activity for FII, FV, FVII, FVIII, FIX, FX, FXI, or FXII). These contour plots depict the distribution of specimens within a category according to their map coordinates.
- Figure 28 Contour plots for populations of samples used in training a self-organizing feature map using the unsupervised training method SOM based on data from APTT assays. Optical data parameters from 765 APTT assays were used to train this self-organizing feature map. The shaded areas represent the distribution of output neurons for specific specimen populations within the feature map. Each contour line represents an incremental step of one test result located at a given set of map coordinates.
- Figure 28 shows SOM contour plots derived from APTT optical data for the six specimen categories. Specimens containing low fibrinogen and high fibrinogen were classified 'at opposite borders of the SOM with no overlap. Normal populations showed some overlapping with low fibrinogen, factor deficient and oral anticoagulated categories. Overlap between normal specimens and edges of the high and low fibrinogen populations is expected, since some proportion of healthy donors have fibrinogen levels that are lower or higher than normal. Overlap between mapping of normal specimens and factor-deficient plasmas is also not surprising, since APTT tests are sensitive to some factor-deficiencies (but not others), whereas PT assays are sensitive to a separate subset of factor deficiencies.
- the low fibrinogen category tended to overlap the factor-deficient category, consistent with our observation that many factor-deficient specimens also had reduced fibrinogen levels.
- the heparin category tended to overlap the high fibrinogen category, again consistent with measured levels of fibrinogen for these specimens. Little or no overlap was observed between normal specimens and specimens containing heparin. Specimens from patients receiving oral anticoagulant therapy show significant overlap with both normal and heparin populations. This is consistent with known properties of APTT assays, which are sensitive to heparin therapy but relatively insensitive to oral anticoagulant therapy.
- Figure 29 Contour plots for populations of samples used in training a self-organizing feature map using the unsupervised training method SOM based on optical data from 765 PT assays. Experimental details are as described in the Materials and Methods section and in Figure 28.
- Contour plots for self-organizing feature maps trained with PT data are shown in Figure 29. Results are similar to maps from APTT data in several respects: (1) high and low fibrinogen were well resolved at opposite sides of the map; (2) normal specimens were localized in a region that overlapped low fibrinogen specimens slightly; (3) factor-deficient specimens were distributed between non-overlapping regions and regions that overlapped low fibrinogen and normal populations. Overlap was consistent with measured fibrinogen for some specimens, and with poor sensitivity of PT reagents to some factor deficiencies in other cases; (4) oral anticoagulated specimens showed some overlap with both normal and heparin populations; and (5) the heparinized population was distributed over a large portion of the map. Overlap between heparinized specimens and high fibrinogen populations was consistent with measured fibrinogen levels. The resolution of the heparin population is somewhat surprising, considering that PT reagents are relatively insensitive to heparin.
- LVQ networks were trained to predict the presence or absence of a specific factor deficiency or therapeutic condition from APTT or PT optical data. Results for the cross-validation data are summarized in Figure 30. Previous studies concluded that back-propagation neural networks were capable of sensitivity > 0.6 while maintaining specificity >0.9 for all factors except FVII using an appropriate choice of PT and APTT data separately or in combination. In this study, LVQ networks using APTT data gave sensitivity > 0.6 with specificity > 0.85 for factors II, X, XI, and XII, and heparin.
- LVQ networks using PT data were able to achieve > 0.6 sensitivity while maintaining > 0.85 specificity for Factors II, X, and XI, and heparin ( Figure 30).
- Results from LVQ networks showed less sensitivity for prediction of FVII deficiencies, consistent with results from back-propagation networks.
- sensitivity for predicting deficiencies from LVQ cross-validation sets was generally less ( ⁇ 0.35) than for factors II, X, XI and XII.
- Haemostatic Dysfunction is the activation of coagulation prior to initiation of clot formation, which results in a biphasic waveform.
- DIC Disseminated intravascular coagulation
- the invention has been found to be not only useful as an early diagnostic and single monitoring marker of DIC, but in addition the quantifiable and standardizable changes also allow for prognostic applicability in clinical management.
- DIC Disseminated intravascular coagulation
- Freshly collected blood samples that required a PT or an APTT were analyzed prospectively over a two week working period. These were in 0.105M tri-sodium citrate in the ratio of 1 part anticoagulant to 9 parts whole blood and the platelet-poor plasma was analyzed on the MDA (Multichannel Discrete Analyzer) 180, an automated analyzer for performing clinical laboratory coagulation assays using an optical detection system (Organon Teknika Corporation, Durham, NC, USA).
- MDA Multichannel Discrete Analyzer
- Decreasing levels of light transmittance therefore correlates directly with increasing steepness of the bi-phasic slope.
- the recording of the light transmittance, at 25 seconds also allows for standardization between patients and within the same patient with time. If the minimum level of light transmittance for each sample were to be used instead, this would be affected by variations in the clot time of the APTT and would therefore not be ideal for comparisons.
- Platelet counts (Plt) normal 150-400 10 9 /1) performed on an EDTA sample at the same time were recorded.
- clinical details were .fully elucidated on any patient with a bi-phasic TW or coagulation abnormalities consistent with DIC.
- the diagnosis of DIC was strictly defined in the context of both laboratory and clinical findings of at least 2 abnormalities in the screening tests (increased PT, increased APTT, reduced Fgn, increased TT or reduced Plt) plus the finding of an elevated D-dimer level (>0.5 mg/l) in association with a primary condition recognized in the pathogenesis of DIC.
- Serial screening tests were also available on those patients to chart progression and confirmation of the diagnosis of DIC as was direct clinical assessment and management.
- values for the sensitivity, specificity, positive and negative prediction of the APTT-TW for the diagnosis of DIC were calculated employing a two-by-two table. 95% confidence intervals (CI) were calculated by the exact binomial method.
- DIC was diagnosed in 41 patients with 30 of these requiring transfusion support with fresh frozen plasma, cryoprecipitate or platelets. The underlying clinical disorders as shown in Table 1 Clinical disorders predisposing patients to DIC. Disorder No Infections 17 Trauma or recent major surgery 16 Malignancy 2 Hepatic Disease 1 Obstetric Cause 1 Miscellaneous Additional Causes 4 40 of the 41 patients with DIC had the bi-phasic TW.
- the one false negative result occurred in a patient with pre-eclampsia (PET) where the single sample available for analysis showed a prolonged PT of 21.0s, APTT of 44.0s and raised D-dimers of 1.5mg/l.
- PET pre-eclampsia
- 5 other patients were identified in this study with PET and none had either DIC or a bi-phasic TW.
- DIC DIC without a bi-phasic TW
- Table 3 illustrates one such example with serial test results from a patient with E. coli septicaemia.
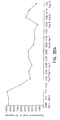
- FIG. 34 illustrates the results of a patient who initially presented with peritonitis following bowel perforation. This was further complicated by gram negative septicaemia postoperatively with initial worsening of DIC followed by a gradual recovery after appropriate therapy. As DIC progressed initially, there was increasing steepness in the bi-phasic slope of the TW and a fall in the light transmittance level. A reversal of this heralded clinical recovery.
- Figure 35 illustrates the results of a patient who sustained severe internal and external injuries following a jet-ski accident. Although initially stabilized with blood product support, his condition deteriorated with continuing blood loss and development of fulminant DIC. The bi-phasic slope became increasingly steep with falls in transmittance level as the consequences of his injuries proved fatal.
- TW data from the MDA-180 would also fulfil the criteria of simplicity and rapidity unlike the measurements of thrombin-antithrombin complexes or other markers that are dependent on ELISA technology.
- the advantages of TW analysis are that: (a) the bi-phasic TW change appears to be the single most useful correlate within an isolated sample for DIC and as such, reliance need no longer be placed on serial estimations of a battery of tests, and (b) the appearance or resolution of the bi-phasic TW can precede changes in the standard, traditional parameters monitored in DIC with strong, clear correlation to clinical events and outcome.
- bi-phasic TW was also seen in patients who did not have DIC per se as defined by the above criteria, the clinical conditions were associated with Haemostatic Dysfunction - namely activated coagulation prior to initiation of clot formation resulting in a biphasic waveform (for example in chronic liver disease or in the very ill patients on the Intensive Care Unit who had multiple organ dysfunction). It appears that bi-phasic TW is sensitive to non-overt or'compensated DIC and that a transmittance level of less than 90% ( Figure 33) or sequential falls in that level ( Figure 35), reflects decompensation towards a more overt manifestation and potentially fulminant form of DIC.
- a second embodiment of the invention has been found that greatly improves sensitivity and specificity. It has been found that looking at transmittance at a particular time can result in detecting an artifact or other decrease in transmittance at that point, even though the waveform is not a bi-phasic waveform. For example, a temporary dip in transmittance at 25 seconds would cause such a patient sample to be flagged as bi-phasic, even if the waveform was normal or at least not bi-phasic. Also, if a patient sample had a particularly short clotting time, then if clot formation begins e.g. prior to 25 seconds (or whatever time is preselected), then the waveform could be flagged as biphasic, even though the real reason for decreased transmittance at 25 seconds is because clot formation has already begun/occurred.
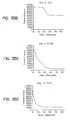
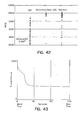
- Fig. 36 illustrates ROC plots for the prediction of DIC for three different parameters derived from the APTT assay using the combined data sets described: (1) transmittance at 25 seconds (TR25), (2) APTT clot time, and (3) slope 1 (the slope up to initiation of clot formation). Slope 1 exhibited the best predictive power, followed by TR25.
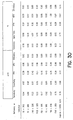
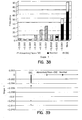
- Tables 5 and 6 show the data for the histograms in Figures 37 and 38 respectively: Bins DIC Normal Abnormal/Non-DIC -0.006 3 0 0 -0.005 2 0 0 -0.004 1 0 0 -0.003 10 0 0 -0.002 24 0 0 -0.001 33 0 0 -0.0005 12 0 0 -0.0002 5 5 2 -0.0001 1 37 13 More 0 68 22 Bin DIC Normal Abnormal/Non-DIC 7000 34 1 0 8000 18 2 0 9000 26 6 1 9500 8 3 0 9600 3 2 1 9700 1 0 0 9800 1 3 0 9900 0 21 4 10000 0 62 30 More 0 10 1
- Figures 39 and 41 show the group distributions for Slope 1 and TR25 respectively; and Figures 40 and 42 show the group distributions for Slope 1 and TR25 respectively. Figures 40 and 42 show partial subpopulations of the data shown in Figures 39 and 41.
- the detected bi-phasic waveform can be flagged.
- the operator of the machine, or an individual interpreting the test results e.g. a doctor or other medical practitioner
- the flag can be displayed on a monitor or printed out.
- a slope of less than about -0.0003 or less than about -0.0005 is the preferred cutoff for indicating a bi-phasic waveform. An increasing steepness in slope prior to clot formation correlates to disease progression.
- the PT waveform profile was derived using PT reagents (thromboplastin), namely RecombiplastTM (Ortho), ThromborelTM (Dade-Behring) and InnovinTM (Dade-Behring). Both Recombiplast and Thromborel were particularly good at showing bi-phasic responses. Innovin was intermediate in its sensitivity. Using the transmittance level at 10 seconds into the PT reaction as the quantitative index, Recombiplast and Thromborel objectively showed lower levels of light transmittance than Innovin. Thromborel can show a slight increase in initial light transmittance before the subsequent fall. This may be, in part, related to the relative opaqueness of Thromborel.
- Figure 23 illustrates the results of classification of coagulation factor deficiencies as determined from area under ROC curves. Results are shown for classification based on APTT and PT clot times (APTT CT and PT CT, respectively) and from neural networks using APTT optical data parameter sets (PTT NN), PT data parameters (PT NN) and combined data sets from both assays (APTT-PT NN). Results are expressed as area under ROC curves and the associated standard error (SE) calculated according to [19].
- SE standard error
- Figure 24 illustrates the areas under ROC curves for three networks trained to classify factor deficiencies based on three different diagnostic cutoffs (10%, 30% and 50%).
- the area under the ROC curve for PT clot time is also included.
- ROC curves for APTT clot time are not shown due to the generally accepted insensitivity of APTT clot time to FX (as exhibited in Table II).
- SE is the standard error associated with the area.
- Figure 25 illustrates the results from linear regressions comparing factor concentrations estimated using neural networks with measured factor concentrations, including the slope, intercept, and the Pearson product moment correlation coefficient (r). Pearson correlation coefficients are also included for linear regressions comparing APTT and PT clot times with measured factor concentrations.
- Figure 30 illustrates sensitivity, specificity, efficiency, predictive value of positive test (PPV), and predictive power of negative test (NPV) for self-organizing feature maps trained using learning vector quantization to predict factor-deficiencies or herapin therapy based on either APTT or PT parameters.
- PV positive test
- NPV predictive power of negative test
Landscapes
- Health & Medical Sciences (AREA)
- Life Sciences & Earth Sciences (AREA)
- Hematology (AREA)
- Engineering & Computer Science (AREA)
- Molecular Biology (AREA)
- Biomedical Technology (AREA)
- Chemical & Material Sciences (AREA)
- Immunology (AREA)
- Urology & Nephrology (AREA)
- Biotechnology (AREA)
- Microbiology (AREA)
- Cell Biology (AREA)
- Food Science & Technology (AREA)
- Medicinal Chemistry (AREA)
- Physics & Mathematics (AREA)
- Analytical Chemistry (AREA)
- Biochemistry (AREA)
- General Health & Medical Sciences (AREA)
- General Physics & Mathematics (AREA)
- Pathology (AREA)
- Investigating Or Analysing Biological Materials (AREA)
Applications Claiming Priority (3)
| Application Number | Priority Date | Filing Date | Title |
|---|---|---|---|
| US24434099A | 1999-02-04 | 1999-02-04 | |
| US244340 | 1999-02-04 | ||
| EP00913371A EP1147423B1 (de) | 1999-02-04 | 2000-02-04 | Verfahren und vorrichtung zum vorhersagen von haemostatischer funktionsstörung in patientenproben |
Related Parent Applications (1)
| Application Number | Title | Priority Date | Filing Date |
|---|---|---|---|
| EP00913371A Division EP1147423B1 (de) | 1999-02-04 | 2000-02-04 | Verfahren und vorrichtung zum vorhersagen von haemostatischer funktionsstörung in patientenproben |
Publications (1)
| Publication Number | Publication Date |
|---|---|
| EP1522860A1 true EP1522860A1 (de) | 2005-04-13 |
Family
ID=34315152
Family Applications (1)
| Application Number | Title | Priority Date | Filing Date |
|---|---|---|---|
| EP04025887A Withdrawn EP1522860A1 (de) | 1999-02-04 | 2000-02-04 | Verfahren und Vorrichtung zum Vorhersagen von haemostatischer Funktionsstörung in Patientenproben |
Country Status (1)
| Country | Link |
|---|---|
| EP (1) | EP1522860A1 (de) |
Cited By (1)
| Publication number | Priority date | Publication date | Assignee | Title |
|---|---|---|---|---|
| CN112396591A (zh) * | 2020-11-25 | 2021-02-23 | 暨南大学附属第一医院(广州华侨医院) | 一种基于腰椎x线图像的骨质疏松智能评估方法 |
Citations (3)
| Publication number | Priority date | Publication date | Assignee | Title |
|---|---|---|---|---|
| WO1996041291A1 (en) * | 1995-06-07 | 1996-12-19 | Akzo Nobel N.V. | A method and apparatus for predicting the presence of congenital and acquired imbalances and therapeutic conditions |
| WO1999034208A1 (en) * | 1997-12-31 | 1999-07-08 | Akzo Nobel N.V. | A method for predicting an abnormal level of clotting proteins |
| WO2001013125A1 (en) * | 1999-08-12 | 2001-02-22 | Akzo Nobel N.V. | A method for predicting the presence of haemostatic dysfunction in a patient sample |
-
2000
- 2000-02-04 EP EP04025887A patent/EP1522860A1/de not_active Withdrawn
Patent Citations (4)
| Publication number | Priority date | Publication date | Assignee | Title |
|---|---|---|---|---|
| US5708591A (en) * | 1995-02-14 | 1998-01-13 | Akzo Nobel N.V. | Method and apparatus for predicting the presence of congenital and acquired imbalances and therapeutic conditions |
| WO1996041291A1 (en) * | 1995-06-07 | 1996-12-19 | Akzo Nobel N.V. | A method and apparatus for predicting the presence of congenital and acquired imbalances and therapeutic conditions |
| WO1999034208A1 (en) * | 1997-12-31 | 1999-07-08 | Akzo Nobel N.V. | A method for predicting an abnormal level of clotting proteins |
| WO2001013125A1 (en) * | 1999-08-12 | 2001-02-22 | Akzo Nobel N.V. | A method for predicting the presence of haemostatic dysfunction in a patient sample |
Cited By (1)
| Publication number | Priority date | Publication date | Assignee | Title |
|---|---|---|---|---|
| CN112396591A (zh) * | 2020-11-25 | 2021-02-23 | 暨南大学附属第一医院(广州华侨医院) | 一种基于腰椎x线图像的骨质疏松智能评估方法 |
Similar Documents
| Publication | Publication Date | Title |
|---|---|---|
| EP1147423B1 (de) | Verfahren und vorrichtung zum vorhersagen von haemostatischer funktionsstörung in patientenproben | |
| US6321164B1 (en) | Method and apparatus for predicting the presence of an abnormal level of one or more proteins in the clotting cascade | |
| EP0834145B1 (de) | Verfahren und apparat zum vorhersagen der präsenz von angeborenen und erworbenen unausgewogenheiten und therapeutischen zuständen | |
| US6898532B1 (en) | Method and apparatus for predicting the presence of haemostatic dysfunction in a patient sample | |
| AU2008201621A1 (en) | A method for predicting the presence of haemostatic dysfunction in a patient sample | |
| US20030049851A1 (en) | Method for predicting the presence of haemostatic dysfunction in a patient sample | |
| EP1188060B1 (de) | Verfahren und apparatur zum präsentieren von daten von thrombose- und haemostaseassays | |
| EP1522860A1 (de) | Verfahren und Vorrichtung zum Vorhersagen von haemostatischer Funktionsstörung in Patientenproben | |
| Givens et al. | Classification of factor deficiencies from coagulation assays using neural networks | |
| AU2004201011B2 (en) | Method and apparatus for presenting thrombosis and hemostasis assay data | |
| AU2005201099A1 (en) | Method for predicting the presence of haemostatic dysfunction in a patient sample |
Legal Events
| Date | Code | Title | Description |
|---|---|---|---|
| PUAI | Public reference made under article 153(3) epc to a published international application that has entered the european phase |
Free format text: ORIGINAL CODE: 0009012 |
|
| AC | Divisional application: reference to earlier application |
Ref document number: 1147423 Country of ref document: EP Kind code of ref document: P |
|
| AK | Designated contracting states |
Kind code of ref document: A1 Designated state(s): AT BE CH CY DE DK ES FI FR GB GR IE IT LI LU MC NL PT SE |
|
| 17P | Request for examination filed |
Effective date: 20051013 |
|
| AKX | Designation fees paid |
Designated state(s): AT BE CH CY DE DK ES FI FR GB GR IE IT LI LU MC NL PT SE |
|
| 17Q | First examination report despatched |
Effective date: 20081010 |
|
| STAA | Information on the status of an ep patent application or granted ep patent |
Free format text: STATUS: THE APPLICATION IS DEEMED TO BE WITHDRAWN |
|
| 18D | Application deemed to be withdrawn |
Effective date: 20090521 |