EP1548596A1 - Méthode pour le test de la charge d'un système de transactions d'ordinateur - Google Patents
Méthode pour le test de la charge d'un système de transactions d'ordinateur Download PDFInfo
- Publication number
- EP1548596A1 EP1548596A1 EP04257952A EP04257952A EP1548596A1 EP 1548596 A1 EP1548596 A1 EP 1548596A1 EP 04257952 A EP04257952 A EP 04257952A EP 04257952 A EP04257952 A EP 04257952A EP 1548596 A1 EP1548596 A1 EP 1548596A1
- Authority
- EP
- European Patent Office
- Prior art keywords
- frustration
- delay time
- abandonment
- user
- delay
- Prior art date
- Legal status (The legal status is an assumption and is not a legal conclusion. Google has not performed a legal analysis and makes no representation as to the accuracy of the status listed.)
- Withdrawn
Links
Images




Classifications
-
- G—PHYSICS
- G06—COMPUTING OR CALCULATING; COUNTING
- G06F—ELECTRIC DIGITAL DATA PROCESSING
- G06F11/00—Error detection; Error correction; Monitoring
- G06F11/30—Monitoring
- G06F11/34—Recording or statistical evaluation of computer activity, e.g. of down time, of input/output operation ; Recording or statistical evaluation of user activity, e.g. usability assessment
- G06F11/3447—Performance evaluation by modeling
-
- G—PHYSICS
- G06—COMPUTING OR CALCULATING; COUNTING
- G06F—ELECTRIC DIGITAL DATA PROCESSING
- G06F11/00—Error detection; Error correction; Monitoring
- G06F11/30—Monitoring
- G06F11/34—Recording or statistical evaluation of computer activity, e.g. of down time, of input/output operation ; Recording or statistical evaluation of user activity, e.g. usability assessment
- G06F11/3409—Recording or statistical evaluation of computer activity, e.g. of down time, of input/output operation ; Recording or statistical evaluation of user activity, e.g. usability assessment for performance assessment
- G06F11/3419—Recording or statistical evaluation of computer activity, e.g. of down time, of input/output operation ; Recording or statistical evaluation of user activity, e.g. usability assessment for performance assessment by assessing time
-
- G—PHYSICS
- G06—COMPUTING OR CALCULATING; COUNTING
- G06F—ELECTRIC DIGITAL DATA PROCESSING
- G06F11/00—Error detection; Error correction; Monitoring
- G06F11/30—Monitoring
- G06F11/34—Recording or statistical evaluation of computer activity, e.g. of down time, of input/output operation ; Recording or statistical evaluation of user activity, e.g. usability assessment
- G06F11/3438—Recording or statistical evaluation of computer activity, e.g. of down time, of input/output operation ; Recording or statistical evaluation of user activity, e.g. usability assessment monitoring of user actions
Definitions
- the present invention relates to a method for testing a system to determine the likely frustration that will be experienced by users of a system, and percentage of users likely to abandon the system.
- the invention relates in particular to computer or software systems that can be used simultaneously by many users, and to frustration caused by delay times between the request and delivery of information in such systems.
- transactional servers In computer systems that can be used simultaneously by many users, it is often desirable to be able to test and monitor the performance of the systems.
- Such systems are known as "transactional servers" and common examples are web sites, web applications, telephone applications and web services.
- devices such as computers, mobile phones, telephones and mobile devices connect over a network to a transactional server where they can access information or applications on the transactional server.
- load testing or monitoring tools for testing and monitoring the performance of transactional servers such as web sites or web services.
- load testing or monitoring tools are the Advanced .NET Testing System® product of Red Gate Software Ltd, LoadRunner® by Mercury Interactive Inc, Silk Performer® by Segue Inc, and ACT® and Homer® by Microsoft Inc.
- These tools are typically used on transactional servers that are not yet deployed or launched. Testing will often be done to ensure that a transactional server will be able to support the number of users anticipated to be using it once it is launched.
- Load testing tools are designed to predict how well a transactional server will perform when it is in use by a number of users.
- Information that can be produced by load tests of systems such as web sites is generally of the form of a measurement indicating the average page download time for X concurrent simulated users.
- the average page download time is generally given as Y seconds.
- a load testing tool will simulate a number of users using a transactional server.
- a tool may measure any or all of the following: the time taken for information to be transferred from the server to the users; the quantity of data transferred to users; whether or not information requested by a user has been delivered correctly.
- the results of load tests can be enhanced by the use of statistical processing and used to generate histograms, averages, graphs and charts for displaying to the test users.
- a large amount of data can be obtained from a load test and consequently it can be a daunting task for a test user to attempt to analyse the results and interpret them in the context of the transactional server tested.
- What is important to a person viewing the results of a load test is usually the simple question of how the server's performance will be perceived by its users.
- it is a disadvantage of current systems that the person will be supplied with a series of figures or graphs, and will not easily be able to conclude whether or not the server's performance is adequate.
- Queuing Theory's main unit is the 'Erlang' which is a measure of the probability that a user will be able to use a system immediately when they try to access the system (an example of this is the probability that the telephone is engaged when you try to call your bank).
- Erlang C problem There is an extension to queuing theory that touches on the nature of the present invention which is sometimes known as the Erlang C problem. This relates to a probabilistic calculation of the length of time someone will be made to wait for a system with a given number of erlangs (and some other information). (An example of this is the situation when a person calls a bank and an automated voice tells him that no one can take his call at the moment but please hold and someone will be with you as soon as possible - the Erlang C problem is about probabalistically calculating an average wait time).
- Embodiments of the present invention tie into the Erlang C problem by determining what an acceptable wait would be by measuring the frustration and abandonment of real users in a similar system and predicting what the likely frustration and abandonment characteristics would be.
- a transactional server Once a transactional server has been deployed and is in use by a number of users, it is often desirable to monitor the performance of the server to ensure that it is capable of supporting the number of users wishing to access it. Monitoring will often be carried out regularly and frequently. Examples of software tools and services for monitoring performances of transactional servers are Uptime® and AppMonitor® , and companies such as Alertsite.com Inc, Spyn and Webmaster solutions offer transactional server monitoring services. Monitoring tools typically work by simulating one user making many thousands of uses of a system on an regular or continuous basis.
- An example of a benchmark often used in transaction server monitoring is the average download time of a page of information or file of html from a web site. This is sometimes called a page download time.
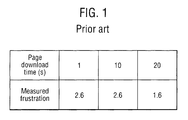
- This is interesting information, it has two important disadvantages. Firstly, it doesn't provide an idea of business impact. Secondly, a distribution of results with a large standard deviation cannot be distinguished from a distribution with a small standard deviation.
- Another benchmark often used in monitoring is the average availability of a live site. This is useful to know, but it doesn't give any information about the satisfaction of users using the site. For example, a site may be available but many users may be leaving due to frustration at the slow response times.
- a method for measuring frustration experienced by a user of a system comprises: (a) requiring the user to initiate the method; (b) after a delay time, requesting the user to provide a frustration number representative of the frustration caused by the delay time; and (c) recording the frustration number provided for that delay time such that it is relateable to that delay time, wherein the frustration number is stored in conjunction with the delay time.
- the delay times could suitably be pre-determined or random.
- the method can suitably be used in the context of web sites such that a web page is displayed to the user requesting the user to press a button or follow a link to initiate the method, and after a delay time a further web page is displayed to the user requesting the user to enter a frustration number representing the user's frustration caused by the delay time.
- a method for providing a series of weighting factors, which weighting factors relate to delay times experienced by users of a system comprises: (a) defining a series of delay time intervals; (b) calculating a single frustration number for each delay time interval, from recorded frustration numbers representative of frustration experienced by a user of a system due to delay times exhibited by the system; (c) optionally normalising each single frustration number to produce a single normalised frustration number for each delay time interval; (d) defining a weighting factor for each delay time interval as the single frustration number for that interval, or the single normalised frustration number for that interval.
- This method advantageously produces weighting factors that accurately represent user frustration for any given delay time interval based on data correlating delay times and frustration experienced by users.
- a method for determining a frustration coefficient (the Red Gate Frustration CoefficientTM) for a system prone to one or more delay times, which frustration coefficient is representative of the frustration caused to a user by the delay times in the system, which method comprises: (a) testing the system to determine one or more delay times to which the system is prone; (b) determining the number of delay times exhibited by the system within each one of a series of pre-defined delay time intervals; (c) for each delay time interval, multiplying the number of delay times exhibited by the system in that interval by a weighting factor associated with that interval, to produce a frustration coefficient for each interval; and (d) calculating a frustration coefficient for the system from the frustration coefficients of the delay time intervals.
- the Red Gate Frustration CoefficientTM the Red Gate Frustration Coefficient
- This method is preferably used in conjunction with transactional server tests or monitoring.
- the results of a measurement are combined according to the method with weighting factors to produce a frustration coefficient for a transactional server.
- the frustration coefficient is advantageously a single number that represents how frustrating a typical user would find the server to use. This frustration coefficient is very easily interpreted and indicates clearly the performance of the transactional server.
- a method for determining a frustration coefficient for a system prone to one or more delay times, which frustration coefficient is representative of the frustration caused to a user by the delay times in the system comprises: (a) recording a series of frustration numbers representative of frustration experienced by a user of a system due to delay times exhibited by the system; (b) providing a weighting factor for each of a series of pre-defined delay time intervals, based upon the recorded frustration numbers; (c) testing a system to determine one or more delay times to which the system is prone; and (d) determining a frustration coefficient for the system based upon the weighting factors and the number of delay times exhibited by the system in each of the pre-defined delay time intervals.
- the determined frustration coefficient takes into account any users who abandoned the system in that or any previous intervals by ascribing to them a frustration value representing a maximum level of frustration.
- a method for measuring an abandonment profile of a system comprises: (a) requiring the user to initiate the method; (b) after a delay time, requesting the user to provide an indication relevant to the delay time; and (c) recording the indication provided for that delay time such that the indication is relateable to the delay time, wherein if the user abandons the system during that delay time, the indication is an abandonment indication.
- a method for providing a series of ratios, which ratios relate to an abandonment profile of a system comprises: (a) defining a series of delay time intervals; and (b) calculating a ratio for each delay time interval, from pre-recorded indications representative of an abandonment profile of the system, which ratio is represented by the total number of abandonment indications recorded for each delay time interval to the total number of indications recorded for that interval.
- the method according to the sixth aspect of the invention allows abandonment to be taken into account if it occurred prior to a given delay time interval. This results in an accurate abandonment profile.
- a method for determining an abandonment coefficient (the Red Gate Abandonment CoefficientTM) for a system prone to one or more delay times, which abandonment coefficient is representative of the likelihood of a user abandoning the system comprises: (a) testing the system to determine one or more delay times to which the system is prone; (b) determining the number of delay times exhibited by the system within each one of a series of pre-defined delay time intervals; (c) for each delay time interval, multiplying the number of delay times exhibited by the system in that interval by an abandonment percentage associated with that interval, to produce an abandonment coefficient for each interval; and (d) calculating an abandonment coefficient for the system from the abandonment coefficientTM of the delay time intervals.
- the Red Gate Abandonment CoefficientTM the Red Gate Abandonment Coefficient
- a method for determining an abandonment coefficient for a system prone to one or more delay times, which abandonment coefficient is representative of the likelihood of a user abandoning the system during one of the delay times comprises: (a) recording a series of indications representative of an abandonment profile of the system; (b) providing an abandonment percentage for each of a series of pre-defined delay time intervals, based upon the recorded indications; (c) testing a system to determine one or more delay times to which the system is prone; and (d) determining an abandonment coefficient for the system based upon the abandonment percentages and the number of delay times exhibited by the system in each of the pre-defined delay time intervals.
- test data acquired in accordance with embodiments of the present invention can be used to enable efficient modification of a transactional server system so that the delay times associated with the system can be improved.
- the methods in accordance with embodiments of the present invention allow frustration data to be obtained in a way that does not prejudice a user before the user is required to submit a rating of his or her frustration.
- Minimal information is given to the user before the method is initiated to ensure that the user's evaluation of his frustration is not tainted by prior knowledge of the nature of the method.
- realistic and reliable information can be achieved correlating delay times with user frustration.
- This information can then be used in the improvement of systems.
- the causes of the delay times can be investigated, and the system can be modified to give delay times that correspond to satisfactory system performance. Modified versions of the system can be re-tested in accordance with embodiments of the invention so that the effects of modifications can be measured to simulate the system's performance as seen by simulated users.
- a survey is carried out on a web site.
- the survey is intended to produce a series of data correlating page download delay times with users' evaluations of the frustration caused to them by the delays.
- the survey is described below with reference to Figure 2.
- a user On following a link to a particular web page 1 of the web site, a user will be invited to take part in a survey.
- the page 1 contains a link 2.
- the user When the user follows the link 2, the user will experience a delay before a further web page 4 is displayed.
- the length of this delay is pre-determined by software controlling the web site. The delay is randomly generated and is known by the software. In the present embodiment, the delay time is between 0 and 30 seconds.
- the user will do one of three things: abandon the web site; click a "refresh" button in an attempt to speed up the download of the further page; or wait until the further page 4 appears without clicking any links or buttons.
- the time taken for the user to abandon after following the link 2 is preferably recorded by the software running the web site. It can reasonably be assumed that the user was very frustrated by the delay, and a frustration number representing a maximum level of frustration will be assigned to this user and recorded.
- a refresh indication can give useful information about the length of time a user is willing to wait before he or she starts to become sufficiently frustrated to click "refresh".
- a frustration number supplied by a person who has refreshed can be omitted from the collected test data, and a separate indication can instead be provided to indicate that the delay time experienced by that person was unacceptably long.
- Page 4 displays an invitation to the user to enter a number (5) on a scale of 1 to 10 representing the level of frustration caused by the delay, with 1 representing no frustration (i.e. a short time) and 10 representing a high level of frustration (i.e. a very long time, as perceived by the user). The user will then respond to the invitation, and the frustration number given will be recorded.
- the frustration number (5) provided by the user may be stored in a frustration database 3 in such a way that it can be related to the pre-determined delay time.
- the information recorded is typically stored in the frustration database 3 in such a way that the frustration number can be related to the length of the pre-determined delay time, and an indication that the user abandoned the web site can be related to the delay time.
- the frustration number 5 is stored in the frustration database 3 in such a way that it can be related to the time before the refresh button was clicked (that is, the time taken for the page 4 to download).
- step 10 in Figure 3 After the process illustrated in Figure 2 has been repeated a number of times (shown as step 10 in Figure 3) using a number of delay times and preferably a number of users, the data stored in the frustration database 3 is then analysed (step 11 in Figure 3).
- a suitable technique for analysing the results of the research 10 is as follows.
- the pre-determined delay times between 0 and 30 seconds are split into a series of intervals.
- the intervals selected are not especially limited and should in general be determined according to the range of delays typically found in the type of system under investigation. Generally the time delays represented in the highest interval should be comparable with the maximum delay that the user was subjected to after following link 2.
- the intervals are preferably: 0-0.5 seconds; 0.5-1 second; 1-5 seconds; 5-10 seconds; 10-15 seconds and >15 seconds (shown as 20 in Figure 4) since these intervals are particularly appropriate when testing a web site, since delays experienced by web users are generally of comparable lengths to these intervals.
- the frustration numbers related to delay times within that interval are averaged to produce a single frustration number for the interval.
- this will produce six single frustration numbers, each one associated with a delay time interval.
- an algorithm or formula could be derived and used to determine single frustration numbers, or the frustration numbers could be fitted to a curve of frustration number against delay time and this could be used to determine the single frustration numbers.
- the single frustration numbers are then optionally normalised.
- a preferred way of normalising the single frustration numbers is multiplying by 10 and rounding to the nearest integer. This produces a series of six weighting factors (12 in Figure 4) between 0 and 100, each one associated with a delay time interval 20.
- abandonment coefficientsTM are calculated. For each defined delay time interval 20, the number of users abandoning the web site within that time interval is calculated as a proportion of the total number of delay times falling within that interval. In this example, this produces six abandonment ratios. The abandonment ratios are then optionally normalised. In a preferred embodiment, the ratios are expressed as percentages 13 which represent a likelihood for a given time interval that a user will abandon a web site if a page has a download time in that interval.
- the abandonment coefficientsTM and weighting factors for frustration obtained as described above can be applied to results of standard load tests 14. In this manner, the figures 15 and 16 can be derived to describe the performance of a web site in a meaningful way.
- the number 14 in each interval 20 can now be multiplied by the weighting factors 12 calculated in step 11 of Figure 3.
- the weighting factors take into account the relative frustration felt by users made to wait different times for pages to load.
- a series of coefficients 24 are derived.
- the sum of these coefficients represents the total frustration experienced by all simulated users of the transactional server during the load test.
- the total figure is 3115.
- This figure is translated into a frustration coefficient 15 on a scale between 0 and 100 by dividing it by the total number of simulated page downloads during the test, in this example 100.
- the frustration coefficient for this load test is therefore 31 (rounded to the nearest integer).
- a coefficient can be produced from the basic load test results to represent how likely an average user would be to abandon the server.
- the results 14 are multiplied by the abandonment percentages 13 to produce a series of figures 25. These figures 25 are then summed to give a total of 8.75. This represents how likely a user would be to abandon the transactional server if it performed as it did during the load test. The total can be rounded to the nearest integer.
- the final abandonment coefficient 15 is 9%, that is, roughly one in ten users would abandon the server.
- a person analysing the results of the load test can see at a glance how well the transactional server performed during the load test.
- a frustration coefficient of 31 represents a fairly poor performance. Zero would mean that every user was perfectly satisfied with the server and was never subjected to delays, and 100 would mean an unacceptable performance with users being so frustrated that they will abandon the system.
- the person analysing the results would probably wish to refine the transactional server's performance in order to achieve an improved frustration coefficient 15 and abandonment coefficient 16. After making various adaptations to the server, the person may wish to carry out a further load test. Simple software could then produce a further frustration coefficient 15 and abandonment coefficient 16 to inform the person clearly as to whether the adaptations were effective in improving the server's performance.
- A(t) is a polynomial function of t.
- F c (t) (1-A(t)) ⁇ F(t) + A(t) ⁇ F max , where F max is the maximum assignable level of frustration (e.g. 10 in the embodiment shown in Fig. 2).
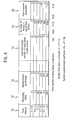
- FIG 5 shows the results obtained when four web sites were tested and then analysed in accordance with the present invention.
- Web sites A, B, C and D have 6, 9, 5 and 13 pages respectively. Download times were measured for each of these pages and are shown in the tables of Figure 5. The results were then combined with the weighting factors calculated according to the present invention. A frustration coefficient was determined for each web site by the steps shown in the tables. It should be noted that although in this example web page download times have been used, the present invention is equally applicable to web services having delay times due to requests being serviced.
- Web site C has only 5 pages, but the download times were fairly long and therefore a high frustration coefficient (60) was obtained.
- Web site D performed well during the testing, with only 3 of the 13 web pages taking longer than a second to download. The frustration coefficient of this web site is 8, indicating that potential users of the web site would not experience lesser frustration in using the web site.
Landscapes
- Engineering & Computer Science (AREA)
- Theoretical Computer Science (AREA)
- General Engineering & Computer Science (AREA)
- Quality & Reliability (AREA)
- Physics & Mathematics (AREA)
- General Physics & Mathematics (AREA)
- Computer Hardware Design (AREA)
- Life Sciences & Earth Sciences (AREA)
- Bioinformatics & Cheminformatics (AREA)
- Bioinformatics & Computational Biology (AREA)
- Evolutionary Biology (AREA)
- Debugging And Monitoring (AREA)
- Data Exchanges In Wide-Area Networks (AREA)
Applications Claiming Priority (2)
| Application Number | Priority Date | Filing Date | Title |
|---|---|---|---|
| GB0329848A GB2409542A (en) | 2003-12-23 | 2003-12-23 | Assessing user frustration with a load-tested system |
| GB0329848 | 2003-12-23 |
Publications (1)
| Publication Number | Publication Date |
|---|---|
| EP1548596A1 true EP1548596A1 (fr) | 2005-06-29 |
Family
ID=30776388
Family Applications (1)
| Application Number | Title | Priority Date | Filing Date |
|---|---|---|---|
| EP04257952A Withdrawn EP1548596A1 (fr) | 2003-12-23 | 2004-12-20 | Méthode pour le test de la charge d'un système de transactions d'ordinateur |
Country Status (3)
| Country | Link |
|---|---|
| US (1) | US20050135267A1 (fr) |
| EP (1) | EP1548596A1 (fr) |
| GB (1) | GB2409542A (fr) |
Cited By (2)
| Publication number | Priority date | Publication date | Assignee | Title |
|---|---|---|---|---|
| WO2014100130A1 (fr) | 2012-12-19 | 2014-06-26 | Amazon Technologies, Inc. | Analyses d'interactivité de ressources internet sur la base d'événements de rechargement |
| WO2016094009A1 (fr) * | 2014-12-12 | 2016-06-16 | Qualcomm Incorporated | Caractérisation d'application pour apprentissage automatique sur dispositifs à noyaux hétérogènes |
Families Citing this family (7)
| Publication number | Priority date | Publication date | Assignee | Title |
|---|---|---|---|---|
| US8196052B2 (en) * | 2006-06-30 | 2012-06-05 | International Business Machines Corporation | System and method to display a web page as scheduled by a user |
| US7516042B2 (en) * | 2007-01-11 | 2009-04-07 | Microsoft Corporation | Load test load modeling based on rates of user operations |
| US20100082516A1 (en) * | 2008-09-29 | 2010-04-01 | Microsoft Corporation | Modifying a System in Response to Indications of User Frustration |
| US9201752B2 (en) * | 2010-01-19 | 2015-12-01 | Ca, Inc. | System and method for correlating empirical data with user experience |
| US10521090B2 (en) | 2017-07-13 | 2019-12-31 | International Business Machines Corporation | Dashboard generation based on user interaction |
| JPWO2021166252A1 (fr) * | 2020-02-21 | 2021-08-26 | ||
| GB2640145A (en) * | 2024-04-03 | 2025-10-15 | Ibm | Defining recovery performance goals for applications |
Citations (4)
| Publication number | Priority date | Publication date | Assignee | Title |
|---|---|---|---|---|
| US5884244A (en) * | 1997-10-21 | 1999-03-16 | Hewlett-Packard Company | Method for measuring quality of service in a computer system |
| WO2000026836A2 (fr) * | 1998-11-02 | 2000-05-11 | Vividence Corporation | Procede et appareil de bureau de recherche offrant tous les services et de centre de test |
| WO2000075814A1 (fr) * | 1999-06-03 | 2000-12-14 | Keylime Software, Inc. | Systeme et methode de surveillance d'interaction utilisateur avec des pages web |
| WO2003067376A2 (fr) * | 2002-02-05 | 2003-08-14 | Comscore Networks, Inc. | Systemes et procedes d'identification d'utilisateurs, transmission d'informations demographiques sur les utilisateurs et collecte de donnees d'utilisation |
Family Cites Families (1)
| Publication number | Priority date | Publication date | Assignee | Title |
|---|---|---|---|---|
| US7062557B1 (en) * | 2000-07-10 | 2006-06-13 | Hewlett-Packard Development Company, L.P. | Web server request classification system that classifies requests based on user's behaviors and expectations |
-
2003
- 2003-12-23 GB GB0329848A patent/GB2409542A/en not_active Withdrawn
-
2004
- 2004-12-20 EP EP04257952A patent/EP1548596A1/fr not_active Withdrawn
- 2004-12-21 US US11/018,005 patent/US20050135267A1/en not_active Abandoned
Patent Citations (4)
| Publication number | Priority date | Publication date | Assignee | Title |
|---|---|---|---|---|
| US5884244A (en) * | 1997-10-21 | 1999-03-16 | Hewlett-Packard Company | Method for measuring quality of service in a computer system |
| WO2000026836A2 (fr) * | 1998-11-02 | 2000-05-11 | Vividence Corporation | Procede et appareil de bureau de recherche offrant tous les services et de centre de test |
| WO2000075814A1 (fr) * | 1999-06-03 | 2000-12-14 | Keylime Software, Inc. | Systeme et methode de surveillance d'interaction utilisateur avec des pages web |
| WO2003067376A2 (fr) * | 2002-02-05 | 2003-08-14 | Comscore Networks, Inc. | Systemes et procedes d'identification d'utilisateurs, transmission d'informations demographiques sur les utilisateurs et collecte de donnees d'utilisation |
Non-Patent Citations (1)
| Title |
|---|
| P. SELVIDGE: "how long is too long to wait for a website to load?", USABILITY NEWS, no. 1.2, 1999, pages 1 - 4, XP002321615, Retrieved from the Internet <URL:http://psychology.wichita.edu/surl/usabilitynews/1s/time-delay.htm> [retrieved on 20050315] * |
Cited By (7)
| Publication number | Priority date | Publication date | Assignee | Title |
|---|---|---|---|---|
| WO2014100130A1 (fr) | 2012-12-19 | 2014-06-26 | Amazon Technologies, Inc. | Analyses d'interactivité de ressources internet sur la base d'événements de rechargement |
| CN105144137A (zh) * | 2012-12-19 | 2015-12-09 | 亚马逊科技公司 | 基于重新加载事件对网络资源进行的交互性分析 |
| EP2936337A4 (fr) * | 2012-12-19 | 2017-02-22 | Amazon Technologies, Inc. | Analyses d'interactivité de ressources internet sur la base d'événements de rechargement |
| US9628349B2 (en) | 2012-12-19 | 2017-04-18 | Amazon Technologies, Inc. | Interactivity analyses of web resources based on reload events |
| CN105144137B (zh) * | 2012-12-19 | 2018-05-29 | 亚马逊科技公司 | 基于重新加载事件对网络资源进行的交互性分析 |
| WO2016094009A1 (fr) * | 2014-12-12 | 2016-06-16 | Qualcomm Incorporated | Caractérisation d'application pour apprentissage automatique sur dispositifs à noyaux hétérogènes |
| US10049327B2 (en) | 2014-12-12 | 2018-08-14 | Qualcomm Incorporated | Application characterization for machine learning on heterogeneous core devices |
Also Published As
| Publication number | Publication date |
|---|---|
| GB2409542A (en) | 2005-06-29 |
| US20050135267A1 (en) | 2005-06-23 |
| GB0329848D0 (en) | 2004-01-28 |
Similar Documents
| Publication | Publication Date | Title |
|---|---|---|
| US7912898B2 (en) | System and method for measuring reactions to product packaging, advertising, or product features over a computer-based network | |
| CN104993946B (zh) | 灰度发布的评估方法、装置和系统 | |
| US20050228875A1 (en) | System for estimating processing requirements | |
| CN107852338B (zh) | 检测和报警特征斜升期间的性能下降 | |
| US10037393B1 (en) | Consumer performance index scoring for websites and web-based applications | |
| US20160189176A1 (en) | Systems and methods for response rate determination and offer selection | |
| CN103412918A (zh) | 一种基于服务质量和声誉的服务信任度评估方法 | |
| US11132717B2 (en) | Synthetic user profiles and monitoring online advertisements | |
| Rempel | Defining standards for web page performance in business applications | |
| US11704705B2 (en) | Systems and methods for an intelligent sourcing engine for study participants | |
| US20220414686A1 (en) | Automated Testing of Forms | |
| EP1548596A1 (fr) | Méthode pour le test de la charge d'un système de transactions d'ordinateur | |
| CN112801458B (zh) | 视频会议应用评价方法、装置、设备及存储介质 | |
| Lalanne et al. | Quality of experience as a selection criterion for web services | |
| CN109034867A (zh) | 点击流量检测方法、装置及存储介质 | |
| US6763321B2 (en) | Method and apparatus to facilitate measurement of quality-of-service performance of a network server | |
| CN112711524B (zh) | 基于ab测试的数据测试方法、装置及计算机存储介质 | |
| Huynh et al. | Empirical observations on the session timeout threshold | |
| Jahromi et al. | Establishing waiting time thresholds in interactive web mapping applications for network QoE management | |
| US20170221091A1 (en) | Method and system for performing online advertisement monitoring | |
| JP4843379B2 (ja) | 計算機システムの開発プログラム | |
| US20120303443A1 (en) | Ad impact testing | |
| CN113902589A (zh) | 目标服务策略的测试方法、介质、装置和计算设备 | |
| JP5706980B2 (ja) | 情報処理装置、情報処理方法および情報処理プログラム | |
| Schimanski et al. | Development of a Web Based Framework to Objectively Compare and Evaluate Software |
Legal Events
| Date | Code | Title | Description |
|---|---|---|---|
| PUAI | Public reference made under article 153(3) epc to a published international application that has entered the european phase |
Free format text: ORIGINAL CODE: 0009012 |
|
| 17P | Request for examination filed |
Effective date: 20050113 |
|
| AK | Designated contracting states |
Kind code of ref document: A1 Designated state(s): AT BE BG CH CY CZ DE DK EE ES FI FR GB GR HU IE IS IT LI LT LU MC NL PL PT RO SE SI SK TR |
|
| AX | Request for extension of the european patent |
Extension state: AL BA HR LV MK YU |
|
| STAA | Information on the status of an ep patent application or granted ep patent |
Free format text: STATUS: THE APPLICATION HAS BEEN WITHDRAWN |
|
| 18W | Application withdrawn |
Effective date: 20060124 |
|
| AKX | Designation fees paid |
Designated state(s): AT BE BG CH CY CZ DE DK EE ES FI FR GB GR HU IE IS IT LI LT LU MC NL PL PT RO SE SI SK TR |