EP1624074A1 - Methoden und Marker zür Nachweiss pränataler chromosomaler Abnormalitäten - Google Patents
Methoden und Marker zür Nachweiss pränataler chromosomaler Abnormalitäten Download PDFInfo
- Publication number
- EP1624074A1 EP1624074A1 EP04292013A EP04292013A EP1624074A1 EP 1624074 A1 EP1624074 A1 EP 1624074A1 EP 04292013 A EP04292013 A EP 04292013A EP 04292013 A EP04292013 A EP 04292013A EP 1624074 A1 EP1624074 A1 EP 1624074A1
- Authority
- EP
- European Patent Office
- Prior art keywords
- markers
- marker
- syndrome
- mass
- chromosomal
- Prior art date
- Legal status (The legal status is an assumption and is not a legal conclusion. Google has not performed a legal analysis and makes no representation as to the accuracy of the status listed.)
- Withdrawn
Links
- 238000000034 method Methods 0.000 title claims abstract description 57
- 208000031404 Chromosome Aberrations Diseases 0.000 title claims description 18
- 206010008805 Chromosomal abnormalities Diseases 0.000 title claims description 10
- 201000010374 Down Syndrome Diseases 0.000 claims abstract description 63
- 239000003550 marker Substances 0.000 claims abstract description 35
- 206010044688 Trisomy 21 Diseases 0.000 claims abstract description 19
- 238000004949 mass spectrometry Methods 0.000 claims abstract description 11
- 239000012472 biological sample Substances 0.000 claims abstract description 10
- 238000000338 in vitro Methods 0.000 claims abstract description 4
- 102000004169 proteins and genes Human genes 0.000 claims description 53
- 108090000623 proteins and genes Proteins 0.000 claims description 53
- 239000000523 sample Substances 0.000 claims description 26
- 238000001514 detection method Methods 0.000 claims description 23
- 206010053884 trisomy 18 Diseases 0.000 claims description 23
- 125000000129 anionic group Chemical group 0.000 claims description 22
- 238000000746 purification Methods 0.000 claims description 21
- 238000003556 assay Methods 0.000 claims description 20
- 230000035935 pregnancy Effects 0.000 claims description 19
- 210000003754 fetus Anatomy 0.000 claims description 17
- 108010026331 alpha-Fetoproteins Proteins 0.000 claims description 16
- 230000002209 hydrophobic effect Effects 0.000 claims description 14
- 238000012216 screening Methods 0.000 claims description 14
- 108091023037 Aptamer Proteins 0.000 claims description 10
- 102000000541 Defensins Human genes 0.000 claims description 10
- 108010002069 Defensins Proteins 0.000 claims description 10
- 230000005856 abnormality Effects 0.000 claims description 10
- 108010088751 Albumins Proteins 0.000 claims description 9
- 102000009027 Albumins Human genes 0.000 claims description 9
- 230000008569 process Effects 0.000 claims description 9
- 208000007159 Trisomy 18 Syndrome Diseases 0.000 claims description 7
- 238000005194 fractionation Methods 0.000 claims description 7
- 210000000440 neutrophil Anatomy 0.000 claims description 7
- 201000006360 Edwards syndrome Diseases 0.000 claims description 6
- PROQIPRRNZUXQM-ZXXIGWHRSA-N estriol Chemical compound OC1=CC=C2[C@H]3CC[C@](C)([C@H]([C@H](O)C4)O)[C@@H]4[C@@H]3CCC2=C1 PROQIPRRNZUXQM-ZXXIGWHRSA-N 0.000 claims description 6
- 230000002068 genetic effect Effects 0.000 claims description 5
- 238000003793 prenatal diagnosis Methods 0.000 claims description 5
- PROQIPRRNZUXQM-UHFFFAOYSA-N (16alpha,17betaOH)-Estra-1,3,5(10)-triene-3,16,17-triol Natural products OC1=CC=C2C3CCC(C)(C(C(O)C4)O)C4C3CCC2=C1 PROQIPRRNZUXQM-UHFFFAOYSA-N 0.000 claims description 4
- 101100451306 Caenorhabditis elegans hnd-1 gene Proteins 0.000 claims description 4
- 102000014914 Carrier Proteins Human genes 0.000 claims description 4
- 108010078791 Carrier Proteins Proteins 0.000 claims description 4
- 230000002759 chromosomal effect Effects 0.000 claims description 4
- 229960001348 estriol Drugs 0.000 claims description 4
- 229940088597 hormone Drugs 0.000 claims description 4
- 239000005556 hormone Substances 0.000 claims description 4
- 201000009928 Patau syndrome Diseases 0.000 claims description 3
- 206010044686 Trisomy 13 Diseases 0.000 claims description 3
- 208000006284 Trisomy 13 Syndrome Diseases 0.000 claims description 3
- 208000026928 Turner syndrome Diseases 0.000 claims description 3
- 201000003738 orofaciodigital syndrome VIII Diseases 0.000 claims description 3
- 102000004506 Blood Proteins Human genes 0.000 claims description 2
- 108010017384 Blood Proteins Proteins 0.000 claims description 2
- 208000001914 Fragile X syndrome Diseases 0.000 claims description 2
- 208000017924 Klinefelter Syndrome Diseases 0.000 claims description 2
- 208000036830 Normal foetus Diseases 0.000 claims description 2
- 229960004407 chorionic gonadotrophin Drugs 0.000 claims description 2
- 208000021596 pentasomy X Diseases 0.000 claims description 2
- 102100023635 Alpha-fetoprotein Human genes 0.000 claims 2
- 108010080511 serum sodium transport inhibitor Proteins 0.000 claims 1
- 208000011580 syndromic disease Diseases 0.000 claims 1
- 210000002966 serum Anatomy 0.000 abstract description 19
- 210000004369 blood Anatomy 0.000 abstract description 6
- 239000008280 blood Substances 0.000 abstract description 6
- 210000002381 plasma Anatomy 0.000 abstract description 5
- 210000000349 chromosome Anatomy 0.000 abstract description 4
- 210000002700 urine Anatomy 0.000 abstract description 2
- 239000012530 fluid Substances 0.000 abstract 1
- 235000018102 proteins Nutrition 0.000 description 50
- 238000001228 spectrum Methods 0.000 description 50
- 239000012071 phase Substances 0.000 description 24
- 238000000926 separation method Methods 0.000 description 22
- 238000005516 engineering process Methods 0.000 description 21
- 230000003595 spectral effect Effects 0.000 description 18
- 239000000499 gel Substances 0.000 description 16
- 102000013529 alpha-Fetoproteins Human genes 0.000 description 14
- 238000010606 normalization Methods 0.000 description 14
- 238000012360 testing method Methods 0.000 description 14
- 238000004458 analytical method Methods 0.000 description 12
- 241000283690 Bos taurus Species 0.000 description 11
- 230000003993 interaction Effects 0.000 description 11
- 230000001605 fetal effect Effects 0.000 description 10
- 238000011534 incubation Methods 0.000 description 10
- 230000035945 sensitivity Effects 0.000 description 10
- 238000013459 approach Methods 0.000 description 9
- 239000000872 buffer Substances 0.000 description 9
- 230000008030 elimination Effects 0.000 description 9
- 238000003379 elimination reaction Methods 0.000 description 9
- 108090000765 processed proteins & peptides Proteins 0.000 description 9
- 101001011741 Bos taurus Insulin Proteins 0.000 description 8
- IXIBAKNTJSCKJM-BUBXBXGNSA-N bovine insulin Chemical compound C([C@@H](C(=O)N[C@@H](CC(C)C)C(=O)N[C@H]1CSSC[C@H]2C(=O)N[C@@H](C)C(=O)N[C@@H](CO)C(=O)N[C@H](C(=O)N[C@H](C(N[C@@H](CO)C(=O)N[C@@H](CC(C)C)C(=O)N[C@@H](CC=3C=CC(O)=CC=3)C(=O)N[C@@H](CCC(N)=O)C(=O)N[C@@H](CC(C)C)C(=O)N[C@@H](CCC(O)=O)C(=O)N[C@@H](CC(N)=O)C(=O)N[C@@H](CC=3C=CC(O)=CC=3)C(=O)N[C@@H](CSSC[C@H](NC(=O)[C@H](C(C)C)NC(=O)[C@H](CC(C)C)NC(=O)[C@H](CC=3C=CC(O)=CC=3)NC(=O)[C@H](CC(C)C)NC(=O)[C@H](C)NC(=O)[C@H](CCC(O)=O)NC(=O)[C@H](C(C)C)NC(=O)[C@H](CC(C)C)NC(=O)[C@H](CC=3NC=NC=3)NC(=O)[C@H](CO)NC(=O)CNC1=O)C(=O)NCC(=O)N[C@@H](CCC(O)=O)C(=O)N[C@@H](CCCNC(N)=N)C(=O)NCC(=O)N[C@@H](CC=1C=CC=CC=1)C(=O)N[C@@H](CC=1C=CC=CC=1)C(=O)N[C@@H](CC=1C=CC(O)=CC=1)C(=O)N[C@@H]([C@@H](C)O)C(=O)N1[C@@H](CCC1)C(=O)N[C@@H](CCCCN)C(=O)N[C@@H](C)C(O)=O)C(=O)N[C@@H](CC(N)=O)C(O)=O)=O)CSSC[C@@H](C(N2)=O)NC(=O)[C@H](CCC(N)=O)NC(=O)[C@H](CCC(O)=O)NC(=O)[C@H](C(C)C)NC(=O)[C@@H](NC(=O)CN)[C@@H](C)CC)C(C)C)NC(=O)[C@H](CCC(N)=O)NC(=O)[C@H](CC(N)=O)NC(=O)[C@@H](NC(=O)[C@@H](N)CC=1C=CC=CC=1)C(C)C)C1=CN=CN1 IXIBAKNTJSCKJM-BUBXBXGNSA-N 0.000 description 8
- NOESYZHRGYRDHS-UHFFFAOYSA-N insulin Chemical compound N1C(=O)C(NC(=O)C(CCC(N)=O)NC(=O)C(CCC(O)=O)NC(=O)C(C(C)C)NC(=O)C(NC(=O)CN)C(C)CC)CSSCC(C(NC(CO)C(=O)NC(CC(C)C)C(=O)NC(CC=2C=CC(O)=CC=2)C(=O)NC(CCC(N)=O)C(=O)NC(CC(C)C)C(=O)NC(CCC(O)=O)C(=O)NC(CC(N)=O)C(=O)NC(CC=2C=CC(O)=CC=2)C(=O)NC(CSSCC(NC(=O)C(C(C)C)NC(=O)C(CC(C)C)NC(=O)C(CC=2C=CC(O)=CC=2)NC(=O)C(CC(C)C)NC(=O)C(C)NC(=O)C(CCC(O)=O)NC(=O)C(C(C)C)NC(=O)C(CC(C)C)NC(=O)C(CC=2NC=NC=2)NC(=O)C(CO)NC(=O)CNC2=O)C(=O)NCC(=O)NC(CCC(O)=O)C(=O)NC(CCCNC(N)=N)C(=O)NCC(=O)NC(CC=3C=CC=CC=3)C(=O)NC(CC=3C=CC=CC=3)C(=O)NC(CC=3C=CC(O)=CC=3)C(=O)NC(C(C)O)C(=O)N3C(CCC3)C(=O)NC(CCCCN)C(=O)NC(C)C(O)=O)C(=O)NC(CC(N)=O)C(O)=O)=O)NC(=O)C(C(C)CC)NC(=O)C(CO)NC(=O)C(C(C)O)NC(=O)C1CSSCC2NC(=O)C(CC(C)C)NC(=O)C(NC(=O)C(CCC(N)=O)NC(=O)C(CC(N)=O)NC(=O)C(NC(=O)C(N)CC=1C=CC=CC=1)C(C)C)CC1=CN=CN1 NOESYZHRGYRDHS-UHFFFAOYSA-N 0.000 description 8
- 230000008774 maternal effect Effects 0.000 description 8
- 102000004196 processed proteins & peptides Human genes 0.000 description 8
- ONIBWKKTOPOVIA-UHFFFAOYSA-N Proline Natural products OC(=O)C1CCCN1 ONIBWKKTOPOVIA-UHFFFAOYSA-N 0.000 description 7
- VYPSYNLAJGMNEJ-UHFFFAOYSA-N Silicium dioxide Chemical compound O=[Si]=O VYPSYNLAJGMNEJ-UHFFFAOYSA-N 0.000 description 7
- 238000003018 immunoassay Methods 0.000 description 7
- 238000011160 research Methods 0.000 description 7
- 102000018832 Cytochromes Human genes 0.000 description 6
- 108010052832 Cytochromes Proteins 0.000 description 6
- 150000001413 amino acids Chemical class 0.000 description 6
- 238000002669 amniocentesis Methods 0.000 description 6
- 238000002474 experimental method Methods 0.000 description 6
- 239000011159 matrix material Substances 0.000 description 6
- 239000006228 supernatant Substances 0.000 description 6
- 238000002604 ultrasonography Methods 0.000 description 6
- NZNMSOFKMUBTKW-UHFFFAOYSA-N Cyclohexanecarboxylic acid Natural products OC(=O)C1CCCCC1 NZNMSOFKMUBTKW-UHFFFAOYSA-N 0.000 description 5
- 241000283073 Equus caballus Species 0.000 description 5
- 235000001014 amino acid Nutrition 0.000 description 5
- 239000000090 biomarker Substances 0.000 description 5
- 239000003153 chemical reaction reagent Substances 0.000 description 5
- 150000001875 compounds Chemical class 0.000 description 5
- 239000003446 ligand Substances 0.000 description 5
- 238000002360 preparation method Methods 0.000 description 5
- 239000000126 substance Substances 0.000 description 5
- 108091003079 Bovine Serum Albumin Proteins 0.000 description 4
- 238000009007 Diagnostic Kit Methods 0.000 description 4
- 108090001061 Insulin Proteins 0.000 description 4
- 102000004877 Insulin Human genes 0.000 description 4
- 102000008192 Lactoglobulins Human genes 0.000 description 4
- 208000037280 Trisomy Diseases 0.000 description 4
- AFVLVVWMAFSXCK-VMPITWQZSA-N alpha-cyano-4-hydroxycinnamic acid Chemical compound OC(=O)C(\C#N)=C\C1=CC=C(O)C=C1 AFVLVVWMAFSXCK-VMPITWQZSA-N 0.000 description 4
- 125000002091 cationic group Chemical group 0.000 description 4
- 238000004587 chromatography analysis Methods 0.000 description 4
- 230000000875 corresponding effect Effects 0.000 description 4
- 238000012217 deletion Methods 0.000 description 4
- 230000037430 deletion Effects 0.000 description 4
- 201000010099 disease Diseases 0.000 description 4
- 208000037265 diseases, disorders, signs and symptoms Diseases 0.000 description 4
- 238000009826 distribution Methods 0.000 description 4
- 230000036571 hydration Effects 0.000 description 4
- 238000006703 hydration reaction Methods 0.000 description 4
- 229940125396 insulin Drugs 0.000 description 4
- 238000004811 liquid chromatography Methods 0.000 description 4
- 238000000816 matrix-assisted laser desorption--ionisation Methods 0.000 description 4
- 239000012528 membrane Substances 0.000 description 4
- 238000000513 principal component analysis Methods 0.000 description 4
- XLYOFNOQVPJJNP-UHFFFAOYSA-N water Chemical compound O XLYOFNOQVPJJNP-UHFFFAOYSA-N 0.000 description 4
- 108020004414 DNA Proteins 0.000 description 3
- 102000004190 Enzymes Human genes 0.000 description 3
- 108090000790 Enzymes Proteins 0.000 description 3
- GYHNNYVSQQEPJS-UHFFFAOYSA-N Gallium Chemical compound [Ga] GYHNNYVSQQEPJS-UHFFFAOYSA-N 0.000 description 3
- PMMYEEVYMWASQN-DMTCNVIQSA-N Hydroxyproline Chemical compound O[C@H]1CN[C@H](C(O)=O)C1 PMMYEEVYMWASQN-DMTCNVIQSA-N 0.000 description 3
- 108010060630 Lactoglobulins Proteins 0.000 description 3
- 102000036675 Myoglobin Human genes 0.000 description 3
- 108010062374 Myoglobin Proteins 0.000 description 3
- 230000003321 amplification Effects 0.000 description 3
- 239000011324 bead Substances 0.000 description 3
- 229940098773 bovine serum albumin Drugs 0.000 description 3
- 238000005251 capillar electrophoresis Methods 0.000 description 3
- 150000007942 carboxylates Chemical group 0.000 description 3
- 230000002596 correlated effect Effects 0.000 description 3
- PMMYEEVYMWASQN-UHFFFAOYSA-N dl-hydroxyproline Natural products OC1C[NH2+]C(C([O-])=O)C1 PMMYEEVYMWASQN-UHFFFAOYSA-N 0.000 description 3
- 238000010828 elution Methods 0.000 description 3
- 210000000540 fraction c Anatomy 0.000 description 3
- 229910052733 gallium Inorganic materials 0.000 description 3
- 230000007062 hydrolysis Effects 0.000 description 3
- 238000006460 hydrolysis reaction Methods 0.000 description 3
- 229960002591 hydroxyproline Drugs 0.000 description 3
- 230000036046 immunoreaction Effects 0.000 description 3
- 150000002500 ions Chemical class 0.000 description 3
- 239000000463 material Substances 0.000 description 3
- 238000005259 measurement Methods 0.000 description 3
- 238000003199 nucleic acid amplification method Methods 0.000 description 3
- 230000026731 phosphorylation Effects 0.000 description 3
- 238000006366 phosphorylation reaction Methods 0.000 description 3
- 238000009609 prenatal screening Methods 0.000 description 3
- 239000000047 product Substances 0.000 description 3
- 230000002441 reversible effect Effects 0.000 description 3
- 239000000377 silicon dioxide Substances 0.000 description 3
- 239000000243 solution Substances 0.000 description 3
- 238000000672 surface-enhanced laser desorption--ionisation Methods 0.000 description 3
- 238000003786 synthesis reaction Methods 0.000 description 3
- 238000004885 tandem mass spectrometry Methods 0.000 description 3
- 235000008521 threonine Nutrition 0.000 description 3
- FGMPLJWBKKVCDB-UHFFFAOYSA-N trans-L-hydroxy-proline Natural products ON1CCCC1C(O)=O FGMPLJWBKKVCDB-UHFFFAOYSA-N 0.000 description 3
- 239000011534 wash buffer Substances 0.000 description 3
- YBJHBAHKTGYVGT-ZKWXMUAHSA-N (+)-Biotin Chemical compound N1C(=O)N[C@@H]2[C@H](CCCCC(=O)O)SC[C@@H]21 YBJHBAHKTGYVGT-ZKWXMUAHSA-N 0.000 description 2
- 102100026189 Beta-galactosidase Human genes 0.000 description 2
- 102000011022 Chorionic Gonadotropin Human genes 0.000 description 2
- 108010062540 Chorionic Gonadotropin Proteins 0.000 description 2
- 241000588724 Escherichia coli Species 0.000 description 2
- 102100031181 Glyceraldehyde-3-phosphate dehydrogenase Human genes 0.000 description 2
- 102000007625 Hirudins Human genes 0.000 description 2
- 108010007267 Hirudins Proteins 0.000 description 2
- 101000976075 Homo sapiens Insulin Proteins 0.000 description 2
- 108010001336 Horseradish Peroxidase Proteins 0.000 description 2
- 108060003951 Immunoglobulin Proteins 0.000 description 2
- QNAYBMKLOCPYGJ-REOHCLBHSA-N L-alanine Chemical compound C[C@H](N)C(O)=O QNAYBMKLOCPYGJ-REOHCLBHSA-N 0.000 description 2
- CKLJMWTZIZZHCS-REOHCLBHSA-N L-aspartic acid Chemical compound OC(=O)[C@@H](N)CC(O)=O CKLJMWTZIZZHCS-REOHCLBHSA-N 0.000 description 2
- KZSNJWFQEVHDMF-BYPYZUCNSA-N L-valine Chemical compound CC(C)[C@H](N)C(O)=O KZSNJWFQEVHDMF-BYPYZUCNSA-N 0.000 description 2
- 241000209499 Lemna Species 0.000 description 2
- 101800000287 Neutrophil defensin 2 Proteins 0.000 description 2
- 241000283973 Oryctolagus cuniculus Species 0.000 description 2
- AYFVYJQAPQTCCC-UHFFFAOYSA-N Threonine Natural products CC(O)C(N)C(O)=O AYFVYJQAPQTCCC-UHFFFAOYSA-N 0.000 description 2
- 239000004473 Threonine Substances 0.000 description 2
- KZSNJWFQEVHDMF-UHFFFAOYSA-N Valine Natural products CC(C)C(N)C(O)=O KZSNJWFQEVHDMF-UHFFFAOYSA-N 0.000 description 2
- 238000004847 absorption spectroscopy Methods 0.000 description 2
- 230000009471 action Effects 0.000 description 2
- 235000004279 alanine Nutrition 0.000 description 2
- 125000003277 amino group Chemical group 0.000 description 2
- 238000005571 anion exchange chromatography Methods 0.000 description 2
- 239000000427 antigen Substances 0.000 description 2
- 108091007433 antigens Proteins 0.000 description 2
- 102000036639 antigens Human genes 0.000 description 2
- KBZOIRJILGZLEJ-LGYYRGKSSA-N argipressin Chemical compound C([C@H]1C(=O)N[C@@H](CCC(N)=O)C(=O)N[C@@H](CC(N)=O)C(=O)N[C@@H](CSSC[C@@H](C(N[C@@H](CC=2C=CC(O)=CC=2)C(=O)N1)=O)N)C(=O)N1[C@@H](CCC1)C(=O)N[C@@H](CCCN=C(N)N)C(=O)NCC(N)=O)C1=CC=CC=C1 KBZOIRJILGZLEJ-LGYYRGKSSA-N 0.000 description 2
- 235000003704 aspartic acid Nutrition 0.000 description 2
- 230000004888 barrier function Effects 0.000 description 2
- 108010005774 beta-Galactosidase Proteins 0.000 description 2
- OQFSQFPPLPISGP-UHFFFAOYSA-N beta-carboxyaspartic acid Natural products OC(=O)C(N)C(C(O)=O)C(O)=O OQFSQFPPLPISGP-UHFFFAOYSA-N 0.000 description 2
- 230000015572 biosynthetic process Effects 0.000 description 2
- 230000015556 catabolic process Effects 0.000 description 2
- 210000004027 cell Anatomy 0.000 description 2
- 229940015047 chorionic gonadotropin Drugs 0.000 description 2
- 230000000295 complement effect Effects 0.000 description 2
- 238000010276 construction Methods 0.000 description 2
- 238000007405 data analysis Methods 0.000 description 2
- 230000007423 decrease Effects 0.000 description 2
- 238000006731 degradation reaction Methods 0.000 description 2
- 238000003745 diagnosis Methods 0.000 description 2
- 239000003814 drug Substances 0.000 description 2
- 238000001035 drying Methods 0.000 description 2
- JMNJYGMAUMANNW-FIXZTSJVSA-N dynorphin a Chemical compound C([C@@H](C(=O)N[C@@H](CC(C)C)C(=O)N[C@@H](CCCNC(N)=N)C(=O)N[C@@H](CCCNC(N)=N)C(=O)N[C@@H]([C@@H](C)CC)C(=O)N[C@@H](CCCNC(N)=N)C(=O)N1[C@@H](CCC1)C(=O)N[C@@H](CCCCN)C(=O)N[C@@H](CC(C)C)C(=O)N[C@@H](CCCCN)C(=O)N[C@@H](CC=1C2=CC=CC=C2NC=1)C(=O)N[C@@H](CC(O)=O)C(=O)N[C@@H](CC(N)=O)C(=O)N[C@@H](CCC(N)=O)C(O)=O)NC(=O)CNC(=O)CNC(=O)[C@@H](N)CC=1C=CC(O)=CC=1)C1=CC=CC=C1 JMNJYGMAUMANNW-FIXZTSJVSA-N 0.000 description 2
- 230000000694 effects Effects 0.000 description 2
- 238000011984 electrochemiluminescence immunoassay Methods 0.000 description 2
- 238000002330 electrospray ionisation mass spectrometry Methods 0.000 description 2
- 239000003480 eluent Substances 0.000 description 2
- 238000002875 fluorescence polarization Methods 0.000 description 2
- 238000002866 fluorescence resonance energy transfer Methods 0.000 description 2
- 210000002196 fr. b Anatomy 0.000 description 2
- 210000003918 fraction a Anatomy 0.000 description 2
- 239000012520 frozen sample Substances 0.000 description 2
- 125000000524 functional group Chemical group 0.000 description 2
- 108020004445 glyceraldehyde-3-phosphate dehydrogenase Proteins 0.000 description 2
- 230000036541 health Effects 0.000 description 2
- 229940006607 hirudin Drugs 0.000 description 2
- WQPDUTSPKFMPDP-OUMQNGNKSA-N hirudin Chemical compound C([C@@H](C(=O)N[C@@H](CCC(O)=O)C(=O)N[C@@H](CCC(O)=O)C(=O)N[C@@H]([C@@H](C)CC)C(=O)N1[C@@H](CCC1)C(=O)N[C@@H](CCC(O)=O)C(=O)N[C@@H](CCC(O)=O)C(=O)N[C@@H](CC=1C=CC(OS(O)(=O)=O)=CC=1)C(=O)N[C@@H](CC(C)C)C(=O)N[C@@H](CCC(N)=O)C(O)=O)NC(=O)[C@H](CC(O)=O)NC(=O)CNC(=O)[C@H](CC(O)=O)NC(=O)[C@H](CC(N)=O)NC(=O)[C@H](CC=1NC=NC=1)NC(=O)[C@H](CO)NC(=O)[C@H](CCC(N)=O)NC(=O)[C@H]1N(CCC1)C(=O)[C@H](CCCCN)NC(=O)[C@H]1N(CCC1)C(=O)[C@@H](NC(=O)CNC(=O)[C@H](CCC(O)=O)NC(=O)CNC(=O)[C@@H](NC(=O)[C@@H](NC(=O)[C@H]1NC(=O)[C@H](CCC(N)=O)NC(=O)[C@H](CC(N)=O)NC(=O)[C@H](CCCCN)NC(=O)[C@H](CCC(O)=O)NC(=O)CNC(=O)[C@H](CC(O)=O)NC(=O)[C@H](CO)NC(=O)CNC(=O)[C@H](CC(C)C)NC(=O)[C@H]([C@@H](C)CC)NC(=O)[C@@H]2CSSC[C@@H](C(=O)N[C@@H](CCC(O)=O)C(=O)NCC(=O)N[C@@H](CO)C(=O)N[C@@H](CC(N)=O)C(=O)N[C@H](C(=O)N[C@H](C(NCC(=O)N[C@@H](CCC(N)=O)C(=O)NCC(=O)N[C@@H](CC(N)=O)C(=O)N[C@@H](CCCCN)C(=O)N2)=O)CSSC1)C(C)C)NC(=O)[C@H](CC(C)C)NC(=O)[C@H]1NC(=O)[C@H](CC(C)C)NC(=O)[C@H](CC(N)=O)NC(=O)[C@H](CCC(N)=O)NC(=O)CNC(=O)[C@H](CO)NC(=O)[C@H](CCC(O)=O)NC(=O)[C@H]([C@@H](C)O)NC(=O)[C@@H](NC(=O)[C@H](CC(O)=O)NC(=O)[C@@H](NC(=O)[C@H](CC=2C=CC(O)=CC=2)NC(=O)[C@@H](NC(=O)[C@@H](N)C(C)C)C(C)C)[C@@H](C)O)CSSC1)C(C)C)[C@@H](C)O)[C@@H](C)O)C1=CC=CC=C1 WQPDUTSPKFMPDP-OUMQNGNKSA-N 0.000 description 2
- 102000018475 human neutrophil peptide 2 Human genes 0.000 description 2
- 230000005661 hydrophobic surface Effects 0.000 description 2
- 102000018358 immunoglobulin Human genes 0.000 description 2
- 229940072221 immunoglobulins Drugs 0.000 description 2
- 238000003780 insertion Methods 0.000 description 2
- 230000037431 insertion Effects 0.000 description 2
- PBGKTOXHQIOBKM-FHFVDXKLSA-N insulin (human) Chemical compound C([C@@H](C(=O)N[C@@H](CC(C)C)C(=O)N[C@H]1CSSC[C@H]2C(=O)N[C@H](C(=O)N[C@@H](CO)C(=O)N[C@H](C(=O)N[C@H](C(N[C@@H](CO)C(=O)N[C@@H](CC(C)C)C(=O)N[C@@H](CC=3C=CC(O)=CC=3)C(=O)N[C@@H](CCC(N)=O)C(=O)N[C@@H](CC(C)C)C(=O)N[C@@H](CCC(O)=O)C(=O)N[C@@H](CC(N)=O)C(=O)N[C@@H](CC=3C=CC(O)=CC=3)C(=O)N[C@@H](CSSC[C@H](NC(=O)[C@H](C(C)C)NC(=O)[C@H](CC(C)C)NC(=O)[C@H](CC=3C=CC(O)=CC=3)NC(=O)[C@H](CC(C)C)NC(=O)[C@H](C)NC(=O)[C@H](CCC(O)=O)NC(=O)[C@H](C(C)C)NC(=O)[C@H](CC(C)C)NC(=O)[C@H](CC=3NC=NC=3)NC(=O)[C@H](CO)NC(=O)CNC1=O)C(=O)NCC(=O)N[C@@H](CCC(O)=O)C(=O)N[C@@H](CCCNC(N)=N)C(=O)NCC(=O)N[C@@H](CC=1C=CC=CC=1)C(=O)N[C@@H](CC=1C=CC=CC=1)C(=O)N[C@@H](CC=1C=CC(O)=CC=1)C(=O)N[C@@H]([C@@H](C)O)C(=O)N1[C@@H](CCC1)C(=O)N[C@@H](CCCCN)C(=O)N[C@@H]([C@@H](C)O)C(O)=O)C(=O)N[C@@H](CC(N)=O)C(O)=O)=O)CSSC[C@@H](C(N2)=O)NC(=O)[C@H](CCC(N)=O)NC(=O)[C@H](CCC(O)=O)NC(=O)[C@H](C(C)C)NC(=O)[C@@H](NC(=O)CN)[C@@H](C)CC)[C@@H](C)CC)[C@@H](C)O)NC(=O)[C@H](CCC(N)=O)NC(=O)[C@H](CC(N)=O)NC(=O)[C@@H](NC(=O)[C@@H](N)CC=1C=CC=CC=1)C(C)C)C1=CN=CN1 PBGKTOXHQIOBKM-FHFVDXKLSA-N 0.000 description 2
- 238000004989 laser desorption mass spectroscopy Methods 0.000 description 2
- 238000004519 manufacturing process Methods 0.000 description 2
- 239000011325 microbead Substances 0.000 description 2
- 239000011859 microparticle Substances 0.000 description 2
- 210000003205 muscle Anatomy 0.000 description 2
- GRZXCHIIZXMEPJ-HTLKCAKFSA-N neutrophil peptide-2 Chemical compound C([C@H]1C(=O)N[C@H]2CSSC[C@H]3C(=O)N[C@H](C(N[C@@H](C)C(=O)NCC(=O)N[C@@H](CCC(O)=O)C(=O)N[C@@H](CCCNC(N)=N)C(=O)N[C@@H](CCCNC(N)=N)C(=O)N[C@@H](CC=4C=CC(O)=CC=4)C(=O)NCC(=O)N[C@H](C(=O)N[C@@H](CSSC[C@H](NC(=O)[C@H](CC=4C=CC(O)=CC=4)NC(=O)[C@@H](N)CSSC[C@H](NC2=O)C(O)=O)C(=O)N[C@@H](CCCNC(N)=N)C(=O)N[C@@H]([C@@H](C)CC)C(=O)N2[C@@H](CCC2)C(=O)N[C@@H](C)C(=O)N3)C(=O)N[C@H](C(=O)N[C@@H](CC=2C=CC(O)=CC=2)C(=O)N[C@@H](CCC(N)=O)C(=O)NCC(=O)N[C@@H](CCCNC(N)=N)C(=O)N[C@@H](CC(C)C)C(=O)N[C@@H](CC=2C3=CC=CC=C3NC=2)C(=O)N[C@@H](C)C(=O)N1)[C@@H](C)CC)[C@@H](C)O)=O)[C@@H](C)CC)C1=CC=CC=C1 GRZXCHIIZXMEPJ-HTLKCAKFSA-N 0.000 description 2
- 238000005457 optimization Methods 0.000 description 2
- 238000011002 quantification Methods 0.000 description 2
- 238000003127 radioimmunoassay Methods 0.000 description 2
- 230000002829 reductive effect Effects 0.000 description 2
- 230000000717 retained effect Effects 0.000 description 2
- 238000012502 risk assessment Methods 0.000 description 2
- 238000003860 storage Methods 0.000 description 2
- 239000000758 substrate Substances 0.000 description 2
- 239000004474 valine Substances 0.000 description 2
- 238000012800 visualization Methods 0.000 description 2
- PXFBZOLANLWPMH-UHFFFAOYSA-N 16-Epiaffinine Natural products C1C(C2=CC=CC=C2N2)=C2C(=O)CC2C(=CC)CN(C)C1C2CO PXFBZOLANLWPMH-UHFFFAOYSA-N 0.000 description 1
- XYPANFGXFLOTDK-CJLNJPJHSA-N 1b-de-l-phenylalanine-insulin Chemical compound C([C@H](NC(=O)[C@H](CC(C)C)NC(=O)[C@H](CO)NC(=O)[C@H](CS)NC(=O)[C@H](C(C)C)NC(=O)[C@H](CO)NC(=O)[C@H](C)NC(=O)[C@H](CS)NC(=O)[C@H](CS)NC(=O)[C@H](CCC(N)=O)NC(=O)[C@H](CCC(O)=O)NC(=O)[C@H](C(C)C)NC(=O)[C@@H](NC(=O)CN)[C@@H](C)CC)C(=O)N[C@@H](CCC(N)=O)C(=O)N[C@@H](CC(C)C)C(=O)N[C@@H](CCC(O)=O)C(=O)N[C@@H](CC(N)=O)C(=O)N[C@@H](CC=1C=CC(O)=CC=1)C(=O)N[C@@H](CS)C(=O)N[C@@H](CC(N)=O)C(O)=O)C1=CC=C(O)C=C1.C([C@H](NC(=O)[C@H](CC(C)C)NC(=O)[C@H](CO)NC(=O)[C@H](CS)NC(=O)[C@H](C(C)C)NC(=O)[C@H](CO)NC(=O)[C@H](C)NC(=O)[C@H](CS)NC(=O)[C@H](CS)NC(=O)[C@H](CCC(N)=O)NC(=O)[C@H](CCC(O)=O)NC(=O)[C@H](C(C)C)NC(=O)[C@@H](NC(=O)CN)[C@@H](C)CC)C(=O)N[C@@H](CCC(N)=O)C(=O)N[C@@H](CC(C)C)C(=O)N[C@@H](CCC(O)=O)C(=O)N[C@@H](CC(N)=O)C(=O)N[C@@H](CC=1C=CC(O)=CC=1)C(=O)N[C@@H](CS)C(=O)N[C@@H](CC(N)=O)C(O)=O)C1=CC=C(O)C=C1 XYPANFGXFLOTDK-CJLNJPJHSA-N 0.000 description 1
- 208000037068 Abnormal Karyotype Diseases 0.000 description 1
- 206010000234 Abortion spontaneous Diseases 0.000 description 1
- 208000019901 Anxiety disease Diseases 0.000 description 1
- 238000006677 Appel reaction Methods 0.000 description 1
- 108090001008 Avidin Proteins 0.000 description 1
- 102100031680 Beta-catenin-interacting protein 1 Human genes 0.000 description 1
- 101001008231 Bos taurus Beta-lactoglobulin Proteins 0.000 description 1
- 101000921522 Bos taurus Cytochrome c Proteins 0.000 description 1
- 101500025132 Bos taurus Ubiquitin Proteins 0.000 description 1
- 101500027500 Bos taurus Ubiquitin Proteins 0.000 description 1
- 101500027539 Bos taurus Ubiquitin Proteins 0.000 description 1
- 101500028979 Bos taurus Ubiquitin Proteins 0.000 description 1
- KPBJTGOVJLITON-UHFFFAOYSA-N CC(C)C(NC(=O)CNC(=O)C(N)CCC(O)=O)C(=O)NC(CC(N)=O)C(=O)NC(CC(O)=O)C(=O)NC(CC(N)=O)C(=O)NC(CCC(O)=O)C(=O)NC(CCC(O)=O)C(=O)NCC(=O)NC(Cc1ccccc1)C(=O)NC(Cc1ccccc1)C(=O)NC(CO)C(=O)NC(C)C(=O)NC(CCCNC(N)=N)C(O)=O Chemical compound CC(C)C(NC(=O)CNC(=O)C(N)CCC(O)=O)C(=O)NC(CC(N)=O)C(=O)NC(CC(O)=O)C(=O)NC(CC(N)=O)C(=O)NC(CCC(O)=O)C(=O)NC(CCC(O)=O)C(=O)NCC(=O)NC(Cc1ccccc1)C(=O)NC(Cc1ccccc1)C(=O)NC(CO)C(=O)NC(C)C(=O)NC(CCCNC(N)=N)C(O)=O KPBJTGOVJLITON-UHFFFAOYSA-N 0.000 description 1
- OKTJSMMVPCPJKN-UHFFFAOYSA-N Carbon Chemical group [C] OKTJSMMVPCPJKN-UHFFFAOYSA-N 0.000 description 1
- 108020004638 Circular DNA Proteins 0.000 description 1
- 108010026206 Conalbumin Proteins 0.000 description 1
- 208000002330 Congenital Heart Defects Diseases 0.000 description 1
- 206010010356 Congenital anomaly Diseases 0.000 description 1
- 108010091893 Cosyntropin Proteins 0.000 description 1
- 102000053602 DNA Human genes 0.000 description 1
- 101710178508 Defensin 3 Proteins 0.000 description 1
- 101710178505 Defensin-1 Proteins 0.000 description 1
- 101710178510 Defensin-2 Proteins 0.000 description 1
- 102400000242 Dynorphin A(1-17) Human genes 0.000 description 1
- 108010065372 Dynorphins Proteins 0.000 description 1
- 208000001362 Fetal Growth Retardation Diseases 0.000 description 1
- 208000022471 Fetal disease Diseases 0.000 description 1
- 206010055690 Foetal death Diseases 0.000 description 1
- 206010070531 Foetal growth restriction Diseases 0.000 description 1
- 241000287828 Gallus gallus Species 0.000 description 1
- 108090000288 Glycoproteins Proteins 0.000 description 1
- 102000003886 Glycoproteins Human genes 0.000 description 1
- 101500024729 Homo sapiens Angiotensin-1 Proteins 0.000 description 1
- 101000993469 Homo sapiens Beta-catenin-interacting protein 1 Proteins 0.000 description 1
- 101500024092 Homo sapiens Beta-endorphin Proteins 0.000 description 1
- 101000971703 Homo sapiens Kinesin-like protein KIF1C Proteins 0.000 description 1
- 101000979579 Homo sapiens NK1 transcription factor-related protein 1 Proteins 0.000 description 1
- 101000918983 Homo sapiens Neutrophil defensin 1 Proteins 0.000 description 1
- 101000830386 Homo sapiens Neutrophil defensin 3 Proteins 0.000 description 1
- 102100021525 Kinesin-like protein KIF1C Human genes 0.000 description 1
- QIVBCDIJIAJPQS-VIFPVBQESA-N L-tryptophane Chemical compound C1=CC=C2C(C[C@H](N)C(O)=O)=CNC2=C1 QIVBCDIJIAJPQS-VIFPVBQESA-N 0.000 description 1
- OUYCCCASQSFEME-QMMMGPOBSA-N L-tyrosine Chemical compound OC(=O)[C@@H](N)CC1=CC=C(O)C=C1 OUYCCCASQSFEME-QMMMGPOBSA-N 0.000 description 1
- 108090001030 Lipoproteins Proteins 0.000 description 1
- 102000004895 Lipoproteins Human genes 0.000 description 1
- 241001465754 Metazoa Species 0.000 description 1
- 102100029494 Neutrophil defensin 1 Human genes 0.000 description 1
- 102100024761 Neutrophil defensin 3 Human genes 0.000 description 1
- 108020004711 Nucleic Acid Probes Proteins 0.000 description 1
- 108091034117 Oligonucleotide Proteins 0.000 description 1
- 108010058846 Ovalbumin Proteins 0.000 description 1
- 108010001441 Phosphopeptides Proteins 0.000 description 1
- 108010022181 Phosphopyruvate Hydratase Proteins 0.000 description 1
- 102000012288 Phosphopyruvate Hydratase Human genes 0.000 description 1
- 108010026552 Proteome Proteins 0.000 description 1
- KJTLSVCANCCWHF-UHFFFAOYSA-N Ruthenium Chemical compound [Ru] KJTLSVCANCCWHF-UHFFFAOYSA-N 0.000 description 1
- 108020004682 Single-Stranded DNA Proteins 0.000 description 1
- FAPWRFPIFSIZLT-UHFFFAOYSA-M Sodium chloride Chemical compound [Na+].[Cl-] FAPWRFPIFSIZLT-UHFFFAOYSA-M 0.000 description 1
- 201000010829 Spina bifida Diseases 0.000 description 1
- 208000006097 Spinal Dysraphism Diseases 0.000 description 1
- 102000019197 Superoxide Dismutase Human genes 0.000 description 1
- 108010012715 Superoxide dismutase Proteins 0.000 description 1
- 241001080024 Telles Species 0.000 description 1
- QIVBCDIJIAJPQS-UHFFFAOYSA-N Tryptophan Natural products C1=CC=C2C(CC(N)C(O)=O)=CNC2=C1 QIVBCDIJIAJPQS-UHFFFAOYSA-N 0.000 description 1
- 102100038968 WAP four-disulfide core domain protein 1 Human genes 0.000 description 1
- 240000008042 Zea mays Species 0.000 description 1
- 238000010521 absorption reaction Methods 0.000 description 1
- 230000004913 activation Effects 0.000 description 1
- 238000001042 affinity chromatography Methods 0.000 description 1
- 229940050528 albumin Drugs 0.000 description 1
- 102000018568 alpha-Defensin Human genes 0.000 description 1
- 108050007802 alpha-defensin Proteins 0.000 description 1
- 150000001412 amines Chemical group 0.000 description 1
- 210000004381 amniotic fluid Anatomy 0.000 description 1
- 239000012491 analyte Substances 0.000 description 1
- ORWYRWWVDCYOMK-HBZPZAIKSA-N angiotensin I Chemical compound C([C@@H](C(=O)N[C@@H]([C@@H](C)CC)C(=O)N[C@@H](CC=1NC=NC=1)C(=O)N1[C@@H](CCC1)C(=O)N[C@@H](CC=1C=CC=CC=1)C(=O)N[C@@H](CC=1NC=NC=1)C(=O)N[C@@H](CC(C)C)C(O)=O)NC(=O)[C@@H](NC(=O)[C@H](CCCN=C(N)N)NC(=O)[C@@H](N)CC(O)=O)C(C)C)C1=CC=C(O)C=C1 ORWYRWWVDCYOMK-HBZPZAIKSA-N 0.000 description 1
- 238000005349 anion exchange Methods 0.000 description 1
- 150000001450 anions Chemical class 0.000 description 1
- 230000009830 antibody antigen interaction Effects 0.000 description 1
- 230000036506 anxiety Effects 0.000 description 1
- 229910000266 aqualite Inorganic materials 0.000 description 1
- 235000009697 arginine Nutrition 0.000 description 1
- 150000001484 arginines Chemical class 0.000 description 1
- 230000001580 bacterial effect Effects 0.000 description 1
- 239000013060 biological fluid Substances 0.000 description 1
- 230000033228 biological regulation Effects 0.000 description 1
- 229960002685 biotin Drugs 0.000 description 1
- 235000020958 biotin Nutrition 0.000 description 1
- 239000011616 biotin Substances 0.000 description 1
- 210000001124 body fluid Anatomy 0.000 description 1
- 239000010839 body fluid Substances 0.000 description 1
- 210000000988 bone and bone Anatomy 0.000 description 1
- 238000004364 calculation method Methods 0.000 description 1
- 150000001720 carbohydrates Chemical class 0.000 description 1
- 238000005277 cation exchange chromatography Methods 0.000 description 1
- GLCFDMVVSSMZRL-BRKZGERCSA-N chembl499388 Chemical compound C([C@H]1C(=O)N[C@H]2CSSC[C@H]3C(=O)N[C@H](C(N[C@@H](C)C(=O)NCC(=O)N[C@@H](CCC(O)=O)C(=O)N[C@@H](CCCNC(N)=N)C(=O)N[C@@H](CCCNC(N)=N)C(=O)N[C@@H](CC=4C=CC(O)=CC=4)C(=O)NCC(=O)N[C@H](C(=O)N[C@@H](CSSC[C@H](NC(=O)[C@H](CC=4C=CC(O)=CC=4)NC(=O)[C@H](CSSC[C@H](NC2=O)C(O)=O)NC(=O)[C@@H](N)CC(O)=O)C(=O)N[C@@H](CCCNC(N)=N)C(=O)N[C@@H]([C@@H](C)CC)C(=O)N2[C@@H](CCC2)C(=O)N[C@@H](C)C(=O)N3)C(=O)N[C@H](C(=O)N[C@@H](CC=2C=CC(O)=CC=2)C(=O)N[C@@H](CCC(N)=O)C(=O)NCC(=O)N[C@@H](CCCNC(N)=N)C(=O)N[C@@H](CC(C)C)C(=O)N[C@@H](CC=2C3=CC=CC=C3NC=2)C(=O)N[C@@H](C)C(=O)N1)[C@@H](C)CC)[C@@H](C)O)=O)[C@@H](C)CC)C1=CC=CC=C1 GLCFDMVVSSMZRL-BRKZGERCSA-N 0.000 description 1
- 238000006757 chemical reactions by type Methods 0.000 description 1
- 238000003759 clinical diagnosis Methods 0.000 description 1
- 208000028831 congenital heart disease Diseases 0.000 description 1
- 238000007796 conventional method Methods 0.000 description 1
- ZOEFCCMDUURGSE-SQKVDDBVSA-N cosyntropin Chemical compound C([C@@H](C(=O)N[C@@H](CO)C(=O)N[C@@H](CCSC)C(=O)N[C@@H](CCC(O)=O)C(=O)N[C@@H](CC=1NC=NC=1)C(=O)N[C@@H](CC=1C=CC=CC=1)C(=O)N[C@@H](CCCNC(N)=N)C(=O)N[C@@H](CC=1C2=CC=CC=C2NC=1)C(=O)NCC(=O)N[C@@H](CCCCN)C(=O)N1[C@@H](CCC1)C(=O)N[C@@H](C(C)C)C(=O)NCC(=O)N[C@@H](CCCCN)C(=O)N[C@@H](CCCCN)C(=O)N[C@@H](CCCNC(N)=N)C(=O)N[C@@H](CCCNC(N)=N)C(=O)N1[C@@H](CCC1)C(=O)N[C@@H](C(C)C)C(=O)N[C@@H](CCCCN)C(=O)N[C@@H](C(C)C)C(=O)N[C@@H](CC=1C=CC(O)=CC=1)C(=O)N1[C@@H](CCC1)C(O)=O)NC(=O)[C@@H](N)CO)C1=CC=C(O)C=C1 ZOEFCCMDUURGSE-SQKVDDBVSA-N 0.000 description 1
- 230000001186 cumulative effect Effects 0.000 description 1
- 238000013523 data management Methods 0.000 description 1
- 230000003247 decreasing effect Effects 0.000 description 1
- 239000003398 denaturant Substances 0.000 description 1
- 230000001419 dependent effect Effects 0.000 description 1
- 238000003795 desorption Methods 0.000 description 1
- 239000003599 detergent Substances 0.000 description 1
- 238000001962 electrophoresis Methods 0.000 description 1
- 230000002996 emotional effect Effects 0.000 description 1
- 125000003700 epoxy group Chemical group 0.000 description 1
- 238000013401 experimental design Methods 0.000 description 1
- 230000002349 favourable effect Effects 0.000 description 1
- 208000030941 fetal growth restriction Diseases 0.000 description 1
- 231100000562 fetal loss Toxicity 0.000 description 1
- 238000000684 flow cytometry Methods 0.000 description 1
- MHMNJMPURVTYEJ-UHFFFAOYSA-N fluorescein-5-isothiocyanate Chemical compound O1C(=O)C2=CC(N=C=S)=CC=C2C21C1=CC=C(O)C=C1OC1=CC(O)=CC=C21 MHMNJMPURVTYEJ-UHFFFAOYSA-N 0.000 description 1
- 238000012921 fluorescence analysis Methods 0.000 description 1
- 230000008014 freezing Effects 0.000 description 1
- 238000007710 freezing Methods 0.000 description 1
- 108091008053 gene clusters Proteins 0.000 description 1
- 230000013595 glycosylation Effects 0.000 description 1
- 238000006206 glycosylation reaction Methods 0.000 description 1
- PCHJSUWPFVWCPO-UHFFFAOYSA-N gold Chemical compound [Au] PCHJSUWPFVWCPO-UHFFFAOYSA-N 0.000 description 1
- 239000010931 gold Substances 0.000 description 1
- 229910052737 gold Inorganic materials 0.000 description 1
- 230000012010 growth Effects 0.000 description 1
- 238000003306 harvesting Methods 0.000 description 1
- 238000004128 high performance liquid chromatography Methods 0.000 description 1
- 238000009396 hybridization Methods 0.000 description 1
- 230000036039 immunity Effects 0.000 description 1
- 238000001114 immunoprecipitation Methods 0.000 description 1
- 239000011261 inert gas Substances 0.000 description 1
- 208000015181 infectious disease Diseases 0.000 description 1
- 230000002458 infectious effect Effects 0.000 description 1
- 108010067471 inhibin A Proteins 0.000 description 1
- 230000000670 limiting effect Effects 0.000 description 1
- 238000004895 liquid chromatography mass spectrometry Methods 0.000 description 1
- 235000018977 lysine Nutrition 0.000 description 1
- 150000002669 lysines Chemical class 0.000 description 1
- 230000014759 maintenance of location Effects 0.000 description 1
- 230000036244 malformation Effects 0.000 description 1
- 238000007726 management method Methods 0.000 description 1
- 238000001819 mass spectrum Methods 0.000 description 1
- 238000005374 membrane filtration Methods 0.000 description 1
- 230000002503 metabolic effect Effects 0.000 description 1
- 229910052751 metal Inorganic materials 0.000 description 1
- 239000002184 metal Substances 0.000 description 1
- 238000005497 microtitration Methods 0.000 description 1
- 208000015994 miscarriage Diseases 0.000 description 1
- 230000004048 modification Effects 0.000 description 1
- 238000012986 modification Methods 0.000 description 1
- 238000010369 molecular cloning Methods 0.000 description 1
- 238000012544 monitoring process Methods 0.000 description 1
- 208000030454 monosomy Diseases 0.000 description 1
- 230000008722 morphological abnormality Effects 0.000 description 1
- 239000002105 nanoparticle Substances 0.000 description 1
- MGFYIUFZLHCRTH-UHFFFAOYSA-N nitrilotriacetic acid Chemical compound OC(=O)CN(CC(O)=O)CC(O)=O MGFYIUFZLHCRTH-UHFFFAOYSA-N 0.000 description 1
- 239000002853 nucleic acid probe Substances 0.000 description 1
- 230000003287 optical effect Effects 0.000 description 1
- 229940092253 ovalbumin Drugs 0.000 description 1
- 230000003071 parasitic effect Effects 0.000 description 1
- 230000001575 pathological effect Effects 0.000 description 1
- 230000037361 pathway Effects 0.000 description 1
- 238000005191 phase separation Methods 0.000 description 1
- 210000002826 placenta Anatomy 0.000 description 1
- 229920000642 polymer Polymers 0.000 description 1
- 238000006116 polymerization reaction Methods 0.000 description 1
- 239000000256 polyoxyethylene sorbitan monolaurate Substances 0.000 description 1
- 238000001556 precipitation Methods 0.000 description 1
- 238000012545 processing Methods 0.000 description 1
- 230000004845 protein aggregation Effects 0.000 description 1
- 230000006920 protein precipitation Effects 0.000 description 1
- 238000001742 protein purification Methods 0.000 description 1
- 238000003908 quality control method Methods 0.000 description 1
- 238000012552 review Methods 0.000 description 1
- 229910052707 ruthenium Inorganic materials 0.000 description 1
- 238000005070 sampling Methods 0.000 description 1
- 238000003118 sandwich ELISA Methods 0.000 description 1
- 238000012163 sequencing technique Methods 0.000 description 1
- 235000004400 serine Nutrition 0.000 description 1
- 150000003355 serines Chemical class 0.000 description 1
- 230000035939 shock Effects 0.000 description 1
- 229910052814 silicon oxide Inorganic materials 0.000 description 1
- 229910052709 silver Inorganic materials 0.000 description 1
- 239000004332 silver Substances 0.000 description 1
- PCMORTLOPMLEFB-ONEGZZNKSA-N sinapic acid Chemical compound COC1=CC(\C=C\C(O)=O)=CC(OC)=C1O PCMORTLOPMLEFB-ONEGZZNKSA-N 0.000 description 1
- PCMORTLOPMLEFB-UHFFFAOYSA-N sinapinic acid Natural products COC1=CC(C=CC(O)=O)=CC(OC)=C1O PCMORTLOPMLEFB-UHFFFAOYSA-N 0.000 description 1
- 239000011780 sodium chloride Substances 0.000 description 1
- 239000007787 solid Substances 0.000 description 1
- 239000007790 solid phase Substances 0.000 description 1
- 241000894007 species Species 0.000 description 1
- 208000000995 spontaneous abortion Diseases 0.000 description 1
- 238000007619 statistical method Methods 0.000 description 1
- 238000001920 surface-enhanced laser desorption--ionisation mass spectrometry Methods 0.000 description 1
- 230000009897 systematic effect Effects 0.000 description 1
- 150000003588 threonines Chemical class 0.000 description 1
- 230000009466 transformation Effects 0.000 description 1
- 230000005945 translocation Effects 0.000 description 1
- 210000000251 trophoblastic cell Anatomy 0.000 description 1
- OUYCCCASQSFEME-UHFFFAOYSA-N tyrosine Natural products OC(=O)C(N)CC1=CC=C(O)C=C1 OUYCCCASQSFEME-UHFFFAOYSA-N 0.000 description 1
- 230000003612 virological effect Effects 0.000 description 1
- 238000005406 washing Methods 0.000 description 1
- AFVLVVWMAFSXCK-UHFFFAOYSA-N α-cyano-4-hydroxycinnamic acid Chemical compound OC(=O)C(C#N)=CC1=CC=C(O)C=C1 AFVLVVWMAFSXCK-UHFFFAOYSA-N 0.000 description 1
- KRJOFJHOZZPBKI-KSWODRSDSA-N α-defensin-1 Chemical compound C([C@H]1C(=O)N[C@H]2CSSC[C@H]3C(=O)N[C@H](C(N[C@@H](C)C(=O)NCC(=O)N[C@@H](CCC(O)=O)C(=O)N[C@@H](CCCNC(N)=N)C(=O)N[C@@H](CCCNC(N)=N)C(=O)N[C@@H](CC=4C=CC(O)=CC=4)C(=O)NCC(=O)N[C@H](C(=O)N[C@@H](CSSC[C@H](NC(=O)[C@H](CC=4C=CC(O)=CC=4)NC(=O)[C@H](CSSC[C@H](NC2=O)C(O)=O)NC(=O)[C@H](C)N)C(=O)N[C@@H](CCCNC(N)=N)C(=O)N[C@@H]([C@@H](C)CC)C(=O)N2[C@@H](CCC2)C(=O)N[C@@H](C)C(=O)N3)C(=O)N[C@H](C(=O)N[C@@H](CC=2C=CC(O)=CC=2)C(=O)N[C@@H](CCC(N)=O)C(=O)NCC(=O)N[C@@H](CCCNC(N)=N)C(=O)N[C@@H](CC(C)C)C(=O)N[C@@H](CC=2C3=CC=CC=C3NC=2)C(=O)N[C@@H](C)C(=O)N1)[C@@H](C)CC)[C@@H](C)O)=O)[C@@H](C)CC)C1=CC=CC=C1 KRJOFJHOZZPBKI-KSWODRSDSA-N 0.000 description 1
Images







Classifications
-
- C—CHEMISTRY; METALLURGY
- C12—BIOCHEMISTRY; BEER; SPIRITS; WINE; VINEGAR; MICROBIOLOGY; ENZYMOLOGY; MUTATION OR GENETIC ENGINEERING
- C12Q—MEASURING OR TESTING PROCESSES INVOLVING ENZYMES, NUCLEIC ACIDS OR MICROORGANISMS; COMPOSITIONS OR TEST PAPERS THEREFOR; PROCESSES OF PREPARING SUCH COMPOSITIONS; CONDITION-RESPONSIVE CONTROL IN MICROBIOLOGICAL OR ENZYMOLOGICAL PROCESSES
- C12Q1/00—Measuring or testing processes involving enzymes, nucleic acids or microorganisms; Compositions therefor; Processes of preparing such compositions
- C12Q1/68—Measuring or testing processes involving enzymes, nucleic acids or microorganisms; Compositions therefor; Processes of preparing such compositions involving nucleic acids
- C12Q1/6876—Nucleic acid products used in the analysis of nucleic acids, e.g. primers or probes
- C12Q1/6883—Nucleic acid products used in the analysis of nucleic acids, e.g. primers or probes for diseases caused by alterations of genetic material
-
- C—CHEMISTRY; METALLURGY
- C12—BIOCHEMISTRY; BEER; SPIRITS; WINE; VINEGAR; MICROBIOLOGY; ENZYMOLOGY; MUTATION OR GENETIC ENGINEERING
- C12Q—MEASURING OR TESTING PROCESSES INVOLVING ENZYMES, NUCLEIC ACIDS OR MICROORGANISMS; COMPOSITIONS OR TEST PAPERS THEREFOR; PROCESSES OF PREPARING SUCH COMPOSITIONS; CONDITION-RESPONSIVE CONTROL IN MICROBIOLOGICAL OR ENZYMOLOGICAL PROCESSES
- C12Q2600/00—Oligonucleotides characterized by their use
- C12Q2600/158—Expression markers
Definitions
- the present invention relates to prenatal screening for chromosomal abnormalities. More particularly, the invention is based on the identification of new markers of chromosomal abnormalities, in particular trisomy 21, whose assay from a biological fluid sample of the pregnant woman, alone or in combination with other assays, to determine the probability that the fetus is suffering from a chromosomal abnormality, with a precision greater than that of the tests currently used.
- Trisomy 21 or Down syndrome is the most common of the viable chromosome abnormalities. At the origin of psychomotor handicaps, it affects one birth in 800, and knowing that about 800 000 births are observed in France, the incidence is 1000 children with Down Syndrome per year.
- the risk of trisomy increases with maternal age, especially after age 35 (exponential growth). The risk is also increased if one of the parents carries a balanced translocation or if the couple has already given birth to a child with a chromosomal abnormality. Fetal abnormalities detected on ultrasound can also lead to the prescription of a fetal karyotype.
- Antenatal screening for trisomy 21 consists of studying the fetal karyotype, either on amniotic cells or on trophoblastic cells. The sample is at risk of miscarriage.
- the karyotype is a long examination that is performed in a specialized laboratory and authorized by the Ministry of Health. It is therefore reserved for a population of women called "at high risk of chromosomal abnormalities".
- AFP alpha-fetoprotein
- hCG chorionic gonadotropin hormone
- hCG hCG
- AFP unconjugated estriol
- uE3 unconjugated estriol
- the maternal serum markers hCG, uE3 and AFP
- the test is next B145 or 39 euros 15.
- a blood sample between the 15 th and 18 th week of gestation, to dosage at least two of these markers is carried out, enabling a calculation of risk taking into account the risk a priori of the age of the mother modulated according to the observed values of these markers.
- the threshold risk considered as decision-making for prenatal screening is arbitrarily set at 1/250.
- Screening sensitivity is approximately 60% if the risk threshold chosen for access to amniocentesis is 1/250. This leads to amniocentesis for about 5% of pregnant women.
- the positive predictive value (specificity) is of the order of 1 to 2%.
- the sensitivity of the screening is better, with equal amniocentesis rate, if the markers are more discriminating and combined with each other.
- the most commonly used combinations are the triple test (hCG + AFP + uE3) and the double tests, hCG + AFP or hCG + uE3, the latter being the best.
- the false positives of screening are amniocenteses with a normal karyotype.
- the number of false positives should be reduced as much as possible because of the risk of fetal loss after amniocentesis (about 1%). Moreover, they can generate great anxiety in women while waiting for karyotype results.
- PAPP-A protein plasma pregnancy associated protein A
- hCG free beta subunit of hCG
- nuchal translucency at 12 weeks gestation.
- the performance of the serum markers depends on the chosen strategy: risk threshold beyond which an amniocentesis is proposed, nature of the markers used, and type of association between them. Some combinations of markers perform better than others (Wald et al, Lancet, 2003, 8, 361, 855-6).
- the inventors conducted studies from 280 frozen sera of women. pregnant with fetuses with trisomal 21 (including those that were detected and those that were not detected by serum markers of the second trimester), and more than 280 control sera of women without fetuses trisomic 21 whose outcomes are known.
- the placenta is a barrier between mother and fetus, but there is evidence that some small molecular weight molecules pass this barrier.
- the inventors have therefore chosen to apply the proteomic technique in the serum of pregnant women, in order to determine a differential expression profile that makes it possible to almost certainly distinguish those with fetuses with trisomics 21 compared with sera from normal pregnant women.
- This approach illustrated in the experimental part below, allowed them to identify several markers that can almost certainly distinguish the sera of women with fetuses with trisomic 21 compared with sera of normal pregnant women.
- the present invention thus relates, in the first place, to the use of one or more marker (s) chosen from list (i) below.
- the invention also relates to an in vitro screening method for determining whether a pregnant woman is a carrier of a fetus suffering from an abnormality, comprising a step of assaying, in a biological sample of said pregnant woman, at least one marker selected from list (i) above.
- the word "assay” refers to a quantitative or semi-quantitative measurement in the broad sense, for example a relative quantification of a compound, with respect to the same compound in another sample, or with respect to another compound in the same sample.
- a comparison of profiles, obtained for example by mass spectrometry is considered a "dosage”.
- the method of the invention comprises a step of assaying at least three markers, at least one of which is selected from list (i) above, and the other two are selected. either in this same list, or among the markers already characterized and used today, such as one of the markers of the second trimester - the hormone chorionic gonadotropin (hCG) or its free ⁇ subunit, unconjugated estriol (uE3), ⁇ -fetoprotein (AFP) and / or inhibin A - or first trimester -subunit ⁇ free of hCG and / or plasma protein associated with pregnancy (PAPP-A).
- one of the dosages can be replaced by the observation of nuchal translucency, in the first trimester.
- an "improved triple test”, based on the hCG assay, uE3, and one of the markers cited above, is an integral part of the invention.
- the assay of a marker from list (i) above may be combined with one or more other known test (s), such as, for example, the examination of nuchal translucency.
- the invention makes it possible to detect chromosomal abnormalities, in particular trisomy 21, trisomy 18 and a deletion of the long arm of chromosome 7, but also other congenital anomalies currently detected by ultrasound, for example Spina Bifida.
- the invention can be applied to the detection of genetic or infectious (viral, bacterial, or parasitic) or metabolic fetal diseases, or to the search for a specific phenotype and in particular the sex of the fetus.
- the method of the invention involves a dosage step from a biological sample from the pregnant woman, which may be any body fluid, such as a sample of blood, serum, plasma, urine. ..
- the present invention is applicable to prenatal screening during the second trimester, or earlier, during the first trimester of pregnancy.
- markers identified by the inventors are designated by their molecular weight (MW). This molecular weight is that measured by mass spectrometry, according to the protocols described hereinafter in the experimental part (under non-denaturing conditions).
- MW molecular weight
- PM3371 refers to the molecule identified by a peak at 3371 Da by mass spectrometry performed using an anionic separation surface under the conditions summarized in Table 20 below.
- PM6423 refers to the molecule identified by a peak at 6423 Da under different conditions, using a hydrophobic separating surface. Table 14 presented in the experimental section below indicates, for each marker, whether it has been identified in anionic or hydrophobic separation phase.
- the molecular weights of the markers identified by the inventors were measured under specific conditions, in particular calibration, and with a given instrumentation, in particular with a well-tuned laser. Under these conditions, the measurement of the molecular weights of the various labels is reproducible, with a coefficient of variation that is very much less than 10%, typically of the order of 0.3 to 0.5%, for molecular weight markers of less than 12000. da. Of calibrators used, this coefficient of variation is of the order of 10 to 25% for molecular weight markers greater than 12000 Da. As stated in the experimental section below (title C-3), the choice of the calibrator does not influence the values of the intensities of the peaks observed. The use of different calibrators from those used by the inventors may possibly lead to a variation in the mass measured for the marker. The peaks corresponding to each of the markers, however, remain always identifiable.
- the inventors have identified a subgroup of 19 particularly effective markers, which are cited in list (ii) below: PM3371; PM3442; PM3486; PM4152; PM4168; PM4186; PM4201; PM4300; PM5695; PM6222; PM4682; PM5625; PM6423; PM6439; PM6620; PM6636; PM9360; PM14035; and PM17262.
- at least one marker is chosen from the list (ii).
- the number of markers selected from the molecules identified by the inventors may be equal to 1, 2, 3, 4, 5, 6, 7, 8, 9, 10, 15, 20 or more, whether they are markers selected from the subgroup of the 19 potentially most relevant markers (list (ii)), or from the larger list (i).
- list (ii) the subgroup of the 19 potentially most relevant markers
- Those skilled in the art will determine the number of markers to be assayed according to efficiency constraints (search for the most sensitive and selective test possible), and economic constraints.
- the invention relates to a method as described above, comprising a dosage step of at least three markers newly identified by the inventors, selected either from the extended list (i) or from the restricted list (ii).
- This method may further include a step of assaying, in the biological sample of the pregnant woman, one or more other marker (s) chosen from the hormone chorionic gonadotrophin (hCG); the ⁇ subunit of hCG; unconjugated estriol (uE3); and alpha-fetoprotein (AFP).
- hCG hormone chorionic gonadotrophin
- uE3 unconjugated estriol
- AFP alpha-fetoprotein
- PM3371, PM3442, and PM3486 were identified as human neutrophil defensins HND-2, HND-1, and HND-3, respectively (see Experimental Part, D-9). These defensins are overexpressed or expressed normally in controls, and under-expressed in trisomy (Fig. 15). According to a preferred implementation of the process of the invention, at least one of the markers for which the assay is carried out is selected from PM3371, PM3442, and PM3486. A high rate of the marker in question is indicative of a healthy fetus, while a low rate is indicative of a high probability of trisomy.
- the invention also relates to the use of one or more human neutrophil defensins selected from HND-1, HND-2 and HND-3 as a marker (s) for the prenatal diagnosis of a chromosomal abnormality.
- At least one of the markers under consideration is selected from PM6423, PM6439, PM6620, and PM6636.
- these methods also comprise, for each measured marker, a step of comparing the measured concentration of this marker in the biological sample of the pregnant woman, with reference values of the concentration of this marker in pregnant women with normal fetuses, and in pregnant women with fetuses with a known chromosomal and / or genetic abnormality, the comparison being indicative of the risk that the pregnant woman has a fetus suffering from a chromosomal and / or genetic anomaly.
- These references will be chosen by those skilled in the art to correspond to the gestational age of the sample taken from the pregnant woman.
- the chromosomal abnormalities for which screening is sought include at least one disease selected from the group consisting of Down syndrome (trisomy 21), Edwards syndrome (trisomy 18), Patau syndrome (Trisomy 13), Turner's syndrome, Klinefelter syndrome, X monosomy, Fragile X syndrome, and Penta X syndrome.
- the most commonly sought abnormality is Down syndrome.
- the screening methods according to the invention may also include an initial step of preparing the sample.
- this step may comprise fractionation as a function of the mass of the proteins, and / or a stage of depletion of albumin or other transport proteins, and / or a step of purifying the proteins on an anion-type preparative surface and / or hydrophobic.
- the assay of at least one marker is carried out by mass spectrometry, for example by low-resolution (SELDI-TOF) or high-resolution (Bruker) mass spectrometry.
- mass spectrometry for example by low-resolution (SELDI-TOF) or high-resolution (Bruker) mass spectrometry.
- the Sandwich IA approach is based on the double recognition of the marker - or antigen by specific antibodies: the so-called “capture” antibodies immobilized on the chosen support (micro-titration plate, magnetic ball ...), and so-called “detection” antibodies, in solution and coupled to a reactive molecule, responsible for the emission of the binding signal (directly or indirectly).
- This set of non-overlapping specific antibodies is the reagents common to the various detection systems of today.
- antigen recognition can be accomplished using aptamers, which are single-stranded oligonucleotide (DNA or RNA) sequences selected in vitro for their binding capacity to a given molecule; this selection can be done, for example, by the method SELEX ( Systematic Evolution of Ligands by Exponential Enrichment ) as described in US Patent 5,270,163.
- a functionalized aptamer may, for example, be used in place of a secondary antibody in a Sandwich ELISA immunoassay , as described by Sumedha Jayasena ( Clinical Chemistry 1999, 45 (9): 1628-50, FIG. 6).
- Aptamers can be optimized by different modifications (Sumedha Jayasena, supra, Fig. 2). It is in particular possible to modify the aptamers so that activation by UV after binding of their target ensures the covalent binding of this target to the support ( photoaptamers ).
- a diagnostic device of the immuno-reaction type also depend on the detection system used. Some reagents and supports that can be used to implement the invention are summarized in Table 1 below, as well as examples of suitable instrumentation. Table 1: The different components of a type IA diagnostic device Detection system Reagents (except antibodies and capture and detection aptamers and associated buffers) Support Instrumentation (Photomultipliers and CCD cameras for IFA, CLIA and ECLIA) RIA (Radioimmuno Assay) Radiolotics ( 125 I) Microplates, Microbeads, Magnetic microbeads. Technicon Star System ...
- IFA Immunofluorescent Assay
- FP Fluorescence Polarization
- TRF Time Resolved Fluorescence
- FRET Fluorescence Resonance Energy Transfer
- Protein chips can be designed to determine selected protein expression patterns involving the desired markers. This technology is presented in the review paper by Sydor and Nock (Proteome Science, 2003, June 10; 1 (1) : 3). Of course, those skilled in the art can improve the technologies presented in this article by using their general knowledge in this field.
- MAP technology Luminex Corp
- Bio Bar Codes Nanotechnologies Inc.
- LumiPhos markers 530 and 480 Lumigen
- RCA Rolling-circle Amplification
- MAP Luminex Corp
- IFA Immunofluorescent Assay
- Bio Bar Codes (Nanotechnologies Inc.) Combine Nanoparticles and Scanometry (Silver), Introducing a New Detection System Based on Hybridization of Unique Nucleic Acid Probes (Marker Identification) ( Nanoparticle-Based Bio-Bar Codes for the Ultrasensitive Detection of Proteins, Min Jwa Min et al., Science 2003).
- LumiPhos 530 and 480 (Lumigen) markers combine chemiluminescent and fluorescent detection systems, ensuring signal optimization.
- the RCA Rolling-circle Amplification allows the detection of proteins with a sensitivity of the order of the zeptomole (10 -21 moles).
- This technology described by Schweitzer et al (Proc Natl Acad Sci US A 2000 Aug 29; 97 (18): 10113-9), involves the polymerization of a long chain of single-stranded DNA attached to the analyte (by for example, an antibody) from a circular DNA template. This technology makes it possible to minimize sample volumes and the use of expensive equipment (monoclonal antibodies and enzymes).
- signal amplification systems as another category of reagent in particular in the context of IFA and CLIA (eg biotin / avidin).
- the present invention also relates to a prenatal diagnostic kit for chromosomal abnormalities, comprising means suitable for carrying out one of the methods described above.
- the person skilled in the art is able to select, according to the assay and detection techniques which he wishes to use to implement the invention, the elements to be integrated into such a diagnostic kit: specific antibodies, secondary antibodies, aptamers, detection reagents (fluorescent compounds, enzymes, antibodies modified to use the RCA technology, etc.), etc. It can choose at least some of these elements from the elements mentioned above, and complete the kit, the case with the help of his general knowledge and reference books on the purification, the assay, or the detection of biological molecules.
- a prenatal diagnostic kit according to the invention may for example comprise specific antibodies and / or aptamers of one or more markers mentioned above.
- each antibody or aptamer is specific for a single marker.
- each solution is preferably specific for a single marker, or a group of associated markers (e.g., defensins HND-1, HND-2 and HND-3).
- anti-HND antibodies such as those marketed by Tebu-Bio SA (39 rue de Houdan, F-78612 Le Perray en Yvelines).
- 038NCL-DEFENSIN Anti-Neutrophil Defensin Mouse IgG1 Clone D21, 1 ml.
- a diagnostic kit comprises, for at least one of the markers of the invention, a set of non-overlapping specific antibodies, that is to say at least two antibodies capable of simultaneously recognizing the marker in question, which makes it possible to carry out immuno-reaction tests of the type "sandwich”.
- the antibodies in particular the so-called “capture” antibodies, can be immobilized on a support, and the so-called “detection” antibodies coupled to a molecule allowing the detection.
- capture antibodies can be immobilized on a support, and the so-called “detection” antibodies coupled to a molecule allowing the detection.
- detection antibodies coupled to a molecule allowing the detection.
- supports and molecules for detection usable in the context of the invention, are mentioned above.
- the samples were analyzed blinded or double-blind in the case-control studies (in order to avoid monitoring bias during analysis and attrition bias).
- Bovine Serum Albumin Serum Albumin C100-0005 Arg8-Vasopressin Somatatostatin Beta Chain of Bovine Insulin, Human Insulin, Hirudin BHVK C100-0002 Bovine insulin C100-0001 Beta-Bovine Lactoglobulin A, Horseradish peroxidase
- the samples are partially depleted in abundant proteins such as albumin or immunoglobulins.
- the transport proteins and the molecules associated with them are purified, thereby increasing the relative concentration of the molecules transported in the fraction of the sample analyzed.
- Raw or partially depleted or enriched samples are fractionated under native conditions by separation as a function of protein mass.
- Samples were prepared at different degrees of fractionation and purified by surface solid phase retention chromatography and / or liquid chromatography.
- biochemical properties specific to each protein are used in order to separate them from each other according to their apparent surface charges (ionic properties) and their hydrophobicity. In parallel, their relative concentration within the sample and / or the analyzed fraction of the sample is studied. Four different approaches are used:
- This chromatographic approach based on the use of silica, makes it possible to check the quality of a sample and to assess the relative concentration of a protein.
- the association is via arginines, lysines, serines and threonines.
- a positively charged functional group eg, quaternary amines
- anionic (negatively charged) character Two variable parameters are generally explored: the pH at which the incubation-association phase takes place and the degree of stringency of the eluent used.
- a negatively charged functional group eg, carboxylate group
- a known cationic character positively charged.
- anion exchange chromatography different experimental combinations are applied to the association and elution phases.
- Hydrophobic interactions release structured water surrounding hydrophobic sectors of biomolecules. This has the effect of increasing the entropy, making the thermodynamically favorable interactions. Chromatography using a carbon chain (for example: C 18 ) can be used. The association and elution conditions depend on the degree of hydrophobicity of the eluent used.
- Two experimental schemes were used for a targeted approach to protein purification.
- the biological characteristics of the proteins to be purified reveal the capacity of association with a metal ligand and / or chemical.
- the identity of the protein to be isolated is known, allows to use an immune strategy, thus using an antibody specific for the targeted protein.
- results from purification phases by liquid chromatography can be visualized directly during the various phases of elution of proteins by absorption spectroscopy, or indirectly, by electrophoretic mobility separation under denaturing conditions or by mass spectrometry.
- the different fractions of proteins from the fractionation and purification steps are denatured by the action of denaturants (detergents, etc.) and thermal degradation. Denatured proteins migrate into a porous phase (the gel) under electrostatic stress. Their physico-chemical characteristics (pI, mass, etc 7) ensure a good separation of the different products.
- the proteins are deposited on an active surface (SELDI mass spectrometry - Surface Enhanced Laser Desorption Ionization), or passive (MALDI mass spectrometry - Matrix Assisted Laser Desorption Ionization), associated with a chemical matrix allowing, under vacuum, their ionization by a laser beam. Once ionized, they are accelerated and directed under electrostatic stress to a detector placed at the end of a vacuum tube. The speed at which they reach the detector (TOF - Time of Flight) is proportional to the square root of their mass.
- the proteins are nebulized and then ionized under the action of an inert gas, passing through a very fine, highly charged needle.
- the analyzer is most often a "TOF" of the same type as for laser desorption mass spectrometry.
- the recordings and the analysis of the spectra are carried out according to different protocols, which depend on the surface and the apparatus (laser intensity, detector mass sensitivity, detector gain, deflector adjustment). These parameters are optimized according to the zone of the mass range to be analyzed.
- the standardization factors used are mainly Total Current Ion (TIC), some markers having a specific standardization.
- Figure 3 summarizes the different recording conditions, depending on the molecular weight of the proteins to be detected.
- the spectra and associated clusters are annotated according to two complementary procedures, one automatic, the other manual pertaining to the art of signal processing. The two procedures are then confronted with each other.
- the samples were either analyzed unfractionated native or analyzed fractionated according to the mass of proteins.
- the eluates were used either native or analyzed after albumin depletion or other transport proteins, and then separated and purified in two modes, one anionic, the other hydrophobic.
- a type analyzer SELDI-TOF mass spectrometer was used to acquire the spectral information.
- the spectra presented are obtained on anionic separating surface.
- the peaks of interest mentioned are present at pH 4 and at any pH value greater than 4, insofar as no protein aggregation or precipitation phenomenon occurs at basic pH.
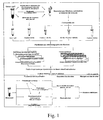
- FIG. 4 shows the experimental scheme that was used.
- the protein chips are inserted into the mass spectrometer or any other appropriate reading or sequencing apparatus.
- the protein chips are inserted into the mass spectrometer for reading according to the different intensities described above and in FIG. 3, or any other suitable reading device, optimized and adjusted accordingly.
- the skilled person will choose the intensity of the laser to allow the proteins to fly, depending on their mass, some of their physicochemical properties, and any interactions that they establish with partners.
- the antibodies used have been described above.
- Calibrators used on Normal Phase / Silicon Oxide and Maldi mode are as described in Table 3.
- Mass fractionation is intended to increase the relative protein concentration of a fraction relative to the total protein concentration without altering the absolute concentration of the separated proteins.
- albumin is normally found as a major element, and can be specifically deleted if necessary. This deletion was not performed in the experiments described here; the removal of albumin will detect an additional peak corresponding to ⁇ -fetoprotein, which is currently masked by the albumin peak.
- Vivaspin 500 type separators from the company Vivascience, with 3 distinct cut-off points: 10, 50 and 100 kDa.
- the separation by membrane filtration takes place in 1X PBS, pH 7.4, under non-denaturing conditions. All that passes through the membrane is of smaller mass than the cutoff threshold, all that remains in the dead volume above the membrane is mass greater than the cutoff threshold.
- the proteins remaining in the upper part of Vivaspin 500 with a cut-off threshold of 100 kDa therefore have a native mass> 100 kDa. This is also true of heterogeneous multimeric complexes as well as homogeneous ones.
- the Total Ion Current (TIC) normalization method allows for each spectrum to average the intensities, and adjusts the average intensities of each spectrum so that the data is normalized.
- the normalization parameters used corresponded to a "Total Ion Current" normalization starting at 3000, and ending at 20000, with subtraction of the baseline, a normalization coefficient of 0.269112, and without normalization to ground.
- Table 9 Standardization Report (Main Study - Anionic Separation) Sample name Normalization factor Used in standardization? With ICT Sample name Normalization factor Used in standardization?
- the calibration is made on insulin peaks (bovine) (5733.58 + 1H), and bovine insulin 2H + (2866.79 + 1H).
- the calibration equation used is m / Z quadratic: where m / z is the mass-to-charge ratio, U the voltage of the source and t the flight time.
- the clustering consists in grouping the value of the intensity of the peaks corresponding to this protein for all the recorded spectra.
- a cluster is therefore defined as a table returning the value of the intensity of the peak considered for each spectrum studied.
- Controls Controls ( Control ), DS ( Down Syndrome ) and ES ( Edward Syndrome ).
- the peaks are manually annotated.
- Calibration is done on insulin (bovine) peaks (5733.58 + 1H), and bovine insulin 2H + (2866.79 + 1H).
- the objective is to optimize the calibration zone between 2800 and 5750 Da.
- cytochrome C (bovine) is used to calibrate.
- ⁇ -lactoglobulin A (bovine) is used to calibrate.
- the choice of the calibrator does not influence the intensity values in any way. Their values do not vary according to the calibration used.
- the calibration makes it possible to increase the accuracy of the values of the masses of the peaks recorded, over a restricted spectral zone.
- Table 12 presents a list of calibrators that can be used, as well as their molecular weight.
- Table 12 Peptide / protein Molecular weight (Daltons) Arg 8-vasopressin 1084.2474 Human Angiotensin I 1296.5 [Glu 1 ] Fibrinopeptide B 1570.6 Somatatostatine 1637.9030 Porcine Dynorphin A (209-225) 2147.5 ACTH (1-24) human 2933.5 human ⁇ -endorphin 3465.0 ⁇ chain of bovine insulin 3495.9409 bovine insulin 5733.6 Human insulin 5807.6533
- the inventors have identified clusters of interest (referenced in Tables 13 and 14) in the data obtained from the spectra obtained (one spectrum per sample of the populations of the three control groups, DS (T21) and ES (T18), outside the group - 80 ° C, except for the special case of samples A7 and A15, recorded in triplicate in study E6).
- the number of manually annotated clusters is reduced according to the criterion "present in at least 30% of the spectral population".
- Table 13 Analytical Phase Summary Experiences Analysis area Cluster mode Number of clusters identified Number of clusters retained Number of Spectra Analyzed Anionic separation phase E6 4-20 kDa Manual 156 29 (18.6%) 40 Automatic 8 7 (87.5%) E1-E5 3-10 kDa Manual 40 39 (97.5%) 32 Automatic 6 6 (100%) Hydrophobic interaction E6 3-10 kDa Manual 140 31 (22.2%) 34 Automatic 17 17 (100%) 3-20 kDa Manual 164 54 (32.9%) 34 Automatic 35 34 (97.2%) Table 14: List of selected clusters CLUSTERS Anionic separation phase Hydrophobic interaction E6 Presence of a signal on frozen samples at -80 ° C E6 Cumulative E1-E5 PM3061 * + - PM3101 + + PM3156 + + PM3166 * + + PM3181 * + + PM3214 + + PM3223 + + PM3233 * + + PM3313 + + PM3320 + - + PM3321 + - PM3371 # + + + + PM3394 * +
- the clusters defined in Table 14 correspond to the markers in list (i) above.
- Table 15 shows an example of good reproducibility of the value of the TOF (and therefore of the actual mass observed) and the quality of the signal-to-noise ratio on Studies E1 to E6.
- Table 16 indicates for a few clusters observed during the E6 study experiments, the flight time (TOF), the p value of the cluster and for each group (Control, T21, T18) , the average, minimum and maximum intensities as well as the standard deviation on the intensity.
- FIG. 5 shows the spectra obtained in the spectral zone 3000-20000 Dalton, in global views, for the control group, the T21 group and the T18 group. Standardized spectra are superimposed by clinical category.
- Figures 6, 7 and 8 show, respectively, the spectral views (normalized and superimposed spectra by clinical category), the pseudo-gel views, and the shifted view spectra (study E6), centered on the area 4000 Da.
- Figures 9, 10 and 11 show, respectively, the spectral views (normalized and superimposed spectra by clinical category), the pseudo-gel views, and the offset-view spectra (study E6), centered on the 5000-6000 Da area. .
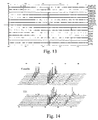
- Figures 12 to 14 show the spectra centered on the spectral area 3000-10000 Daltons, respectively in global views (standardized and superimposed spectra by clinical category), pseudo-gel view, and offset views (E1 to E5).
- Figure 15 shows the spectra centered on the 3000-4000 Dalton spectral zone (E1 to E5).
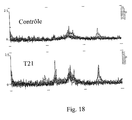
- Figures 16 to 18 show the spectra, normalized and superimposed by clinical category, respectively centered on the areas 4000-5000 Daltons, 5000-7000 Daltons, and 7000-10000 Daltons (Studies E1 to E5).
- Figures 27 to 30 show examples of intensity distribution statistics of different clusters for the control groups and T21.
- ROC Receiver Operating Characteristic
- Figure 31 shows the ROC curves for the molecular weight markers 3371, 3442, 3486, and 6423 Da.
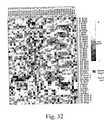
- Figure 32 shows the result of a build with the software Genecluster Version 1999 (Eisen M.) and Treeview Version 1.60 (Eisen M.) (Hierarchical classification on dataset of the study E6 (95% CI), Anionic Surface Q10).
- the software used is Stata SE 8 and software Ciphergen Express Version 1.0 software. Both software confirm the results.
- the eigenvalues confirm the presence and the molecular weight of the peaks identified as defensins whose masses are: PM3371, PM3442 and PM3486.
- results obtained for the peaks in the 3000 Dalton zone, on anionic surface Q10 are shown in Table 17. These three peaks are under-expressed or absent in the T21 group, reflecting a significant decrease in immunity, and expressed normally. or over-expressed in the control group. Further study of the results will determine the detection threshold for these three peaks, which are correlated and dependent, such that at least one negative sign among the three or one positive sign among the three signifies the disease or absence of disease, respectively.
- the results presented in Table 17 show a variability for these three peaks, mainly due to the fact that they were obtained with samples stored at -20 ° C, showing some degradation.
- Table 18 presents the results and applications for peaks in the 4000 - 9000 Dalton zone, on anionic surface Q10.
- Table 19 shows the results and applications for peaks in the 4000 -17500 Dalton area, on H50 hydrophobic surface.
- peptides have correlated biophysicochemical properties. They are present in a native fraction of the samples such that the mass of the products is between 50 and 100 kDa. It is therefore peptides associated with one or more proteins, such that the mass of the complexes thus formed is between 50 and 100 kDa.
- PM3442 - PM3371 71 Da ⁇ alanine (A)
- PM3486 - PM3371 115 Da ⁇ Aspartic acid (D)
- PM3486 - PM3442 44 Da ⁇ replacement of an aspartic acid (D) with alanine (A).
- HNPs Human Neutrophil Defensins
- Table 21 Amino acid sequence of ⁇ -Defensins (HNP-1, HNP-2 and HNP-3) names Sequence of amino acids Molecular Weight (Da) Difference from HNP-2 Defensin-2 human neutrophil - CYCR IPACIAGERRYGTCIYQGRLWAFCC 3371.01 - Defensin-1 human neutrophil ACYCR IPACIAGERRYGTCIYQGRLWAFCC 3442.09 AT Defensin-3 human neutrophil DCYCR IPACIAGERRYGTCIYQGRLWAFCC 3486.10 D
- peptides have correlated biophysicochemical properties. They are present in a native fraction of the samples such that the mass of the products is between 50 and 100 kDa as well as in a fraction of native mass greater than 100 kDa. They are thus peptides associated with several distinct proteins, such that the mass of the complexes thus constituted is between 50 and 100 kDa, or greater than 100 kDa.
- the mass peaks PM 3371, PM3442, PM 3486, identified as defensins are under-expressed in the T21 groups and over-expressed or normally expressed in the controls.
- the mass peaks PM 6423, PM 6439, PM6620, PM6636 are identified in pairs by hydrolysis of a proline to hydroxyproline (+16 Da).
Landscapes
- Chemical & Material Sciences (AREA)
- Life Sciences & Earth Sciences (AREA)
- Health & Medical Sciences (AREA)
- Proteomics, Peptides & Aminoacids (AREA)
- Organic Chemistry (AREA)
- Genetics & Genomics (AREA)
- Zoology (AREA)
- Analytical Chemistry (AREA)
- Wood Science & Technology (AREA)
- Engineering & Computer Science (AREA)
- Microbiology (AREA)
- Biochemistry (AREA)
- Biotechnology (AREA)
- Molecular Biology (AREA)
- Biophysics (AREA)
- Physics & Mathematics (AREA)
- Pathology (AREA)
- Immunology (AREA)
- Bioinformatics & Cheminformatics (AREA)
- General Engineering & Computer Science (AREA)
- General Health & Medical Sciences (AREA)
- Other Investigation Or Analysis Of Materials By Electrical Means (AREA)
- Investigating Or Analysing Biological Materials (AREA)
- Analysing Materials By The Use Of Radiation (AREA)
Priority Applications (4)
| Application Number | Priority Date | Filing Date | Title |
|---|---|---|---|
| EP04292013A EP1624074A1 (de) | 2004-08-06 | 2004-08-06 | Methoden und Marker zür Nachweiss pränataler chromosomaler Abnormalitäten |
| EP05795957A EP1776480A2 (de) | 2004-08-06 | 2005-08-08 | Methoden und marker zum nachweis pränataler chromosomaler abnormalitäten |
| PCT/FR2005/002053 WO2006021673A2 (fr) | 2004-08-06 | 2005-08-08 | Marqueurs et procedes pour le depistage prenatal d'anomalies chromosomiques |
| US11/573,244 US20080166708A1 (en) | 2004-08-06 | 2005-08-08 | Markers and Methods For Prenatal of Chromosal Alberrations |
Applications Claiming Priority (1)
| Application Number | Priority Date | Filing Date | Title |
|---|---|---|---|
| EP04292013A EP1624074A1 (de) | 2004-08-06 | 2004-08-06 | Methoden und Marker zür Nachweiss pränataler chromosomaler Abnormalitäten |
Publications (1)
| Publication Number | Publication Date |
|---|---|
| EP1624074A1 true EP1624074A1 (de) | 2006-02-08 |
Family
ID=34931330
Family Applications (2)
| Application Number | Title | Priority Date | Filing Date |
|---|---|---|---|
| EP04292013A Withdrawn EP1624074A1 (de) | 2004-08-06 | 2004-08-06 | Methoden und Marker zür Nachweiss pränataler chromosomaler Abnormalitäten |
| EP05795957A Withdrawn EP1776480A2 (de) | 2004-08-06 | 2005-08-08 | Methoden und marker zum nachweis pränataler chromosomaler abnormalitäten |
Family Applications After (1)
| Application Number | Title | Priority Date | Filing Date |
|---|---|---|---|
| EP05795957A Withdrawn EP1776480A2 (de) | 2004-08-06 | 2005-08-08 | Methoden und marker zum nachweis pränataler chromosomaler abnormalitäten |
Country Status (3)
| Country | Link |
|---|---|
| US (1) | US20080166708A1 (de) |
| EP (2) | EP1624074A1 (de) |
| WO (1) | WO2006021673A2 (de) |
Families Citing this family (8)
| Publication number | Priority date | Publication date | Assignee | Title |
|---|---|---|---|---|
| US7620889B2 (en) | 2004-12-20 | 2009-11-17 | Microsoft Corporation | Method and system for linking data ranges of a computer-generated document with associated extensible markup language elements |
| EP2401617A4 (de) * | 2009-02-24 | 2012-09-26 | Winton G Gibbons | Nachweis von komplexen aus tau und amyloid |
| EP3994295A1 (de) | 2019-07-05 | 2022-05-11 | Agfa-Gevaert N.V. | Separator für alkalische wasserelektrolyse |
| EP3933069A1 (de) | 2020-07-03 | 2022-01-05 | Agfa-Gevaert Nv | Separator für alkalische wasserelektrolyse |
| KR20260040470A (ko) | 2020-07-03 | 2026-03-24 | 아그파-게바에르트 엔.브이. | 물 전기분해를 위한 다공성 세퍼레이터 |
| JP2024525619A (ja) | 2021-07-08 | 2024-07-12 | アグフア-ゲヴエルト,ナームローゼ・フエンノートシヤツプ | アルカリ性水電解用セパレータ |
| KR20240018620A (ko) | 2021-07-08 | 2024-02-13 | 아그파-게바에르트 엔.브이. | 알칼리 수전해용 세퍼레이터 |
| EP4367290A1 (de) | 2021-07-08 | 2024-05-15 | Agfa-Gevaert Nv | Separator für alkalische wasserelektrolyse |
Citations (5)
| Publication number | Priority date | Publication date | Assignee | Title |
|---|---|---|---|---|
| US4931385A (en) * | 1985-06-24 | 1990-06-05 | Hygeia Sciences, Incorporated | Enzyme immunoassays and immunologic reagents |
| US5100806A (en) * | 1989-03-24 | 1992-03-31 | Macri James N | Method for detecting Edwards syndrome |
| US6492178B1 (en) * | 1999-01-12 | 2002-12-10 | Quest Diagnostic Investments, Incorporated | Methods of determining an increased risk of a woman carrying a downs syndrome affected fetus by measuring an analyte in a biological sample |
| US20030166913A1 (en) * | 1997-09-10 | 2003-09-04 | Zymogenetics, Inc. | Novel beta-defensins |
| US20040063134A1 (en) * | 2000-05-26 | 2004-04-01 | Yizhong Gu | Novel isoforms of human pregnancy-associated protein-E |
Family Cites Families (5)
| Publication number | Priority date | Publication date | Assignee | Title |
|---|---|---|---|---|
| CA2296022A1 (en) * | 1998-02-06 | 1999-08-26 | University Of Pittsburgh | Screening method for reproductive tract inflammation and preeclampsia using neutrophil defensins |
| AUPR749901A0 (en) * | 2001-09-06 | 2001-09-27 | Monash University | Method of identifying chromosomal abnormalities and prenatal diagnosis |
| NZ535044A (en) * | 2002-03-01 | 2008-12-24 | Ravgen Inc | Non-invasive method to determine the genetic sequence of foetal DNA from a sample from a pregnant female thereby detecting any alternation in gene sequence as compared with the wild type sequence |
| WO2004043238A2 (en) * | 2002-11-14 | 2004-05-27 | Ciphergen Biosystems, Inc. | Biomarkers for intra-amniotic inflammation |
| US8068990B2 (en) * | 2003-03-25 | 2011-11-29 | Hologic, Inc. | Diagnosis of intra-uterine infection by proteomic analysis of cervical-vaginal fluids |
-
2004
- 2004-08-06 EP EP04292013A patent/EP1624074A1/de not_active Withdrawn
-
2005
- 2005-08-08 US US11/573,244 patent/US20080166708A1/en not_active Abandoned
- 2005-08-08 WO PCT/FR2005/002053 patent/WO2006021673A2/fr not_active Ceased
- 2005-08-08 EP EP05795957A patent/EP1776480A2/de not_active Withdrawn
Patent Citations (5)
| Publication number | Priority date | Publication date | Assignee | Title |
|---|---|---|---|---|
| US4931385A (en) * | 1985-06-24 | 1990-06-05 | Hygeia Sciences, Incorporated | Enzyme immunoassays and immunologic reagents |
| US5100806A (en) * | 1989-03-24 | 1992-03-31 | Macri James N | Method for detecting Edwards syndrome |
| US20030166913A1 (en) * | 1997-09-10 | 2003-09-04 | Zymogenetics, Inc. | Novel beta-defensins |
| US6492178B1 (en) * | 1999-01-12 | 2002-12-10 | Quest Diagnostic Investments, Incorporated | Methods of determining an increased risk of a woman carrying a downs syndrome affected fetus by measuring an analyte in a biological sample |
| US20040063134A1 (en) * | 2000-05-26 | 2004-04-01 | Yizhong Gu | Novel isoforms of human pregnancy-associated protein-E |
Non-Patent Citations (3)
| Title |
|---|
| BECKER K., BRUETON L.A., MAINIE P., BANNON M.: "Behcet Disease in constitutional trisomy 8.", J. MED. GENET, vol. 38, 2001, pages S34, XP008043253 * |
| BENN P A: "Advances in prenatal screening for Down syndrome: I. General principles and second trimester testing", CLINICA CHIMICA ACTA 2002 NETHERLANDS, vol. 323, no. 1-2, 2002, pages 1 - 16, XP008043309, ISSN: 0009-8981 * |
| PETRAGLIA F ET AL: "Serum activin A and inhibitin A levels in pregnancies complicated by IUGR", HORMONE RESEARCH (BASEL), vol. 50, no. SUPPL. 3, September 1998 (1998-09-01), 37TH ANNUAL MEETING OF THE EUROPEAN SOCIETY FOR PAEDIATRIC ENDOCRINOLOGY; FLORENCE, ITALY; SEPTEMBER 24-27, 1998, pages 1, XP008043311, ISSN: 0301-0163 * |
Also Published As
| Publication number | Publication date |
|---|---|
| EP1776480A2 (de) | 2007-04-25 |
| WO2006021673A3 (fr) | 2006-04-20 |
| US20080166708A1 (en) | 2008-07-10 |
| WO2006021673A2 (fr) | 2006-03-02 |
Similar Documents
| Publication | Publication Date | Title |
|---|---|---|
| AU2022221445B2 (en) | Biomarkers and methods for predicting preterm birth | |
| US20240318250A1 (en) | Biomarker pairs for predicting preterm birth | |
| Nagalla et al. | Proteomic analysis of maternal serum in down syndrome: identification of novel protein biomarkers | |
| JP7285215B2 (ja) | 大腸がんを検出するためのバイオマーカー | |
| EP1799861A2 (de) | Diagnose einer fötalen aneuploidie | |
| US20230408530A1 (en) | Pregnancy clock proteins for predicting due date and time to birth | |
| US20250329468A1 (en) | Systems, devices, and methods for generating machine learning models and using the machine learning models for early prediction and prevention of preeclampsia | |
| US20190369109A1 (en) | Biomarkers for predicting preterm birth in a pregnant female exposed to progestogens | |
| Vasani et al. | Advances in the proteomics of amniotic fluid to detect biomarkers for chromosomal abnormalities and fetomaternal complications during pregnancy | |
| Zubair et al. | Contribution of proteomics in transplantation: identification of injury and rejection markers | |
| JP2024529555A (ja) | Nmosd予測または再発モニタリングのためのバイオマーカーおよびその用途 | |
| EP1776480A2 (de) | Methoden und marker zum nachweis pränataler chromosomaler abnormalitäten | |
| WO2024197021A1 (en) | Assays for characterization of extracellular vesicles and methods of using the same | |
| WO2020163591A1 (en) | Compositions and methods for characterizing pancreatic ductal adenocarcinoma | |
| HK40107594A (en) | Biomarker pairs for predicting preterm birth | |
| JP2025508428A (ja) | バイオマーカーパネルおよび妊娠高血圧腎症の予測方法 | |
| Kolla | Identification of Screening Biomarkers for Chromosomal Anomalies and Pregnancy-related Disorder Using Quantitative Plasma Proteomics | |
| HK1254669B (en) | Biomarker pairs for predicting preterm birth |
Legal Events
| Date | Code | Title | Description |
|---|---|---|---|
| PUAI | Public reference made under article 153(3) epc to a published international application that has entered the european phase |
Free format text: ORIGINAL CODE: 0009012 |
|
| AK | Designated contracting states |
Kind code of ref document: A1 Designated state(s): AT BE BG CH CY CZ DE DK EE ES FI FR GB GR HU IE IT LI LU MC NL PL PT RO SE SI SK TR |
|
| AX | Request for extension of the european patent |
Extension state: AL HR LT LV MK |
|
| RAP1 | Party data changed (applicant data changed or rights of an application transferred) |
Owner name: TYCOON R & D LTD |
|
| AKX | Designation fees paid | ||
| REG | Reference to a national code |
Ref country code: DE Ref legal event code: 8566 |
|
| STAA | Information on the status of an ep patent application or granted ep patent |
Free format text: STATUS: THE APPLICATION IS DEEMED TO BE WITHDRAWN |
|
| 18D | Application deemed to be withdrawn |
Effective date: 20060809 |