EP1652475B1 - Dispositif ultrasonographique et procede ultrasonographique - Google Patents
Dispositif ultrasonographique et procede ultrasonographique Download PDFInfo
- Publication number
- EP1652475B1 EP1652475B1 EP04745943.3A EP04745943A EP1652475B1 EP 1652475 B1 EP1652475 B1 EP 1652475B1 EP 04745943 A EP04745943 A EP 04745943A EP 1652475 B1 EP1652475 B1 EP 1652475B1
- Authority
- EP
- European Patent Office
- Prior art keywords
- signals
- ultrasonic
- frequency
- data
- processed signals
- Prior art date
- Legal status (The legal status is an assumption and is not a legal conclusion. Google has not performed a legal analysis and makes no representation as to the accuracy of the status listed.)
- Expired - Lifetime
Links
- 238000000034 method Methods 0.000 title description 18
- 238000003384 imaging method Methods 0.000 claims description 48
- 238000006073 displacement reaction Methods 0.000 claims description 40
- 230000005540 biological transmission Effects 0.000 claims description 35
- 230000015572 biosynthetic process Effects 0.000 claims description 30
- 238000003786 synthesis reaction Methods 0.000 claims description 30
- 239000000523 sample Substances 0.000 claims description 28
- 230000001427 coherent effect Effects 0.000 claims description 20
- 238000002156 mixing Methods 0.000 claims description 5
- 230000004044 response Effects 0.000 claims description 5
- 230000008859 change Effects 0.000 claims description 4
- 238000001514 detection method Methods 0.000 description 53
- 238000012545 processing Methods 0.000 description 22
- 238000010586 diagram Methods 0.000 description 13
- 239000002932 luster Substances 0.000 description 10
- 230000006872 improvement Effects 0.000 description 9
- 150000001875 compounds Chemical class 0.000 description 7
- 238000005070 sampling Methods 0.000 description 7
- 238000004088 simulation Methods 0.000 description 6
- 230000000694 effects Effects 0.000 description 4
- 230000006870 function Effects 0.000 description 4
- 230000001902 propagating effect Effects 0.000 description 4
- 230000015556 catabolic process Effects 0.000 description 3
- 230000007547 defect Effects 0.000 description 3
- 238000006731 degradation reaction Methods 0.000 description 3
- 230000002194 synthesizing effect Effects 0.000 description 3
- 210000004204 blood vessel Anatomy 0.000 description 2
- 238000012937 correction Methods 0.000 description 2
- 238000003745 diagnosis Methods 0.000 description 2
- 239000000463 material Substances 0.000 description 2
- 230000008569 process Effects 0.000 description 2
- 239000007787 solid Substances 0.000 description 2
- 238000012546 transfer Methods 0.000 description 2
- 238000002604 ultrasonography Methods 0.000 description 2
- 238000013329 compounding Methods 0.000 description 1
- 238000007796 conventional method Methods 0.000 description 1
- 230000001419 dependent effect Effects 0.000 description 1
- 238000011161 development Methods 0.000 description 1
- 201000010099 disease Diseases 0.000 description 1
- 208000037265 diseases, disorders, signs and symptoms Diseases 0.000 description 1
- 239000002184 metal Substances 0.000 description 1
- 229910052751 metal Inorganic materials 0.000 description 1
- 239000000203 mixture Substances 0.000 description 1
- 230000002093 peripheral effect Effects 0.000 description 1
- 239000000843 powder Substances 0.000 description 1
- 238000002360 preparation method Methods 0.000 description 1
- 238000001308 synthesis method Methods 0.000 description 1
- 238000012285 ultrasound imaging Methods 0.000 description 1
- 210000001835 viscera Anatomy 0.000 description 1
Images



Classifications
-
- A—HUMAN NECESSITIES
- A61—MEDICAL OR VETERINARY SCIENCE; HYGIENE
- A61B—DIAGNOSIS; SURGERY; IDENTIFICATION
- A61B8/00—Diagnosis using ultrasonic, sonic or infrasonic waves
-
- G—PHYSICS
- G01—MEASURING; TESTING
- G01S—RADIO DIRECTION-FINDING; RADIO NAVIGATION; DETERMINING DISTANCE OR VELOCITY BY USE OF RADIO WAVES; LOCATING OR PRESENCE-DETECTING BY USE OF THE REFLECTION OR RERADIATION OF RADIO WAVES; ANALOGOUS ARRANGEMENTS USING OTHER WAVES
- G01S15/00—Systems using the reflection or reradiation of acoustic waves, e.g. sonar systems
- G01S15/88—Sonar systems specially adapted for specific applications
- G01S15/89—Sonar systems specially adapted for specific applications for mapping or imaging
- G01S15/8906—Short-range imaging systems; Acoustic microscope systems using pulse-echo techniques
- G01S15/8995—Combining images from different aspect angles, e.g. spatial compounding
-
- G—PHYSICS
- G01—MEASURING; TESTING
- G01S—RADIO DIRECTION-FINDING; RADIO NAVIGATION; DETERMINING DISTANCE OR VELOCITY BY USE OF RADIO WAVES; LOCATING OR PRESENCE-DETECTING BY USE OF THE REFLECTION OR RERADIATION OF RADIO WAVES; ANALOGOUS ARRANGEMENTS USING OTHER WAVES
- G01S7/00—Details of systems according to groups G01S13/00, G01S15/00, G01S17/00
- G01S7/52—Details of systems according to groups G01S13/00, G01S15/00, G01S17/00 of systems according to group G01S15/00
- G01S7/52017—Details of systems according to groups G01S13/00, G01S15/00, G01S17/00 of systems according to group G01S15/00 particularly adapted to short-range imaging
- G01S7/52077—Details of systems according to groups G01S13/00, G01S15/00, G01S17/00 of systems according to group G01S15/00 particularly adapted to short-range imaging with means for elimination of unwanted signals, e.g. noise or interference
Definitions
- the present invention relates to an ultrasonic imaging device used for medical diagnosis or other purposes, and more specifically to a technique for obtaining a high quality tomographic image referred generally to as a compound scan image displayed as one image by synthesizing image signals obtained by scanning a scanned object from various angles.
- the ultrasonic imaging device brings an ultrasonic probe into contact with a surface of a scanned object, transmits ultrasonic waves to the object from the probe, receives reflected waves (echo signals) from the inside of the object, and displays tomographic images showing a state of various sections of the object based on the echo signals, which are used for medical diagnosis or other purposes.
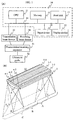
- FIG. 1(A) is a view illustrating the general configuration of an ultrasonic imaging device.
- Reference numeral 10 indicates an control unit such as a personal computer.
- Designated at reference numeral 11 is a CPU, at 12 a memory, at 13 a hard disk, at 21 an input device, and at 22 a display device.
- the devices are connected to each other through a bus 14 for delivery of various types of information between the devices.
- the hard disk 14 stores therein various types of programs and data required for operations of the ultrasonic imaging device, and the programs and data are read out according to the necessity and stored in the memory 12, and used for operations under control by the CPU 11.
- the input device is a keyboard, a mouse, or the like, and is used for receiving set-up information required by a user of the ultrasonic imaging device or for outputting operation signals.
- Various screens including necessary operation screens or a screen showing the results of imaging are displayed on the display device 13.
- Reference numerals 23 and 24 indicate a transmission beam former and a receiving beam former respectively, which are connected to the bus 14 of the control unit 10. Moreover, the transmission beam former 23 and receiving beam former 24 are connected via a transmission/receiving separator 31 to a ultrasonic probe 32.
- the transmission beam former 23 generates an ultrasonic transmission signal corresponding to a digital signal delivered from the control unit 10 and sends the ultrasonic transmission signal via the transmission/receiving separator 31 to the ultrasonic probe 32 so that an ultrasonic signal corresponding to a program corresponding to the user's operation signal is transmitted from the ultrasonic probe 32.
- a signal corresponding to the received ultrasonic signal is transmitted via the transmission/receiving separator 31 to the receiving beam former 24.
- the receiving beam former 24 subjects the signal to required processing such as digitalization and sends the processed signal to the control unit 10.
- the control unit 10 processes the received signal with a program appropriate for the object of imaging, and displays a result of imaging on the display device 13.
- FIG. 1(B) illustrates an example of the ultrasonic probe 32, and in this example, n sets of transducer elements 1-1, 1-2, and 1-3 are arrayed in a linear state in parallel to each other.
- wiring is provided for the transducer elements for transmitting a transmission signal from a transmission beam former 23 and also a signal corresponding to a reflected wave from the inside of the object detected by each transducer element to a receiving beam former 24.
- the ultrasonic probe 32 is an acoustic matching layer 5 made of, for instance, a mixture of metal powder and polymeric materials and an acoustic lens also made of polymeric materials for effectively bringing the transducer elements into contact with the scanned object for efficient transaction of ultrasonic signals with the scanned body.
- the focus depth, direction of irradiation and amplitude of the ultrasound irradiated from the ultrasonic probe 32 can be controlled freely, that is, the depth and direction can be controlled as indicated by F 1 - F 1 and F 2 - F 2 .
- control can be provided so that the beam is oriented to the direction A, B, or C on the focus line F 1 - F 1 .
- the ultrasonic probe 32 has a handle to be grasped by a user.
- the configuration of the ultrasonic probe 32 is not limited to the example shown in FIG. 1(B) , and for any purpose of imaging, the ultrasonic probe 32 may have various forms, for example, in which a plurality of transducer elements are arranged at equal intervals in a linear, curved or planar manner.
- a linear scan type of ultrasonic imaging device forms an aperture by selecting a group of transducer elements driving simultaneously with the preset aperture selecting function, and moves the aperture by and by to scan the inside of a sample or an object with a ultrasonic beam.
- the convex scan type of ultrasonic imaging device works similarly.
- a second merit is to be largely effective in removing speckles causing degradation of the contrast resolution. Since images picked up from substantially different angular directions have different speckle patterns, the signal amplitude for a section corresponding to the reflecting section of the scanned object itself increases due to the effect of addition, while the speckle patterns increase only in proportion to a root of the sum. When it is assumed that a number of added factors is N, therefore the contrast resolution is improved in proportion to a root of N.
- Improvement of the contrast resolution as described above can be realized since image synthesis is carried out by converting RF signals to envelop e curve signals to make the signals incoherent and then adding the signals. To describe it from the contrary viewpoint, since the signals are made incoherent and then added, improvement of spatial resolution like in the case of addition of coherent signals cannot be expected.
- WO 03/022153 A1 discloses an ultrasonographic apparatus and a corresponding method capable of increasing the S/M ratio of a compound image, since envelope detection is conducted after the echo signals of the ultrasonic transmissions have been synthesized.
- US 6 464 638 B1 discloses a related ultrasound imaging system.
- US 6 511 426 B1 discloses an ultrasonic imaging device using compounding of ultrasonic data of a number of two-dimensional image frames each having a different elevation in order to reduces speckles of ultrasound images.
- An internal organ of a human body as an object for ultrasonic imaging is not a solid body, and deforms differently from place to place. Therefore, it is difficult to perform idealistic correction for the entire image. Furthermore, influence of positional displacement between synthesized images in the synthetic aperture method is different from that in the compound imaging.
- the desire is to realize improvement of contrast resolution and improvement of spatial resolution at the same time and also to realize an imaging method in which an image is little degraded due to movement of a scanned object.
- a transfer function of the ultrasonic probe 32 is equivalent to a width of several waves on the time axis because the width is limited in the frequency space.
- influence by a transfer function of the ultrasonic probe 32 occurs twice because of transmission of ultrasonic signal waves from the ultrasonic probe 32 and receiving of ultrasonic waves reflected by a scanned body with the ultrasonic probe 32, and therefore a width of the envelop e is in the range from about 2 to 4 waves.
- influence caused by movement of a scanned object in the coherent case is around 10 times larger than that in the incoherent case.
- T he present invention provides the ultrasonic imaging device according to claim 1 and the ultrasonic imaging method according to claim 2.
- I t is not aimed to perfectly correct a local displacement, and correction is carried out based on the large scale displacement rate. That is to say, when a displacement is small (for instance, smaller than a quarter of a wavelength), signal synthesis is executed based on RF data, and when the displacement is larger, the signal synthesis is carried out based on the envelop e detection signals.
- a degree of each displacement can be determined on recognition of correlation of RF data between images in different frames.
- any of signal synthesis based on RF data and signal synthesis of envelop e detection signals can be selected freely by controlling a reference frequency for heterodyne detection.
- FIGS. 1(A) and 1(B) Each embodiment of the present invention is realized by an ultrasonic imaging device having a control unit as shown in FIGS. 1(A) and 1(B) .
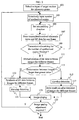
- FIG. 2 is a flow chart illustrating a signal processing flow in the ultrasonic imaging device according to a first example of the present invention.
- Reference numeral 101 indicates a preparation step, in which data such as a type of an ultrasonic probe to be used and codes indicating objective portions of an object to be imaged is inputted through an input device 21.
- Reference numeral 103 indicates a step of specifying the number of image frames to be synthesized for the target portions of the scanned object, in which the data is inputted through the input device 21.
- the number of frames to be synthesized is at least 3 or more.
- the number of frames may be in the range from 7 to around 15. As the number of frames to be synthesized increases, effects of image synthesis and defects caused by synthesis increase, and therefore the number of frames should preferably be determined according to an object to be imaged (movement of the object to be imaged).
- Reference numeral 105 indicates a step for setting a direction in which ultrasonic waves are to be transmitted toward a target portion for imaging, in which the data is inputted via the input device 21.
- the data corresponds to the number of frames to be synthesized, specified in step 103, and the data may automatically be set by a program in response to the number of frames already imaged.
- the direction of transmitting ultrasonic waves as used herein indicates each of the different directions A, B, and C transmitted on the plane of the focus F 1 - F 1 .
- the directions are shown as a square A schematically shown with a solid line, a square B shown with a dot and chain line, and a square C shown with a broken line. That is to say, the squares A, B, and C schematically show the state in which a scanned object is linearly scanned by transmitting ultrasonic beams at the same focus depth and at different angles.
- the reference numeral 107 indicates a step of transmitting and receiving ultrasonic waves for one frame and storing RF data.
- an ultrasonic wave pulse signal corresponding to a program for the target portion to be imaged is generated by the CPU 11.
- the signal is converted by the transmission beam former 23 to a signal given to transducer elements in the ultrasonic probe 32.
- the converted signal is then given via the transmission/receiving separator 31 to the transducer elements in the ultrasonic probe 32.
- the ultrasonic signal reflected from the target portion for imaging is received and converted to an electric signal by transducer elements in the ultrasonic probe 32, and the electric signal is given to the receiving beam former 24 via the transmission/receiving separator 31.
- the electric signal is converted to a digital signal and subjected to phase-aligned addition between channels, and is stored as RF data in the memory 12.
- Reference numeral 109 indicates a step of evaluating the number of frames already imaged, in which a check is made as to whether or not RF data for transmitted/received signals has been stored by the number of frames specified in step 103.
- step 103 When it is determined that RF data has not been stored by the number of frames specified in step 103, the processing returns to step 105, in which the RF data for transmitted and received ultrasonic signals for one frame in the next signal transmitting direction is stored.
- step 108 When it is determined in step 108 that the number of frames already imaged has been stored by the number specified in step 103, the processing proceeds to data assessment.
- Reference numeral 111 indicates a step of computing correlation of RF data between images for different frames.
- image data for the respective frames stored in the memory 12 are sequentially read out to compute the correlation.
- an amount of displacement and an amount of deformation are computed by especially checking a specified reflecting portion of a scanned object in each ultrasonic wave transmitting direction on the basis of image data for each frame.
- Reference numeral 113 indicates a step of checking whether or not a deformation rate between images for different frames is greater than a preset value. That is to say, when it is determined that the correlation of RF data between images for different frames computed in step 111 is smaller than the preset value, the RF data for each frame stored in the memory 12 is subjected to envelop e detection (step 115), and data synthesis is carried out between images of the different frames based on the data after the envelop e detection (step 117).
- step S121 When the correlation value of RF data between images for different frames is greater than the preset value, data synthesis is carried out between images for different frames based on the RF data for each frame stored in the memory 12 (step 121), and the synthesized RF data is subjected to envelop e detection (step S121).
- Reference numeral 123 indicates an image display step, in which an image satisfying requirements of a particular program is displayed on the display device 22 based on either one of the data obtained in step 117 or data in step 121.
- Reference numeral 125 indicates a step of determining whether or not adjustment of the image quality is required. For instance, in the image display step 123, the question of "data re-acquisition required?" and “YES”, "NO" switches are displayed at a portion of the screen. When the user is not satisfied with the image displayed on the display device 22 and selects "YES”, the processing returns to step 103, and the processing flow is again executed from the necessary setup process. When the user selects "NO", imaging is finished.
- the conditions for acquiring RF data of transmitted and received ultrasonic signals are changed, for instance, by increasing the number of synthesized images, or by making a change rate of a signal transmitting direction minuter.
- imaging is continued and the screen is continuously updated unless the imaging stop button is pressed. Because of the feature, even when a screen display of inquiring the necessity of data acquisition is not provided, the user can change the setup according to each image or reflect the changed conditions to imaging next time.
- influence of displacement of target portions included in a scanned object over synthesized signals largely varies between a case of coherent signals such as RF signals and a case of incoherent signals such as envelop e detection signals.
- in coherent signals when the displacement is equal to a half of the wavelength or more, the signals cancel each other completely, and the influence can be ignored only when the displacement is not greater than a quarter of the wavelength.
- canceling never occurs, and therefore the influence is small when the displacement is not greater than a width of the envelop.
- step 111 correlation of RF data between images for different frames is computed in step 111, and whether a deformation between images for different frames is larger than a preset value or not is determined in step 113.
- the signal processing is carried out based on incoherent signals giving smaller influence due to displacement between images for different frames.
- displacement of a target position of a scanned object between images for different frames is smaller than the preset value, the signal processing is carried out based on coherent signals.
- I k i,j indicates brightness of a pixel located at the i-th position in the depth direction and j-th position in the horizontal direction in the frame number k
- a k i,j indicates an amplitude of an RF signal at the same position.
- the deformation vector V k i,j based on correlation between two frames at the pixel ij is computed through equations (1) and (2) below.
- the correlation Cr(k, K+1) is computed through equation (1) below:
- C r k , k + 1 A i ⁇ w ⁇ 1 2 , j k ⁇ A i + w ⁇ 1 2 , j k * A i ⁇ w ⁇ 1 2 , j k + 1 ⁇ A i + w ⁇ 1 2 , j k + 1
- C r k k A i ⁇ w ⁇ 1 2 , j k ⁇ A i + w ⁇ 1 2 , j k * A i ⁇ w ⁇ 1 2 , j k ⁇ A i + w ⁇ 1 2 , j k ⁇ A i + w ⁇ 1 2 , j k ⁇ A i + w ⁇ 1 2
- a local deformation is treated as a one-dimensional program only in the depth direction although the local deformation relates to a two-dimensional vector.
- the reason is that, because point responses based on transmitted and received ultrasonic pulses are distributed in a narrow area along the depth direction and in a wide direction along the azimuth direction, sampling is executed more finely as compared to the Nyquist frequency of the RF signal wave along the depth direction and more roughly along the azimuth direction.
- the sampling interval in the depth direction is 15 ⁇ m.
- the sampling interval in the azimuth direction is generally equivalent to the element pitch or around a half of the element pitch. Therefore, assuming that the element width is around a half of the central frequency, when the central frequency is 3 MHz, the sampling pitch is around 125 ⁇ m, which is about 10 times larger than that in the depth direction. Because of it, when the frame rate is fully higher as compared with a velocity of the scanned object, the deformation may be measured only in the depth direction.
- a window is set for computing correlation for the following two reasons.
- the first reason is that, when all of data for one luster is used out all at once, it is disadvantageous for scanning an object such as a living thing which can not be treated as a solid object, because the deformation varies according to the depth.
- correlation is computed between images picked up from different angular directions, and therefore, when a luster is compared to another luster, places can not be matched with each other in the depth direction.
- a limit is introduced for a window width, it is possible to prevent a luster from being overlapped on another luster within a range of the window.
- the obtained data may be used as a deformation rate as it is.
- the influence by noises is large, however, it is also possible to execute the processing by replacing the value with an average value with, for instance, a low-pass spatial filter.
- the two-dimensional deformation may be computed by computing a two-dimensional deformation based on the two-dimensional correlation including the azimuth direction, or by integrating the values luster by luster in the depth direction, computing the deformation in the azimuth direction based on correlation of integrated patterns for different frames, and combining the deformation with that in the depth direction described before.
- FIG. 6(A) is a diagram plotted with a displacement between images for frames along the horizontal axis and selection between addition of RF data and envelope detection executed according to the displacement along the vertical axis.
- the threshold value for a displacement between images for different frames is a quarter of a wavelength of the ultrasonic wave with the central frequency ⁇ 0 .
- the signal processing is executed by envelop e detection, namely based on the incoherent signals.
- the signal processing is carried out by executing addition based on the RF data and then by envelop e detection, namely based on the coherent signals.
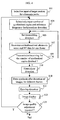
- FIG. 3 is a flow chart illustrating a signal processing flow in an ultrasonic imaging device according to the embodiment of the present invention.
- the same reference numbers are assigned to the corresponding steps in FIG. 2 .
- a type of a ultrasonic probe to be used and a target portion of a scanned object are set (step 101), the number of frames to be imaged for image synthesis is specified (step 103), a ultrasonic signal wave transmission direction toward each target portion to be imaged is set (step 105), RF data for transmitted and received ultrasonic signal waves for one frame is stored (step 107), the number of imaged frames is checked (step 109), and the processing sequence is repeated until the number of imaged frames reaches the number of frames specified in step 103. Then correlation of RF data between images for different frames in step 111 is computed.
- Reference numeral 114 indicates a step of setting the reference frequency ⁇ 1 for heterodyne detection
- reference numeral 116 indicates a step of executing the heterodyne direction corresponding to the set reference frequency ⁇ 1
- Reference numeral 118 indicates a step of receiving a result of detection in step 116 and synthesizing data after detection of images for different frames.
- the image display in step 123 and image quality adjustment in step 125 are the same as those described in the first example.
- FIG. 6(B) illustrates an example of setup curve for setting the reference frequency ⁇ 1 for heterodyne detection in step 114.
- This diagram is plotted with the horizontal axis indicating a displacement between images for different frames with respect to a wavelength of ultrasonic wave with the central frequency ⁇ 0 of the ultrasonic wave and also with the vertical axis indicating a ratio of a frequency after mixing corresponding to the reference frequency determined in response to each displacement to the central frequency ⁇ 0 of the ultrasonic wave.
- a quarter of a wavelength of ultrasonic wave with the central frequency ⁇ 0 is used as a threshold value for the displacement between images for different frames.
- the reference frequency for heterodyne detection is the same as the central frequency ⁇ 0 of the ultrasonic wave.
- the reference frequency is set to the frequency after mixing shown in FIG. 6(B) .
- the reference frequency is selected according to the degree of difference.
- heterodyne detection based on the RF data is carried out, and then the signal processing is executed by envelop e detection, namely based on the coherent signals.
- the reference frequency ⁇ 1 is set to a value equal to the central frequency ⁇ 0 of the ultrasonic wave to execute homodyne detection.
- RF data for the received ultrasonic waves is transformed into in coherent signals, and imaging is carried out by envelop detection.
- the reference frequency ⁇ 1 is set to a value different from the central frequency ⁇ 0 of the ultrasonic wave to execute heterodyne detection.
- FIG. 5(A) is a schematic diagram illustrating three beam propagating directions A, B and C different from each other received by the transmitting/receiving transducer 32.
- FIG. 5(B) is a diagram showing beam patterns of RF signals in the beam propagating directions received by the transmitting/receiving transducer 32.
- FIG. 5(C) is a diagram illustrating beam patterns after envelop detections for RF signals received by the transmitting/receiving transducer 32.
- FIG. 5(B) is compared to FIG. 5(C) , only the intensity signals are strongly displayed and the phase signals are hard to be recognized visually in the beam patterns after envelop e detection.
- FIG. 7 illustrates distribution of ultrasonic signal intensities after beam patterns are obtained by executing envelope detection for the beams in the different three directions A, B, and C as shown in FIG. 5(B) and then synthesizing the beam patterns shown in FIG. 5(C) . That is, the horizontal direction indicates a spread of ultrasonic signal waves, and the vertical direction indicates the focus depth.
- FIG. 7 illustrates a case in which the transmitting/receiving transducer 32 is focused to a position with the depth of 50 mm and the spread is ⁇ 2 degrees at the focus position.
- the lines extending along the vertical axis indicate a contour of ultrasonic signal intensities.
- the RF signal as shown in FIG. 5(B) can be expressed as a time function F(t) by equation (3) below:
- F t A t sin ⁇ 0 wherein ⁇ 0 indicates a central frequency of the ultrasonic wave signal, and A(t) indicates the envelop e .
- homodyne detection as a specific variant of the heterodyne detection for detecting the envelop e expressed by F(t).
- image synthesis can be executed with the incoherent signals obtained after the envelop detection described in the first example. Specifically, as shown in FIG. 6(B) , image synthesis is executed based on the RF signals, namely coherent signals only when a displacement between images for different frames is a specific value (a quarter of a wavelength of the ultrasonic signal with the central frequency in the figure).
- the reference frequency ⁇ 1 after heterodyne detection is set to a value different from the central frequency ⁇ 0 of the ultrasonic signal as shown in the figure based on the correlation between RF data as a parameter.
- the coherent signals can be changed successively to incoherent signals, and image synthesis based on both the incoherent signals and coherent signals can be realized.
- FIG. 8 illustrates how the distribution of ultrasonic wave intensities shown in FIG. 7 changes with reference to the cases in which the central frequency ⁇ 0 of ultrasonic wave is set to 2 MHz and the frequency ⁇ 1 of the reference wave is set to 2 MHz, 1 MHz, 0 MHz, and -1 MHz.
- FIG. 8(A), FIG. 8(B), FIG. 8(C), and FIG. 8(D) show examples of beam patterns indicating the results of heterodyne detection when the frequency ⁇ 1 of the reference wave is set to 2 MHz, 1 MHz, 0 MHz, and -1 MHz.
- the beam pattern is thinner (with small spread), the spatial resolution in the azimuth direction is higher, and as the side lobe is stronger, speckle patterns are generated more strongly with the contrast resolution degraded.
- FIG. 8(A) shows a case where the frequency ⁇ 1 of the reference wave is 2 MHz, that is, the frequency after mixing with the reference wave and passing through the low pass filter (a frequency after heterodyne detection) is 0 MHz, and this case corresponds to the envelop e detection described in relation to step 115 in the first example.
- the contrast resolution is the highest
- the spatial resolution is the lowest.
- FIG. 8(C) shows a case where the frequency ⁇ 1 of the reference wave is 0 MHz, that is, the frequency after heterodyne detection is 2 MHz, and therefore this case corresponds to detection of received RF signals, in other words to the envelop e detection after synthesis of RF data in step 119 in the first example .
- FIG. 8(C) shows a case where the frequency ⁇ 1 of the reference wave is 0 MHz, that is, the frequency after heterodyne detection is 2 MHz, and therefore this case corresponds to detection of received RF signals, in other words to the
- FIG. 8(B) shows a case where the frequency ⁇ 1 of the reference wave is 1 MHz, that is, the frequency after heterodyne detection is 1 MHz, and therefore an intermediate state between those shown in FIGS. 8(A) and 8(C) is obtained.
- FIG. 8(D) shows a case where the frequency ⁇ 1 of the reference wave is -1 MHz, that is, the frequency after heterodyne detection is 3 MHz (the reference wave has a phase reverse to that shown in FIG. 8(B) ), and in this case, the spatial resolution is highest, and the contrast resolution is low.
- FIGS. 9 and 10 show examples of screens displaying the image after synthesis.
- FIG. 9(A) shows an example of a result of simulation for an image obtained through steps 115 and 117 shown in FIG. 2
- FIG. 9(B) shows an example of a result of simulation for an image obtained through steps 119 and 120 shown in FIG. 2
- This case shows an example of a result of simulation for imaging a portion of a human body in which a blood vessel not reflecting ultrasonic waves is present with the size of 5 cm x 5 cm.
- a black portion at a central lower section corresponds to the blood vessel, while the peripheral portion corresponds to the body.
- White dots on the left side and in the upper edge section are images of dot-like reflecting bodies.
- the image obtained by synthesis in the state of RF signals in FIG. 9(B) shows the higher spatial resolution.
- FIGS. 10(A) to 10(D) show examples of images corresponding to those shown in FIGS. 8(A) to (D) , respectively, which are results of simulation executed in the same way as shown in FIGS. 9(A) and 9(B) .
- FIG. 10(A) shows a case in which the frequency ⁇ 1 of the reference wave is 2 MHz as with the case shown in FIG. 9(A) corresponding to the envelop e detection described above.
- FIG. 10(C) shows a case in which the frequency of the reference wave is 0 MHz, and this case corresponds to detection of received RF signal which is the same as the envelop e detection shown in FIG. 9(B) after synthesis of RF data in step 119 in the first example.
- FIG. 10(A) shows a case in which the frequency ⁇ 1 of the reference wave is 2 MHz as with the case shown in FIG. 9(A) corresponding to the envelop e detection described above.
- FIG. 10(C) shows a case
- FIG. 10(B) shows case in which, as with the case shown in FIG. 8(B) , the frequency ⁇ 1 of the reference wave is 1 MHz, and therefore a result indicating an intermediate state between those shown in FIGS. 10(A) and 10(C) is obtained.
- FIG. 10(D) shows a case in which, as with the case shown in FIG. 8(D) , the frequency ⁇ 1 of the reference wave is -1 MHz (the reference wave has a phase reverse to that shown in FIG. 7(B) ), and therefore the spatial resolution is the most excellent, while the contrast resolution is low.
- FIG. 4 is a flow chart illustrating a signal processing flow in an ultrasonic imaging device according to a second example of the present invention.
- the same reference numerals are assigned to the steps of executing the same processing steps shown in FIG. 2 or 3 .
- a reference frequency for heterodyne detection is automatically selected according to correlation of RF data between images for different frames (step 114).
- a user can change the reference frequency for heterodyne detection based on the user's policy in step 104, which is the only difference from the second embodiment.
- Other processing steps are the same as those shown in the processing flow shown in FIG. 3 .
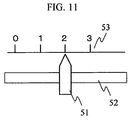
- FIG. 11 shows an appearance of an input device operated by a user in step 104 in the second example.
- Reference numeral 51 indicates an operation button, which can be moved in the horizontal direction along a travel guide 52.
- Reference numeral 53 indicates a display section.
- a volume type of operation button which can linearly be moved is shown.
- the displays 0 - 3 indicate positions for specifying the reference frequencies for obtaining images corresponding to FIGS. 10 (A) to (D) , respectively.
- operation of the operation button 51 indicates setting of the reference frequency ⁇ 1 for heterodyne detection corresponding to FIG. 6(B) .
- the user can accumulate knowledge as to how the obtained image changes according to an object or a disease to be checked through experiences, so that the user can determine which of the contrast resolution and spatial resolution should come first case by case.
- the number of images to be synthesized is three, but the number may be made larger. In this case, it is possible to synthesize a coherent image using a portion of the images and synthesize an incoherent image using the remaining images, and also to obtain an image by mixing the coherent and incoherent images.
- the present invention enables an improvement in spatial resolution by synthesis when an object for scanning moves only a little, and also enables an improvement in contrast resolution even when the object largely moves.
- the present invention makes it possible to obtain an image with a good balance between the contrast resolution and spatial resolution according to a positional displacement between images to be synthesized. Further the present invention makes it possible to acquire an image with a good balance between the contrast resolution and spatial resolution according to an object to be imaged, or according to selection by the user.
Landscapes
- Engineering & Computer Science (AREA)
- Physics & Mathematics (AREA)
- Health & Medical Sciences (AREA)
- Life Sciences & Earth Sciences (AREA)
- Remote Sensing (AREA)
- Radar, Positioning & Navigation (AREA)
- Acoustics & Sound (AREA)
- Medical Informatics (AREA)
- General Health & Medical Sciences (AREA)
- Heart & Thoracic Surgery (AREA)
- Radiology & Medical Imaging (AREA)
- Molecular Biology (AREA)
- Surgery (AREA)
- Animal Behavior & Ethology (AREA)
- Biomedical Technology (AREA)
- Public Health (AREA)
- Veterinary Medicine (AREA)
- Pathology (AREA)
- Nuclear Medicine, Radiotherapy & Molecular Imaging (AREA)
- Biophysics (AREA)
- Computer Networks & Wireless Communication (AREA)
- General Physics & Mathematics (AREA)
- Ultra Sonic Daignosis Equipment (AREA)
Claims (2)
- Dispositif d'imagerie échographique, comportant :une unité de commande (10) conçue pour envoyer séquentiellement des signaux numériques de commande à un conformateur (23) de faisceaux d'émission pour former l'un après l'autre des faisceaux d'ultrasons d'émission afin d'irradier un plan d'un sujet depuis plusieurs directions via une sonde échographique (32) et de recevoir des signaux traités issus d'un conformateur (24) de faisceaux de réception ; dans lequelle conformateur (23) de faisceaux d'émission est conçu pour former une série de signaux échographiques d'émission en réponse aux signaux numériques de commande ;la sonde échographique (32) est conçue pour recevoir les signaux échographiques d'émission issus du conformateur (23) de faisceaux d'émission via un séparateur d'émission/réception (31) afin d'irradier le sujet avec les faisceaux d'ultrasons d'émission ; et pour détecter des signaux d'échos de l'irradiation par chacun des signaux échographiques d'émission ;le conformateur (24) de faisceaux de réception est conçu pour aligner des phases des signaux d'échos et former des séries de signaux traités ;
l'unité de commande (10) étant conçue pourstocker une première série de signaux traités en tant que données RF d'une première trame qui représente le plan du sujet irradié depuis une première direction angulaire par les faisceaux échographiques d'émission ;modifier la direction angulaire de faisceaux échographiques d'émission pour leur donner une seconde direction angulaire afin de recevoir une seconde série de signaux traités ;stocker la seconde série de signaux traités en tant que données RF d'une seconde trame qui représente le plan du sujet irradié depuis la seconde direction angulaire par les faisceaux échographiques d'émission ;calculer une corrélation de données RF entre la première trame et la seconde trame, qui indique un degré de déplacement du sujet ;mélanger chacune des première et seconde séries des signaux traités avec un signal de référence ayant une fréquence, laquelle est choisie parmi une première fréquence égale à la fréquence centrale des signaux d'émission, une deuxième fréquence égale à zéro et une troisième fréquence différente de la première et de la deuxième fréquences en fonction d'un résultat du calcul pour la corrélation ;réaliser une synthèse des données mélangées dérivées de la première série des signaux traités et des données mélangées de la seconde série des signaux traités afin d'obtenir des données d'image représentant une image de synthèse en mode B, la synthèse étant une synthèse non-cohérente si la fréquence de référence est égale à la fréquence centrale des signaux d'émission, une synthèse cohérente si la fréquence de référence est nulle, ou une synthèse intermédiaire entre les formes non-cohérente et cohérente si la fréquence de référence est différente des première et seconde fréquences ; etafficher sur un dispositif d'affichage (22) les données de l'image de synthèse en mode B. - Procédé d'échographie comportant les étapes de :émission de faisceaux d'ultrasons depuis une sonde échographique (32) jusqu'à un plan d'un sujet depuis une première direction angulaire en entraînant la sonde échographique (32) avec une série de signaux échographiques d'émission ;réception de signaux d'échos réfléchis par le sujet et formation d'une première série de signaux traités ;stockage de la première série de signaux traités en tant que données RF d'une première trame qui représente le plan du sujet irradié depuis la première direction angulaire par les faisceaux échographiques d'émission :modification de la direction angulaire d'irradiation pour en faire une seconde direction angulaire ;émission de faisceaux d'ultrasons depuis la sonde échographique (32) jusqu'au plan du sujet depuis la seconde direction angulaire ;réception des signaux échographiques réfléchis par le sujet et formation d'une seconde série de signaux traités ;stockage de la seconde série de signaux traités en tant que données RF d'une seconde trame qui représente le plan du sujet irradié depuis la seconde direction angulaire par les faisceaux échographiques d'émission ;calcul d'une corrélation de données RF entre la première trame et la seconde trame, qui indique un degré de déplacement du sujet ;mélange de chacune des première et seconde séries des signaux traités avec un signal de référence ayant une fréquence, laquelle est choisie parmi une première fréquence égale à la fréquence centrale des signaux d'émission, une deuxième fréquence égale à zéro et une troisième fréquence différente de la première et de la deuxième fréquences en fonction d'un résultat du calcul pour la corrélation ;réalisation d'une synthèse des données mélangées dérivées de la première série des signaux traités et des données mélangées dérivées de la seconde série des signaux traités afin d'obtenir des données d'image représentant une image de synthèse en mode B, la réalisation de la synthèse aboutissant à une synthèse non-cohérente si la fréquence de référence est égale à la fréquence centrale des signaux d'émission, à une synthèse cohérente si la fréquence de référence est nulle, ou à une synthèse intermédiaire entre les formes non-cohérente et cohérente si la fréquence de référence est différente des première et seconde fréquences ; etl'affichage, sur un dispositif d'affichage, des données de l'image de synthèse en mode B.
Applications Claiming Priority (2)
| Application Number | Priority Date | Filing Date | Title |
|---|---|---|---|
| JP2003206184 | 2003-08-06 | ||
| PCT/JP2004/008391 WO2005013829A1 (fr) | 2003-08-06 | 2004-06-09 | Dispositif ultrasonographique et procede ultrasonographique |
Publications (3)
| Publication Number | Publication Date |
|---|---|
| EP1652475A1 EP1652475A1 (fr) | 2006-05-03 |
| EP1652475A4 EP1652475A4 (fr) | 2011-03-30 |
| EP1652475B1 true EP1652475B1 (fr) | 2016-08-31 |
Family
ID=34131377
Family Applications (1)
| Application Number | Title | Priority Date | Filing Date |
|---|---|---|---|
| EP04745943.3A Expired - Lifetime EP1652475B1 (fr) | 2003-08-06 | 2004-06-09 | Dispositif ultrasonographique et procede ultrasonographique |
Country Status (5)
| Country | Link |
|---|---|
| US (2) | US7473226B2 (fr) |
| EP (1) | EP1652475B1 (fr) |
| JP (2) | JP4426530B2 (fr) |
| CN (1) | CN1805710A (fr) |
| WO (1) | WO2005013829A1 (fr) |
Families Citing this family (41)
| Publication number | Priority date | Publication date | Assignee | Title |
|---|---|---|---|---|
| US8473239B2 (en) | 2009-04-14 | 2013-06-25 | Maui Imaging, Inc. | Multiple aperture ultrasound array alignment fixture |
| EP2088932B1 (fr) | 2006-10-25 | 2020-04-08 | Maui Imaging, Inc. | Procédé et appareil de production d'images ultrasonores au moyen d'une pluralité d'orifices |
| EP1974672B9 (fr) * | 2007-03-28 | 2014-04-16 | Kabushiki Kaisha Toshiba | Appareil d'imagerie par ultrasons et procédé d'optimisation de la vitesse ultrasonique |
| US9282945B2 (en) | 2009-04-14 | 2016-03-15 | Maui Imaging, Inc. | Calibration of ultrasound probes |
| US9788813B2 (en) | 2010-10-13 | 2017-10-17 | Maui Imaging, Inc. | Multiple aperture probe internal apparatus and cable assemblies |
| EP2053419B1 (fr) * | 2007-10-25 | 2012-10-17 | Samsung Medison Co., Ltd. | Appareil et procédé d'évaluation et de compensation d'un mouvement dans la formation d'une image synthétique en utilisant une séquence particulière de lignes explorées |
| CN101438967B (zh) * | 2007-11-22 | 2012-09-05 | Ge医疗系统环球技术有限公司 | 超声成像设备 |
| JP5074937B2 (ja) * | 2008-01-22 | 2012-11-14 | 日立アロカメディカル株式会社 | 超音波診断装置 |
| US9271697B2 (en) * | 2008-03-21 | 2016-03-01 | Boston Scientific Scimed, Inc. | Ultrasound imaging with speckle suppression via direct rectification of signals |
| WO2010017445A2 (fr) | 2008-08-08 | 2010-02-11 | Maui Imaging, Inc. | Imagerie ultrasonore médicale à ouvertures multiples et synchronisation de systèmes complémentaires |
| EP2182352A3 (fr) * | 2008-10-29 | 2011-08-03 | Hitachi Ltd. | Procédé et dispositif d'aération |
| CN101810492B (zh) * | 2009-02-24 | 2013-10-02 | 深圳迈瑞生物医疗电子股份有限公司 | 超声诊断系统及动态提高成像帧率的方法和波束合成装置 |
| EP2536339B1 (fr) | 2010-02-18 | 2024-05-15 | Maui Imaging, Inc. | Transmission à source ponctuelle et correction de la vitesse du son à l'aide d'une imagerie par ultrasons à ouvertures multiples |
| US9668714B2 (en) | 2010-04-14 | 2017-06-06 | Maui Imaging, Inc. | Systems and methods for improving ultrasound image quality by applying weighting factors |
| JP2012030048A (ja) * | 2010-07-02 | 2012-02-16 | Toshiba Corp | 超音波診断装置、画像処理装置、及び解析プログラム |
| JP2012071115A (ja) * | 2010-08-30 | 2012-04-12 | Toshiba Corp | 超音波診断装置 |
| JP6092109B2 (ja) | 2010-10-13 | 2017-03-08 | マウイ イマギング,インコーポレーテッド | 凹面超音波トランスデューサ及び3dアレイ |
| JP5967901B2 (ja) * | 2011-11-07 | 2016-08-10 | キヤノン株式会社 | 被検体情報取得装置 |
| WO2013082455A1 (fr) | 2011-12-01 | 2013-06-06 | Maui Imaging, Inc. | Détection de mouvement par utilisation d'un doppler à ouverture basé sur l'impulsion acoustique émise et à ouvertures multiples |
| JP2015503404A (ja) | 2011-12-29 | 2015-02-02 | マウイ イマギング,インコーポレーテッド | 任意経路のmモード超音波イメージング |
| JP6438769B2 (ja) | 2012-02-21 | 2018-12-19 | マウイ イマギング,インコーポレーテッド | 多数開口超音波を用いた物質の硬度の決定 |
| DE102012205225A1 (de) * | 2012-03-30 | 2013-10-02 | Fraunhofer-Gesellschaft zur Förderung der angewandten Forschung e.V. | Computertomographiesystem und verfahren zur datenermittelung für eine störeinfluss-korrigierte computertomographieaufnahme eines untersuchungsobjekts |
| WO2014026185A1 (fr) | 2012-08-10 | 2014-02-13 | Maui Imaging, Inc. | Étalonnage de sondes à ultrasons à ouvertures multiples |
| EP3893022B1 (fr) | 2012-09-06 | 2025-02-12 | Maui Imaging, Inc. | Architecture de mémoire de système d'imagerie par ultrasons |
| CN103676827A (zh) | 2012-09-06 | 2014-03-26 | Ip音乐集团有限公司 | 用于远程控制音频设备的系统和方法 |
| WO2014160291A1 (fr) | 2013-03-13 | 2014-10-02 | Maui Imaging, Inc. | Alignement de groupements de transducteurs à ultrasons et ensemble de sonde à ouvertures multiples |
| US9883848B2 (en) | 2013-09-13 | 2018-02-06 | Maui Imaging, Inc. | Ultrasound imaging using apparent point-source transmit transducer |
| CN105249992A (zh) * | 2014-02-20 | 2016-01-20 | 飞依诺科技(苏州)有限公司 | 基于rf数据超声成像处理方法及系统 |
| JP6150749B2 (ja) * | 2014-03-11 | 2017-06-21 | オリンパス株式会社 | 超音波観測装置 |
| KR102617888B1 (ko) | 2014-08-18 | 2023-12-22 | 마우이 이미징, 인코포레이티드 | 네트워크-기반 초음파 이미징 시스템 |
| EP3213110B1 (fr) * | 2014-10-30 | 2020-08-05 | Koninklijke Philips N.V. | Détection compressive dans la formation d'images par ultrasons |
| KR102681141B1 (ko) | 2015-03-30 | 2024-07-02 | 마우이 이미징, 인코포레이티드 | 오브젝트 모션을 검출하기 위한 초음파 이미징 시스템들 및 방법들 |
| EP4697068A3 (fr) | 2016-01-27 | 2026-04-22 | Maui Imaging, Inc. | Imagerie ultrasonore à sondes à matrice creuse |
| US11382604B2 (en) * | 2017-01-18 | 2022-07-12 | Furuno Electric Co., Ltd. | Ultrasonic image system with synthesis of images of different ultrasonic waves received at respective positions of a probe |
| JP6924905B2 (ja) * | 2018-08-27 | 2021-08-25 | 富士フイルム株式会社 | 超音波診断装置および超音波診断装置の制御方法 |
| JP7581682B2 (ja) * | 2020-07-16 | 2024-11-13 | コニカミノルタ株式会社 | 超音波診断装置、超音波信号処理方法、及びプログラム |
| JP7724853B2 (ja) | 2020-10-21 | 2025-08-18 | マウイ イマギング,インコーポレーテッド | 多数開口超音波を用いた組織の特徴付けのためのシステム及び方法 |
| CN116635162A (zh) | 2020-11-02 | 2023-08-22 | 毛伊图像公司 | 用于改进超声图像质量的系统和方法 |
| WO2023045119A1 (fr) * | 2021-09-24 | 2023-03-30 | 武汉联影医疗科技有限公司 | Procédé et système d'imagerie échographique |
| CN116327238A (zh) * | 2021-12-24 | 2023-06-27 | 深圳迈瑞生物医疗电子股份有限公司 | 超声成像方法和超声成像系统 |
| JP7828243B2 (ja) * | 2022-06-17 | 2026-03-11 | 富士フイルム株式会社 | 超音波診断装置 |
Family Cites Families (15)
| Publication number | Priority date | Publication date | Assignee | Title |
|---|---|---|---|---|
| JPS63241481A (ja) * | 1987-03-30 | 1988-10-06 | Yokogawa Medical Syst Ltd | ソナ−システムのヘテロダイン受信機 |
| JPH0327215U (fr) * | 1989-07-27 | 1991-03-19 | ||
| JP3262169B2 (ja) * | 1990-10-23 | 2002-03-04 | 株式会社日立メディコ | 超音波診断装置 |
| JPH04208141A (ja) * | 1990-11-30 | 1992-07-29 | Aloka Co Ltd | 超音波診断装置 |
| JPH04314435A (ja) * | 1991-04-15 | 1992-11-05 | Aloka Co Ltd | 超音波診断装置 |
| US5582173A (en) * | 1995-09-18 | 1996-12-10 | Siemens Medical Systems, Inc. | System and method for 3-D medical imaging using 2-D scan data |
| US6292433B1 (en) * | 1997-02-03 | 2001-09-18 | Teratech Corporation | Multi-dimensional beamforming device |
| US6511426B1 (en) * | 1998-06-02 | 2003-01-28 | Acuson Corporation | Medical diagnostic ultrasound system and method for versatile processing |
| US6117081A (en) * | 1998-10-01 | 2000-09-12 | Atl Ultrasound, Inc. | Method for correcting blurring of spatially compounded ultrasonic diagnostic images |
| US6283917B1 (en) | 1998-10-01 | 2001-09-04 | Atl Ultrasound | Ultrasonic diagnostic imaging system with blurring corrected spatial compounding |
| US6464638B1 (en) * | 2000-10-05 | 2002-10-15 | Koninklijke Philips Electronics N.V. | Ultrasound imaging system and method for spatial compounding |
| JP4958348B2 (ja) * | 2001-09-06 | 2012-06-20 | 株式会社日立メディコ | 超音波撮像装置 |
| JP3911403B2 (ja) | 2001-10-25 | 2007-05-09 | ジーイー・メディカル・システムズ・グローバル・テクノロジー・カンパニー・エルエルシー | 超音波診断装置 |
| JP4060615B2 (ja) * | 2002-03-05 | 2008-03-12 | 株式会社東芝 | 画像処理装置及び超音波診断装置 |
| US6679847B1 (en) * | 2002-04-30 | 2004-01-20 | Koninklijke Philips Electronics N.V. | Synthetically focused ultrasonic diagnostic imaging system for tissue and flow imaging |
-
2004
- 2004-06-09 CN CNA2004800167273A patent/CN1805710A/zh active Pending
- 2004-06-09 EP EP04745943.3A patent/EP1652475B1/fr not_active Expired - Lifetime
- 2004-06-09 US US10/562,465 patent/US7473226B2/en not_active Expired - Fee Related
- 2004-06-09 WO PCT/JP2004/008391 patent/WO2005013829A1/fr not_active Ceased
- 2004-06-09 JP JP2005512903A patent/JP4426530B2/ja not_active Expired - Fee Related
-
2009
- 2009-01-02 US US12/348,135 patent/US8079956B2/en not_active Expired - Fee Related
- 2009-09-28 JP JP2009221937A patent/JP5357684B2/ja not_active Expired - Lifetime
Non-Patent Citations (1)
| Title |
|---|
| None * |
Also Published As
| Publication number | Publication date |
|---|---|
| WO2005013829A1 (fr) | 2005-02-17 |
| CN1805710A (zh) | 2006-07-19 |
| JP4426530B2 (ja) | 2010-03-03 |
| JP2010042266A (ja) | 2010-02-25 |
| JP5357684B2 (ja) | 2013-12-04 |
| US8079956B2 (en) | 2011-12-20 |
| US20060173334A1 (en) | 2006-08-03 |
| EP1652475A1 (fr) | 2006-05-03 |
| JPWO2005013829A1 (ja) | 2006-09-28 |
| US7473226B2 (en) | 2009-01-06 |
| US20090118617A1 (en) | 2009-05-07 |
| EP1652475A4 (fr) | 2011-03-30 |
Similar Documents
| Publication | Publication Date | Title |
|---|---|---|
| US7473226B2 (en) | Ultrasonographic device and ultrasonographic method | |
| EP3548920B1 (fr) | Procédés et systèmes de filtrage de brouillage d'image ultrasonore | |
| EP2203120B1 (fr) | Appareil et procédé de création d'image doppler de tissu à l'aide d'une image de synthèse | |
| US8068647B2 (en) | Method and apparatus for real-time motion correction for ultrasound spatial compound imaging | |
| US7828731B2 (en) | Ultrasonographic apparatus, ultrasonographic data processing method, and ultrasonographic data processing program | |
| US20070276236A1 (en) | Ultrasonic diagnostic imaging system with automatic control of penetration, resolution and frame rate | |
| US7874988B2 (en) | Ultrasonic diagnostic apparatus and ultrasonic transmission method | |
| JP4575737B2 (ja) | 超音波撮像装置 | |
| US7713206B2 (en) | Ultrasonic imaging apparatus | |
| US20110245676A1 (en) | Method and apparatus for ultrasound signal acquisition and processing | |
| US20240000430A1 (en) | Processing ultrasound scan data | |
| Schiffner et al. | Frequency-dependent F-number suppresses grating lobes and improves the lateral resolution in coherent plane-wave compounding | |
| CN119413897B (zh) | 超声声速图像的生成方法、超声设备以及存储介质 | |
| JP7648005B2 (ja) | 心臓超音波撮像の改善 | |
| WO2010068450A1 (fr) | Système et procédé d'analyse du canal carpien par imagerie à ultrasons | |
| EP3685753B1 (fr) | Appareil d'imagerie à ultrasons et procédé de commande correspondant | |
| CN120788613A (zh) | 超声成像方法和超声成像系统 | |
| CN116546926A (zh) | 分析腹直肌的超声图像数据 | |
| JP4772338B2 (ja) | 超音波診断装置 | |
| Dia et al. | Refraction corrected specular beamforming applied to cortical bone enhances interface visibility of bone-soft tissues interfaces | |
| EP4664154A1 (fr) | Procédé et système de correction de données d'imagerie ultrasonore | |
| Cho et al. | Intravascular ultrasound imaging with directional synthetic aperture focusing and coherence factor weighting | |
| Stergiopoulos | Digital 3D/4D Ultrasound Imaging Technology | |
| Nayebi | Synthetic aperture imaging: Applications in high-frequency ultrasound |
Legal Events
| Date | Code | Title | Description |
|---|---|---|---|
| PUAI | Public reference made under article 153(3) epc to a published international application that has entered the european phase |
Free format text: ORIGINAL CODE: 0009012 |
|
| 17P | Request for examination filed |
Effective date: 20060227 |
|
| AK | Designated contracting states |
Kind code of ref document: A1 Designated state(s): DE FR GB IT NL |
|
| DAX | Request for extension of the european patent (deleted) | ||
| RBV | Designated contracting states (corrected) |
Designated state(s): DE FR GB IT NL |
|
| A4 | Supplementary search report drawn up and despatched |
Effective date: 20110224 |
|
| RIC1 | Information provided on ipc code assigned before grant |
Ipc: A61B 8/08 20060101ALI20110218BHEP Ipc: A61B 8/00 20060101AFI20050224BHEP Ipc: G01S 15/89 20060101ALI20110218BHEP Ipc: G01S 7/52 20060101ALI20110218BHEP |
|
| 17Q | First examination report despatched |
Effective date: 20110617 |
|
| GRAP | Despatch of communication of intention to grant a patent |
Free format text: ORIGINAL CODE: EPIDOSNIGR1 |
|
| INTG | Intention to grant announced |
Effective date: 20160404 |
|
| GRAS | Grant fee paid |
Free format text: ORIGINAL CODE: EPIDOSNIGR3 |
|
| GRAP | Despatch of communication of intention to grant a patent |
Free format text: ORIGINAL CODE: EPIDOSNIGR1 |
|
| INTG | Intention to grant announced |
Effective date: 20160630 |
|
| GRAA | (expected) grant |
Free format text: ORIGINAL CODE: 0009210 |
|
| AK | Designated contracting states |
Kind code of ref document: B1 Designated state(s): DE FR GB IT NL |
|
| REG | Reference to a national code |
Ref country code: GB Ref legal event code: FG4D |
|
| REG | Reference to a national code |
Ref country code: DE Ref legal event code: R096 Ref document number: 602004049868 Country of ref document: DE |
|
| REG | Reference to a national code |
Ref country code: DE Ref legal event code: R082 Ref document number: 602004049868 Country of ref document: DE Representative=s name: STREHL SCHUEBEL-HOPF & PARTNER MBB PATENTANWAE, DE Ref country code: DE Ref legal event code: R081 Ref document number: 602004049868 Country of ref document: DE Owner name: HITACHI, LTD., JP Free format text: FORMER OWNER: HITACHI MEDICAL CORP., TOKIO/TOKYO, JP |
|
| RAP2 | Party data changed (patent owner data changed or rights of a patent transferred) |
Owner name: HITACHI, LTD. |
|
| REG | Reference to a national code |
Ref country code: NL Ref legal event code: MP Effective date: 20160831 |
|
| PG25 | Lapsed in a contracting state [announced via postgrant information from national office to epo] |
Ref country code: NL Free format text: LAPSE BECAUSE OF FAILURE TO SUBMIT A TRANSLATION OF THE DESCRIPTION OR TO PAY THE FEE WITHIN THE PRESCRIBED TIME-LIMIT Effective date: 20160831 |
|
| REG | Reference to a national code |
Ref country code: DE Ref legal event code: R097 Ref document number: 602004049868 Country of ref document: DE |
|
| PG25 | Lapsed in a contracting state [announced via postgrant information from national office to epo] |
Ref country code: IT Free format text: LAPSE BECAUSE OF FAILURE TO SUBMIT A TRANSLATION OF THE DESCRIPTION OR TO PAY THE FEE WITHIN THE PRESCRIBED TIME-LIMIT Effective date: 20160831 |
|
| PLBE | No opposition filed within time limit |
Free format text: ORIGINAL CODE: 0009261 |
|
| STAA | Information on the status of an ep patent application or granted ep patent |
Free format text: STATUS: NO OPPOSITION FILED WITHIN TIME LIMIT |
|
| 26N | No opposition filed |
Effective date: 20170601 |
|
| GBPC | Gb: european patent ceased through non-payment of renewal fee |
Effective date: 20170609 |
|
| REG | Reference to a national code |
Ref country code: FR Ref legal event code: ST Effective date: 20180228 |
|
| PG25 | Lapsed in a contracting state [announced via postgrant information from national office to epo] |
Ref country code: GB Free format text: LAPSE BECAUSE OF NON-PAYMENT OF DUE FEES Effective date: 20170609 |
|
| PG25 | Lapsed in a contracting state [announced via postgrant information from national office to epo] |
Ref country code: FR Free format text: LAPSE BECAUSE OF NON-PAYMENT OF DUE FEES Effective date: 20170630 |
|
| PGFP | Annual fee paid to national office [announced via postgrant information from national office to epo] |
Ref country code: DE Payment date: 20180530 Year of fee payment: 15 |
|
| REG | Reference to a national code |
Ref country code: DE Ref legal event code: R119 Ref document number: 602004049868 Country of ref document: DE |
|
| PG25 | Lapsed in a contracting state [announced via postgrant information from national office to epo] |
Ref country code: DE Free format text: LAPSE BECAUSE OF NON-PAYMENT OF DUE FEES Effective date: 20200101 |