EP1655980A2 - System und Verfahren zur Bestimmung von Benutzer wahrgenommenen deckungslosen Zonen in einem drahtlosen Kommunikationssystem - Google Patents
System und Verfahren zur Bestimmung von Benutzer wahrgenommenen deckungslosen Zonen in einem drahtlosen Kommunikationssystem Download PDFInfo
- Publication number
- EP1655980A2 EP1655980A2 EP05256429A EP05256429A EP1655980A2 EP 1655980 A2 EP1655980 A2 EP 1655980A2 EP 05256429 A EP05256429 A EP 05256429A EP 05256429 A EP05256429 A EP 05256429A EP 1655980 A2 EP1655980 A2 EP 1655980A2
- Authority
- EP
- European Patent Office
- Prior art keywords
- user
- mobile device
- coverage
- holes
- location
- Prior art date
- Legal status (The legal status is an assumption and is not a legal conclusion. Google has not performed a legal analysis and makes no representation as to the accuracy of the status listed.)
- Withdrawn
Links
- 238000000034 method Methods 0.000 title claims abstract description 80
- 230000001413 cellular effect Effects 0.000 claims abstract description 25
- 238000004891 communication Methods 0.000 claims abstract description 15
- 229920001690 polydopamine Polymers 0.000 claims description 2
- 230000000977 initiatory effect Effects 0.000 claims 3
- 230000008569 process Effects 0.000 description 50
- 238000012360 testing method Methods 0.000 description 9
- 230000006399 behavior Effects 0.000 description 4
- 238000005259 measurement Methods 0.000 description 4
- 238000001514 detection method Methods 0.000 description 3
- 238000004519 manufacturing process Methods 0.000 description 3
- 239000000203 mixture Substances 0.000 description 3
- 230000006870 function Effects 0.000 description 2
- 230000001788 irregular Effects 0.000 description 2
- 238000005303 weighing Methods 0.000 description 2
- 230000004075 alteration Effects 0.000 description 1
- 230000008602 contraction Effects 0.000 description 1
- 230000000694 effects Effects 0.000 description 1
- 230000003203 everyday effect Effects 0.000 description 1
- 238000007670 refining Methods 0.000 description 1
- 238000004088 simulation Methods 0.000 description 1
- 238000003860 storage Methods 0.000 description 1
- 238000006467 substitution reaction Methods 0.000 description 1
- 238000012546 transfer Methods 0.000 description 1
Images


Classifications
-
- H—ELECTRICITY
- H04—ELECTRIC COMMUNICATION TECHNIQUE
- H04W—WIRELESS COMMUNICATION NETWORKS
- H04W16/00—Network planning, e.g. coverage or traffic planning tools; Network deployment, e.g. resource partitioning or cells structures
- H04W16/18—Network planning tools
-
- H—ELECTRICITY
- H04—ELECTRIC COMMUNICATION TECHNIQUE
- H04W—WIRELESS COMMUNICATION NETWORKS
- H04W24/00—Supervisory, monitoring or testing arrangements
- H04W24/08—Testing, supervising or monitoring using real traffic
Definitions
- RF field is undersampled in time, since each sample covers only a fraction of a second per month at any one location.
- Another disadvantage of drive testing is that the RF field is also undersampled in space, because most of the major roads are not driven their entire length and only some of the minor roads are driven. Drive testing misses all locations without a road, such as parks, stadiums, homes, offices, conference centers, etc.
- the wireless coverage area is a cellular network and the holes are determined by actual cellular phone usage within the network. Location and direction of travel data pertaining to a cellular phone's usage is stored and refined within the cellular phone so as to define areas where the user selects to place calls or selects to terminate calls. The data stored within the cellular phone is from time to time communicated to the central wireless broadcast system. Refinement of the data in the cellular phone allows for long storage periods so that signal quality can be reported over long time spans. By collecting such data from a plurality of such devices, the central system can map coverage holes from a user's perspective.
- a cellular system monitors at least some of the cellular phones operating within its coverage area in order to locate areas where the signal strength is either below user's acceptance levels or users decide not to place calls. Holes in this context may be inferred from user's behavior and their discovered location can be used by the cellular system provider to better adjust its coverage area.
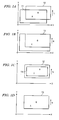
- FIGURE 1A shows geographical areas defined by a mobile device
- FIGURES 1B, 1C, and 1D show movement, expansion and contraction of the geographical area of FIGURE 1;
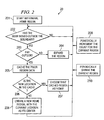
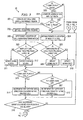
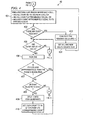
- FIGURES 2, 3, and 4 show flow charts of one embodiment of system operations
- FIGURE 5 shows one embodiment of a mobile device
- FIGURE 6 shows one embodiment of a cellular system using the systems and methods described herein;
- FIGURE 7 shows one example of a user entering and leaving a coverage hole
- FIGURE 8 shows one example where a user's path crosses on edge of a coverage hole
- FIGURE 9A, 9B, and 10 illustrate examples of each cell maintaining a count of coverage starts and stops on a directional basis
- FIGURES 11-13 illustrate coalescing of the cells adjacent to a boundary.
- FIGURES 1A through 7 of said application A discussion of FIGURES 1A through 7 of said application follows.
- FIGURE 1A shows geographical area 11 where the user of a mobile device (for example, a cellular telephone) spends most of his/her time.
- the letter 'A' is positioned at the center of geographical area 11. For discussion purposes, this is called the 'home' region and in discussing FIGURES 1A-1D the method discussed with respect to FIGURE 2 will be used.
- FIGURE 1B shows the expanded region 13.
- the new home region has expanded on the north and east.
- the expansion amount could be by just enough to include the user's new location or could be by an integral number of bins (cells), or by doubling the original size, etc.
- FIGURE 1C shows an example where the user remains within the confines of region 12 and, periodically, as will be discussed hereinafter, the region is reduced.
- acts performed periodically can be performed at regular intervals or at random intervals.
- region 13 is reduced on all sides to form region 14.
- FIGURE 1D shows that the home region, now region 15, has again been expanded on the north and east to include areas of user movement.
- the home region now includes the new areas of user movement, and omits the areas where the user no longer goes.
- the home region has effectively moved to follow the user from A to B.
- the coordinates (and the data associated with the coordinates) are cached (home coordinate cache) and a new temporary region is created.
- the system periodically increments a count associated with the region the user is currently in and periodically deletes from the cache the region with the smallest count.
- the system has established a home region.
- the system establishes which cached region is the user's home region. There may be a tie, or a near-tie, for first place, depending on the usage pattern. However, this does not matter since the important thing is to choose a region where the user spends a lot of time.
- it takes four numbers to store the region information.
- the numbers may be, for example, latitude/longitude, or distance (in bins, or some other unit) plus an angle from a known tower, or some other coordinate system (which need not be Cartesian).
- FIGURE 2 shows one embodiment of a flowchart showing system and method 20 for determining the home region for storing data pertaining to signal strength.
- Process 201 starts with an initial home region.
- Process 202 determines whether the user has moved outside of the home region. If the user has moved outside the home region, process 203 determines if the user has moved beyond a given distance. If not, then the boundary is expanded via process 204 as discussed above. If the user has moved beyond a given distance, then the prior region's data is stored in a cache via process 205. Process 206 then determines if the new location is in cache. If so, that cached region becomes the new home region. If not, then process 208 creates a new home region.
- Process 209 periodically increments the count for the current region and process 210 periodically shrinks the current region. Either or both of these actions can be performed periodically, such as every minute, every hour, every day, etc., as desired. While uniform shrinking is discussed, an important factor is that shrinkage (whether uniform or nonuniform) is unbiased over the long run. Thus, the shrinkage need not be uniform across the region, and one side could be reduced at one time and a different side reduced at another time. The side or sides to be reduced could be determined in order (north, south, east, west, etc.) or in random order, and any number of sides can be reduced at a time.
- this system will continually refine itself so that if a user has moved to a new home region, the new home region will soon become the official home region and the system will continue without anything being done by either the user or the central system to which the device will eventually report.
- the size of the area will continually refine downward (or upward) so that as the user's movements reduce (or increase) the home region also reduces (or increases).
- Phase 1 Find the user's home region as discussed above with respect to FIGURES 1A through 2 above.
- FIGURE 7 shows road 73 passing through an area such as area 71, where users tend to turn off (end) their wireless communications on entry or tend to begin conversations on exit.
- area 71 an area such as area 71, where users tend to turn off (end) their wireless communications on entry or tend to begin conversations on exit.
- the determination of the edges of coverage holes is based upon actual data pertaining to user initiated ending of calls and beginning of calls as stored in user's phone(s). This area will be inferred to be a coverage hole.
- westbound user 72W typically hangs up (ends call) when crossing the hole boundary shown as line 75W.
- This same user when going in the opposite direction (72E), frequently places calls shortly after crossing the east boundary (shown as line 75E) of hole 71.
- users will regularly start/end calls at locations which have nothing to do with a coverage hole. For example, a user may call home when he/she leaves work, but that does not mean there is a coverage hole in front of the user's work place. These "holes" will tend to average out across users, but even if they do not, they should be explainable by looking at a map. Also, users will start/end calls at irregular times and places, and these irregular times and places will be ignored since, as will be discussed, the system and methods discussed herein pay attention only to differences which remain sharp even when accumulated over many measurements. In other situations, users may regularly start/end calls at a boundary of a coverage hole which the service provider's measurements do not show.
- Step 1 A grid is constructed over the home region and is made as fine as permitted by the desired memory usage of the mobile device.
- the grid corresponds to geographical area traversed by a mobile device.
- Memory in each such mobile device is associated with each grid cell.
- FIGURE 3 shows one embodiment 30 of a system and method for constructing a grid of cells describing the measurement of the phenomenon, for example, quality of wireless coverage as perceived by the user.
- Process 301 constructs a cell grid over the region where the user presently is located. Note that the memory can be different for different mobile devices, and thus, the size of grid area or the refinement therein can be different.
- FIGURE 8 shows one example of such a grid where eastbound user 72E's path crosses the east edge (75E) in cell G12. Calls and hang-ups are recorded in each mobile device with respect to these cells.
- Coverage hole 71 (FIGURE 7) has other edges and, may have other roads through it, and each of those edges and each of those roads will be treated as described herein. However, for clarity we will consider just one edge, namely edge 75(E&W), shown in cell G12.
- Step 2 At each cell, a set of counters is identified, and in process 302 (FIGURE 3) each counter is set initially to zero and each counter represents a compass direction. This is shown in FIGURE 9A, where c2 represents east, c1 represents northeast, etc.
- FIGURE 9B shows four counters, with counter c1 covering east, east by northeast, east by southeast; counter c2 covering north, north by northeast, north by northwest, etc.
- the number of counters ideally should be greater than four and should be, if possible, an even number.
- Step 3 Whenever the user initiates a call, the current location (or if none is available the next measured location) is noted as shown in process 303, FIGURE 3. This location, together with a recent history of user location, process 304, is used to compute a direction the user is traveling. This can be the user's last n locations for some small value of n. In this way, even if the user is stationary, the system will know which direction the user has been heading.
- One embodiment for accomplishing such a determination is to use the latitude and longitude of the newly obtained location and the latitude and longitude of the previous location and to determine (process 305) if the newly obtained longitude is less than the previous longitude. If so, then process 310 determines that the device is going east.
- process 309 determines that the device is going west.
- Process 306 determines if the newly obtained latitude is less than the previous latitude. If it is, then process 312 determines the device is going south. If it is not, then process 311 determines the device is going north. For example, if the user (device) is going north and there are four counters, increment the 'North' counter (c2 in FIGURE 9B). If an eight cell count is used, then cell c0 (FIGURE 9A) would be incremented as shown by either process 314 or by process 315. If the user is exactly on the boundary between two directions, randomly decide which counter to increment. Process 314 is used if the user placed the call, as determined by process 313.
- Step 4 Whenever the user ends a call by hanging up (rather than by having the call dropped, or the other party hanging up), as determined by process 307, the opposite direction counter is incremented as shown by process 315, FIGURE 3. For example, if the user is going west and there are eight counters (FIGURE 9A), increment east counter c2. If the user is exactly on the boundary between two directions, randomly decide which counter to increment.
- FIGURE 10 shows one example after placing one call when traveling east, and hanging up on one call when traveling west.
- the counters for a cell (such as cell G12, FIGURE 8) would be as shown in FIGURE 10, with a 2 in counter c2.
- Step 5 After a period of time (which may be a time interval, or when the count with the largest value exceeds a threshold, or when the sum of counts exceeds a threshold or even random), process 316, FIGURE 3 initiates a process for coalescing or splitting grid elements of a particular region.
- a period of time which may be a time interval, or when the count with the largest value exceeds a threshold, or when the sum of counts exceeds a threshold or even random
- FIGURE 4 shows one embodiment 40 for performing such coalescing and splitting.
- process 401 begins the process of coalescing by finding rectangular regions where the counts in each cell meet any of the following criteria:
- Process 402 determines if there are any such rectangular regions. If there are, then process 403 coalesces the found region into a single grid element and process 404 sets all counts in the new grid element to zero. The resulting structure is no longer a grid, but can be efficiently represented as a quadtree. See for example U.S. Patent Application No. 10/909, 814, filed on August 2, 2004, entitled “SYSTEM AND METHOD FOR WIRELESS COVERAGE DETECTION,” which is hereby incorporated by reference herein. In our example, assume that the only events in the home region are calls placed just after crossing the boundary (grid G12, FIGURE 8) going east (72E), or calls ended just before crossing the boundary going west (72W). Then the new region would look as shown in FIGURE 11.
- New region A is formed by coalescing the 9x11 cells (A1 - I11) west of the shaded cell (G12); B is formed by coalescing the two cells (H12, I12) north of cell G12; C by coalescing the 2x2 cells (H13 - I14) to the northeast and the two cells (G13, G14) to the east; and D by coalescing the six cells (A12-F12) to the south of region E and the 6x2 cells (A13 - F14) to the southeast of region E. Notice that 125 cells (regions A, B, C and D) have been coalesced into 4.
- Step 6 If process 402 determines that there are no more regions which meet the criteria of process 401, then process 405 determines if there are any other cells. If so, process 406 selects one such cell and process 407 determines if the selected cell size is near the resolution of the phone's location (e.g. 4x the resolution). If the cell size is smaller than the phone's resolution, then process this cell as described in phase 3, i.e., skip the rest of this step, and when appropriate, send the data from the unsplit cells to the service provider. The reason for this is that a phone knows its own location with some finite precision (100 feet, 100 meters, 1 inch).
- the size of the grid element is equal to that precision or smaller, then it will not do any good to split the grid element into quadrants because the phone would not know which quadrant it was in, and thus, the recorded data for the quadrant would be random at best. For example (using a one-dimensional example), suppose locations are measured in feet from some origin, and the phone has 10-foot resolution. The phone then reports its location as 0 feet, 10 feet, 20 feet, 30 feet, etc. Suppose there is a grid element at the 20-30 foot position, and suppose its size is equal to the resolution, namely 10 feet. If this is split in two (two, rather than four, because this is a one-dimensional example), then the left half (say) would span 20-24 feet and the right half would span 25-29 feet.
- Step 6 says that if a user is in this situation, or near it, then skip the rest of phase 2 for this cell, i.e., skip step 7 in which the cell is split.
- Step 7 If the cell size is not smaller than the phone's resolution and if process 408 determines that there is enough memory to split the cell, then, still following the quadtree representation, split it into four quadrants as shown by process 409. In each quadrant, as shown by process 410, set each counter to 1 ⁇ 4 of the count in the parent's corresponding counter. Thus, cell E of FIGURE 11 would become cells F, G, H and J as shown in FIGURE 12. If, at any point in this step, there is not enough memory to split a cell, then process that cell as described in Phase 3. This step focuses in on the boundary between good and bad areas, and on which side is good/bad. In principle, that boundary can be arbitrarily detailed; but this step constructs only as much detail as possible in the available memory.
- Step 8 Repeat from step 3. For example, after coalescing, cell F would be unchanged and cells G, H, and J would become cells K, L, M, N, P and appear as shown in FIGURE 13.
- step 3 The system should not go back to step 3 if one or more of the counters is near overflow, since this could mean that measurements have been taken for a long time and the overall situation may have changed. In such a situation, the procedure should start over from Phase 1.
- Phase 3 In phase 3, cells are processed to provide the location and orientation of part of a boundary between good and bad coverage. Phase 3 is shown in FIGURE 3, processes 330-332 wherein process 330 determines if it is time to file the data with the central system. If it is, then compute the orientation of the boundary as follows:
- this set of cells is sent with the data, via process 331, from the cellular phone to the central system.
- This transfer can occur periodically, randomly, or on command from the central system, and, this time can be once a year, or every several months, or sooner as desired.
- the system triggers process 302 and phase 2 of embodiment 30 will repeat.
- a mobile device To obtain good statistics, a mobile device must collect data over many calls and many crossings of a boundary. This means that it should have counters which can count fairly high (a few thousand, say). If eight counters per grid element are used, then a 250x250 grid over the home region using 2-byte counters results in 1 megabyte of counters. This can be improved by using 1-byte counters with their range extended as described in Morris, Robert "Counting Large Number Of Events In Small Registers" Communications of the ACM, Volume 21 Number 10, pp. 841-842, October 1978, which is hereby incorporated by reference herein.
- FIGURE 5 shows one example of a hand-held device 50.
- device 50 is a cellular phone having display 51, location detector 56, signal strength detector 57, processor 53, memory 54 and counters 55. Some or all of these elements may not be necessary or can be combined into one or more as desired.
- the mobile device can be any type of device designed to receive wireless broadcast signals, such as, for example, cellular phones, PDAs, navigation systems, computers, vehicle control processors, etc.
- FIGURE 6 shows RF system 600 having RF communication tower 601 controlled by control system 602.
- RF tower 601 is a cellular tower communicating to cellular phones 50-1, 50-2 through 50-n. These cellular phones are mobile and can thus move throughout the coverage area or to other areas. As they each move, they will each contain, within the device, the incremented numbers recorded according to the system and method discussed above. Periodically, this information will be communicated to control system 702 for the purpose of allowing the central system to then determine problems within the coverage areas based upon actual occurring criteria as determined from mobile devices in the course of their normal end-user usage. Note that the home region of each device is defined based upon that device's actual movements, and thus, each home region will be different. This difference then assures that the entire coverage area is monitored.
- This process evolves an ever-more-detailed image of the boundary of coverage holes, in bounded memory and using only 1-byte counters.
- the two main phases of determining the home region and determining holes could run concurrently or alternately, or by constantly updating the counts in the cache, perhaps at a slower rate, once the system has calculated a home location. Updating home location is necessary because the system might have made a wrong choice, or the user's behavior may have changed.
Landscapes
- Engineering & Computer Science (AREA)
- Computer Networks & Wireless Communication (AREA)
- Signal Processing (AREA)
- Mobile Radio Communication Systems (AREA)
Applications Claiming Priority (1)
| Application Number | Priority Date | Filing Date | Title |
|---|---|---|---|
| US10/978,707 US20060094438A1 (en) | 2004-11-01 | 2004-11-01 | System and method for determining user-perceived holes in wireless communication coverage areas |
Publications (2)
| Publication Number | Publication Date |
|---|---|
| EP1655980A2 true EP1655980A2 (de) | 2006-05-10 |
| EP1655980A3 EP1655980A3 (de) | 2008-02-27 |
Family
ID=35784758
Family Applications (1)
| Application Number | Title | Priority Date | Filing Date |
|---|---|---|---|
| EP05256429A Withdrawn EP1655980A3 (de) | 2004-11-01 | 2005-10-17 | System und Verfahren zur Bestimmung von Benutzer wahrgenommenen deckungslosen Zonen in einem drahtlosen Kommunikationssystem |
Country Status (2)
| Country | Link |
|---|---|
| US (1) | US20060094438A1 (de) |
| EP (1) | EP1655980A3 (de) |
Cited By (2)
| Publication number | Priority date | Publication date | Assignee | Title |
|---|---|---|---|---|
| WO2008073012A1 (en) * | 2006-12-12 | 2008-06-19 | Telefonaktiebolaget Lm Ericsson (Publ) | Method and arrangement for locating areas having poor radio coverage |
| EP2763479A4 (de) * | 2012-12-28 | 2015-05-27 | Rakuten Inc | Informationsverarbeitungsvorrichtung, informationsverarbeitungsverfahren, informationsverarbeitungsprogramm und speichermedium mit dem darauf gespeicherten informationsverarbeitungsprogramm |
Families Citing this family (6)
| Publication number | Priority date | Publication date | Assignee | Title |
|---|---|---|---|---|
| EP2404439B1 (de) * | 2009-03-04 | 2019-04-24 | Nokia Corporation | Positionsüberwachung für ein deckungsgebiet |
| EP2404386B1 (de) * | 2009-03-04 | 2017-10-25 | Nokia Technologies Oy | Prüfung von endgerätpositionen an einem endgerät |
| US20110072469A1 (en) * | 2009-09-18 | 2011-03-24 | Nokia Corporation | Addressing Fringe Areas in Broadcast Networks |
| US9094524B2 (en) * | 2012-09-04 | 2015-07-28 | Avaya Inc. | Enhancing conferencing user experience via components |
| US12013775B2 (en) | 2015-12-09 | 2024-06-18 | International Business Machines Corporation | Building coverage metrics and testing strategies for mobile testing via view enumeration |
| US10623911B1 (en) * | 2019-03-28 | 2020-04-14 | Lenovo (Singapore) Pte. Ltd. | Predictive intermittent service notification for a mobile communication device |
Citations (3)
| Publication number | Priority date | Publication date | Assignee | Title |
|---|---|---|---|---|
| US20030061009A1 (en) | 2001-09-21 | 2003-03-27 | Davis Scott B. | Method for mapping poor coverage areas |
| US20040152362A1 (en) | 2003-01-30 | 2004-08-05 | Stephen Carter | Event-triggered data collection |
| US20040203855A1 (en) | 2002-05-07 | 2004-10-14 | Samsung Electronics Co., Ltd. | System and method for identifying coverage holes in a wireless network |
Family Cites Families (10)
| Publication number | Priority date | Publication date | Assignee | Title |
|---|---|---|---|---|
| US5732330A (en) * | 1996-07-02 | 1998-03-24 | Ericsson Inc. | Dual band transceiver |
| US6603966B1 (en) * | 1997-12-23 | 2003-08-05 | At&T Wireless Services, Inc. | Method and system for optimizing performance of a mobile communication system |
| KR100259864B1 (ko) * | 1998-03-06 | 2000-06-15 | 윤종용 | 코드 분할 다중 접속 시스템에서 위치 등록 영역의 설정 방법 |
| US6516195B1 (en) * | 1999-05-14 | 2003-02-04 | Ericsson Inc. | Method and system for optimizing a telecommunications utilizing positioning information in network recording programs |
| US6522888B1 (en) * | 1999-08-31 | 2003-02-18 | Lucent Technologies Inc. | System for determining wireless coverage using location information for a wireless unit |
| US6965773B2 (en) * | 2001-04-05 | 2005-11-15 | International Business Machines Corporation | Virtual cooperative network formed by local clients in zones without cellular services |
| US20030013441A1 (en) * | 2001-07-12 | 2003-01-16 | International Business Machines Corporation | Tracking dropped communications |
| GB2388745A (en) * | 2002-04-30 | 2003-11-19 | Hewlett Packard Co | Mobile communication system with service quality feedback |
| JP2004201001A (ja) * | 2002-12-18 | 2004-07-15 | Matsushita Electric Ind Co Ltd | 移動通信システムおよび移動通信制御方法 |
| US8175587B2 (en) * | 2003-07-10 | 2012-05-08 | Motorola Mobility, Inc. | Obtaining service when in a no-coverage area of a communication system |
-
2004
- 2004-11-01 US US10/978,707 patent/US20060094438A1/en not_active Abandoned
-
2005
- 2005-10-17 EP EP05256429A patent/EP1655980A3/de not_active Withdrawn
Patent Citations (3)
| Publication number | Priority date | Publication date | Assignee | Title |
|---|---|---|---|---|
| US20030061009A1 (en) | 2001-09-21 | 2003-03-27 | Davis Scott B. | Method for mapping poor coverage areas |
| US20040203855A1 (en) | 2002-05-07 | 2004-10-14 | Samsung Electronics Co., Ltd. | System and method for identifying coverage holes in a wireless network |
| US20040152362A1 (en) | 2003-01-30 | 2004-08-05 | Stephen Carter | Event-triggered data collection |
Non-Patent Citations (1)
| Title |
|---|
| MORRIS; ROBERT: "Counting Large Number Of Events In Small Registers", COMMUNICATIONS OF THE ACM, vol. 21, no. 10, October 1978 (1978-10-01), pages 841 - 842 |
Cited By (2)
| Publication number | Priority date | Publication date | Assignee | Title |
|---|---|---|---|---|
| WO2008073012A1 (en) * | 2006-12-12 | 2008-06-19 | Telefonaktiebolaget Lm Ericsson (Publ) | Method and arrangement for locating areas having poor radio coverage |
| EP2763479A4 (de) * | 2012-12-28 | 2015-05-27 | Rakuten Inc | Informationsverarbeitungsvorrichtung, informationsverarbeitungsverfahren, informationsverarbeitungsprogramm und speichermedium mit dem darauf gespeicherten informationsverarbeitungsprogramm |
Also Published As
| Publication number | Publication date |
|---|---|
| EP1655980A3 (de) | 2008-02-27 |
| US20060094438A1 (en) | 2006-05-04 |
Similar Documents
| Publication | Publication Date | Title |
|---|---|---|
| US7356340B2 (en) | System and method for wireless coverage detection | |
| CN105898762B (zh) | 基站优化及部署方法和装置 | |
| EP1351532B1 (de) | Kapazitätsplanung und -optimierung in einem zellularen mobilen Telekommunikationsnetz | |
| US7120449B1 (en) | Location determination in telecommunication network | |
| US9572086B2 (en) | Personal wireless coverage maps | |
| EP2869622B1 (de) | Verfahren und vorrichtung zur lokalisierung der netzwerkaktivität in zellularen kommunikationsnetzwerken | |
| EP3031043B1 (de) | Verwaltung von gesammelten daten zur verkehrsanalyse | |
| CN101426206B (zh) | 一种通信网络话务分布网格化的方法及系统 | |
| CN104427513B (zh) | 一种识别方法、装置、网络设备及网络系统 | |
| US20100103868A1 (en) | Method for modeling wireless network coverage under line-of-sight conditions | |
| CN105657724A (zh) | 用于提供小小区部署规划的技术 | |
| EP1655980A2 (de) | System und Verfahren zur Bestimmung von Benutzer wahrgenommenen deckungslosen Zonen in einem drahtlosen Kommunikationssystem | |
| WO2012142602A1 (en) | Mobile device location estimation using operational data of a wireless network | |
| EP1629683B1 (de) | Verfahren und vorrichtung zur zellenplanung | |
| US12238534B2 (en) | Network expansion optimization | |
| CN114040431B (zh) | 网络测试方法、装置、设备及存储介质 | |
| Egi et al. | An efficient approach for evaluating performance in LTE wireless networks | |
| Herrnleben et al. | Investigating the Predictability of QoS Metrics in Cellular Networks | |
| US12598478B2 (en) | Methods and systems for coverage area deficiency visualizations | |
| KR20050061270A (ko) | 인빌딩 품질관리 시스템 | |
| KR100392374B1 (ko) | 무선통신 사업자간의 통화품질 비교 방법 | |
| CN102802179A (zh) | 一种确定用户常态地址点和据此进行话单数据分析的方法 | |
| CN118158316A (zh) | 异网用户确定方法、装置、设备及存储介质 |
Legal Events
| Date | Code | Title | Description |
|---|---|---|---|
| PUAI | Public reference made under article 153(3) epc to a published international application that has entered the european phase |
Free format text: ORIGINAL CODE: 0009012 |
|
| AK | Designated contracting states |
Kind code of ref document: A2 Designated state(s): AT BE BG CH CY CZ DE DK EE ES FI FR GB GR HU IE IS IT LI LT LU LV MC NL PL PT RO SE SI SK TR |
|
| AX | Request for extension of the european patent |
Extension state: AL BA HR MK YU |
|
| RAP1 | Party data changed (applicant data changed or rights of an application transferred) |
Owner name: AGILENT TECHNOLOGIES, INC. |
|
| PUAL | Search report despatched |
Free format text: ORIGINAL CODE: 0009013 |
|
| AK | Designated contracting states |
Kind code of ref document: A3 Designated state(s): AT BE BG CH CY CZ DE DK EE ES FI FR GB GR HU IE IS IT LI LT LU LV MC NL PL PT RO SE SI SK TR |
|
| AX | Request for extension of the european patent |
Extension state: AL BA HR MK YU |
|
| 17P | Request for examination filed |
Effective date: 20080826 |
|
| AKX | Designation fees paid |
Designated state(s): DE FR GB |
|
| RIC1 | Information provided on ipc code assigned before grant |
Ipc: H04W 16/18 20090101AFI20091203BHEP |
|
| GRAP | Despatch of communication of intention to grant a patent |
Free format text: ORIGINAL CODE: EPIDOSNIGR1 |
|
| STAA | Information on the status of an ep patent application or granted ep patent |
Free format text: STATUS: THE APPLICATION IS DEEMED TO BE WITHDRAWN |
|
| 18D | Application deemed to be withdrawn |
Effective date: 20100504 |