EP1785714A2 - Dispositif d'évaluation de lentilles - Google Patents
Dispositif d'évaluation de lentilles Download PDFInfo
- Publication number
- EP1785714A2 EP1785714A2 EP06023480A EP06023480A EP1785714A2 EP 1785714 A2 EP1785714 A2 EP 1785714A2 EP 06023480 A EP06023480 A EP 06023480A EP 06023480 A EP06023480 A EP 06023480A EP 1785714 A2 EP1785714 A2 EP 1785714A2
- Authority
- EP
- European Patent Office
- Prior art keywords
- image
- point light
- unit
- fitting
- lens evaluation
- Prior art date
- Legal status (The legal status is an assumption and is not a legal conclusion. Google has not performed a legal analysis and makes no representation as to the accuracy of the status listed.)
- Granted
Links
Images





Classifications
-
- G—PHYSICS
- G01—MEASURING; TESTING
- G01M—TESTING STATIC OR DYNAMIC BALANCE OF MACHINES OR STRUCTURES; TESTING OF STRUCTURES OR APPARATUS, NOT OTHERWISE PROVIDED FOR
- G01M11/00—Testing of optical apparatus; Testing structures by optical methods not otherwise provided for
- G01M11/02—Testing optical properties
- G01M11/0242—Testing optical properties by measuring geometrical properties or aberrations
- G01M11/0257—Testing optical properties by measuring geometrical properties or aberrations by analyzing the image formed by the object to be tested
- G01M11/0264—Testing optical properties by measuring geometrical properties or aberrations by analyzing the image formed by the object to be tested by using targets or reference patterns
Definitions
- the present invention relates to a lens evaluation device, and more particularly to a lens evaluation device for evaluating the performance related to an image position of an optical system, specifically lateral magnification, distortion aberration, field curvature and chromatic aberration.
- an evaluation device capable of measuring the performance related to an image position of the optical system, specifically lateral magnification, distortion aberration, field curvature and chromatic aberration with high accuracy is indispensable.
- a pin-hole 51 which becomes a point light source, is installed on the object surface of an optical system 52 to be evaluated and is illuminated from behind by an illumination means, which is not shown in Fig. 1.
- the aerial image 53 of the pin-hole 51 is formed on the image surface of the optical system 52.
- this aerial image 53 is small, an image position with the maximum intensity cannot be measured with sufficient accuracy even if the aerial image is directly picked up by an imaging device. Therefore, its image enlarged by an enlargement optical system 54 is picked up by the imaging device 55.
- its image position can be determined by retrieving a pixel with the maximum brightness from the enlarge image.
- the X, Y and Z coordinates of the image position can be determined.
- the respective positions of the enlargement optical system 54 and the imaging device 55 must be monitored by three pieces of length meter.
- the image In order to determine the shape of the entire object within the view field, the image must be measured while moving the pin-hole 51 to a plurality of positions on the object surface. In this case, the X, Y and Z coordinates of the pin-hole 51 must also be monitored by the length meter.
- Patent references 1-5 and Non-patent reference 1 As the prior art related to the lens evaluation device in this technical field, there are Patent references 1-5 and Non-patent reference 1.
- Non-patent reference 1 " Image Correction for Highly Accurate Image Measurement Using Digital Image", by Nakamura et al., Journal of the Electronic Image Association, Vol.31, No.4, pages 534-541 (7/25/2002 ).
- the field curvature of a confocal microscope can be corrected by the correction data obtained by measuring a flat mirror, the distortion aberration and lateral chromatic aberration cannot be corrected.
- the lens evaluation device in the first aspect of the present invention comprises a plurality of point light sources arrayed on a flat surface, an imaging unit for picking up an object and obtaining the image, a movement unit for changing the relative distance between the point light source or the imaging unit and an optical system to be evaluated, a storage medium on which is recorded a stack image obtained by the imaging unit picking up the images of the plurality of point light sources via the optical system every time the movement unit changes the relative distance, an image position calculation unit for calculating a plurality of image positions from the plurality of point light source images in the stack image recorded on the storage medium and an aberration acquisition unit for fitting an aberration model function to the plurality of image positions calculated by the image position calculation unit and obtaining an aberration measurement value.
- the optical device for picking up the image of an object in the second aspect of the present invention is provided with the lens evaluation device in the first aspect.
- the optical device comprises an image correction unit for correcting the distortion and/or color deviation of the image by the obtained aberration measurement value.
- the present invention is not limited to the lens evaluation device and the optical device.
- the lens evaluation device can also be constituted as a lens evaluation method or a storage medium on which are recorded the lens evaluation program.
- Figs. 2 through 9 and 10 show the lens evaluation device for evaluating the microscopic optical system in the first preferred embodiment of the present invention.
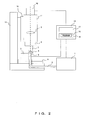
- Fig. 2 shows the side view of the lens evaluation device in the first preferred embodiment and the block diagram of its control system.
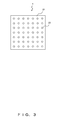
- Fig. 3 shows a pin-hole array specimen.
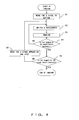
- Fig. 4 is a flowchart showing the picking-up of a stack image.
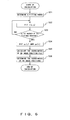
- Fig. 5 is a flowchart showing how to calculate aberration.
- Fig. 6 is a flowchart showing how to calculate an image position.
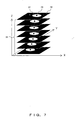
- Fig. 7 shows how to calculate an image position.
- Fig. 8 shows the chromatic aberration in the lateral direction.
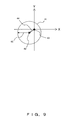
- Fig. 9 shows the operation of the rotation unit of the lens evaluation device.
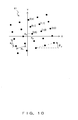
- Fig. 10 shows how to calculate an object point position.
- a light source 1 includes an incandescent light source, a wavelength selection means and a light amount adjustment means inside.
- a halogen lamp, a xenon lamp, a LED or the like is used for the incandescent light source.
- the wavelength selection means is a rotary holder capable of selecting one from a plurality of interference filters and installing it in an optical path.
- the light amount adjustment means which is not shown in Fig. 2, is, for example, a rotary ND filter capable of consecutively changing transmittance in the range between 0 and 100%.
- the wavelength selection means and the light amount adjustment means which are not shown in Fig.
- the wavelength selection means can be replaced with another spectral means or a plurality of light sources each with a different wavelength can be switched.
- the Optical intensity unification unit 3 is composed of rod glass, a diffusion plate or the like that repeats reflection inside.
- the sample 4 is a pin-hole array specimen as shown in Fig. 3.
- Pin-holes 22 are opened on an opaque metal film 21 evaporated on a glass substrate in a lattice shape at equal horizontal/vertical intervals.
- the diameters of all the pin-holes are the same and are smaller than the refraction limit of an object lens 7. Specifically, it is equivalent to or less than the resolution of the optical system to be evaluated.
- the distribution range of the pin-hole array is preferable for the distribution range of the pin-hole array to be wider than the view field of the microscopic optical system to be evaluated.
- the lattice arrangement of the pin-hole array is not limited to that shown in Fig. 3 and it can be another arrangement if it is two-dimensionally periodic.
- the sample 4 is mounted on a Z-axis stage 5 which moves in the optical axis direction of the microscopic optical system including the object lens 7.
- the optical axis of the microscopic optical system is assumed to be the Z-axis.
- the Z-axis stage 5 is a piezo-stage which embeds an electrostatic capacity sensor for monitoring the amount of displacement and can move the sample 4 to an arbitrary Z-axis position by an external control signal.
- An XY stage 6 is a manual stage which can move the Z-axis stage 5 and the sample 4 in a direction perpendicular to the optical axis of the microscopic optical system.
- the microscopic optical system to be evaluated comprises an object lens 7 and an tube lens 9, and forms the image of the sample 4 on the imaging surface of an imaging device 10.
- the imaging device 10 is a two-dimensional CCD having an imaging area which is larger than the imaging range of the microscopic optical system or can picks up the most of it.
- These devices 7, 9, 10 are mounted on an observation tube 11.
- the object lens 7 is mounted on the observation tube 11 via a rotation unit 8.
- the rotation unit 8 can rotate and fix the object lens 7 at an arbitrary angle using the optical axis as the rotation axis.
- the observation tube 11 is mounted on an observation base 13 via a longitudinal movement stage 12 for longitudinally moving it.
- the light source 1, the Z-axis stage 5 and the imaging device 10 are connected to a computer 14.
- the computer 14 comprises a CPU, RAM and ROM 16 on which is recorded a control program 15, which is described later, and the like. By executing the control program 15 recorded on the ROM 16, the CPU controls the connected units to pick up the image of the sample 4 and to calculate an aberration evaluation value.
- the computer 14 further comprises a storage medium 17 on which are recorded image files and the like, an input unit and a display unit.
- An operator mounts an object lens to be evaluated on the rotation unit 8 and mounts a sample 4 with a pin-hole diameter suitable for the object lens 7 on the Z-axis stage 5. Then, while monitoring the image of the imaging device 10 on the screen of the display unit of the computer 14 determines the position of the sample 4 by the XY stage 6 and also focuses the sample 4 by longitudinal movement stage 12 or the Z-axis stage 5.
- This focusing is not limited to manual and, for example, can also be automatic by providing the lens evaluation device with an automatic focusing unit.
- the CPU of the computer 14 After focusing thus, the CPU of the computer 14 starts executing the imaging program.
- This imaging program is part of the control program recorded on the ROM 16 of the computer 14 and controls to automatically pick up a stack image by a plurality of wavelengths.
- the procedure of this imaging program is described below with reference to Fig. 4.
- the plurality of wavelengths is composed of a reference wavelength which is based on when evaluating chromatic aberration and a plurality of wavelengths to be evaluated.
- the Z-axis stage 5 is moved from the focused position (position after the focusing) to the bottom of the imaging range. It is preferable to set the imaging range in the Z direction to approximately several times of focal depth in such a way as to include the respective ranges of the field curvature and chromatic aberration in the longitudinal direction of the object lens to be evaluated.
- the illumination light is switched to one to which S2 and S3, which is described later, are not applied yet in the current Z-axis stage position, of the plurality of wavelengths. Then, the amount of light is switched to an appropriate one by the ND filter (light amount adjustment means) of the light source 1.
- This amount of light is set in advance in such a way that the respective brightness of the stack image by the plurality of wavelengths is matched to the same level.
- the imaging device 10 picks up the image of the sample 4 and transfers it to the computer 14 as an image file.
- the transferred image file is recorded on the storage medium 17 of the computer 14.
- S4 it is determined whether S2 and S3 are applied to all the plurality of wavelengths in the current Z-axis stage position (the number reaches the number of the wavelengths) . If the determination result is yes, the process proceeds to S5. If the determination result is no, the process returns to S2. As described above, by repeating S2 and S3 until the determination result in S4 becomes yes, the image file of each of the plurality of wavelengths in the current Z-axis stage position is transferred to and recorded on the computer 14.
- S5 it is determined whether the number of image files of all the wavelengths transferred to and recorded on the computer 14 reaches the number of stack images covering the imaging range in the Z direction. If the determination result is yes, the imaging by the imaging program is terminated. If the determination result is no, the process proceeds to S6.
- the Z-axis stage 5 is moved upward by one step. It is preferable for this amount of movement to be approximately 1/5 ⁇ 1/10 of the focal depth of the object lens 7 to be evaluated. After S6, the process returns to S2.
- the stack images with the plurality of wavelengths are simultaneously picked up by repeatedly moving the Z-axis stage 5 upward by one step, switching the plurality of wavelengths and sensing each image.
- the drift of a sample position within the sensing time, due to the changes of environmental temperature or the like, in each wavelength becomes almost the same. This is effective in reducing an aberration calculation error, which is described later.
- the analysis program is part of the control program recorded on the ROM 16 of the computer 14 and controls to automatically calculate the lateral magnification, distortion aberration, field curvature and chromatic aberration of the microscopic optical system including the object lens 7.
- the procedure of this analysis program is described below with reference to Fig. 5.
- an image position is calculated from one pin-hole image within the sensing range of the one wavelength, to which S12 is not applied yet.
- the image position means the position of an image point where the intensity of the aerial image of a pin-hole is the maximum.
- the sampling interval of sensing (the pixel interval of the imaging device 10 and the amount of movement for one step in the Z-axis stage 5) is approximately 1/5 ⁇ 1/10 of the size of a pin-hole aerial image, no highly accurate image position can be calculated simply by searching for a pixel position with the maximum brightness. Therefore, in S12, the image position is calculated according to the procedure shown in Fig. 6. The procedure is described in more detail below with reference to Figs. 6 and 7.
- a range where an intensity distribution model is fit to a pin-hole aerial image to be sampled is set.
- To fit means to apply.
- the intensity of the pin-hole aerial image gradually decreases as the pin-hole aerial image goes away from the maximum intensity position. In the neighborhood of the maximum intensity, since the change monotonously decreases and is gradual, it is easy to fit a simple intensity distribution model.
- the fitting range of the longitudinal direction (Z-axis direction) is made the focal depth of the object lens 7.
- the fitting range of the lateral direction (XY-axis direction) is made within 1/2 of the radius of an airy disk.
- ⁇ /NA 2 and 0.3 ⁇ /NA respectively, from the (numerical apertures) NA of the object lens 7 to be evaluated and the wavelength ⁇ of the illumination light.
- a pixel with the maximum brightness is retrieved from the sampled pin-hole aerial image, and a sampling point included within the (cylindrical) fitting range with the pixel position as the center is made a fitting target, which is described below.
- the fitting range can also finely adjusted by increasing/reducing the values.
- Fig. 7 shows how to calculate the image position of one pin-hole aerial image.
- the cross section 27 of a pin-hole aerial image is sampled as each leaf image 28 for each Z-axis position.
- the intensity distribution model I(x, y) of the cross section 27 is fit to the sampling point within the fitting range of one leaf image 28 by the least square method.
- the rotation-symmetrical two-dimensional Gaussian distribution (equation (1)) is adopted as the intensity distribution model which can be easily fit to intensity distribution in the neighborhood of the maximum intensity position.
- I x ⁇ y I ⁇ exp - b 2 x - c c 2 + y - y c 2
- the maximum intensity I of one leaf image 28 and its position (x c , y c ) are calculated from the fitting intensity distribution model I(x, y).
- the maximum intensity I and its position (x c , y c ) which are calculated here is also the maximum value of the fitting intensity distribution model I(x, y) and its plane coordinates, respectively.
- the maximum intensity I and its position (x c , y c ) of one leaf image can be obtained with higher accuracy than the sampling interval in the original XY direction.
- the sampling interval in the original XY direction means, for example, a sampling interval on the object side, which is determined by the pixel interval of the imaging device 10 and the lateral magnification of an optical system to be evaluated.
- an intensity distribution model I (x, y) is fit to the sampling point in the fitting range of one leaf image and the maximum intensity I and its position (x c , y c ) is calculated, it can also be replaced with that a pixel with the maximum brightness value is retrieved from the sampling points within the fitting range of one leaf image, and the brightness value and its position are calculated.
- an aberration equation where the error of each image position is killed by each other can be determined by the fitting of an aberration model function, which is described later, if there are a sufficient number of pin-holes within the sensing view filed.
- S23 it is determined whether S22 is applied to all the leaf images included in the fitting range of the longitudinal direction (the number of files reaches the number of fit images). If the determination result is yes, the process proceeds to S24. If the determination result is no, the process returns to S22. As described above, by repeating S22 until the determination result in S23 becomes yes, the maximum intensity I of each of the leaf images included in the fitting range of the longitudinal direction and its position (x c , y c ) can be calculated. In Fig. 7, the position 29 of each leaf image 28indicates the maximum intensity position (x c , y c ) of each calculated leaf image. In this case, the maximum intensity position of a pin-hole aerial image lies on a straight line connecting the maximum intensity position 29 of each leaf image 28.
- a linear model (primary curve model) is sufficient for a fit model. If the sensing time is long and the amount of drift varies complexly, an n-degree curve model can also be selected.
- the peak position of the n-degree curve model fit to the maximum intensity I(z) of each leaf image as a Z-coordinate function is calculated. This becomes the Z-coordinate of the maximum intensity position of a pin-hole aerial image.
- the XY-coordinates of the maximum intensity position are calculated by assigning the Z-coordinate to the linear models x c (z) and y c (z) calculated in S24.
- the image position calculated thus is converted into the actual coordinates on the object side or on the image side, as requested.
- the sampling interval in the Z direction is converted into the step movement interval (unit: ⁇ m) of the Z-axis stage 5.
- the sampling interval in the XY direction is converted into a value obtained by dividing the pixel interval (unit: ⁇ m) of the imaging device 10 by the lateral magnification of an optical system to be evaluated.
- this lateral magnification is usually sufficient for this lateral magnification to be a design value of the optical system to be evaluated (how to calculate an accurate lateral magnification is described later in S17) . This also applies to the conversion to the actual coordinates on the image side. Then, the calculation of one image position is terminated.
- the XYZ coordinates of one image position can be obtained with higher accuracy than the original sampling interval.
- the calculation procedure of an image position shown in Fig. 6 has an advantage that such a complex transformation can be absorbed by the combination of fairly simple intensity distribution models.
- S13 it is determined whether S12 is applied to all the pin-holes within the sensing range of a stack image with one wavelength (the number reaches the number of the pin-holes). If the determination result is yes, the process proceeds to S14. If the determination result is no, the process returns to S12. As described above, by repeating S12 until the determination result in S13 becomes yes, all the image positions can be calculated from all the pin-holes within the sensing range of a stack image with one wavelength.
- S14 it is determined whether S11 through S13 are applied to all the plurality of wavelengths (the number reaches the number of the wavelengths). If the determination result is yes, the process proceeds to S15. If the determination result is no, the process returns to S11. As described above, by repeating S11 through S13 until the determination result in S14 becomes yes, all the image positions within the sensing range of each of the stack images with a plurality of wavelengths can be calculated. In other words, the distribution of image positions of each wavelength can be calculated.
- an object point position specifically the position of each pin-hole of the pin-hole array specimen is calculated.
- This object point position is needed to evaluate especially the lateral magnification and the distortion aberration.
- the optical system to be evaluated is of compression type like a camera lens, sufficient measurement accuracy can be obtained by actual measurement since the interval between the obj ect points of the specimen is wide.
- an enlargement optical system such as a microscopic optical system, it is difficult to actually calculate the highly accurate XY-coordinates of an object point position.
- the highly accurate pin-hole interval of a pin-hole array specimen can be obtained by a manufacturing technique such as photolithography or the like. How to calculate an installation position when installing it on the object side of the optical system to be evaluated is described below with reference to Figs. 2 and 10.
- Fig. 10 shows the positional relationship between a pin-hole array specimen 61 (sample 4) arranged in a rectangular lattice at lattice intervals a x and a y and coordinates on the object side.
- the origin of the coordinates is the optical axis of the optical system, and the XY axes are directed to the horizontal and vertical directions of the imaging device 10.
- the sample 4 is fixed on the Z-axis stage 5.
- the angle between the pin-hole array directions and the vertical/horizontal directions of the imaging device 10 is assumed to be ⁇ p .
- the index (p,q) of each pin-hole is determined as shown in Fig. 10 with one pin-hole near the coordinate origin as an index (0, 0).
- the position of a pin-hole with index (0, 0) is assumed to be (x p , y p ) .
- the object point position (x, y) of the pin-hole with index (p, q) is expressed as follows by angle ⁇ p rotation and parallel movement (x p , y p ).
- the coordinate origin on the image side is defined as a position where the coordinate origin on the object side is formed by the reference wavelength. Furthermore, if the distortion aberration of the microscopic optical system is neglected since it is generally very small, the image position (X, Y) of each pin-hole at the reference wavelength becomes as follows. ⁇ is the average of the lateral magnification in a measurement area.
- A ⁇ ⁇ cos ⁇ p
- B - ⁇ ⁇ sin ⁇ p
- C ⁇ ⁇ ⁇ x p
- D ⁇ ⁇ sin ⁇ p
- E ⁇ ⁇ cos ⁇ p
- F ⁇ ⁇ ⁇ y p
- (x p , y p ), ⁇ p and ⁇ can be obtained as follows.
- ⁇ p and ⁇ are the averages of values obtained from two planes.
- x p C A 2 + B 2
- index (p, q) an independent variable.
- the imaging equation in the lateral direction including the lateral magnification and the distortion aberration coefficient is determined. If the aberration of the optical system to be evaluated is highly corrected, high-degree distortion aberration can be neglected.
- the amount of movement of an image position, due to the lowest order (third) distortion aberration is in proportion to the cube of the distance from the "center of distortion", and its direction lies on a straight line connecting the center of distortion and the object point position. Therefore, the imaging equation in the lateral direction, specifically the relationship equation between the position r of an object point and that R of an image point can be expressed as follows.
- R ⁇ 0 r + R s - A 3 ⁇ r - r c 2 ⁇ r - r c , where
- ⁇ 0 , R s , A 3 and r c of equation (12) are calculated as follows, using the image position (X, Y) calculated in S11 through S15 and the object point position (x, y) actually measured or calculated in S16.
- the image position calculated by assigning the object point position r i of the i-th pin-hole of N measured pin-holes to the imaging equation (12) is assumed to be R' i .
- the image position obtained by measuring the i-th pin-hole is assumed to be R i .
- the imaging equation (12) is fit to its actual image position. Therefore, the parameters ⁇ 0 , R s , A 3 and r c are optimized in such a way that the evaluation function S of the following equation (13) can be minimized.
- the optimization is performed by a general iterative optimization algorithm for a non-linear model, such as the "steepest descent method” or the like (see W. H. Press et al., "Numerical Recipe in C: the Art of Scientific Computing 2nd Ed.”, Cambridge University Press (1922 )) .
- the measurement value of an image position (X, Y) corresponding an arbitrary object point position (x, y) can be obtained from the imaging equation in the lateral direction, calculated thus.
- equation (4) is assigned to equation (13) . Then, ⁇ p and (x p , y p ) as well as parameters ⁇ 0 , R s , A 3 and r c can be calculated by the above-described iterative optimization.
- ⁇ 0 and A 3 can also be calculated as follows.
- the imaging equation in the lateral direction (equation (12)) is transformed as follows.
- R r ⁇ 0 - A 3 ⁇ r 2
- the imaging equation in the lateral direction can be determined from one image picked up in the focused state.
- the S1 of the flowchart (Fig. 4) of sensing a stack image can be modified to "Move Z stage to the focal position" and S5 and S6 can be omitted.
- S23 through S25 of the flowchart of calculating the image position can be omitted.
- the imaging equation in the longitudinal direction (equation (18)) is determined by fitting a quadratic surface model to the Z-coordinate of the image position calculated in S11 through S15, corresponding to the object point position r calculated in S16.
- a coefficient c is a quadratic coefficient expressing an field curvature
- x 0 , y 0 and Z 0 are the coordinates of the peak of the quadratic surface.
- ⁇ X(x, y) and ⁇ Y(x, y) are chromatic aberration distribution in the lateral direction. If the aberration of the optical system to be evaluated is highly corrected and it is sufficient to take into consideration only a small lateral magnification difference due to a wavelength, specifically the chromatic aberration of magnification, the distribution of the XY coordinates of an image position is shown in Fig. 8. As shown in Fig. 8, the image position 32 of an evaluation wavelength (white circle in Fig. 8) slightly deviates sideway against the image position of the reference wavelength 31 (black circle) by the difference of the lateral magnification. In this case, the positional relationship between both has the following nature.
- ⁇ X and ⁇ Y can be expressed by the following linear equations (19) and (20).
- the coefficient A is a "magnification chromatic aberration coefficient".
- the lateral chromatic aberration expressions are determined by fitting the linear model of equations (19) and (20) to all the image position differences ⁇ X and ⁇ Y by the least square method.
- the measurement value of the lateral chromatic aberration corresponding to an arbitrary object point position (x, y) can be obtained from the calculated lateral chromatic aberration expression.
- the ⁇ Z(x, y) is the chromatic aberration distribution in the longitudinal direction.
- the longitudinal chromatic aberration becomes the quadratic surface like equation (18). Therefore, the longitudinal chromatic aberration expression is determined by fitting a quadratic surface model to all the image position difference ⁇ Z(x, y) by the least square method.
- the measurement value of the longitudinal chromatic aberration corresponding to an arbitrary object point position (x, y) can be obtained from the calculated longitudinal chromatic aberration expression. If it is suitable to set an field curvature model including higher order terms in the optical system, the model function of the longitudinal chromatic aberration should also be modified so.
- the respective chromatic aberration in the lateral and longitudinal directions can also be calculated according to the imaging equations calculated in S17 and S18. Specifically, the image positions (X, Y) of an evaluation wavelength and the reference wavelength, corresponding to an arbitrary object point position (x, y) are obtained from the imaging equation in the lateral direction. In this case, the measurement value of the lateral chromatic aberration corresponding to the object point position (x, y) can be obtained as the difference between both. The chromatic aberration in the longitudinal direction can be obtained similarly.
- S20 it is determined whether S17 through S19 are applied to all the plurality of wavelengths (the number reaches the number of the wavelengths). If the determination result is yes, the calculation of the evaluation value by the analysis program is terminated. If the determination result is no, the process returns to S17. As described above, by repeating S17 through S19 until the determination result in S20 becomes yes, the imaging equations in the lateral and longitudinal directions and the chromatic aberration expression (only the evaluation wavelength) of the plurality of wavelengths can be determined. Specifically, the respective measurement values of the lateral magnification, distortion aberration, field curvature and lateral/longitudinal chromatic aberration can be obtained.
- Each image position has measurement errors, such as an error due to the uneven surface of the sample 4, the error in the amount of movement of the Z-axis stage 5, the error of image position calculation and the like.
- measurement errors such as an error due to the uneven surface of the sample 4, the error in the amount of movement of the Z-axis stage 5, the error of image position calculation and the like.
- the measurement errors of each image position are killed by each other, thereby determining highly accurate aberration expressions.
- an object point position can be calculated by dividing the image position of the reference wavelength calculated in S11 through S15 by the lateral magnification in the design of the optical system. In this case, there is always no need to arrange the pin-hole arrays of the sample 4 regularly. However, if the fitting of an aberration is taken into consideration, it is preferable to almost uniformly distribute pin-holes in the sensing view field.
- a highly accurate image position is calculated by repeating the fitting of a model function (see Fig. 6).
- the pixel position with the maximum brightness in all the stack images of each pin-hole can also be retrieved and be specified as the image position.
- the accuracy of a calculated aberration expression decreases compared with the procedure shown in Fig. 6.
- the center of gravity position of intensity can be calculated instead of the maximum intensity position of the leaf image or all the stack image of a pin-hole.
- the maximum intensity position is more preferable.
- an imaging equation including the distortion aberration or field curvature that is rotation symmetric around the center of aberration is adopted.
- another form of an imaging equation including a rotation-asymmetric aberration can also be adopted.
- a component due to the object lens 7, of the parameters of the XY coordinates (the center of the lateral chromatic aberration, etc.) included in the imaging equation in the lateral/longitudinal directions and the chromatic aberration expression also rotates and moves accordingly.
- the operation is described below with reference to Fig. 9.
- the movement of the XY coordinates accompanying the rotation draws the locus of a circle 41.
- the center 42 of the circle 41 does not always coincide with the center 43 of the view field.
- the difference 44 between both is a component due to the errors in the disposition of the optical system other than the object lens 7 and devices.
- the radius of the circle 45 is a component due to the object lens 7.
- the rotation unit 8 is rotated by 180 degrees and the same measurement is performed.
- the average of the parameters of the XY coordinates of both is a component due to other than the object lens 7. 1/2 of the difference between both is a component due to the object lens 7.
- the measurement is performed, for example, in four positions of 0, 90, 180 and 270 degrees and the center 42 and radius 45 of the circle 41 is calculated, both components can be separated with further higher accuracy.
- the parameters of the Z coordinate (Z coordinate of the peak of the field curvature, etc.) and parameters other than the coordinate (lateral magnification, each aberration coefficient, etc.), included in the imaging equation in the lateral/longitudinal directions and the chromatic aberration expression never change accompanying the rotation.
- the measurement errors of these values can be improved by averaging the plurality of measurement values.
- the imaging device 10 can also be moved and a stack image can also be picked up.
- at least one movement means for relatively changing the distance between the optical system to be evaluated and either the sample 4 or the imaging device 10 is necessary.
- the light source can be replaced with another preferred form as long as a plurality of point light sources is arranged on the plane.
- it can be replaced with the output terminal array of optical fibers, a illuminants like fluorescent beads, etc. which are arranged on the plane.
- the pin-hole array specimen as shown in Fig. 3 is assumed to "negative", its "positive” specimen can also be used. Specifically, a specimen in which only the parts of the metal film 21 corresponding to the pin-holes 22 shown in Fig. 3 are left and the other parts of metal film 21 are eliminated can be used.
- each metal film 21 can be regarded to be a plurality of point light sources when such a specimen is illuminated from top.
- a illuminant with a single wavelength such as a light-emitting diode array can also be used. It is preferable for the size of this point light source to be equal to or less than the resolution of the optical system to be evaluated.
- the measurement accuracy can be further improved by increasing the number of point light sources in the sensing view field. Furthermore, the measurement accuracy can be further improved by using an imaging device 10 whose pixel density per sensing area is high, specifically an imaging device with high pixel density.
- Fig. 11 shows the side view of the fluorescent confocal microscope of the lens evaluation device in the second preferred embodiment and the block diagram of its control system.
- a plurality of pieces of illumination light (excitation light) from a laser light source 101 for emitting laser beams with a plurality of wavelength is collected to the focal position of a sample 107 by an object lens system 106 via an XY scanner 104 and a total reflector 105.
- Reflection light (fluorescent) from the sample 107 is branched and reflected by a dichroic mirror 103 provided between the XY scanner 104 and the laser light source 101 via the object lens system 106 and the total reflector 105 and is received by a light detection system 110 via a confocal optical system 109.
- a confocal optical system 109 In this case, only reflection light from the focal position is inputted to the light detection system 110, by the confocal effect of the confocal optical system 109.
- the inputted light is converted into electric signals by the light detection system 110 and is transmitted to a computer 112 as brightness information.
- the XY scanner 104 comprises an X galvano-mirror for swinging the luminous flux of the illumination light from the laser light source 101 to the X direction and a Y galvano-mirror for swinging the luminous flux to the Y direction perpendicular to the X direction, which can scan the light condensation position in the sample in the X and Y directions that are perpendicular to each other against the optical axis.
- the Z stage 108 can move the mounted sample 107 in the optical axis direction while maintaining it, by which it can move the focal position of the sample 107 to the Z direction, which is the optical axis direction.
- a computer 112 builds up the scan image of the sample 107 from the brightness information outputted from the light detection system 110 according to the scanning through the sample 107 of the illumination light by the XY scanner 104.
- the built scan image can be viewed by displaying it on a display unit 113.
- a control unit 111 controls the wavelength switching of the laser light source 101 and the operation of the XY scanner 104 and the Z stage 108 based on instructions of the computer 112.
- the operator focuses a stack image by the Z stage 108 while displaying the image obtained by the scan of the XY scanner 104 on a display unit 113. Then, the CPU of the computer 112 starts executing a sensing program.
- the sensing program is part of a control program recorded on the computer 112 and automatically controls to pick up the stack image with a plurality of wavelengths. The procedure by this sensing program is described below with reference to Fig. 4.
- the plurality of wavelengths is emitted by the laser light source 101 for emitting laser beams with a plurality of wavelengths.
- the Z stage 108 is moved from the focused position (position after the focusing) to the bottom of the sensing range. It is preferable to set the sensing range in the Z direction to approximately several times of focal depth in such a way as to include the field curvature and the chromatic aberration range in the longitudinal direction of the object lens system 106.
- the wavelength of the laser light source 101 is switched to one to which S2 and S3 are not applied yet in the current Z-axis stage position, of the plurality of wavelengths.
- the image of the sample 107 is picked up by the scanning of the XY scanner 104 and is recorded on the storage medium of the computer 112.
- S4 it is determined whether S2 and S3 are applied to all the plurality of wavelengths in the current Z stage position (the number reaches the number of the wavelengths) . If the determination result is yes, the process proceeds to S5. If the determination result is no, the process returns to S2. As described above, by repeating S2 and S3 until the determination result in S4 becomes yes, the image files of each of the plurality of wavelengths in the current Z stage 108 position are recorded on the computer 112.
- S5 it is determined whether the number of the image files of each wavelength transferred to and recorded on the computer 112 reaches the number of stack images covering the sensing range in the Z direction. If the determination result is yes, the sensing by the sensing program is terminated. If the determination result is no, the process proceeds to S6.
- the Z stage 108 is moved upward by one step. It is preferable for this amount of movement to be approximately 1/5 ⁇ 1/10 of the focal depth of the object lens system 106 to be evaluated. After S6, the process returns to S2.
- a general sample whose image is corrected is picked up.
- the procedure of sensing using a plurality of wavelengths is the same as that shown in Fig. 4.
- the sensing range in the Z direction is set according to the distance in the depth direction of the sample.
- the stack image of a general sample, picked up thus is hereinafter called an "original image”.
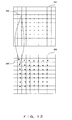
- Fig. 12 shows the correspondence in the X Y coordinates between the object side and the image side.
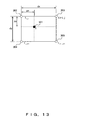
- Fig. 13 shows an interpolation method used to correct an image.
- Fig. 14 is a flowchart showing the correction of an image.
- the XY coordinates of each pixel (hereinafter called an "object point") of an image after correction (hereinafter called a "corrected image”) are determined.
- the pixel interval of the corrected image is equal to a value obtained by converting the sampling interval of the original image into that on the object (sample) side. However, depending on its usage, it can be larger or smaller than it.
- the coordinate value 203 of each pixel (object point) of the corrected image 201 is arranged in a lattice as shown in Fig. 12.
- the coordinates of an image point corresponding to the first object point of the corrected image is determined.
- the coordinates can be obtained by assigning the coordinates of the object point to the imaging equation in the lateral direction (equation (12)), which is already calculated by an aberration evaluation means, of the first wavelength by which the original image has been picked up.
- the coordinate value 203 of the object point of the corrected image 201 is converted into the coordinate value 204 of the image point of the original image 202.
- the brightness value I at the coordinate value 301 of the image point is calculated by linearly interpolating the brightness values, Ii, j ⁇ Ii+1, j+1 of the interpolation source pixels 302-305. This linear interpolation is expressed as follows.
- I dx - px dx ⁇ dy - py dy ⁇ I i , j + px dx ⁇ dy - py dy ⁇ I i + 1 , j + dx - px dx ⁇ py dy ⁇ I i , j + 1 + px dx ⁇ py dy ⁇ I i + 1 , j + 1
- i and j, dx and dy and px and py are the pixel numbers in the XY directions of the original image, the sampling intervals in the XY directions of the original image and the differences in the XY coordinates between the first interpolation source pixel 302 and the image point 301, respectively.
- This interpolation brightness value is stored as the brightness value of the object point of the corrected image.
- S35 it is determined whether S32-S34 are applied to all the plurality of object points in the corrected image of the current leaf image. If the determination result is yes, the process proceeds to S36. If the determination result is no, the process returns to S32. As described above, by repeating S32-S34 until the determination result in S35 becomes yes, the corrected image of the current leaf image is completed.
- S36 it is determined whether S32-S35 are applied to all the leaf images of the stack image of the current wavelength. If the determination result is yes, the process proceeds to S37. If the determination result is no, the process returns to S32. As described above, by repeating S32-S35 until the determination result in S36 becomes yes, the corrected image of the stack image of the current wavelength is completed.
- S37 it is determined whether S32-S36 are applied to all the plurality of wavelengths. If the determination result is yes, the image correction is terminated. If the determination result is no, the process returns to S32. As described above, by repeating S32-S36 until the determination result in S37 becomes yes, the corrected images of the stack image of all the wavelengths are completed.
- a corrected image from which the chromatic aberration of magnification (difference in the lateral magnification by wavelength) and deviation due to the lateral chromatic aberration are eliminated can be obtained.
- images measured by a plurality of wavelengths can be overlapped and painted without positional deviations.
- a corrected image from which lateral magnification errors and distortion aberration are eliminated and corresponds to the accurate XY coordinates of an object can also be obtained.
- accurate distance information and the like can be obtained from a corrected image.
- the comprehensive influence on the image distortion covering all optical devices from the laser light source 101 up to the light detection system 110 can be evaluated and corrected.
- the brightness of a corrected image can be calculated by calculating the Z coordinate of an image point corresponding to an object point according to the imaging equation in the longitudinal direction (equation (18)) and linearly interpolating the brightness value of two pixels of the original image, which encircle the image point in the Z direction.
- equation (18) the imaging equation in the longitudinal direction
- linearly interpolating the brightness value of two pixels of the original image which encircle the image point in the Z direction.
- Those of the XYZ directions can also be corrected simultaneously in the same procedure.
- the XYZ coordinates of an image point corresponding to an object can be calculated according to the imaging equations in the longitudinal/lateral directions.
- the brightness value of a corrected image can be calculated by linearly interpolating eight pixels of an original image, which encircle the image point most closely. Equation (21) can be easily extended to three-dimensional linear interpolation.
- a confocal microscope for scanning through a sample by one light condensation point is described.
- the present invention is also applicable to a confocal microscope for scanning through a sample by a plurality of light condensation points using a Nipknow' s disk or the like.
- Excitation light and fluorescent light are somewhat different in the fluorescent confocal microscope. In the preferred embodiment, evaluation is performed by only excitation light wavelengths. However, when a plurality of fluorescent bead samples arranged on the plane is adopted as the sample 107 of a point light source array, more accurate evaluation including a wavelength difference between excitation light and fluorescent light is possible.
- a point light source array can be formed by the trans-illumination and a pin-hole array specimen as in the first preferred.
- an arbitrary evaluation wavelength can be specified different from a laser light source, aberration can be evaluated by a fluorescent light wavelength or a wavelength between excitation light and fluorescent light, and an image can also be corrected by it.
- the linear interpolation of the most close pixel is adopted as an interpolation method used to calculate a corrected image from the original image of a sample.
- the interpolation method is not limited to this.
- the brightness value of a corrected image can also be calculated by a method using far more pixels of the original image or using another interpolation equation.
- a corrected image is calculated for a part of an original image or the entire original image.
- a corrected image is not always necessary for usages, such as image measurement or the like. For example, when a distance between two points on the original image is calculated, the distance can be calculated after getting the coordinates of the object points corresponding to the two image points using the imaging equations in the longitudinal/lateral directions.
- the image of a wide-field microscope instead of the confocal microscope can also be corrected by the aberration evaluation values of the present invention.
- aberration evaluation values can be measured by representative wavelength of the three-color or a wavelength band via each of three-color filters. The color deviation, distortion and the like can be eliminated by correcting each color image by the evaluation value and then re-combining them.
- the lens evaluation device in each preferred embodiment can also be applied to optical systems or optical devices other than a microscope.
- appropriate point light sources must be prepared.
- This also applies to the amount of step movement and movement range of a movement means for sensing a stack image.
- the requirements necessary in that case is already clear from the above description.
- the algorithm for determining the imaging equations in the lateral/longitudinal directions and chromatic aberration expressions on basis of a stack image the same one as in the preferred embodiment of the microscopic optical system can be used.
- the image correction based on it can also be used.
- the lateral magnification, distortion aberration, field curvature and chromatic aberration of an optical system can be evaluated with high accuracy by collectively sensing the stack images of a plurality of point light sources distributed in the view field by a two-dimensional imaging device and also using an algorithm for applying the fitting of appropriate model functions to the calculation of an image position and aberration.
- the XY coordinates of an image position can be calculated with accuracy lower than the pixel interval of the imaging device, no highly accurate length meter is need to measure them. Since a view field is collectively picked up, a measurement time is widely shortened.
- this evaluation means By mounting this evaluation means on an optical device, the distortion or color deviation of an image picked up by the optical device can also be corrected.
Landscapes
- Physics & Mathematics (AREA)
- Geometry (AREA)
- Chemical & Material Sciences (AREA)
- Analytical Chemistry (AREA)
- General Physics & Mathematics (AREA)
- Testing Of Optical Devices Or Fibers (AREA)
Applications Claiming Priority (3)
| Application Number | Priority Date | Filing Date | Title |
|---|---|---|---|
| JP2005330451 | 2005-11-15 | ||
| JP2006199640A JP2007163455A (ja) | 2005-11-15 | 2006-07-21 | レンズ評価装置 |
| JP2006259189A JP4937686B2 (ja) | 2005-11-15 | 2006-09-25 | レンズ評価装置 |
Publications (3)
| Publication Number | Publication Date |
|---|---|
| EP1785714A2 true EP1785714A2 (fr) | 2007-05-16 |
| EP1785714A3 EP1785714A3 (fr) | 2009-07-29 |
| EP1785714B1 EP1785714B1 (fr) | 2017-02-22 |
Family
ID=37712449
Family Applications (1)
| Application Number | Title | Priority Date | Filing Date |
|---|---|---|---|
| EP06023480.4A Active EP1785714B1 (fr) | 2005-11-15 | 2006-11-10 | Dispositif d'évaluation de lentilles |
Country Status (3)
| Country | Link |
|---|---|
| US (1) | US7747101B2 (fr) |
| EP (1) | EP1785714B1 (fr) |
| CN (1) | CN1967185B (fr) |
Cited By (4)
| Publication number | Priority date | Publication date | Assignee | Title |
|---|---|---|---|---|
| WO2009000906A1 (fr) * | 2007-06-26 | 2008-12-31 | Dublin City University | Procédé pour l'étalonnage et la suppression de haute précision de la distorsion de lentille |
| EP1990624A3 (fr) * | 2007-05-09 | 2009-08-19 | Olympus Corporation | Appareil et procédé d'évaluation d'un système optique |
| NL1040008C2 (en) * | 2013-01-18 | 2014-07-21 | Univ Delft Tech | Optical and integrated inspection apparatus and method. |
| EP2622397A4 (fr) * | 2010-09-29 | 2018-04-04 | GE Healthcare Bio-Sciences Corp. | Cibles d'étalonnage pour imagerie microscopique |
Families Citing this family (36)
| Publication number | Priority date | Publication date | Assignee | Title |
|---|---|---|---|---|
| CN1918513B (zh) * | 2004-02-05 | 2011-02-02 | 皇家飞利浦电子股份有限公司 | 掩模检查装置和方法 |
| US8027813B2 (en) * | 2004-02-20 | 2011-09-27 | Nikon Precision, Inc. | Method and system for reconstructing aberrated image profiles through simulation |
| CN101191995A (zh) * | 2006-11-27 | 2008-06-04 | 鸿富锦精密工业(深圳)有限公司 | 光学镜头测试装置 |
| US8975599B2 (en) * | 2007-05-03 | 2015-03-10 | Asml Netherlands B.V. | Image sensor, lithographic apparatus comprising an image sensor and use of an image sensor in a lithographic apparatus |
| CN101458441B (zh) * | 2007-12-11 | 2011-06-22 | 鸿富锦精密工业(深圳)有限公司 | 测试线对图板、镜头光学解析量测系统及其量测方法 |
| WO2010131181A1 (fr) * | 2009-05-15 | 2010-11-18 | Koninklijke Philips Electronics N.V. | Sonde optique avec correction à rétroaction |
| CN102449527B (zh) * | 2009-06-02 | 2015-08-19 | 株式会社尼康 | 图像处理装置、图像处理方法和显微镜 |
| JP5592715B2 (ja) * | 2010-07-02 | 2014-09-17 | オリンパス株式会社 | 画像処理装置および画像処理方法 |
| US20130169788A1 (en) * | 2010-10-29 | 2013-07-04 | Canon Kabushiki Kaisha | Microscope, image acquisition apparatus, and image acquisition system |
| US8711275B2 (en) | 2011-05-31 | 2014-04-29 | Apple Inc. | Estimating optical characteristics of a camera component using sharpness sweep data |
| US8547439B2 (en) | 2012-02-23 | 2013-10-01 | Apple Inc. | Testing an optical characteristic of a camera component |
| CN102607816B (zh) * | 2012-03-17 | 2014-08-13 | 哈尔滨工业大学 | 利用匀速动点目标的光学系统横向放大率测量方法 |
| US20130321773A1 (en) * | 2012-06-05 | 2013-12-05 | Cheng-Chung Lee | Optometric Automatic Test Device and Method |
| JP6000773B2 (ja) * | 2012-09-13 | 2016-10-05 | キヤノン株式会社 | 収差推定方法、プログラムおよび撮像装置 |
| CN103837093B (zh) * | 2012-11-20 | 2017-09-12 | 鸿富锦精密工业(深圳)有限公司 | 光谱共焦传感器校准系统及方法 |
| CN103257034A (zh) * | 2013-05-16 | 2013-08-21 | 中国科学院长春光学精密机械与物理研究所 | 基于高精度二维平移台的探测器错位成像实验装置和方法 |
| DE112014003220B4 (de) * | 2013-07-11 | 2025-08-28 | Kla-Tencor Corporation | Konfigurationen für einen Metrologietisch und Verfahren zum Betreiben des Metrologietisches |
| CN104378916B (zh) * | 2013-08-13 | 2018-04-03 | 达观科技有限公司 | 物件校正方法 |
| DE102014003145A1 (de) * | 2014-03-04 | 2015-09-10 | Carl Zeiss Microscopy Gmbh | Verfahren zur Korrektur der sphärischen Aberration bei mikroskopischen Anwendungen |
| CN104462643A (zh) * | 2014-10-28 | 2015-03-25 | 张红军 | 基于计算机处理的三维空间的加工系统 |
| US9970754B2 (en) | 2015-08-26 | 2018-05-15 | Industrial Technology Research Institute | Surface measurement device and method thereof |
| CN108152005B (zh) * | 2016-12-06 | 2020-02-07 | 宁波舜宇车载光学技术有限公司 | 一种自动取放测量装置 |
| CN107063638B (zh) * | 2017-05-24 | 2024-03-08 | 茂莱(南京)仪器有限公司 | 一种基于模组化高精度显微镜系统的测试装置 |
| CN109286798B (zh) * | 2017-07-21 | 2020-03-20 | 深圳市Tcl高新技术开发有限公司 | 一种投影屏幕的边框位置识别方法、系统及终端设备 |
| CN107966274B (zh) * | 2017-10-31 | 2020-10-20 | 宁波永新光学股份有限公司 | 一种高倍物镜色差的定量检测装置和检测方法 |
| JP6631647B2 (ja) * | 2018-03-08 | 2020-01-15 | 株式会社島津製作所 | 走査型プローブ顕微鏡及び表面画像補正方法 |
| CN108989789B (zh) * | 2018-07-11 | 2020-05-05 | 深圳职业技术学院 | 一种摄像头成像质量实时评价方法 |
| US10852123B2 (en) | 2018-10-25 | 2020-12-01 | Government Of The United States Of America, As Represented By The Secretary Of Commerce | Apparatus for critical-dimension localization microscopy |
| US10704094B1 (en) | 2018-11-14 | 2020-07-07 | Element Biosciences, Inc. | Multipart reagents having increased avidity for polymerase binding |
| US11060138B1 (en) | 2020-01-17 | 2021-07-13 | Element Biosciences, Inc. | Nucleic acid sequencing systems |
| CN112325765B (zh) * | 2020-10-23 | 2022-04-05 | 苏州中科全象智能科技有限公司 | 一种面阵点扫描分光白光干涉仪 |
| CN112964454B (zh) * | 2021-02-05 | 2024-06-07 | 深圳中科飞测科技股份有限公司 | 检测系统及检测方法 |
| AU2022316142A1 (en) | 2021-07-21 | 2024-02-22 | Element Biosciences, Inc. | Optical systems for nucleic acid sequencing and methods thereof |
| CN114581380B (zh) * | 2022-02-16 | 2024-08-20 | 合肥埃科光电科技股份有限公司 | 一种基于fpga的色散矫正方法及存储介质 |
| CN118654865B (zh) * | 2024-08-20 | 2024-11-12 | 深圳中科飞测科技股份有限公司 | 一种物镜检测方法和相关装置 |
| CN119224968B (zh) * | 2024-10-08 | 2025-06-03 | 重庆联庆瑞奇科技有限公司 | 一种针对高通量样本全自动显微成像的快速对焦方法及系统 |
Family Cites Families (28)
| Publication number | Priority date | Publication date | Assignee | Title |
|---|---|---|---|---|
| US3904294A (en) * | 1973-12-28 | 1975-09-09 | Polaroid Corp | Automatic lens testing apparatus |
| JPS58205834A (ja) * | 1982-05-25 | 1983-11-30 | Canon Inc | 収差測定方法 |
| JPH01270605A (ja) | 1988-04-22 | 1989-10-27 | Olympus Optical Co Ltd | 表面形状測定器 |
| US5661816A (en) * | 1991-10-22 | 1997-08-26 | Optikos Corporation | Image analysis system |
| JP3391470B2 (ja) | 1992-01-17 | 2003-03-31 | 株式会社ニコン | 投影露光装置、及び投影露光方法 |
| JP3141539B2 (ja) | 1992-06-30 | 2001-03-05 | 富士通株式会社 | 無線機とその自動周波数調整方法 |
| US5402224A (en) * | 1992-09-25 | 1995-03-28 | Nikon Corporation | Distortion inspecting method for projection optical system |
| JP3484732B2 (ja) * | 1993-09-29 | 2004-01-06 | ソニー株式会社 | レンズの特性評価装置 |
| FR2716543B1 (fr) * | 1994-02-18 | 1996-04-12 | Luneau Sa | Procédé d'analyse topométrique de verres correcteurs, et appareils pour la mise en Óoeuvre de ce procédé. |
| WO1995034800A1 (fr) * | 1994-06-14 | 1995-12-21 | Visionix Ltd. | Appareil de mappage d'elements optiques |
| US5541731A (en) * | 1995-04-28 | 1996-07-30 | International Business Machines Corporation | Interferometric measurement and alignment technique for laser scanners |
| KR970003401A (ko) * | 1995-06-20 | 1997-01-28 | 김주용 | 디스톨션 체크용 레티클 |
| US5642441A (en) * | 1995-10-24 | 1997-06-24 | Neopath, Inc. | Separation apparatus and method for measuring focal plane |
| US6038089A (en) * | 1996-05-14 | 2000-03-14 | Asahi Kogaku Kogyo Kabushiki Kaisha | Beam shaping optical system |
| JP3927774B2 (ja) * | 2000-03-21 | 2007-06-13 | キヤノン株式会社 | 計測方法及びそれを用いた投影露光装置 |
| JP3730831B2 (ja) * | 2000-03-31 | 2006-01-05 | パイオニア株式会社 | 収差測定装置及び調整装置 |
| JP3429280B2 (ja) * | 2000-09-05 | 2003-07-22 | 理化学研究所 | 画像のレンズ歪みの補正方法 |
| US6693704B1 (en) * | 2000-09-26 | 2004-02-17 | Nikon Corporation | Wave surface aberration measurement device, wave surface aberration measurement method, and projection lens fabricated by the device and the method |
| JP2004534964A (ja) * | 2001-04-27 | 2004-11-18 | ノバルティス アクチエンゲゼルシャフト | 自動レンズ設計及び製造システム |
| DE10126546A1 (de) * | 2001-05-30 | 2002-12-05 | Wilfried Donner | Vorrichtung und Verfahren zur Ermittlung eines ortsabhängigen Intensitäts- und Farbprofils und/oder Schärfeprofils optischer Linsensysteme |
| US6816247B1 (en) * | 2001-08-14 | 2004-11-09 | Carl Zeiss Smt Ag | Moiré method and a system for measuring the distortion of an optical imaging system |
| JP3654220B2 (ja) * | 2001-08-22 | 2005-06-02 | セイコーエプソン株式会社 | レンズ検査装置 |
| AUPS190002A0 (en) * | 2002-04-23 | 2002-05-30 | University Of Adelaide, The | Optical testing method and apparatus |
| JP2004163207A (ja) * | 2002-11-12 | 2004-06-10 | Olympus Corp | レンズ測定装置および測定方法 |
| WO2004090611A2 (fr) * | 2003-03-31 | 2004-10-21 | Bausch & Lomb Incorporated | Lentilles intraoculaires et procede pour diminuer les aberrations dans un systeme oculaire |
| JP2005291900A (ja) * | 2004-03-31 | 2005-10-20 | Nidek Co Ltd | レンズメータ |
| JP2006195790A (ja) | 2005-01-14 | 2006-07-27 | Nippon Telegr & Teleph Corp <Ntt> | レンズ歪推定装置、レンズ歪推定方法、及びレンズ歪推定プログラム |
| JP2006195789A (ja) | 2005-01-14 | 2006-07-27 | Nippon Telegr & Teleph Corp <Ntt> | レンズ歪推定装置、レンズ歪推定方法、及びレンズ歪推定プログラム |
-
2006
- 2006-11-10 EP EP06023480.4A patent/EP1785714B1/fr active Active
- 2006-11-13 US US11/598,446 patent/US7747101B2/en active Active
- 2006-11-14 CN CN2006101384428A patent/CN1967185B/zh active Active
Non-Patent Citations (1)
| Title |
|---|
| None |
Cited By (8)
| Publication number | Priority date | Publication date | Assignee | Title |
|---|---|---|---|---|
| EP1990624A3 (fr) * | 2007-05-09 | 2009-08-19 | Olympus Corporation | Appareil et procédé d'évaluation d'un système optique |
| US7761257B2 (en) | 2007-05-09 | 2010-07-20 | Olympus Corporation | Apparatus and method for evaluating optical system |
| WO2009000906A1 (fr) * | 2007-06-26 | 2008-12-31 | Dublin City University | Procédé pour l'étalonnage et la suppression de haute précision de la distorsion de lentille |
| US8681224B2 (en) | 2007-06-26 | 2014-03-25 | Dublin City University | Method for high precision lens distortion calibration and removal |
| EP2622397A4 (fr) * | 2010-09-29 | 2018-04-04 | GE Healthcare Bio-Sciences Corp. | Cibles d'étalonnage pour imagerie microscopique |
| EP2622397B1 (fr) | 2010-09-29 | 2020-04-22 | Global Life Sciences Solutions USA LLC | Cibles d'étalonnage pour imagerie microscopique |
| NL1040008C2 (en) * | 2013-01-18 | 2014-07-21 | Univ Delft Tech | Optical and integrated inspection apparatus and method. |
| WO2014112877A1 (fr) * | 2013-01-18 | 2014-07-24 | Delmic B.V. | Appareil d'inspection optique et intégré et procédé associé |
Also Published As
| Publication number | Publication date |
|---|---|
| US20070115457A1 (en) | 2007-05-24 |
| US7747101B2 (en) | 2010-06-29 |
| EP1785714B1 (fr) | 2017-02-22 |
| EP1785714A3 (fr) | 2009-07-29 |
| CN1967185A (zh) | 2007-05-23 |
| CN1967185B (zh) | 2012-06-20 |
Similar Documents
| Publication | Publication Date | Title |
|---|---|---|
| US7747101B2 (en) | Lens evaluation device | |
| US7761257B2 (en) | Apparatus and method for evaluating optical system | |
| CN105308949B (zh) | 图像获取装置、图像获取方法以及记录介质 | |
| JP7321391B2 (ja) | ジェムストーン鑑別のための撮像支援走査型分光法 | |
| US7817287B2 (en) | Optical three-dimensional measurement device and filter process method | |
| JP6771584B2 (ja) | デジタルパソロジーのカラーキャリブレーションおよび実証 | |
| US20110134254A1 (en) | Measuring and correcting lens distortion in a multispot scanning device | |
| JPWO2011138874A1 (ja) | 高さ測定方法及び高さ測定装置 | |
| JP4937686B2 (ja) | レンズ評価装置 | |
| CN115718071B (zh) | 一种面向表面缺陷检测的视觉信息采集装置及方法 | |
| CN120721220B (zh) | 一种显示屏子像素的光谱测试系统及光谱测试方法 | |
| KR102885022B1 (ko) | 가변-줌 이미징 장치 | |
| EP4597027A1 (fr) | Appareil et procédé d'inspection de forme tridimensionnelle | |
| US20250085527A1 (en) | Calibration target, fourier ptychographic imaging system and method for calibrating a fourier ptychographic imaging system | |
| JP2020159759A (ja) | 画像処理方法及び測定装置 | |
| NL2028376B1 (en) | Method of and arrangement for verifying an alignment of an infinity-corrected objective. | |
| US20040245437A1 (en) | Method and apparatus for creating high-quality digital images | |
| JP5385206B2 (ja) | 測光装置 | |
| JP2007163455A (ja) | レンズ評価装置 | |
| CN120740774B (zh) | 光学测量装置和系统 | |
| Wu et al. | A compact modulation transfer function colorimeter module | |
| WO2026035459A1 (fr) | Procédé et système de détection de défocalisation d'un système optique | |
| CN121742004A (zh) | 一种高光谱显微镜 | |
| CN121252689A (zh) | 基于超表面光谱成像芯片的光谱共焦三维形貌还原方法和系统 | |
| CN121548722A (zh) | 用于生成三维物体的3d记录的记录装置及方法 |
Legal Events
| Date | Code | Title | Description |
|---|---|---|---|
| PUAI | Public reference made under article 153(3) epc to a published international application that has entered the european phase |
Free format text: ORIGINAL CODE: 0009012 |
|
| AK | Designated contracting states |
Kind code of ref document: A2 Designated state(s): AT BE BG CH CY CZ DE DK EE ES FI FR GB GR HU IE IS IT LI LT LU LV MC NL PL PT RO SE SI SK TR |
|
| AX | Request for extension of the european patent |
Extension state: AL BA HR MK YU |
|
| PUAL | Search report despatched |
Free format text: ORIGINAL CODE: 0009013 |
|
| AK | Designated contracting states |
Kind code of ref document: A3 Designated state(s): AT BE BG CH CY CZ DE DK EE ES FI FR GB GR HU IE IS IT LI LT LU LV MC NL PL PT RO SE SI SK TR |
|
| AX | Request for extension of the european patent |
Extension state: AL BA HR MK RS |
|
| 17P | Request for examination filed |
Effective date: 20100128 |
|
| AKX | Designation fees paid |
Designated state(s): DE FR GB |
|
| 17Q | First examination report despatched |
Effective date: 20110405 |
|
| RAP1 | Party data changed (applicant data changed or rights of an application transferred) |
Owner name: OLYMPUS CORPORATION |
|
| GRAP | Despatch of communication of intention to grant a patent |
Free format text: ORIGINAL CODE: EPIDOSNIGR1 |
|
| RAP1 | Party data changed (applicant data changed or rights of an application transferred) |
Owner name: OLYMPUS CORPORATION |
|
| RIN1 | Information on inventor provided before grant (corrected) |
Inventor name: MATSUZAWA, TOSHIAKI Inventor name: EDA, YUKIO Inventor name: MORITA, TERUMASA Inventor name: RYU, GO |
|
| INTG | Intention to grant announced |
Effective date: 20161004 |
|
| GRAS | Grant fee paid |
Free format text: ORIGINAL CODE: EPIDOSNIGR3 |
|
| GRAA | (expected) grant |
Free format text: ORIGINAL CODE: 0009210 |
|
| AK | Designated contracting states |
Kind code of ref document: B1 Designated state(s): DE FR GB |
|
| REG | Reference to a national code |
Ref country code: GB Ref legal event code: FG4D |
|
| REG | Reference to a national code |
Ref country code: DE Ref legal event code: R096 Ref document number: 602006051756 Country of ref document: DE |
|
| REG | Reference to a national code |
Ref country code: DE Ref legal event code: R097 Ref document number: 602006051756 Country of ref document: DE |
|
| PLBE | No opposition filed within time limit |
Free format text: ORIGINAL CODE: 0009261 |
|
| STAA | Information on the status of an ep patent application or granted ep patent |
Free format text: STATUS: NO OPPOSITION FILED WITHIN TIME LIMIT |
|
| 26N | No opposition filed |
Effective date: 20171123 |
|
| GBPC | Gb: european patent ceased through non-payment of renewal fee |
Effective date: 20171110 |
|
| REG | Reference to a national code |
Ref country code: FR Ref legal event code: ST Effective date: 20180731 |
|
| PG25 | Lapsed in a contracting state [announced via postgrant information from national office to epo] |
Ref country code: FR Free format text: LAPSE BECAUSE OF NON-PAYMENT OF DUE FEES Effective date: 20171130 |
|
| PG25 | Lapsed in a contracting state [announced via postgrant information from national office to epo] |
Ref country code: GB Free format text: LAPSE BECAUSE OF NON-PAYMENT OF DUE FEES Effective date: 20171110 |
|
| REG | Reference to a national code |
Ref country code: DE Ref legal event code: R081 Ref document number: 602006051756 Country of ref document: DE Owner name: EVIDENT CORPORATION, JP Free format text: FORMER OWNER: OLYMPUS CORPORATION, TOKIO/TOKYO, JP |
|
| PGFP | Annual fee paid to national office [announced via postgrant information from national office to epo] |
Ref country code: DE Payment date: 20250930 Year of fee payment: 20 |