EP1801682B1 - Système d'analyse des informations pour systèmes de distribution d'eau et conduites d'eau - Google Patents
Système d'analyse des informations pour systèmes de distribution d'eau et conduites d'eau Download PDFInfo
- Publication number
- EP1801682B1 EP1801682B1 EP20060026436 EP06026436A EP1801682B1 EP 1801682 B1 EP1801682 B1 EP 1801682B1 EP 20060026436 EP20060026436 EP 20060026436 EP 06026436 A EP06026436 A EP 06026436A EP 1801682 B1 EP1801682 B1 EP 1801682B1
- Authority
- EP
- European Patent Office
- Prior art keywords
- data
- flow rate
- pipeline
- water distribution
- pressure
- Prior art date
- Legal status (The legal status is an assumption and is not a legal conclusion. Google has not performed a legal analysis and makes no representation as to the accuracy of the status listed.)
- Ceased
Links
Images



Classifications
-
- G—PHYSICS
- G05—CONTROLLING; REGULATING
- G05B—CONTROL OR REGULATING SYSTEMS IN GENERAL; FUNCTIONAL ELEMENTS OF SUCH SYSTEMS; MONITORING OR TESTING ARRANGEMENTS FOR SUCH SYSTEMS OR ELEMENTS
- G05B23/00—Testing or monitoring of control systems or parts thereof
- G05B23/02—Electric testing or monitoring
- G05B23/0205—Electric testing or monitoring by means of a monitoring system capable of detecting and responding to faults
- G05B23/0218—Electric testing or monitoring by means of a monitoring system capable of detecting and responding to faults characterised by the fault detection method dealing with either existing or incipient faults
- G05B23/0224—Process history based detection method, e.g. whereby history implies the availability of large amounts of data
- G05B23/024—Quantitative history assessment, e.g. mathematical relationships between available data; Functions therefor; Principal component analysis [PCA]; Partial least square [PLS]; Statistical classifiers, e.g. Bayesian networks, linear regression or correlation analysis; Neural networks
Definitions
- the invention relates to an information analysis system for water distribution and pipelines which analyzes the information on the water distribution and pipelines, taking in the data about the inflow of clean water flowing from one water distribution pond into a water distribution pipeline network and the data about the pressure of one position properly selected in the water distribution pipeline network.
- flow meters and pressure indicators are set up at required positions of pipelines in the water distribution pipeline network in order to measure the flow rate and pressure of the pipelines, and a condition of the water distribution pipeline network is monitored according to these measured values.
- these measured data is used for creating a feedback signal of pressure control and flow rate control, detecting an abnormal value by setting the upper/lower limits in the flow rate, and creating daily and monthly reports as the basic information.
- a pipeline network analysis is performed generally, but it has to previously set necessary data including the information of a water distribution pipeline, the altitude where the pipeline is set, and the flow rate data for every point, thereby analyzing the pipeline network by simulation. Therefore, it takes a long time and much labor.
- the present invention is made taking the above situation into consideration and the object of the invention is to supply an information analysis system for water distribution and pipelines which can always keep pressure properly in a water distribution pipeline network and adequately recognize the condition of the water distribution pipeline network which changes on the second time scale.
- the invention provides a water distribution/pipeline information analysis system comprised of the following configuration.
- the information analysis system for water distribution and pipelines in one of the systems of the first and second aspects, further comprises: daily time lag compensating means, having a memory for taking in the flow rate data and the pressure data collected by the data collecting means and storing the data for one day, for selecting a time lag presenting a highest correlation between the flow rate data and the pressure data for one day stored in the memory, to compensate and supply the flow rate data and the related pressure data for the one day to the approximate expression calculating means sequentially.
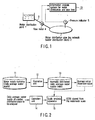
- FIG. 1 is a schematic view showing a process to which an information analysis system for water distribution and pipelines according to the invention is applied.
- the system is for the process in which clean water is supplied from one water distribution pond 1 to a water distribution pipeline network (hereinafter, referred to as a water distribution block) 2. It is provided with a flow meter 4 for measuring the inflow of clean water in a clean water injection pipe 3 near the entrance of the water distribution block 2 and a pressure indicator 5 for measuring the water distribution pressure within the water distribution block 2 in an appropriate pipe within the water distribution block 2.
- the data measured by the flow meter 4 and the pressure indicator 5 is transmitted to an information analysis system 10 for water distribution and pipelines.
- the daily average water supply according to the nationwide water supply statistics ranges widely from 1,000 m 3 /d to 4500,000 m 3 /d and it is not normally distributed in a histogram with water supply divided by the regular water distribution amounts. Therefore, rank of the daily average water supply of the objective distribution block with respect to the nationwide water supply statistics can not be obtained without an area of normally-distributed water amount.
- the daily average water supply from the nationwide water supply statistics is converted by a normal distribution converting formula to obtain a normally distributed histogram in advance.
- a normal distribution converting formula By using an average value and a dispersion value obtained from this histogram, the daily average water supply obtained from the data about the above-mentioned distribution block which is collected by the flow meter 4 and the pressure indicator 5 at a predetermined cycle (for example, a cycle of 5 seconds) is analyzed, thereby making it possible to recognize the water supply scale with probability, without checking the water supply statistics by using the daily average water supply in another water supply block to be analyzed.
- FIG. 2 is a block diagram showing a first embodiment of the information analysis system for water distribution and pipelines system according to the invention.
- the reference numeral 11 denotes a database in which actual daily average water supply data of each water supply business unit according to the nationwide water supply statistics is stored.
- An operation unit 12 takes each daily average water supply data from the database 11 and converts the daily average water supply by the normal distribution converting formula shown in the following formula (1).
- a histogram of the daily average water supply of each water supply business unit according to the nationwide water supply statistics is normally distributed and stored into a disk 13 as a daily average water supply index (average value and dispersion value).
- V log 10 ⁇ Q / 1000 1 / 2.5
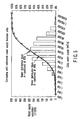
- the daily average water supply distribution of each water supply business unit in the whole country stored in the database 11 is expressed in a graph, as shown in FIG. 3A , with the daily average water supply on an abscissa and the number of business units on an ordinate. As is apparent from FIG. 3A , even if a histogram of the daily average water supply for the regular water distribution amount is obtained, it is found that the histogram is not normally distributed.
- the daily average water supply distribution of each water supply business unit in the whole country converted by the above-mentioned formula (1) is expressed in a graph as shown in FIG. 3B .
- the daily average water supply is normally distributed and the average value and the dispersion value can be obtained from the normally distributed daily average water supply index.
- the daily average water supply data in the water distribution block to be analyzed is supplied to an operation unit 14 and the operation unit 14 converts the daily average water supply according to the above-mentioned formula (1) and supplies the resultant value to a scale analysis apparatus 15.
- the scale analysis apparatus 15 is provided with a normal distribution probability table, not illustrated, in which the daily average water supply index (average value and dispersion value) stored in the above-mentioned disk 13 is stored in advance, the scale analysis apparatus 15 calculates the percentage of the value converted in the operation unit 14 in the whole country scale based on the average value and the dispersion value stored in the normal distribution probability table and outputs the result.
- each daily average water supply in the water distribution block A and the water distribution block B shown in FIG. 4 is analyzed by the above-mentioned water distribution information analysis system
- each daily average water supply in the water distribution blocks A and B is normally distributed as shown in FIG. 5 and the daily average water supply obtained by dividing the water supply amount on the abscissa can be compared all over the whole water supply business units throughout the country.
- the above-mentioned water distribution blocks A and B are seen from the viewpoint of water supply population per one day, it is found that they are positioned at a level of the larger number of plants and that they are plants having the typical scale in Japan's water supply business.
- a normally distributed histogram obtained by converting the daily average water supply according to the nationwide water supply statistics by the normal distribution converting formula (1) is obtained in advance, and the daily average water supply in the water distribution block to be analyzed is analyzed with the average value and the dispersion value obtained from this histogram, thereby making it easy to recognize what scaled business unit the monitored block corresponds to in the water distribution scale from the view of the nationwide water supply statistics, without checking it with the nationwide water supply statistics in the conventional way.
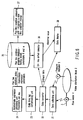
- FIG. 6 is a block diagram showing an information analysis system for water distribution and pipelines according to a second embodiment of the invention.
- the reference numeral 21 is a data collecting unit which takes in the flow rate data and the pressure data respectively measured by the one flow meter 4 mounted in the clean water injection pipe 3 near the entrance of the water distribution block 2 and the one pressure indicator 5 mounted in the appropriate pipe within the water distribution block 2, as shown in FIG. 1 , at regular intervals, for example, at intervals of 0.85 second.
- the reference numeral 22 is a data converter which converts the flow rate data and the pressure data collected by the data collecting unit 21 into data of intervals necessary for calculation, for example, data of 5-second intervals.
- the reference numeral 23 is a daily time lag compensating unit which takes in the flow rate data and the pressure data converted by the data converter 22, stores the data for one day into a memory provided in the unit 23 not illustrated, and selects a time lag showing the highest correlation between the flow rate data and the pressure data for one day stored in the memory to compensate the lag. Since the measurement between the data respectively transmitted from the flow meter 4 and the pressure indicator 5 has each time lag, the daily time lag compensating unit 23 is to compensate the time lags to obtain related data. Namely, since the output of the flow meter 4 and the output of the pressure indicator 5 are not obtained simultaneously, it is not possible to obtain correctly a calculation result of Hazen William's formula (described later). Therefore, in order to perform the correct calculation, the time lag appearing when the flow rate data and the pressure data have the highest correlation is compensated to be zero.
- the reference numeral 24 is an approximate expression calculating unit which sequentially takes in the flow rate data and the pressure data for one day at intervals of 5 seconds compensated by the daily time lag compensating unit 23, and calculates an approximate pressure based on the modified Hazen William's formula specifically mentioned below, handling a virtual pipeline total length L and a flow rate correction coefficient ⁇ per day as parameters in the least-square method.
- the approximate pressure is obtained when a least-square difference between the calculated approximate pressure and the measured pressure become minimum.
- the reference numeral 25 is a pipeline condition grasping database which stores the parameters obtained by the approximate expression calculating unit 24.
- the reference numeral 26 is an on-line defect detector which calculates the pressure value based on the Hazen William's approximate expression with the parameters stored in the pipeline condition grasping database 25 while receiving the flow rate data and the pressure data at intervals of 5 seconds from the data converter 22, and detects an abnormal value when a water head difference between the above pressure value and an actually measured pressure value is deviated more than a predetermined value (for example, 2.5 m or 3.3 m or more).
- a predetermined value for example, 2.5 m or 3.3 m or more.
- the reference numeral 27 is a pipeline condition analyzing unit which is provided with a learning function of recognizing the condition of a pipeline while monitoring the values of the virtual pipeline total length L and the flow rate correction coefficient ⁇ per day stored in the pipeline condition grasping database unit 25, labeling the portfolios of the parameters as a learning item, and classifying the pipe network into patterns.
- the pipe network will have 25 categories or patterns.
- the pipe network is labeled as "label 2", for example.
- the reference numeral 28 is a data display which displays the abnormal value detected by the on-line defect detector 26 and the flow rate data and pressure data of 5-second intervals converted by the data converter 22.
- the data collecting unit 21 receives the flow rate data and the pressure data respectively measured by the flow meter 4 and the pressure indicator 5, for example, at intervals of 0.85 second, the flow rate data and the pressure data are converted into the data, for example, of 5-second intervals by the data converter 22 and supplied to the daily time lag compensating unit 23.
- the daily time lag compensating unit 23 stores the flow rate data and the pressure data for one day supplied from the data converter 22 into the memory not illustrated and selects a time lag showing the highest correlation between the flow rate data and the pressure data to compensate the lag.
- H loss 10.67 ⁇ L ⁇ Q 1.85 ⁇ ⁇ / C 1.85 ⁇ D 4.87
- H loss water head loss
- L virtual pipeline total length (m)
- Q indicated value of the flow meter
- C flow velocity coefficient (set at 110)
- D diameter of pipe (set at the inflow pipe diameter 500 [mm] shown in FIG. 4 , in this case)
- ⁇ flow rate correction coefficient of a water distribution block.
- the Hazen William's formula is primarily a formula for calculating the water head loss of one pipeline, but it is applied to the pipeline network. In this case, since the pipeline network is not formed of one pipeline, the water head loss becomes larger even in the same flow rate in some cases. Therefore, the coefficient ⁇ for increasing the apparent flow rate is introduced in the modified formula (2) .
- the flow rate and the pressure of the pipeline network can be approximated by one virtual pipeline and its characteristics can be compared with each other.
- an approximate expression having ⁇ at its flow rate part is adopted and the approximation method is adapted to extract the parameter in which the least square difference between this expression and the actual measurement is the least. Namely, when apparent flow rate is increased, for example, the pipeline loss caused by the flow resistance will be increased, which can be recognized by the reduction of the pressure in the pipeline.
- H loss R ⁇ Q 1.85 ⁇ ⁇
- R 10.67 ⁇ L / C 1.85 ⁇ D 4.85
- L virtual pipeline length
- C flow velocity coefficient
- D pipeline diameter
- the daily virtual pipeline total length L obtained in this way is stored into the pipeline condition grasping database 25 with the R obtained from the above expression and the flow rate correction coefficient ⁇ as the parameters.
- the character R denotes a general pipeline resistance which is determined definitely irrespective of the flow rate in the pipeline. Since the pipeline coefficient C and the pipeline diameter D are predetermined, the pipeline resistance R may be determined in accordance with the value of the virtual pipeline total length L.
- the on-line defect detector 26 receives the flow rate data and the pressure data at intervals of 5 seconds from the data base converter 22, the parameters R and ⁇ and the actually measured flow rate data stored in the pipeline condition grasping database 25 of, for example, the previous day are given to the Hazen William's approximate expression in order to calculate the pressure value, and this pressure value and the actually measured pressure value are supplied to the data display 27.
- FIG. 8 is a graph showing the correlation between the inflow rate and the water head in one time zone (13:00 to 13:30) of a trend graph of the daily flow rate and the daily water head in the water distribution block 2 displayed by the data display 27 in an enlarged way.
- the flow rate changes momently, the pressure obtained by calculating the correlation between the flow rate and the water head through the approximate expression shown in the formula (2) is shown in a waveform as shown by a thin line and the actually measured pressure is shown in the waveform as shown by a thick line.
- an abnormal change of the flow rate can be detected by taking the parts C and D in FIG. 8 exceeding the upper/lower limits as the abnormal change of the water head.
- the pipeline condition analyzing unit 27 monitors the values of the virtual pipeline total length L and the flow rate correction coefficient ⁇ for every day stored in the pipeline condition grasping database 25, in order to recognize the pipeline condition and it has a learning function of labeling the portfolios of the parameters as a learning item and classifying the pipe network into patterns.
- FIG. 9 shows an example of the correlation graph between the flow rate correction coefficient ⁇ and the virtual pipeline total length L obtained from the measurement data of pressure and flow rate during a period of time when the pressure reducing valve set for keeping water pressure operates normally.
- the flow rate correction coefficient ⁇ is distributed in the range of 1.57 to 1.71 and the virtual pipeline total length L is distributed in the range of 45,000 [m] to 66,000 [m]. Therefore, when the pressure reducing valve operates normally, the pipeline resistance in the water distribution block 2 may increase, and the virtual pipeline total length L in the approximate expression shown in the formula (2) increases, and as a result, the flow rate correction coefficient ⁇ also increases. In other words, when the correlation between the length L and the coefficient ⁇ varies as shown by the graph of FIG. 9 , it is possible to recognize that the pressure reduction valve is operating normally in the pipeline network.
- FIG. 10 shows an example of the correlation graph between the flow rate correction coefficient ⁇ and the virtual pipeline total length L obtained from the measurement data of the pressure and the flow rate during a period of time after a defect of the pressure reducing valve is solved.
- the flow rate correction coefficient ⁇ changes in the range of 0.97 to 1.13 and the virtual pipeline total length L changes in the range of 11,000 [m] to 16,800 [m]. It comes from the fact that the defect of the pressure reducing valve is solved and secondary side pressure of the pressure reducing valve becomes normal, and as the result, it is found that the virtual pipeline total length becomes short and that the value of the flow rate correction coefficient ⁇ changes in the vicinity of one. For example, if a prescribed pressure loss appears in the pipeline even after the pressure reducing valve is make ineffective, it can be determined that the pressure reducing valve is in a defect condition.
Landscapes
- Physics & Mathematics (AREA)
- Engineering & Computer Science (AREA)
- Artificial Intelligence (AREA)
- Evolutionary Computation (AREA)
- Mathematical Physics (AREA)
- General Physics & Mathematics (AREA)
- Automation & Control Theory (AREA)
- Pipeline Systems (AREA)
- Management, Administration, Business Operations System, And Electronic Commerce (AREA)
- Flow Control (AREA)
Claims (3)
- Système d'analyse d'information pour la distribution et des conduites d'eau caractérisé en ce qu'il comporte :des moyens de collecte de données (21) destinés à capter, à des intervalles prédéterminés, des données de débit et des données de pression transmises de manière respective par un débitmètre qui mesure un débit d'eau propre s'écoulant depuis un réservoir de distribution d'eau jusqu'à un réseau de conduite de distribution d'eau et un manomètre qui mesure une pression d'une conduite dans une position appropriée dans le réseau de conduite de distribution d'eau ;des moyens de calcul d'expression approchée (24) destinés à capter les données de débit et les données de pression pour un jour collectées par les moyens de collecte de données de manière séquentielle, afin de calculer les données sur la base de l'expression approchée de Hazen William présentée ci-dessous, et d'obtenir une longueur totale de conduite virtuelle et un coefficient de correction de débit par jour comme paramètres par une méthode des moindres carrés de façon à stocker des données de valeur ainsi obtenues dans une base de données de saisie d'état de conduite,
 Hloss : perte de charge d'eauL : longueur totale de conduite virtuelle (m)Q : valeur indiquée du débitmètreC : coefficient de vitesse d'écoulementD : diamètre du tuyau (mm)α : coefficient de correction de débit d'un bloc de distribution d'eau ; etdes moyens de détection de défaut en ligne (26) destinés à capter les données de débit et les données de pression collectées par les moyens de collecte de données aux intervalles prédéterminés, à calculer une valeur de pression sur la base de l'expression approchée de Hazen William avec les paramètres stockés dans la base de données de saisie d'état de conduite, et à détecter une valeur anormale quand une différence de charge d'eau entre la valeur de pression calculée et la valeur de pression réellement mesurée s'écarte d'une valeur prédéterminée et davantage.
 - Système d'analyse d'information pour la distribution et des conduites d'eau caractérisé en ce qu'il comporte :des moyens de collecte de données (21) destinés à capter, à des intervalles prédéterminés, des données de débit et des données de pression transmises de manière respective par un débitmètre qui mesure un débit d'eau propre s'écoulant depuis un réservoir de distribution d'eau jusqu'à un réseau de conduite de distribution d'eau et un manomètre qui mesure une pression d'une conduite dans une position appropriée dans le réseau de conduite de distribution d'eau ;des moyens de calcul d'expression approchée (24) destinés à capter les données de débit et les données de pression pour un jour collectées par les moyens de collecte de données de manière séquentielle, afin de calculer les données sur la base de l'expression approchée de Hazen William présentée ci-dessous, et d'obtenir une longueur totale de conduite virtuelle et un coefficient de correction de débit par jour comme paramètres par une méthode des moindres carrés de façon à stocker des données de valeur ainsi calculées dans une base de données de saisie d'état de conduite,
 Hloss : perte de charge d'eauL : longueur totale de conduite virtuelle (m)Q : valeur indiquée du débitmètreC : coefficient de vitesse d'écoulementD : diamètre du tuyau (mm)α : coefficient de correction de débit d'un bloc de distribution d'eau ; etdes moyens d'analyse d'état de conduite (27) destinés à identifier un état de conduite tout en surveillant les valeurs des paramètres par jour stockées dans la base de données d'état de conduite, les moyens d'analyse ayant une fonction d'apprentissage destinée à marquer des dossiers des paramètres comme élément d'apprentissage et à classer le réseau de conduite en modèles.
 - Système d'analyse d'information pour la distribution et des conduites d'eau selon la revendication 1 ou la revendication 2, caractérisé en ce qu'il comporte en outre :des moyens de compensation de retard quotidien (23), ayant une mémoire destinée à capter les données de débit et les données de pression collectées par les moyens de collecte de données et à stocker les données pour un jour, afin de sélectionner un retard présentant une corrélation la plus élevée entre les données de débit et les données de pression pour un jour stockées dans la mémoire, de façon à compenser le retard et afin de délivrer les données de débit et les données de pression compensées pour un jour aux moyens de calcul d'expression approchée d'une manière séquentielle.
Applications Claiming Priority (1)
| Application Number | Priority Date | Filing Date | Title |
|---|---|---|---|
| JP2005368195A JP4799168B2 (ja) | 2005-12-21 | 2005-12-21 | 配水及び管路情報解析システム |
Publications (2)
| Publication Number | Publication Date |
|---|---|
| EP1801682A1 EP1801682A1 (fr) | 2007-06-27 |
| EP1801682B1 true EP1801682B1 (fr) | 2012-08-08 |
Family
ID=37712459
Family Applications (1)
| Application Number | Title | Priority Date | Filing Date |
|---|---|---|---|
| EP20060026436 Ceased EP1801682B1 (fr) | 2005-12-21 | 2006-12-20 | Système d'analyse des informations pour systèmes de distribution d'eau et conduites d'eau |
Country Status (3)
| Country | Link |
|---|---|
| EP (1) | EP1801682B1 (fr) |
| JP (1) | JP4799168B2 (fr) |
| CN (1) | CN100558994C (fr) |
Families Citing this family (20)
| Publication number | Priority date | Publication date | Assignee | Title |
|---|---|---|---|---|
| JP5019197B2 (ja) * | 2006-03-31 | 2012-09-05 | 株式会社東芝 | 配水情報管理装置 |
| JP5333589B2 (ja) * | 2009-07-01 | 2013-11-06 | 日本電気株式会社 | 代表特徴抽出システムおよび方法 |
| US20120166158A1 (en) * | 2010-12-28 | 2012-06-28 | Kyrolos Paul El Giheny | Predicting droplet populations in piping flows |
| CN102519556B (zh) * | 2011-12-02 | 2013-11-20 | 北京航空航天大学 | 一种大口径电磁流量计在线校准的方法 |
| ES2585412T3 (es) * | 2012-02-05 | 2016-10-05 | Minimax Gmbh & Co Kg | Sistema de extinción de incendios |
| US9952060B2 (en) * | 2012-10-16 | 2018-04-24 | Lyonnaise Des Eaux France | Method for the real-time estimation of the total consumption of a fluid distributed to users, and a distribution network implementing said method |
| WO2016027528A1 (fr) * | 2014-08-20 | 2016-02-25 | 三菱電機株式会社 | Dispositif de création d'informations de système d'usine |
| JP6520253B2 (ja) * | 2015-03-17 | 2019-05-29 | 株式会社明電舎 | 配水管網計算装置及び配水管網計算方法 |
| RU2637527C1 (ru) * | 2017-02-09 | 2017-12-05 | Государственное Унитарное Предприятие "Водоканал Санкт-Петербурга" | Система оценки водопритока |
| JP7067895B2 (ja) * | 2017-10-25 | 2022-05-16 | 株式会社東芝 | 末端圧力制御支援装置、末端圧力制御支援方法及びコンピュータプログラム |
| JP7279413B2 (ja) * | 2019-02-27 | 2023-05-23 | 株式会社デンソー | 故障予知システム |
| KR102113951B1 (ko) * | 2019-04-17 | 2020-05-21 | 한국수자원공사 | IoT 기반 실시간 무선 수압계 및 이를 포함하는 상수도 관리 시스템 |
| CN112947360B (zh) * | 2021-01-26 | 2021-09-03 | 山东省计算中心(国家超级计算济南中心) | 基于状态转换时延图的水分配系统异常检测方法及系统 |
| CN113653951A (zh) * | 2021-08-11 | 2021-11-16 | 蚌埠学院 | 一种基于水压采样数据的供水管网状态监测方法 |
| CN113987948B (zh) * | 2021-11-03 | 2022-11-04 | 江苏四联水务科技有限公司 | 一种泵站出水流量智能测算方法及系统 |
| CN116451877B (zh) * | 2023-06-16 | 2023-09-01 | 中国石油大学(华东) | 一种基于可计算语义网络的管网停开井产量预测方法 |
| CN117471940B (zh) * | 2023-10-30 | 2024-08-02 | 中亿丰(苏州)城市建设发展股份有限公司 | 基于城市建设的给排水节能控制系统 |
| CN117685508B (zh) * | 2023-12-12 | 2024-06-07 | 山东容和节能环保科技有限公司 | 基于云平台物联网的工业循环水处理智能监控系统及方法 |
| CN119312263B (zh) * | 2024-12-17 | 2025-03-04 | 南昌水业集团二次供水有限责任公司 | 一种给水管理方法及系统 |
| CN120332693B (zh) * | 2025-06-19 | 2025-08-19 | 北京城建华晟交通建设有限公司 | 一种给水管网漏损检测方法及系统 |
Family Cites Families (4)
| Publication number | Priority date | Publication date | Assignee | Title |
|---|---|---|---|---|
| JP2001256314A (ja) * | 2000-03-09 | 2001-09-21 | Vlc Co Ltd | 時間制限付き電子通信式問題解答方法 |
| JP2003306957A (ja) * | 2002-04-16 | 2003-10-31 | Toshiba Corp | 配水システム |
| JP4291992B2 (ja) * | 2002-10-08 | 2009-07-08 | 株式会社東芝 | 圧力推定モデル構築システム |
| JP2005038200A (ja) * | 2003-07-15 | 2005-02-10 | Osaka Gas Co Ltd | 電力販売システム及び電力価格算定方法 |
-
2005
- 2005-12-21 JP JP2005368195A patent/JP4799168B2/ja not_active Expired - Lifetime
-
2006
- 2006-12-20 EP EP20060026436 patent/EP1801682B1/fr not_active Ceased
- 2006-12-21 CN CNB2006100640412A patent/CN100558994C/zh active Active
Also Published As
| Publication number | Publication date |
|---|---|
| JP2007170021A (ja) | 2007-07-05 |
| JP4799168B2 (ja) | 2011-10-26 |
| CN100558994C (zh) | 2009-11-11 |
| CN1986981A (zh) | 2007-06-27 |
| EP1801682A1 (fr) | 2007-06-27 |
Similar Documents
| Publication | Publication Date | Title |
|---|---|---|
| EP1801682B1 (fr) | Système d'analyse des informations pour systèmes de distribution d'eau et conduites d'eau | |
| US8583386B2 (en) | System and method for identifying likely geographical locations of anomalies in a water utility network | |
| CN114910615B (zh) | 基于大数据的化工生产用泄漏气体检测系统 | |
| CN109325692A (zh) | 水管网的数据实时分析方法及装置 | |
| EP2003253A9 (fr) | Dispositif de gestion d'information de distribution d'eau | |
| CN119984455B (zh) | 一种气体超声波流量计的自诊断方法 | |
| Sauer | Standards for the analysis and processing of surface-water data and information using electronic methods | |
| CN106840322A (zh) | 一种计量器具在线软校准的方法和实现该方法的装置 | |
| CN118817616B (zh) | 一种基于数据分析的污水在线监测系统 | |
| CN117672403A (zh) | 一种电力变压器油中溶解气体浓度趋势预测方法 | |
| CN112418517B (zh) | 一种用于冻害短临预警的预测方法 | |
| CN120355085A (zh) | 一种水利水电工程实时监控管理方法及系统 | |
| CN119785534A (zh) | 一种基于大数据的水位序列数据监测与预警方法 | |
| CN115809749A (zh) | 污水处理综合性在线预测模型的建立方法及预测预警方法 | |
| JP3748260B2 (ja) | プラントデータ評価システムと方法、復水器真空度監視方法、データマイニング方法、および、プログラム | |
| KR101063202B1 (ko) | 단계별 필터링 기법을 활용한 상수도 계측데이터 수집방법 및 그 시스템 | |
| CN113961623A (zh) | 一种基于短历时数据的降雨特征指标统计方法 | |
| Smajstrla et al. | Field evaluation of micro irrigation water application uniformity | |
| CN116560417B (zh) | 用于气液分离的全自动排液控制方法及系统 | |
| CN120995905B (zh) | 一种基于环境数据与ai的钢结构防腐评估系统 | |
| US20060100826A1 (en) | Method of monitoring measurements | |
| CN116519202A (zh) | 一种油井压力计量仪表数据漂移的甄别方法及系统 | |
| CN121354653A (zh) | 一种噬菌体生长环境监测与评估方法 | |
| CN119985854A (zh) | 基于ndir的气体数据集成管理系统及方法 | |
| CN121412610A (zh) | 基于燃料监控的燃油灶消耗数据异常分析方法 |
Legal Events
| Date | Code | Title | Description |
|---|---|---|---|
| PUAI | Public reference made under article 153(3) epc to a published international application that has entered the european phase |
Free format text: ORIGINAL CODE: 0009012 |
|
| 17P | Request for examination filed |
Effective date: 20061220 |
|
| AK | Designated contracting states |
Kind code of ref document: A1 Designated state(s): AT BE BG CH CY CZ DE DK EE ES FI FR GB GR HU IE IS IT LI LT LU LV MC NL PL PT RO SE SI SK TR |
|
| AX | Request for extension of the european patent |
Extension state: AL BA HR MK YU |
|
| AKX | Designation fees paid |
Designated state(s): DE FR GB NL |
|
| GRAP | Despatch of communication of intention to grant a patent |
Free format text: ORIGINAL CODE: EPIDOSNIGR1 |
|
| RIN1 | Information on inventor provided before grant (corrected) |
Inventor name: YUKAWA, ATSUSHI |
|
| GRAS | Grant fee paid |
Free format text: ORIGINAL CODE: EPIDOSNIGR3 |
|
| GRAA | (expected) grant |
Free format text: ORIGINAL CODE: 0009210 |
|
| AK | Designated contracting states |
Kind code of ref document: B1 Designated state(s): DE FR GB NL |
|
| REG | Reference to a national code |
Ref country code: GB Ref legal event code: FG4D |
|
| REG | Reference to a national code |
Ref country code: DE Ref legal event code: R096 Ref document number: 602006031222 Country of ref document: DE Effective date: 20121011 |
|
| REG | Reference to a national code |
Ref country code: NL Ref legal event code: T3 |
|
| PLBE | No opposition filed within time limit |
Free format text: ORIGINAL CODE: 0009261 |
|
| STAA | Information on the status of an ep patent application or granted ep patent |
Free format text: STATUS: NO OPPOSITION FILED WITHIN TIME LIMIT |
|
| 26N | No opposition filed |
Effective date: 20130510 |
|
| REG | Reference to a national code |
Ref country code: DE Ref legal event code: R097 Ref document number: 602006031222 Country of ref document: DE Effective date: 20130510 |
|
| REG | Reference to a national code |
Ref country code: FR Ref legal event code: PLFP Year of fee payment: 10 |
|
| REG | Reference to a national code |
Ref country code: FR Ref legal event code: PLFP Year of fee payment: 11 |
|
| REG | Reference to a national code |
Ref country code: FR Ref legal event code: PLFP Year of fee payment: 12 |
|
| PGFP | Annual fee paid to national office [announced via postgrant information from national office to epo] |
Ref country code: NL Payment date: 20231116 Year of fee payment: 18 |
|
| PGFP | Annual fee paid to national office [announced via postgrant information from national office to epo] |
Ref country code: GB Payment date: 20231026 Year of fee payment: 18 |
|
| PGFP | Annual fee paid to national office [announced via postgrant information from national office to epo] |
Ref country code: FR Payment date: 20231108 Year of fee payment: 18 Ref country code: DE Payment date: 20231024 Year of fee payment: 18 |
|
| REG | Reference to a national code |
Ref country code: DE Ref legal event code: R119 Ref document number: 602006031222 Country of ref document: DE |
|
| REG | Reference to a national code |
Ref country code: NL Ref legal event code: MM Effective date: 20250101 |
|
| GBPC | Gb: european patent ceased through non-payment of renewal fee |
Effective date: 20241220 |
|
| PG25 | Lapsed in a contracting state [announced via postgrant information from national office to epo] |
Ref country code: NL Free format text: LAPSE BECAUSE OF NON-PAYMENT OF DUE FEES Effective date: 20250101 |
|
| PG25 | Lapsed in a contracting state [announced via postgrant information from national office to epo] |
Ref country code: DE Free format text: LAPSE BECAUSE OF NON-PAYMENT OF DUE FEES Effective date: 20250701 |
|
| PG25 | Lapsed in a contracting state [announced via postgrant information from national office to epo] |
Ref country code: GB Free format text: LAPSE BECAUSE OF NON-PAYMENT OF DUE FEES Effective date: 20241220 |
|
| PG25 | Lapsed in a contracting state [announced via postgrant information from national office to epo] |
Ref country code: FR Free format text: LAPSE BECAUSE OF NON-PAYMENT OF DUE FEES Effective date: 20241231 |