EP1923809A2 - Procédé pour la réalisation de mesures géométriques sur des images radiologiques numériques - Google Patents
Procédé pour la réalisation de mesures géométriques sur des images radiologiques numériques Download PDFInfo
- Publication number
- EP1923809A2 EP1923809A2 EP08100464A EP08100464A EP1923809A2 EP 1923809 A2 EP1923809 A2 EP 1923809A2 EP 08100464 A EP08100464 A EP 08100464A EP 08100464 A EP08100464 A EP 08100464A EP 1923809 A2 EP1923809 A2 EP 1923809A2
- Authority
- EP
- European Patent Office
- Prior art keywords
- measurement
- image
- objects
- points
- point
- Prior art date
- Legal status (The legal status is an assumption and is not a legal conclusion. Google has not performed a legal analysis and makes no representation as to the accuracy of the status listed.)
- Withdrawn
Links
Images


Classifications
-
- G—PHYSICS
- G06—COMPUTING OR CALCULATING; COUNTING
- G06T—IMAGE DATA PROCESSING OR GENERATION, IN GENERAL
- G06T7/00—Image analysis
- G06T7/0002—Inspection of images, e.g. flaw detection
- G06T7/0012—Biomedical image inspection
-
- G—PHYSICS
- G06—COMPUTING OR CALCULATING; COUNTING
- G06T—IMAGE DATA PROCESSING OR GENERATION, IN GENERAL
- G06T7/00—Image analysis
- G06T7/30—Determination of transform parameters for the alignment of images, i.e. image registration
- G06T7/33—Determination of transform parameters for the alignment of images, i.e. image registration using feature-based methods
-
- G—PHYSICS
- G06—COMPUTING OR CALCULATING; COUNTING
- G06T—IMAGE DATA PROCESSING OR GENERATION, IN GENERAL
- G06T7/00—Image analysis
- G06T7/60—Analysis of geometric attributes
- G06T7/62—Analysis of geometric attributes of area, perimeter, diameter or volume
-
- A—HUMAN NECESSITIES
- A61—MEDICAL OR VETERINARY SCIENCE; HYGIENE
- A61B—DIAGNOSIS; SURGERY; IDENTIFICATION
- A61B6/00—Apparatus or devices for radiation diagnosis; Apparatus or devices for radiation diagnosis combined with radiation therapy equipment
- A61B6/50—Apparatus or devices for radiation diagnosis; Apparatus or devices for radiation diagnosis combined with radiation therapy equipment specially adapted for specific body parts; specially adapted for specific clinical applications
- A61B6/508—Apparatus or devices for radiation diagnosis; Apparatus or devices for radiation diagnosis combined with radiation therapy equipment specially adapted for specific body parts; specially adapted for specific clinical applications for non-human patients
-
- G—PHYSICS
- G06—COMPUTING OR CALCULATING; COUNTING
- G06T—IMAGE DATA PROCESSING OR GENERATION, IN GENERAL
- G06T2207/00—Indexing scheme for image analysis or image enhancement
- G06T2207/30—Subject of image; Context of image processing
- G06T2207/30004—Biomedical image processing
- G06T2207/30008—Bone
Definitions
- the present invention relates to computer-assisted radiological measurements on radiographic images.
- Geometrical quantities measured on radiological images must be checked against normal values. These normal values have been collected from measurements of a representative sample of the normal healthy population and are tabulated in the above-mentioned text books.
- Geometrical measurements in digital images comprise linear and angular measurements. Linear measurements in 2 dimensions and 3 dimensions may be supplemented with distance along a curvilinear path. Angular measurements are considered in the plane of the image, in a world plane or in 3D space. Geometrical areas are considered in the image plane, or more generally of surface patches in 3D images. Volumes are computed in 3D images but may be based on planar measurements. Geometrical indices are clinical quantities based on image measurements. In any of these categories, the measurand is defined as the physical parameter being quantified by measurement.
- radiological measurements on X-ray images are either made on film using conventional measuring devices (such as a ruler, a caliper or a rubber band to measure lengths, and a square or goniometer to measure angles) or in a digital image displayed on screen using cursor controlled points (such as a pair of points to measure Euclidean distance between).
- conventional measuring devices such as a ruler, a caliper or a rubber band to measure lengths, and a square or goniometer to measure angles
- cursor controlled points such as a pair of points to measure Euclidean distance between
- the current measurement procedure thus involves 4 distinct media:
- a calculator device may be needed to compute indices from a collection of measurements, or to convert measured values to true quantities using calibration measures.
- electronic spreadsheets may be used in conjunction with a database to store the measurements and indices.
- the error of measurement is the result of a measurement value minus the (true) value of the measurand.
- Measurement error is due to different sources, basically falling into one of two classes: systematic and random errors.
- Systematic or bias errors arise from consistent and repeatable sources of error (like an offset in calibration). Systematic errors can be studied through inter-comparisons, calibrations, and error propagation from estimated systematic uncertainties in the sensors used. Systematic error is defined as the mean that would result from an infinite number of measurements of the same measurand carried out under repeatability conditions minus the (true) value of the measurand. This source of error can be reduced by better equipment and by calibration.
- Random errors also referred to as statistical errors, arise from random fluctuations in the measurements.
- digitisation noise e.g. geometric digitisation: finite pixel size; intensity digitisation: quantisation of grey levels
- the errors introduced by counting finite number of events e.g. X-ray photon count
- Random error is defined as the result of a measurement minus the measurement that would result from an infinite number of measurements of the same measurand carried out under repeatability conditions. Particularly this source of error is prevailing in the prior art of performing measurements on X-ray images.
- Inter-observer and intra-observer variance on measurement values contribute to this source of error, and has its origin in several forms of ambiguity in defining the measurand. Lack of unambiguous definition of the measurand with respect to the imaged patient anatomy and lack of knowledge of the geometrical pose of the patient with respect to source and detector are the main source of random error.
- 'activation' refers to loading a measurement scheme from memory and measurements to be performed according to the loaded scheme.
- a measurement scheme or measurement template is a pattern of measurements to be performed.
- the measurements to be performed are grouped in the form of a measurement procedure wherein the sequence, the inter-dependence and method of measurements are defined.
- Such a measurement scheme can be noted and stored in a computer in standard notation XML (Extensible Mark-up Language).
- the measurement scheme comprises a graphical part (also called graphical model) and an internal part (also called internal model).
- the graphical part represents the geometric relation between measurement entities (objects and operators) and the anatomy in the type of image on which the measurements are to be performed.
- Measurement objects are e.g. points, lines, circles etc.
- the measurement objects are defined relative to the anatomy. The intended position with respect to the anatomy is thereby unambiguously denoted.
- the measurement objects can be labelled e.g. with the appropriate medical nomenclature. Other kinds of naming are possible, e. g. for naming intermediate objects needed in the course of the measurement procedure.
- Measurement entities also comprise distances, angles which are the result of the measurement procedure and which are preferably also named according to medical convention.
- the graphical part may also comprise measurement mark up such as a graphical indication of distance or angle. It may also comprise textual annotations of the names of objects and entities.
- a region of interest box around a set of measurement points may be superimposed, to indicate the area to which geometric operators (such as zooming) or intensity operators (such as enhancement or landmark extraction operators) can be applied.
- geometric operators such as zooming
- intensity operators such as enhancement or landmark extraction operators
- the correct exposure parameters can be specified in the template, quantifying the imaging geometry. Angle of incidence and source-patient-detector distances are the most important geometric parameters, which much be observed at exposure time for a specific template to be applicable. Specific data structures and methods of each measurement entity and object class are devoted to control their graphical content and behaviour.
- the measurement scheme may also comprise normative values associated with the measurement entities. These normative values are e.g. organised as a normative value table and are used for comparison with measured entities. Abnormal values may be signalled.
- the internal part represents the functional dependencies between measurement entities.
- Functional dependencies comprise type of measurements, measurement methods, location of a measurement entity in a measurement dependency graph, order in which measurements are to be performed etc.
- the internal model can be implemented as an object-oriented model of a coherent set of measurements to be performed on a digital (medical) image. It can for example be represented by a measurement dependency graph.
- the internal model decomposes each measurement of a physical quantity into its constituent measurement objects. It further specifies methods to map the objects geometrically onto the medical image.
- the model is composed of objects belonging to an associated class, consisting of a collection of data structures and methods, said methods operating on the corresponding data structures.
- the flow of execution of the measurements of the measurement scheme is imposed by a measurement dependency graph, in which the nodes correspond to measurement of geometric objects, and directed arcs define the relationship between the nodes.
- the internal part may activate the nodes in several ways:
- the graphical part and the internal part of the measurement scheme are bi-directionally linked such that the master-slave relation between the two parts is defined.
- the bi-directional link provides that measurements can be activated starting from the graphical part as well as starting from the internal part.
- a measurement scheme is selected from a measurement stencils repository.
- a measurement stencils repository comprises a number of measurement stencils. The selection is preferably performed in correspondence with the examination type and/or the radiographic exposure conditions.
- the measurement scheme can be implemented as an active or as a passive measurement scheme.
- An active measurement scheme also called measurement template
- Guidance may range from simple computer guided sequencing of measurement operations to fully automatic execution based on automatically determining landmarks and deforming model contours representing anatomy.
- the graphical part of the measurement scheme can be implemented as an stencil-overlay on the displayed X-ray image.
- the points and lines of the scheme must then be dragged by the user to the correct anatomical position in the displayed image.
- display of the graphical part of the measurement scheme may be omitted when measurements are simple and performed routinely on the radiograph.
- User guidance is effectuated here solely through the measurement dependency graph, which may generate the measurement points and objects immediately in the image, after which the user is requested to map them to their actual position.
- An example of such simple measurement is the cardio-thoracic index, which ratio is calculated routinely on thorax AP radiographs.
- more than one radiographic image may be displayed and a measurement scheme may be activated with more than two associated graphical parts.
- This configuration is useful for performing 3D measurements from measurements on a limited number of projections.
- 3D spinal measurements may be obtained from locations of anatomical points identified on frontal and lateral radiographs of the spine.
- a measurement template with two graphical parts is activated here; one for each of the projections, and each graphical part guides the user in the mapping of the projection point of a certain 3D point in the associated projection images.
- a measurement point node in the measurement dependency graph will compute its 3D coordinates from the locations of the point in the respective projections.
- 3D measurement object and operator nodes have 3D methods to calculate the 3D parameters of the object and the 3D measurement values respectively from the values of their children nodes.
- One aspect of the present invention relates to a computer program product adapted to carry out the method of the present invention when run on a computer.
- the computer program product is commonly stored in a computer readable carrier medium such as a CD-ROM.
- the computer program product takes the form of an electric signal and can be communicated to a user through electronic communication.
- the method of the present invention is advantageous over the prior art for the following reasons.
- Repeatability conditions include (a) the same measurement procedure, (b) the same observer, (c) the same measurement instrument, used under the same conditions, (d) the same location and (e) repetition over a short period of time. Whereas fulfilment of these conditions is not guaranteed by the prior art methods, conditions (a), (c) and (d) are met by the current invention because use of a stencil and programmed methods to define the measurands ensure an identical procedure applied under all circumstances. Conditions (b) and (e) are fulfilled because the instantiated measurands in the image according to the stencil are stored and supplied to other referring clinicians, who only need to perform a confirming analysis.
- the changed conditions may include: (a) principle of measurement, (b) method of measurement, (c) observer, (d) measuring instrument, (e) reference standard, (f) location, (g) conditions of use, (h) time.
- the stencil-based method as laid out in the current invention enhances reproducibility considerably.
- reproducibility conditions (a), (b), (d), (e), (g) are met because the definition of the measurands and their determination are fixed by and laid out in the stencil.
- the stencil-based method of the present invention is further invariant to reproducibility conditions (f) and (h), and condition (c) is achieved because storage and retrieval of prior instantiated measurement schemes render the need to re-perform the measurement scheme superfluous.
- the objective of a measurement is to determine the value of the measurand, that is, the value of the particular quantity to be measured.
- a measurement therefore must begin with an appropriate specification of the measurand, the method of measurement, and the measurement procedure.
- the result of the measurement is only an approximation or estimate of the value of the measurand and thus is complete only when accompanied by a statement of the uncertainty of that estimate.
- Prior art methods such as film-based methods and generic computerised measurements do not cope with the problem that neither measurands nor measurement method are defined.
- the uncertainty of the estimated value of a measurand cannot be determined because (a) a measurand must be defined by a standard method of measurement and (b) the implementation of the standard measurement method.
- both definition of the measurands and implementation of the measurement method are prescribed.
- the anatomy is schematically depicted as a collection of outlines of bone and other radiologically well-manifested landmarks.
- the measurement objects are drawn superimposed onto the anatomical outlines.
- This representation is useful in the course of performing complex measurement procedures since in this implementation the position of the measurement points is displayed with respect to the anatomy of the patient.
- Fundamental to the representation as a graphical object is that this representation graphically depicts the spatial relationship between anatomical features and measurement objects.
- the main advantage of this view is that it enables the user to define user points unambiguously. Hence this representation enhances the precision of the measurement procedure (i.e. the error that would result on the measurements when performed repeatedly by different radiographers).
- Significant spatial relationships for two dimensional (plane) images can be defined for example (analogous relations can hold in three or more dimensions) between points, a point and a line (more general a point and a curve), a point and an area, between lines, line-area, between two areas, etc. Examples of relationships are incidence, betweenness, containment, etc.
- the center line of the femur bone which is a 3D volume, may be defined on the basis of two points, each of which are exactly in the middle between a pair of juxtaposed points on the femur contour.
- the circularly shaped femur head may be described by a circle segment fitted only the femur head edge pixels (circle-contour incidence).
- Measurement entity sharing the term used in this context to denote the use of a measurement entity by more than one super entity, is also expressed in the graphical structure.
- a dependency graph is obtained, whereas in the absence of sharing, a dependency tree results.
- measurements that depend on others can only be performed or calculated when the latter have been done.
- the procedural nature implied by this representation is an advantage because it guides the user and formalizes the measurement. In the prior art, it was the user's task to analyze and extract the right order from a published measurement scheme, which is time-consuming and error-prone. In the absence of a guiding scheme, measurements performed at a given point in time may become invalid when depending measurements were erroneously skipped over.
- a measurement scheme will typically have more measurement results as outcomes.
- Each measurement result is represented by a graph, or a tree when there are no cycles, i.e. no shared measurement entities.
- a collection of disconnected trees is called a forest.
- a tree is usually drawn with the root at the top and the direction is from top to bottom.
- the root node represents the highest-level measurement entity, usually having a diagnostic meaning, a name according to the medical nomenclature and possibly an associated normative values table.
- the children of the root node represent constituent measurement entities such as points, lines, circles etc. Each of these nodes may in turn depend on still other measurement entities.
- the bottommost terminal points in a tree are called leaves.
- Each node basically falls into one of two types:
- the root node type is always a measurement operator (either pure or arithmetic).
- the arity of the nodes of a tree will generally depend on the complexity of the measurement. Measurement operators such as distance or angle involve two operands (e.g. the distance between two points, between a point and a line, the angle between two lines etc.). Arithmetic expressions based on measurements can also be expressed by or converted to a tree having binary nodes only. These binary arithmetic trees are also called a parse trees, and are constructed from expressions in either parenthesized infix or postfix (reverse Polish) notation.
- the arcs between a node and its descendants (children) denote the relationship between them.
- the relationship refines the arguments; for measurement objects, relationship can be read from the descendant node (children) towards the depending node (parent). For example:
- the leave nodes representing points in the image, are generally computed by a method based on internal parameters of the nodes only.
- the points may be defined by pixels designated by the user via the graphical user interface. Definition of the relationship enables a node to perform its computation of the value of the node. In the example given, when two lines each have a relationship of containment of a point, the method of computation of the intersection point is invoked and the result is passed to the higher-level nodes.
- the leave nodes of the measurement dependency graph represent groupings of pixels, belonging to an anatomical contour, and the method of computing these pixels is specified by an edge detection and linking algorithm.
- the depending node will subsequently perform a model-based deformable contour segmentation on the basis of edge and region based features, mapping the instantiated model contour onto the anatomical data.
- the output of such a node is one or more points, representing requested measurement point(s) mapped to its corresponding position in the image.
- This representation is particularly suited to perform customization of existing measurements, or to create measurement schemes from scratch.
- a two-pane view can be used for this purpose.
- the left pane displays the trees making up the measurement scheme(s).
- each sub-level of the tree is indented with respect to parent level.
- Each node of the tree has an associated flag indicating that the underlying sub-tree is either contracted (flag is a "+” sign, indicating that the node has children that currently are invisible but may be viewed by pressing the flag button, upon which the flag turns into a "-” sign) - or expanded (flag is a "-" sign, indicating that the node's children may be hidden by pressing the flag button, after which the flag turns into a "+” sign).
- Customization proceeds by copying subsets of measurements from an existing scheme (or a number of schemes) to a new scheme by mouse-dragging the top-node of a sub-tree from the left pane to the right pane.
- a copy-paste sequence (CTRL-C / CTRL-V key strokes) may be used.
- individual measurements may either be deleted, or added by drawing them from a generic measurement toolbox.
- an existing measurement stencil can be modified by adding measurements from the general measurements toolbox or omitting measurements (both subject to conditional dependencies) and saving the result as a new template.
- a third way of customization consists in that a new template may be constructed departing from two existing complete measurement templates by matching and merging their XML trees (or sub-trees) according to a set of merging rules operating on individual nodes such as updating, adding, deleting and moving nodes or aggregated nodes (sub-trees) such as sub-tree graft (inserting a sub-tree), sub-tree prune (deleting a sub-tree), sub-tree move (moving a sub-tree).
- Node equality comparison may be based on matching of node ID's or the node tag name and content.
- Prior art for merging trees may be used to this purpose such as the IBM Alphaworks' XMLTreeDiff and XMLDiff ("XML Diff and Merge Tool"). More than two templates may be merged by iterating this procedure.
- a geometrical mapping process is invoked to request the user to place all measurement objects in the image whereupon the corresponding position in the image is entered into the computing system.
- a measurement template is termed either active or passive.
- all user-requested measurement points are mapped prior to generating the measurement objects that depend on them. All measurement objects are highlighted on the digital sketch upon which a copy of the object is generated and the user is requested to drag and adjust the copy to its corresponding position in the actual radiographic image. When all measurement points are available, the depending measurement objects are generated and the result of the measurement operators is computed.
- This mode has the advantage that it enables quick execution of the measurement template because all user-interactions are concentrated in a single pass. It has the disadvantage that fewer insight is gained how the template has built up the measurements. Also, eventual errors in locating individual points are less easily discerned and corrected.
- the measurement objects are generated when all points defining them are available, and likewise, the result of measurement operators may be computed when all required objects are known.
- This mode has the advantage that the user has close control over the measurement procedure as it is constructed gradually, which is especially advantageous for complex measurement schemes. In the occurring event that the user establishes the current object wrongly, he/she may re-position the underlying points, without affecting the rest of the procedure. It has the drawback that superposition of too many lines and mark-up in the course of the procedure may prevent the user from accurately positioning the remaining points.
- the measurement value is calculated.
- the calculated data may be corrected on the basis of calibration data derived from calibration objects in the image (such as a ruler).
- a process can be initiated that selects the normative value associated with the anatomical quantity produced by the measurement operator node in the given template.
- the proper identifier and patient data are sent to a normative values repository, and the raw normative reference and its semantics are retrieved. Normalisation is performed when needed, for example to express the acceptable range to the commonly used 2-sigma range, or to a user customised range when the standard deviation is retrieved, or to perform the nomographic look-up procedure when normative values are encoded in nomograms.
- the final normative values are applied to the result of the measurement operator, and normality/abnormality is messaged.
- the result of measurement operators and their associated uncertainty bounds can be displayed textually in a measurement values window, and depicted graphically using suitable mark-up produced by an automatic dimensioning process.
- normal values can also be displayed textually and depicted graphically, to enable clinical assessment of the normality/abnormality of the measurement value in relationship to its uncertainty.
- Two modes may be considered when using a passive measurement template: manual placement mode and enhanced placement mode.
- the enhanced placement mode is achieved by hinting the user as to the position of a constituent point of a measurement object by confining the placement to a set of points or objects defined by the graphical construction defined so far. These set of geometric objects are called the geometric loci of a geometric problem.
- that point of said set which is closest to the mouse cursor, is highlighted along with its property with respect to the measurement object being drawn (e.g. it is a tangent point, perpendicular point, center point, end point, topmost point, leftmost point, inflection point etc.). If the user accepts the suggested point, he or she presses the mouse button, even when the cursor is not exactly over that point, and the mouse cursor will immediately jump to it.
- This mode is also called snap placement mode, and makes it possible to exactly pick out the location of a given point.
- the geometrical measurement precision is substantially enhanced in this mode.
- Setting snap to lines or other graphical entities has a similar effect: e.g. the line tangent to a circle (there are two such lines) through a given point is selected when moving the cursor nearest towards the intended tangent point, and a mouse click will teleport the cursor onto that tangent point on the circle, after which drawing of the tangent line completes the drawing of the line measurement object.
- the set of attractor points contains only one point, the drawing action completes without any further user interaction.
- This auto-completion property is made possible because the measurement template names each measurement object (according to medical nomenclature), and the measurement scheme uses the name of objects to uniquely designate each of them.
- Defining objects based on attractor or snap objects is different from active measurement objects, to be defined further, because they are geometric loci, based on and calculated with the internal descriptions of the graphical measurement objects (e.g. equations of line, circle%) whereas active measurement objects get their final position and shape based on image or image-derived data.
- the digital image that has been acquired is displayed. Then a measurement template is selected and a geometrical mapping process is invoked to request the user to place all measurement objects in the image whereupon the corresponding position in the image is entered into the computing system.
- the measurement template is termed active.
- the geometrical mapping process for active measurement templates is based on automatic landmark, feature and object locating by applying suitable image processing operators and algorithms.
- Initialisation comprises the mapping of anchor points in spatial relation to which the initial position of the instantiated model contours will be positioned.
- the initial pose and shape of the model contours is adapted according to the spatial disposition of the anchor points in the image.
- Pose comprises the translation, orientation and size (i.e. position of the origin point of the instantiated model contour, orientation of an axis of the contour relative to the orientation of lines connecting the anchor points, and the applied magnification).
- Shape comprises size and initial form of the contour, which may be expressed by a transformation matrix calculated on the basis of the anchor points of the model space and the corresponding anchor points located in the image.
- two points in a plane define an Euclidean similarity transformation (translation, rotation, scale) in that plane
- three anchor points define a triangle
- an affine frame translation, rotation, scale and x and y shear
- four anchor points forming a quadrangle
- a projective frame projective frame
- Initialisation further comprises setting suitable parameters for the segmentation such as parameters for the internal and external forces of snake deformation (i.e the coefficients of elasticity, rigidity and the weight associated with the image data).
- An image processing procedure subsequently calculates the precise segmentation of anatomical entity contours or anatomical landmarks on the basis of image data only.
- Measurement objects are computed and drawn superimposed on the segmentation. The user is prompted to accept the segmentation and landmarks, and the computed measurement objects. In the event of mal-positioned objects, the procedure is re-iterated with user-adapted initial parameters.
- Mixed measurement schemes may be constructed and effectuated also, where measurement objects are located by combining manual mapping of the anatomical points with automatic point mapping based on contour and region segmentation of some anatomical entities that have linked the required points into their representation.
- the measurement template imposes the placement order by highlighting each point in sequence (e.g. by blinking the point in the template). Following this order ensures that at any point in time, the system knows which measurement object is being defined by virtue of its definition in the template, and hence which measurement objects and mark-up are to be generated next or which measurement entities may be computed next because of availability of all constituent points of the measurand.
- This auto-completion feature is possible because the dependency graph of the measurement template defines how measurement objects and entities are computed on the basis of existing objects. This property is not available in generic measurement tools of the prior art.
- completion of objects and entities of higher layers may be deferred until the user determines all points of the bottommost layer.
- This alternative embodiment has the advantage that no graphical display of auto-generated objects and entities will obscure the precise placement of subsequent points, which is particularly useful when complex measurement schemes need be performed.
- image data and measurement mark-up may be organised and stored in different layers into computer memory, the display of which is turned on and off depending on the current action being performed. For example, when the user is positioning points, the display of any unimportant graphics may be turned off.
- ROI region of interest
- Each measurement point has an associated ROI, which is an image region covering a particular body part or joint, and wherein the measurement point is contained.
- a ROI may contain a set of measurement points if all of them have similar anatomical semantics and are optimally determined simultaneously. For example, one single ROI covering the femur head is used to locate three separate points sampled identically and approximately equidistant along the femur head's contour and collectively approximating the circularly shaped femur head boundary.
- the portion of the image around the mouse cursor is magnified constantly as the mouse is moved over the image, the size of said image ROI being determined by the measurement template.
- a mouse cursor click freezes the magnification around the current mouse position when the operator believes the ROI is covering the image region containing the desired measurement point.
- the point editing is completed by a second mouse click at the anatomical image location of the measurement point.
- the magnification enables to view image data to pixel-level resolution, individual pixels may be selected unambiguously.
- An alternative for speeding up the determination of the image ROI's is the semi-automated position of ROI's relative to a few user-defined points, the position of which is anchored with respect to the anatomy as depicted in the measurement template.
- Anchor points are sets of points in the template, which have specific anatomical meaning, which are easily locatable, and which are few in number yet enable full location of all ROI's.
- eligible points are the bony landmarks corresponding to the greater trochanter, the femoral intercondylar notch and the upper ankle joint center. Because each ROI has sufficient extent and its location around the measurement point in the image allows certain positional variation, mild positional variation of the anchor points is tolerated as well. The position of previous measurement points inside their associated ROI's may refine the position of ROI's of subsequent measurement points.
- a portion of the graphical measurement stencil around the measurement point may be magnified also to better view the point's relationship to the depicted anatomy.
- the measurement template encodes the precise boundary of all ROI's around their measurement point(s).
- the zoomed portion of the image corresponding to the ROI may be placed either inside the image, at a position centered around the mouse cursor, or alternatively in a separate zoomed image data window.
- generating the graphics and mark-up of measurement objects and entities may be deferred until the position of all points of the bottommost layer of the dependency graph of the measurement template have been determined in the image.
- the position of measurement points and objects is indirectly specified by their associated position and local features on an instantiated and subsequently deformed model contour.
- desired measurement points may be incidence (of the measurement point on the contour), midpoint (with respect to pairs of specific locations on the contour), and barycenter (with respect to configurations of specific point locations on the contour).
- desired measurement lines may be fitted tangent line (with respect to a specific location on the contour), symmetry line (with respect to juxtaposed segments of contour pixels).
- Examples of the relationship of desired measurement curves may be fitted circle arcs (with respect to specific circularly shaped segments of the contour), and fitted parabola's or higher order polynomials to extremal points of groups of contours.
- Automatic placement and deformation of the instantiated model contour(s) can be based on automatically segmenting the bony outlines based on Point Distribution Models (PDM) and Active Shape Models (ASM). This segmentation principle can for example be applied to individual vertebrae of the spine, the hand and the hip.
- PDM Point Distribution Models
- ASM Active Shape Models
- the initial position of the instantiated model contours can likewise be based on a small set of anchor points, relative to which the initial pose (translation, rotation, scale) of each instantiated contour is determined and further be adjusted according to affine or projective transforms.
- object recognition techniques may be used to locate the anatomical site corresponding to the model contour.
- the raw value obtained from the image-based location of the measurement objects is corrected using calibration factors.
- E.g. magnification and pixel size are basic calibration factors to convert pixel distances to physical distance.
- Raw values, correction and calibration factors, and physical measurement values are tabulated and displayed in a measurement values window.
- Measurement entities such as linear and angular dimensions are represented in the radiographic image using graphical mark-up. Dimensions include dimension text, dimension lines, extension lines, and arrowheads. Type and appearance of dimensions may be customised to user preferences.
- Measurement values may be displayed either discretely or continuously in the measurement values window as the user moves the position of a point over the image.
- the values are updated after user control is released (e.g. the user stops dragging the mouse cursor and releases the mouse button when he/she believes the measurement point is well located in the image).
- the values are adapted continuously during moving the measurement point in the image. This mode has the advantage that the abnormality alerting mechanism, described in the sequel, is continuously calculating whether some measurands are outside their normal range in response to repeatedly moving the measurement point around.
- the abnormality signal When a measurand is on the threshold of abnormality, the abnormality signal will start toggling, alerting the physician that care must be exercised, and more confidence will be gained in the outcome of the measurement when finally the mouse cursor control is released on a considered position in the image.
- the input quantities X 1 , X 2 ...X N upon which the output quantity Y depends may themselves be viewed as measurands and may in turn depend on other quantities as expressed by the measurement dependency graph.
- the measurands and depending measurands are based on the determination of points in the image, and therefore, the measurement uncertainty will be a complex relationship f of the uncertainty in pixel location.
- An estimate of the measurand Y denoted by y, is obtained from the functional relationship f using input estimates x 1 ,x 2 ...x N for the values of the N quantities X 1 , X 2 ... X N .
- Each input estimate x i and its associated standard uncertainty u(x i ) are obtained from a distribution of possible values of the input quantity X i .
- This probability distribution may be either frequency based, that is, obtained from a series of k observations of X i , or it may an a priory distribution. These types are referred to as Type A or Type B evaluations of standard uncertainty respectively.
- the standard uncertainty of y where y is the estimate of the measurand Y and thus the result of the measurement, is obtained by appropriately combining the standard uncertainties of the input estimates x 1 ,x 2 ...x N . This process is called error propagation.
- u c ( y ) can universally be used to express the uncertainty of a measurement result, in the context of a medical application, a measure of uncertainty is given that may be expected to encompass a large fraction of the distribution of values that could reasonably be attributed to the measurand.
- k is set to 2, meaning the uncertainty is denoted at a 95% (2SD) confidence level.
- the uncertainty bounds of a measurand may also be depicted graphically in the image by additional lines drawn at either side of the measurement mark-up line of the measured quantity in its associated graphical layer.
- the measurement template provides a coupling between an individual entity and its normative value through a link to a record in a normative reference database.
- the normative reference database is organised around tables, grouping mean value and standard deviations for each measurement scheme in one table. Tables may further be organised hierarchically according to a whole-part relationship (e.g. a normative table for spinal measurements may be composed of tables for the individual vertebrae).
- the link may be through the generally accepted medical name for the anatomical quantity or it may be based on a unique identifier when the quantity is referred to by a plurality of names according to different translations or user preferences.
- the normal values may be depicted by suitable graphical mark-up as well.
- the mean value and the two-sigma range of an angle for the normal population may be depicted in the image with three additional lines. Referencing may be either centrally, or with respect to one of the constituent measurement objects (that is with respect to one of the points in a point pair for distance measurements, or with respect to one of the lines in a line pair for angle measurements).
- This representation enables the clinician to graphically assess the actual measurement value in relationship to the average population.
- all graphical mark-up pertaining to a particular measurand may be grouped in a separate layer, the display of which may be switched on and off on user's request.
- both numerical and graphical results may be reported and saved.
- Measurement results and their applicable normal values are stored in the patient dossier in a suitable data format (such as XML).
- the graphic representation of a measurement session is saved as well in a suitable graphic format (such as SVG), and it is linked with the image, so that it may be redrawn onto the image at future referral.
- the actualised graphics may be stored as a template, to be used in new measurement sessions during follow-up of a patient for example.
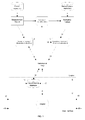
- the system comprises an engine and a user interface.
- the engine (E) guides the measurements that are performed on the retrieved (3) and displayed (4) radiological image by performing a generic execution of a measurement template.
- the engine (a) passes control to the user interface when the point mapping is performed by the user who drags (6) the measurement objects onto an image position in accordance with the template after which the point's position is passed (7) to the measurement calculation module, or (b) initiates appropriate region of interest processing (e.g. contrast enhancement, geometric manipulation such as zooming, or feature-specific filtering to enhance the desired anatomical landmarks), or (c) performs the deformable contour-based segmentation for active measurement templates, in which case the position of the measurement points is established in spatial relationship to said contours and which positions are passed (7) to the measurement calculation module.
- the initial position of the deformable contours may be determined using a small number of mapped anchor points (6).
- the measurement computation module (A) computes the values of parameters of the node based on the values of the depending nodes. For example, the computation of the intersection point of two lines falls under this category.
- the node is a measurement operator, the value of the measurement is computed and the measurement result is depicted graphically onto the radiological image (8).
- the engine further controls selection (9) and addressing (10) of normative values in a normative values table by a selection module (B), which normative values table is retrieved from a normal values repository (2).
- Both normative value (11) and actual measurement (12) are supplied to an abnormality judgement device (C), which calculates the presence and degree of abnormality of the measurement value.
- the deviation from normality may be depicted graphically in the radiological image (13).
- the measurement results (14) and their degree of abnormality (15) is updated in a spreadsheet and clinical database. All graphical results of the measurement session are saved along with the image (16).
- the user interface (D) basically consists of a database, a controller and a graphics part. All graphical objects to be drawn in the image such as measurement objects (e.g. points, lines, circles%) and graphical measurement mark-up (e.g. distance and angle double-side arrow line segments) are generated and stored in a database created and maintained at run-time.
- the controller reacts to events such as the user pressing a mouse button or running a dialog box, starting a command, addition of an object to the database, notification and modification of objects that other objects onto which they are based have changed etc.
- the user interface's responsibility is to render all measurement entities and measurement results. In particular it renders the measurement template in the template window (18), and changes appearance of entities in it in the course of the measurement procedure e.g. to hint the user to the next point to map. It generates or updates the graphical representation of all objects currently in the database, and superimposes it onto the display of the image in the image window (4).
- normative values are displayed (20) in the measurement values window, along with the result of comparison of measurement values with their respective normative values (19).
- the system software layer contains components such as operating systems, databases, interfaces to specific hardware and so on.
- the middle-ware layer contains components such as GUI builders, interfaces to database management systems, platform-independent operating system services, and ActiveX-components such as spreadsheets and diagram editors.
- the business-specific layer contains business specific components used in several applications. For example, a library of calculations on geometric objects falls into this layer.
- the application layer, the top layer contains the application specific services.
Landscapes
- Engineering & Computer Science (AREA)
- Physics & Mathematics (AREA)
- Computer Vision & Pattern Recognition (AREA)
- Theoretical Computer Science (AREA)
- General Physics & Mathematics (AREA)
- Nuclear Medicine, Radiotherapy & Molecular Imaging (AREA)
- Quality & Reliability (AREA)
- Radiology & Medical Imaging (AREA)
- Health & Medical Sciences (AREA)
- Medical Informatics (AREA)
- General Health & Medical Sciences (AREA)
- Geometry (AREA)
- Apparatus For Radiation Diagnosis (AREA)
- Measurement Of The Respiration, Hearing Ability, Form, And Blood Characteristics Of Living Organisms (AREA)
- Testing, Inspecting, Measuring Of Stereoscopic Televisions And Televisions (AREA)
- Analysing Materials By The Use Of Radiation (AREA)
Applications Claiming Priority (1)
| Application Number | Priority Date | Filing Date | Title |
|---|---|---|---|
| EP02100307A EP1349098B1 (fr) | 2002-03-27 | 2002-03-27 | Procédé de mesure géométrique d'images numériques de radiologie utilisant des modèles graphiques |
Related Parent Applications (2)
| Application Number | Title | Priority Date | Filing Date |
|---|---|---|---|
| EP02100307.4 Division | 2002-03-27 | ||
| EP02100307A Division EP1349098B1 (fr) | 2002-03-27 | 2002-03-27 | Procédé de mesure géométrique d'images numériques de radiologie utilisant des modèles graphiques |
Publications (2)
| Publication Number | Publication Date |
|---|---|
| EP1923809A2 true EP1923809A2 (fr) | 2008-05-21 |
| EP1923809A3 EP1923809A3 (fr) | 2010-12-29 |
Family
ID=27798904
Family Applications (2)
| Application Number | Title | Priority Date | Filing Date |
|---|---|---|---|
| EP02100307A Expired - Lifetime EP1349098B1 (fr) | 2002-03-27 | 2002-03-27 | Procédé de mesure géométrique d'images numériques de radiologie utilisant des modèles graphiques |
| EP08100464A Withdrawn EP1923809A3 (fr) | 2002-03-27 | 2002-03-27 | Procédé pour la réalisation de mesures géométriques sur des images radiologiques numériques |
Family Applications Before (1)
| Application Number | Title | Priority Date | Filing Date |
|---|---|---|---|
| EP02100307A Expired - Lifetime EP1349098B1 (fr) | 2002-03-27 | 2002-03-27 | Procédé de mesure géométrique d'images numériques de radiologie utilisant des modèles graphiques |
Country Status (3)
| Country | Link |
|---|---|
| EP (2) | EP1349098B1 (fr) |
| JP (1) | JP4511802B2 (fr) |
| DE (1) | DE60226841D1 (fr) |
Families Citing this family (45)
| Publication number | Priority date | Publication date | Assignee | Title |
|---|---|---|---|---|
| US7050534B2 (en) | 2000-08-29 | 2006-05-23 | Imaging Therapeutics, Inc. | Methods and devices for quantitative analysis of x-ray images |
| US6904123B2 (en) | 2000-08-29 | 2005-06-07 | Imaging Therapeutics, Inc. | Methods and devices for quantitative analysis of x-ray images |
| CN1498385A (zh) | 2000-08-29 | 2004-05-19 | X图像量析的方法与装置 | |
| US7467892B2 (en) | 2000-08-29 | 2008-12-23 | Imaging Therapeutics, Inc. | Calibration devices and methods of use thereof |
| US7660453B2 (en) | 2000-10-11 | 2010-02-09 | Imaging Therapeutics, Inc. | Methods and devices for analysis of x-ray images |
| US8639009B2 (en) | 2000-10-11 | 2014-01-28 | Imatx, Inc. | Methods and devices for evaluating and treating a bone condition based on x-ray image analysis |
| ATE440536T1 (de) | 2001-05-25 | 2009-09-15 | Imaging Therapeutics Inc | Verfahren zur diagnose, behandlung und prävention von knochenverlust |
| US6792071B2 (en) | 2002-03-27 | 2004-09-14 | Agfa-Gevaert | Method of performing geometric measurements on digital radiological images |
| US7840247B2 (en) | 2002-09-16 | 2010-11-23 | Imatx, Inc. | Methods of predicting musculoskeletal disease |
| US8965075B2 (en) | 2002-09-16 | 2015-02-24 | Imatx, Inc. | System and method for predicting future fractures |
| JP2007524438A (ja) | 2003-03-25 | 2007-08-30 | イメージング セラピューティクス,インコーポレーテッド | 放射線画像処理技術における補償の方法 |
| US8290564B2 (en) | 2003-09-19 | 2012-10-16 | Imatx, Inc. | Method for bone structure prognosis and simulated bone remodeling |
| WO2005027732A2 (fr) | 2003-09-19 | 2005-03-31 | Imaging Therapeutics, Inc. | Procede de pronostic de structure osseuse et de remodelage osseux simule |
| WO2005071527A2 (fr) | 2004-01-19 | 2005-08-04 | Koninklijke Philips Electronics N.V. | Procede et appareil pour obtenir une fonctionnalite de mesure flexible pour des images medicales |
| DE602004015739D1 (de) * | 2004-05-18 | 2008-09-25 | Agfa Healthcare Nv | Verfahren zur automatischen Positionierung von geometrischen Objekten in medizinischen Bildern |
| US7394946B2 (en) | 2004-05-18 | 2008-07-01 | Agfa Healthcare | Method for automatically mapping of geometric objects in digital medical images |
| EP1754200B1 (fr) * | 2004-05-28 | 2017-07-12 | Koninklijke Philips N.V. | Procede, programme d'ordinateur, appareil et systeme d'imagerie servant a traiter une image |
| WO2006034018A2 (fr) | 2004-09-16 | 2006-03-30 | Imaging Therapeutics, Inc. | Systeme et procede de prediction de futures fractures |
| US8014625B2 (en) | 2004-11-10 | 2011-09-06 | Agfa Healthcare | Method of performing measurements on digital images |
| EP1657681B1 (fr) | 2004-11-10 | 2009-01-21 | Agfa HealthCare NV | Procédé pour effectuer des mesures sur des images numériques |
| JP2006192104A (ja) * | 2005-01-14 | 2006-07-27 | Konica Minolta Medical & Graphic Inc | 画像計測装置及び画像計測方法 |
| EP1861821A2 (fr) | 2005-03-24 | 2007-12-05 | Image Metrics Limited | Procede et systeme de caracterisation de la morphologie d'une articulation du genou |
| US20070047790A1 (en) | 2005-08-30 | 2007-03-01 | Agfa-Gevaert N.V. | Method of Segmenting Anatomic Entities in Digital Medical Images |
| US8165359B2 (en) | 2005-08-30 | 2012-04-24 | Agfa Healthcare N.V. | Method of constructing gray value or geometric models of anatomic entity in medical image |
| EP1760659B1 (fr) * | 2005-08-30 | 2008-12-24 | Agfa HealthCare NV | Procédé de segmenter des entités anatomiques dans des images médicales numériques |
| DE102005046764A1 (de) * | 2005-09-29 | 2007-04-19 | Siemens Ag | Verfahren zum Erzeugen eines Röntgenbildes einer Extremität eines Patienten mit einem Längenmaßstab |
| EP1975877B1 (fr) | 2005-11-23 | 2018-09-19 | Agfa HealthCare N.V. | Procédé d'attraction du point d'intérêt dans des images numériques |
| CN101374470B (zh) * | 2006-01-24 | 2011-01-05 | 纽卡迪亚6有限责任公司 | 确定椎弓根底周、椎弓根峡部和椎弓根峡部中心的方法 |
| US20080118237A1 (en) * | 2006-11-22 | 2008-05-22 | Rainer Wegenkittl | Auto-Zoom Mark-Up Display System and Method |
| US20090088620A1 (en) * | 2007-10-01 | 2009-04-02 | Koninklijke Philips Electronics N. V. | Quantitative clinical and pre-clinical imaging |
| US20110194741A1 (en) * | 2008-10-07 | 2011-08-11 | Kononklijke Philips Electronics N.V. | Brain ventricle analysis |
| US8939917B2 (en) | 2009-02-13 | 2015-01-27 | Imatx, Inc. | Methods and devices for quantitative analysis of bone and cartilage |
| JP5369891B2 (ja) * | 2009-05-22 | 2013-12-18 | コニカミノルタ株式会社 | 画像計測装置及びプログラム |
| JP5751462B2 (ja) * | 2010-04-19 | 2015-07-22 | 国立大学法人 東京大学 | 脊椎疾患診断支援装置、及び脊椎疾患診断支援プログラム |
| TWI399194B (zh) * | 2011-01-25 | 2013-06-21 | Univ Nat Yunlin Sci & Tech | 基於細胞自動機之半自動膝蓋mri軟骨影像分割方法 |
| RU2462992C1 (ru) * | 2011-06-01 | 2012-10-10 | Федеральное государственное бюджетное учреждение "Саратовский научно-исследовательский институт травматологии и ортопедии" Министерства здравоохранения и социального развития Российской Федерации (ФГБУ "СарНИИТО" Минздравсоцразвития России) | Способ диагностики степени ротационного смещения отломков проксимального отдела бедренной кости |
| US9671925B2 (en) * | 2012-08-28 | 2017-06-06 | Hitachi, Ltd. | Image display device and medical image capturing device |
| EP2735989A1 (fr) | 2012-11-22 | 2014-05-28 | Agfa Healthcare | Procédé et programme informatique pour gérer des mesures sur des images médicales |
| KR101341288B1 (ko) | 2013-10-24 | 2013-12-12 | 사회복지법인 삼성생명공익재단 | 방사선 치료기의 품질 보증 시스템 및 그 품질 보증 방법 |
| KR102245189B1 (ko) | 2014-03-06 | 2021-04-28 | 삼성메디슨 주식회사 | 의료 영상 처리 장치 및 그에 따른 의료 영상 처리 방법 |
| JP6694239B2 (ja) * | 2015-03-04 | 2020-05-13 | キヤノンメディカルシステムズ株式会社 | 放射線診断装置および医用画像診断装置 |
| EP3403583A1 (fr) * | 2017-05-19 | 2018-11-21 | Koninklijke Philips N.V. | Mesures géométriques améliorées dans une image à rayons x |
| DE102017114811A1 (de) * | 2017-07-03 | 2019-01-03 | Volume Graphics Gmbh | Verfahren zur Bestimmung von Unsicherheiten in Messdaten aus einer Messung eines Objekts |
| JP7426929B2 (ja) * | 2017-10-18 | 2024-02-02 | コーニンクレッカ フィリップス エヌ ヴェ | 医療用画像セグメント化のためのランドマーク視覚化 |
| CN114170399B (zh) * | 2021-09-27 | 2025-07-18 | 广西中医药大学 | 一种权重多项式拖网曲面重建与中心辐射容积计算的方法 |
Family Cites Families (3)
| Publication number | Priority date | Publication date | Assignee | Title |
|---|---|---|---|---|
| JPH03230670A (ja) * | 1990-02-05 | 1991-10-14 | Teijin Ltd | 画像読み取り装置及び骨計測装置 |
| EP0973116A1 (fr) * | 1993-03-01 | 2000-01-19 | Kabushiki Kaisha Toshiba | Système de traitement d'informations médicales pour assistance diagnostique |
| JP2003520658A (ja) * | 2000-01-27 | 2003-07-08 | コーニンクレッカ フィリップス エレクトロニクス エヌ ヴィ | 脊柱の幾何学的データを抽出する方法及びシステム |
-
2002
- 2002-03-27 DE DE60226841T patent/DE60226841D1/de not_active Expired - Lifetime
- 2002-03-27 EP EP02100307A patent/EP1349098B1/fr not_active Expired - Lifetime
- 2002-03-27 EP EP08100464A patent/EP1923809A3/fr not_active Withdrawn
-
2003
- 2003-03-26 JP JP2003085027A patent/JP4511802B2/ja not_active Expired - Fee Related
Non-Patent Citations (1)
| Title |
|---|
| No Search * |
Also Published As
| Publication number | Publication date |
|---|---|
| DE60226841D1 (de) | 2008-07-10 |
| EP1349098B1 (fr) | 2008-05-28 |
| EP1923809A3 (fr) | 2010-12-29 |
| JP2003299639A (ja) | 2003-10-21 |
| JP4511802B2 (ja) | 2010-07-28 |
| EP1349098A1 (fr) | 2003-10-01 |
Similar Documents
| Publication | Publication Date | Title |
|---|---|---|
| EP1349098B1 (fr) | Procédé de mesure géométrique d'images numériques de radiologie utilisant des modèles graphiques | |
| US6792071B2 (en) | Method of performing geometric measurements on digital radiological images | |
| US11076770B2 (en) | System for vascular assessment | |
| US9020235B2 (en) | Systems and methods for viewing and analyzing anatomical structures | |
| RU2534948C2 (ru) | Анализ сосудов | |
| EP1598778B1 (fr) | Méthode de positionnement automatique d'objets géometriques dans des images médicales | |
| US7095881B2 (en) | Processing method and system for 3-D geometric modeling of the spine | |
| US7496217B2 (en) | Method and image processing system for segmentation of section image data | |
| EP2116977A2 (fr) | Procédé d'édition de cartes de segmentation d'image en 3D | |
| JP7101809B2 (ja) | 画像処理装置、画像処理方法、及びプログラム | |
| US7346199B2 (en) | Anatomic triangulation | |
| Lee et al. | Three-dimensional analysis of acetabular orientation using a semi-automated algorithm | |
| EP2742483B1 (fr) | Procédé de traitement d'image | |
| US20070177166A1 (en) | Image processing apparatus, an imaging system, a computer program and a method for scaling an object in an image | |
| US7684602B2 (en) | Method and system for local visualization for tubular structures | |
| CN1836258B (zh) | 采用结构张量来检测肺结节和结肠息肉的方法和系统 | |
| US7856132B2 (en) | Method, a computer program, an apparatus and an imaging system for image processing | |
| US11869154B2 (en) | Method and system for visualising a spatial surface curvature of a 3D-object, computer program product, and computer-readable storage medium | |
| Ahmadi et al. | Integration of close range photogrammetry and expert system capabilities in order to design and implement optical image based measurement systems for intelligent diagnosing disease | |
| Liu et al. | Automated, foot-bone registration using subdivision-embedded atlases for spatial mapping of bone mineral density | |
| Le Pennec et al. | CT-based semi-automatic quantification of vertebral fracture restoration | |
| Lu et al. | Prior active shape model for detecting pelvic landmarks | |
| Lee et al. | A robust method to extract the anterior pelvic plane from CT volume independent of pelvic pose | |
| US20090082990A1 (en) | Method and device for determining an optimum direction of projection for recording projection images | |
| Rörich et al. | Inferring 3D finger bone shapes from 2D images–a detailed analysis of shape accuracy |
Legal Events
| Date | Code | Title | Description |
|---|---|---|---|
| PUAI | Public reference made under article 153(3) epc to a published international application that has entered the european phase |
Free format text: ORIGINAL CODE: 0009012 |
|
| AC | Divisional application: reference to earlier application |
Ref document number: 1349098 Country of ref document: EP Kind code of ref document: P |
|
| AK | Designated contracting states |
Kind code of ref document: A2 Designated state(s): BE DE FR GB NL |
|
| PUAL | Search report despatched |
Free format text: ORIGINAL CODE: 0009013 |
|
| AK | Designated contracting states |
Kind code of ref document: A3 Designated state(s): BE DE FR GB NL |
|
| AKY | No designation fees paid | ||
| REG | Reference to a national code |
Ref country code: DE Ref legal event code: R108 |
|
| REG | Reference to a national code |
Ref country code: DE Ref legal event code: R108 Effective date: 20110907 |
|
| STAA | Information on the status of an ep patent application or granted ep patent |
Free format text: STATUS: THE APPLICATION IS DEEMED TO BE WITHDRAWN |
|
| 18D | Application deemed to be withdrawn |
Effective date: 20110630 |