EP1957663B1 - Verfahren und vorrichtung für den verbesserten nachweis von giftstoffen - Google Patents
Verfahren und vorrichtung für den verbesserten nachweis von giftstoffen Download PDFInfo
- Publication number
- EP1957663B1 EP1957663B1 EP06851909A EP06851909A EP1957663B1 EP 1957663 B1 EP1957663 B1 EP 1957663B1 EP 06851909 A EP06851909 A EP 06851909A EP 06851909 A EP06851909 A EP 06851909A EP 1957663 B1 EP1957663 B1 EP 1957663B1
- Authority
- EP
- European Patent Office
- Prior art keywords
- photosynthetic
- fluid
- time
- agents
- organisms
- Prior art date
- Legal status (The legal status is an assumption and is not a legal conclusion. Google has not performed a legal analysis and makes no representation as to the accuracy of the status listed.)
- Not-in-force
Links
- 238000000034 method Methods 0.000 title claims abstract description 36
- 238000001514 detection method Methods 0.000 title claims abstract description 24
- 239000003440 toxic substance Substances 0.000 title description 25
- 231100000167 toxic agent Toxicity 0.000 title description 22
- 230000000243 photosynthetic effect Effects 0.000 claims abstract description 68
- 239000003795 chemical substances by application Substances 0.000 claims abstract description 39
- 238000004458 analytical method Methods 0.000 claims abstract description 28
- 239000012530 fluid Substances 0.000 claims abstract description 25
- 239000000126 substance Substances 0.000 claims abstract description 22
- 238000002032 lab-on-a-chip Methods 0.000 claims abstract description 19
- 230000036962 time dependent Effects 0.000 claims abstract description 14
- 239000013598 vector Substances 0.000 claims abstract description 12
- 238000005370 electroosmosis Methods 0.000 claims abstract description 11
- 239000003053 toxin Substances 0.000 claims abstract description 11
- 231100000765 toxin Toxicity 0.000 claims abstract description 11
- 108700012359 toxins Proteins 0.000 claims abstract description 11
- 238000012706 support-vector machine Methods 0.000 claims abstract description 9
- 238000012545 processing Methods 0.000 claims abstract description 8
- 239000002243 precursor Substances 0.000 claims abstract description 7
- XLYOFNOQVPJJNP-UHFFFAOYSA-N water Substances O XLYOFNOQVPJJNP-UHFFFAOYSA-N 0.000 claims description 36
- 230000006698 induction Effects 0.000 claims description 22
- 239000003651 drinking water Substances 0.000 claims description 12
- 235000020188 drinking water Nutrition 0.000 claims description 12
- 229930002875 chlorophyll Natural products 0.000 claims description 2
- 235000019804 chlorophyll Nutrition 0.000 claims description 2
- ATNHDLDRLWWWCB-AENOIHSZSA-M chlorophyll a Chemical compound C1([C@@H](C(=O)OC)C(=O)C2=C3C)=C2N2C3=CC(C(CC)=C3C)=[N+]4C3=CC3=C(C=C)C(C)=C5N3[Mg-2]42[N+]2=C1[C@@H](CCC(=O)OC\C=C(/C)CCC[C@H](C)CCC[C@H](C)CCCC(C)C)[C@H](C)C2=C5 ATNHDLDRLWWWCB-AENOIHSZSA-M 0.000 claims description 2
- 230000002708 enhancing effect Effects 0.000 abstract 1
- 241000195493 Cryptophyta Species 0.000 description 11
- 238000004422 calculation algorithm Methods 0.000 description 10
- 230000006870 function Effects 0.000 description 8
- 239000007788 liquid Substances 0.000 description 7
- 230000008901 benefit Effects 0.000 description 6
- 239000002245 particle Substances 0.000 description 6
- VYPSYNLAJGMNEJ-UHFFFAOYSA-N Silicium dioxide Chemical compound O=[Si]=O VYPSYNLAJGMNEJ-UHFFFAOYSA-N 0.000 description 4
- 238000011109 contamination Methods 0.000 description 4
- 238000000354 decomposition reaction Methods 0.000 description 4
- 230000005684 electric field Effects 0.000 description 4
- 239000000463 material Substances 0.000 description 4
- 238000012544 monitoring process Methods 0.000 description 4
- NNFCIKHAZHQZJG-UHFFFAOYSA-N potassium cyanide Chemical compound [K+].N#[C-] NNFCIKHAZHQZJG-UHFFFAOYSA-N 0.000 description 4
- 239000000523 sample Substances 0.000 description 4
- 230000035945 sensitivity Effects 0.000 description 4
- 239000000758 substrate Substances 0.000 description 4
- XMTQQYYKAHVGBJ-UHFFFAOYSA-N 3-(3,4-DICHLOROPHENYL)-1,1-DIMETHYLUREA Chemical compound CN(C)C(=O)NC1=CC=C(Cl)C(Cl)=C1 XMTQQYYKAHVGBJ-UHFFFAOYSA-N 0.000 description 3
- 238000000605 extraction Methods 0.000 description 3
- 238000005259 measurement Methods 0.000 description 3
- 244000005700 microbiome Species 0.000 description 3
- RLBIQVVOMOPOHC-UHFFFAOYSA-N parathion-methyl Chemical compound COP(=S)(OC)OC1=CC=C([N+]([O-])=O)C=C1 RLBIQVVOMOPOHC-UHFFFAOYSA-N 0.000 description 3
- 238000011897 real-time detection Methods 0.000 description 3
- 230000004044 response Effects 0.000 description 3
- 230000003595 spectral effect Effects 0.000 description 3
- 238000002198 surface plasmon resonance spectroscopy Methods 0.000 description 3
- 238000013519 translation Methods 0.000 description 3
- 241000894006 Bacteria Species 0.000 description 2
- 240000009108 Chlorella vulgaris Species 0.000 description 2
- 235000007089 Chlorella vulgaris Nutrition 0.000 description 2
- 108090000790 Enzymes Proteins 0.000 description 2
- 102000004190 Enzymes Human genes 0.000 description 2
- 241000588724 Escherichia coli Species 0.000 description 2
- 238000012512 characterization method Methods 0.000 description 2
- 231100000481 chemical toxicant Toxicity 0.000 description 2
- 238000012258 culturing Methods 0.000 description 2
- 238000011161 development Methods 0.000 description 2
- 238000002474 experimental method Methods 0.000 description 2
- 230000003287 optical effect Effects 0.000 description 2
- 238000005070 sampling Methods 0.000 description 2
- 235000012239 silicon dioxide Nutrition 0.000 description 2
- 239000000377 silicon dioxide Substances 0.000 description 2
- 238000007619 statistical method Methods 0.000 description 2
- 238000012549 training Methods 0.000 description 2
- 244000025254 Cannabis sativa Species 0.000 description 1
- OKTJSMMVPCPJKN-UHFFFAOYSA-N Carbon Chemical compound [C] OKTJSMMVPCPJKN-UHFFFAOYSA-N 0.000 description 1
- 241000195597 Chlamydomonas reinhardtii Species 0.000 description 1
- XFXPMWWXUTWYJX-UHFFFAOYSA-N Cyanide Chemical compound N#[C-] XFXPMWWXUTWYJX-UHFFFAOYSA-N 0.000 description 1
- 239000005510 Diuron Substances 0.000 description 1
- WQZGKKKJIJFFOK-GASJEMHNSA-N Glucose Natural products OC[C@H]1OC(O)[C@H](O)[C@@H](O)[C@@H]1O WQZGKKKJIJFFOK-GASJEMHNSA-N 0.000 description 1
- 241000256602 Isoptera Species 0.000 description 1
- OUYCCCASQSFEME-QMMMGPOBSA-N L-tyrosine Chemical compound OC(=O)[C@@H](N)CC1=CC=C(O)C=C1 OUYCCCASQSFEME-QMMMGPOBSA-N 0.000 description 1
- 241001125804 Neocapritermes Species 0.000 description 1
- 108010060806 Photosystem II Protein Complex Proteins 0.000 description 1
- XUIMIQQOPSSXEZ-UHFFFAOYSA-N Silicon Chemical compound [Si] XUIMIQQOPSSXEZ-UHFFFAOYSA-N 0.000 description 1
- 230000009471 action Effects 0.000 description 1
- 230000003213 activating effect Effects 0.000 description 1
- 239000005557 antagonist Substances 0.000 description 1
- 238000013459 approach Methods 0.000 description 1
- 230000009286 beneficial effect Effects 0.000 description 1
- 239000003124 biologic agent Substances 0.000 description 1
- 239000013060 biological fluid Substances 0.000 description 1
- 239000008280 blood Substances 0.000 description 1
- 210000004369 blood Anatomy 0.000 description 1
- 238000004364 calculation method Methods 0.000 description 1
- 229910052799 carbon Inorganic materials 0.000 description 1
- 230000008859 change Effects 0.000 description 1
- 239000002575 chemical warfare agent Substances 0.000 description 1
- 238000007635 classification algorithm Methods 0.000 description 1
- 239000012141 concentrate Substances 0.000 description 1
- 239000004020 conductor Substances 0.000 description 1
- 239000000356 contaminant Substances 0.000 description 1
- 239000013068 control sample Substances 0.000 description 1
- 230000007423 decrease Effects 0.000 description 1
- 238000013461 design Methods 0.000 description 1
- 230000004069 differentiation Effects 0.000 description 1
- 238000009792 diffusion process Methods 0.000 description 1
- 238000007599 discharging Methods 0.000 description 1
- 239000003814 drug Substances 0.000 description 1
- 230000000694 effects Effects 0.000 description 1
- 239000012777 electrically insulating material Substances 0.000 description 1
- 238000005516 engineering process Methods 0.000 description 1
- 238000005530 etching Methods 0.000 description 1
- 238000011156 evaluation Methods 0.000 description 1
- 239000002360 explosive Substances 0.000 description 1
- 239000010408 film Substances 0.000 description 1
- 238000001506 fluorescence spectroscopy Methods 0.000 description 1
- 229960003692 gamma aminobutyric acid Drugs 0.000 description 1
- BTCSSZJGUNDROE-UHFFFAOYSA-N gamma-aminobutyric acid Chemical compound NCCCC(O)=O BTCSSZJGUNDROE-UHFFFAOYSA-N 0.000 description 1
- 239000008103 glucose Substances 0.000 description 1
- 239000004009 herbicide Substances 0.000 description 1
- 238000003018 immunoassay Methods 0.000 description 1
- 230000000984 immunochemical effect Effects 0.000 description 1
- 238000002513 implantation Methods 0.000 description 1
- 238000011065 in-situ storage Methods 0.000 description 1
- AMGQUBHHOARCQH-UHFFFAOYSA-N indium;oxotin Chemical compound [In].[Sn]=O AMGQUBHHOARCQH-UHFFFAOYSA-N 0.000 description 1
- 238000009434 installation Methods 0.000 description 1
- 238000001155 isoelectric focusing Methods 0.000 description 1
- 239000000696 magnetic material Substances 0.000 description 1
- 230000005389 magnetism Effects 0.000 description 1
- 238000004519 manufacturing process Methods 0.000 description 1
- 238000013507 mapping Methods 0.000 description 1
- 230000010034 metabolic health Effects 0.000 description 1
- 229910052751 metal Inorganic materials 0.000 description 1
- 239000002184 metal Substances 0.000 description 1
- 230000000813 microbial effect Effects 0.000 description 1
- 238000012986 modification Methods 0.000 description 1
- 230000004048 modification Effects 0.000 description 1
- 230000001537 neural effect Effects 0.000 description 1
- 239000002858 neurotransmitter agent Substances 0.000 description 1
- 238000010606 normalization Methods 0.000 description 1
- FIKAKWIAUPDISJ-UHFFFAOYSA-L paraquat dichloride Chemical compound [Cl-].[Cl-].C1=C[N+](C)=CC=C1C1=CC=[N+](C)C=C1 FIKAKWIAUPDISJ-UHFFFAOYSA-L 0.000 description 1
- 238000000059 patterning Methods 0.000 description 1
- 239000000575 pesticide Substances 0.000 description 1
- 229920002120 photoresistant polymer Polymers 0.000 description 1
- 230000029553 photosynthesis Effects 0.000 description 1
- 238000010672 photosynthesis Methods 0.000 description 1
- 230000004962 physiological condition Effects 0.000 description 1
- 231100000614 poison Toxicity 0.000 description 1
- 230000010287 polarization Effects 0.000 description 1
- 230000002265 prevention Effects 0.000 description 1
- 230000008569 process Effects 0.000 description 1
- 108090000623 proteins and genes Proteins 0.000 description 1
- 239000000376 reactant Substances 0.000 description 1
- 230000009467 reduction Effects 0.000 description 1
- 230000001105 regulatory effect Effects 0.000 description 1
- 238000011160 research Methods 0.000 description 1
- 238000012552 review Methods 0.000 description 1
- 239000011540 sensing material Substances 0.000 description 1
- 238000000926 separation method Methods 0.000 description 1
- 229910052710 silicon Inorganic materials 0.000 description 1
- 239000010703 silicon Substances 0.000 description 1
- 239000000725 suspension Substances 0.000 description 1
- HODRFAVLXIFVTR-RKDXNWHRSA-N tevenel Chemical compound NS(=O)(=O)C1=CC=C([C@@H](O)[C@@H](CO)NC(=O)C(Cl)Cl)C=C1 HODRFAVLXIFVTR-RKDXNWHRSA-N 0.000 description 1
- 239000010409 thin film Substances 0.000 description 1
- 231100000331 toxic Toxicity 0.000 description 1
- 230000002588 toxic effect Effects 0.000 description 1
- 231100000419 toxicity Toxicity 0.000 description 1
- 230000001988 toxicity Effects 0.000 description 1
- 230000009466 transformation Effects 0.000 description 1
- 230000001131 transforming effect Effects 0.000 description 1
- 230000001052 transient effect Effects 0.000 description 1
- OUYCCCASQSFEME-UHFFFAOYSA-N tyrosine Natural products OC(=O)C(N)CC1=CC=C(O)C=C1 OUYCCCASQSFEME-UHFFFAOYSA-N 0.000 description 1
Images










Classifications
-
- C—CHEMISTRY; METALLURGY
- C12—BIOCHEMISTRY; BEER; SPIRITS; WINE; VINEGAR; MICROBIOLOGY; ENZYMOLOGY; MUTATION OR GENETIC ENGINEERING
- C12Q—MEASURING OR TESTING PROCESSES INVOLVING ENZYMES, NUCLEIC ACIDS OR MICROORGANISMS; COMPOSITIONS OR TEST PAPERS THEREFOR; PROCESSES OF PREPARING SUCH COMPOSITIONS; CONDITION-RESPONSIVE CONTROL IN MICROBIOLOGICAL OR ENZYMOLOGICAL PROCESSES
- C12Q1/00—Measuring or testing processes involving enzymes, nucleic acids or microorganisms; Compositions therefor; Processes of preparing such compositions
- C12Q1/02—Measuring or testing processes involving enzymes, nucleic acids or microorganisms; Compositions therefor; Processes of preparing such compositions involving viable microorganisms
- C12Q1/025—Measuring or testing processes involving enzymes, nucleic acids or microorganisms; Compositions therefor; Processes of preparing such compositions involving viable microorganisms for testing or evaluating the effect of chemical or biological compounds, e.g. drugs, cosmetics
Definitions
- the present invention relates to biosensors for detecting chemical, biological and/or radiological contaminants, or their precursors, in water or air.
- the sensor includes a cell, apparatus for introducing water into the cell and discharging water from the cell adapted for analyzing photosynthetic activity of naturally-occurring, free-living, indigenous photosynthetic organisms in water; a fluorometer for measuring photosynthetic activity of naturally-occurring, free-living, indigenous photosynthetic organisms drawn into the cell.
- An electronics package analyzes raw data from the fluorometer and emits a signal indicating the presence of at least one chemical or biological warfare agent in the water.
- a method of biosensor-based detection of toxins comprises the steps of concentrating a plurality photosynthetic organisms in a fluid to be analyzed into a concentrated region using biased AC electro-osmosis, and obtaining a measured photosynthetic activity of the photosynthetic organisms in the concentrated region, wherein chemical, biological or radiological agents reduce a nominal photosynthetic activity of the photosynthetic organisms.
- the presence of at least one of the agents, or precursors thereof, in the fluid is determined based on the measured photosynthetic activity.
- the plurality of photosynthetic organisms can be naturally-occurring, free-living, indigenous organisms in the fluid, such as native algae in water.
- the DC bias for the biased ACEO is generally from 1 to 10 volts.
- Biased ACEO provides significant fluorescent signal enhancement due to resulting enhanced concentration of the photosynthetic organisms.
- Enhanced concentration of the photosynthetic organisms significantly improving the sensitivity and peed of devices and methods according to the invention as compared to previous related devices and methods.
- the photosynthetic activity can comprise chlorophyll fluorescence induction.
- a lab-on-a-chip system can be used for the concentrating step.
- the fluid can be drawn from a source of primary-source drinking water.
- the method can further comprise the step of refreshing a supply of photosynthetic organisms by drawing a fresh supply of drinking water and repeating the method.
- the determining step can further comprises the steps of providing at least one time-dependent control signal generated by a biosensor in the fluid medium, obtaining a time-dependent biosensor signal from the biosensor in the fluid medium to be monitored or analyzed for the presence of one or more of the chemical, biological or radiological agents; processing the time-dependent biosensor signal to obtain a plurality of feature vectors using at least one of amplitude statistics and a time-frequency analysis, and determining the presence of at least one of the agents, or precursors thereof, from the feature vectors based on reference to the control signal.
- the time-frequency analysis can comprise wavelet coefficient analysis. In one embodiment, both amplitude statistics and time-frequency analysis can be used in the processing step.
- the method can further comprising the step of identifying which agents are present in the fluid.
- a linear discriminant method can be used for the identifying step.
- the linear discriminant method can comprise support vector machine (SVM) classification.
- a water quality analyzer comprises a biased AC electro-osmosis (ACEO) cell for receiving a fluid to be analyzed having a plurality photosynthetic organisms therein and concentrating the plurality photosynthetic organisms into at least one concentrated region.
- a photodetector obtains a measured photosynthetic activity of the plurality of photosynthetic organisms in the concentrated region, wherein chemical, biological or radiological agents reduce a nominal photosynthetic activity of the photosynthetic organisms.
- An electronics package analyzes the measured photosynthetic activity to indicate a presence of the chemical, biological or radiological agents in the fluid.
- the ACEO cell can comprise a lab-on-a-chip device.
- the lab-on-a-chip device can include at least one electronic device on the chip.
- a structure can also be provided for communicating the measured photosynthetic activity or the measured photosynthetic activity after analysis by the electronics package to one or more remote sites.
- Fig. 1 is a schematic view showing an exemplary AC electro-osmosis (ACEO)-based water quality analyzing system 100, according to an embodiment of the present invention.
- AEO AC electro-osmosis
- Fig. 2 shows an exemplary AC electro-osmosis (ACEO) cell based on planar interdigitated electrodes, according to an embodiment of the present invention.
- AEO AC electro-osmosis
- Fig. 3 shows a schematic of preferred embodiment of the ACEO cell-based system along with related interface devices, according to an embodiment of the present invention.
- the ACEO trapping cell is embodied as a lab-on-a-chip device in this preferred embodiment.
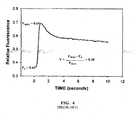
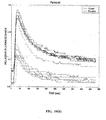
- Fig. 4 is an exemplary fluorescence induction curve.
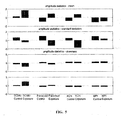
- Fig. 5 compares the average amplitude statistics generated from the control and exposure signals of each toxic agents class.
- Fig. 6 shows a 3-D plot showing three amplitude statistics features (mean, standard deviation, and skewness). It can be seen from Fig. 6 that data from different classes of toxic agents cluster at different positions within the 3D feature space that can be separated relatively easily.
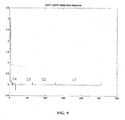
- Fig. 7 shows some examples of some exemplary mother wavelets, including the Daubechies wavelet, the Coiflet wavelet, the Harr wavelet, the Symmlet wavelet, the Meyer wavelet and the Battle Lemarie wavelet.
- Fig. 8 shows a filter bank implementation of a discrete wavelet transform.
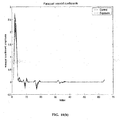
- Fig. 9 shows an example of a fluorescence induction curve exposed to 10 mM KCN and the corresponding 3-level wavelet decomposition.
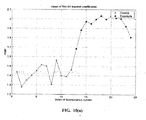
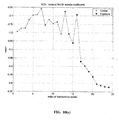
- Fig. 10(a)-(d) show fluorescence induction curves exposed to four classes of toxic agents and the corresponding wavelet transforms of these signals.
- Sensitivity and selectivity are critical for real-time detection of toxins.
- a tissue based detection system is preferably utilized which uses naturally-occurring aquatic photosynthetic tissue as the sensing material (microalgae) for detection of antagonists in the water.
- microalgae aquatic photosynthetic tissue
- the microbial concentration scheme uses biased AC electro-osmosis (ACEO), which is newly discovered and presently at the forefront of electrokinetic microfluidic research.
- ACEO AC electro-osmosis rapidly enriches local microalgal concentration by expediting their diffusion via microfluidic convection to certain areas, thus allowing their concentration.
- Concentrated biosensors improves the resulting signal level, analogous to the function of an amplifier in an electronic circuit. Fluorescence techniques are then preferably used to assess the metabolic health of the biosensors.
- a water quality analyzer for real-time detection comprises a biased AC electro-osmosis (ACEO) cell for receiving a fluid to be analyzed having a plurality photosynthetic organisms therein, and concentrating the plurality photosynthetic organisms into at least one concentrated region.
- a photodetector such as luminometer or fluorometer, is provided for obtaining a measured photosynthetic activity of the plurality of photosynthetic organisms in the concentrated region, wherein chemical, biological or radiological agents reduce a nominal photosynthetic activity of the photosynthetic organisms.
- An electronics package analyzes the measured photosynthetic activity to indicate a presence of the chemical, biological or radiological agents in the fluid. Specific agents can also be identified. For example, using characteristic fluorescence induction curves for a given library of agents, specific agents can be identified. Assuming the agent is a certain minimum concentration, the concentration of the agent may also be determined.
- FIG. 1 is a schematic view showing an exemplary AC electro-osmosis (ACEO)-based water quality analyzing system 100, according to an embodiment of the present invention.
- the system 100 comprises a light source 105 for emitting light beam, a beam splitter 152 for redirecting the emitted light beam to a focusing lens 153.
- Focusing lens 153 focuses the light beam after reflection from beam splitter onto biased AC electro-osmosis (ACEO) trapping cells 154.
- the photosynthetic organisms are bioluminescent, light source 105, beam splitter 152 and focusing lens 153 are not required.
- ACEO cell 154 receives a fluid to be analyzed having a plurality photosynthetic organisms therein and concentrates the plurality photosynthetic organisms into at least one concentrated region therein. Light is directed towards the concentrated regions in ACEO cell 154 thus exciting the photosynthetic organisms on the ACEO cell 154 to produce fluorescence 155.
- a focusing lens 156 is provided for focusing the fluorescence on a photodetector 157 which detects the fluorescence.
- a computing device 158 receives the measured fluorescence signal detected by the photodetector 157.
- the ACEO cell 154 is preferably disposed on a platform 169.
- the platform is generally movable under the control of computing device 158.
- Computing device is generally loaded with algorithms to analyze the fluorescence data as well as to control the movement of the platform 169.
- Planar interdigitated electrodes are generally preferred for the present invention.
- Parallel plates typically generate uniform electric field normal to the electrode surface. In this configuration, tangential electric fields are generated by asymmetric electrode patterns on the plates.
- Patterned electrodes are preferably provided as disclosed in a paper by Bhatt, et al ( Bhatt, K.H., Grego, S., Velev, O.D. 2005; An AC electrokinetic technique for collection and concentration of particles and cells on patterned electrodes. Langmuir, 21(14):6603 -6612 ). Electrodes face each other, in the form of parallel plates.
- the electric field is generated by Bhatt et al. using a pure AC signal. No DC bias is disclosed or suggested by Bhatt.
- the nonuniform electric field gradients are realized through patterning one electrode with non-electrically conductive materials; such as photoresist, or silicon dioxide. Particles accumulate at the center of corrals where the flow velocity is relatively low.
- the invention preferably uses an AC signal together with a DC bias, referred to herein as "biased ACEO" to bias the electrodes.
- Biased ACEO takes advantage of different electrode polarizations which are not possible based on the AC only ACEO disclosed in Bhatt et al..
- the inventive biased ACEO can produce a distinct line of particles, thus heavily concentrating the particles.
- the DC bias is generally in a range from 1 to 10 volts, while the AC signal has less than a 20 volt peak to peak amplitude and frequency of from 50 Hz to 1 MHz.
- the voltage range is within 10 Vrms for DC and AC components combined.
- FIG. 2 An exemplary ACEO cell 200 based on planar interdigitated electrodes according to the present invention is shown in Fig. 2 .
- a substrate support 205 having at least semiconducting electrical conductivity is provided to provide a bottom electrode; such as an n- or p- doped silicon wafer 205.
- a patterned layer of an electrically insulating material 210, such as silicon dioxide, is disposed on the substrate support 205.
- An electrically insulating spacing material 215 surrounds and seals the periphery of cell 200 to allow a liquid to be analyzed to be held within the cell.
- Any substrate 205 can generally be used, as long as an electrically conductive layer is placed on top of the substrate 205 and that electrically conductive layer is exposed to the fluid.
- the exposed patterned electrode is generally realized either by applying another layer of insulting layer or by etching the conductive layer. Fluid stagnation forms at the center of the electrode patterns 225 where the photosynthetic organisms 223 get concentrated.
- the nominal height of spacing material is generally on the order of hundreds of microns.
- An optically transparent top electrode 220 in the wavelength range of interest such as an indium-tin-oxide coated grass layer, is disposed on spacing material to complete the cell enclosure.
- a plurality of photosynthetic organisms 223 are disposed inside cell 200.
- a power supply 231 which provides an AC signal riding on a DC bias applies an electrical signal across top electrode 220 and bottom electrode 205. Although not shown, separate power supplies for the AC signal and the DC bias can be used.
- FIG. 3 shows a preferred embodiment of the ACEO cell-based system 300 along with related interface devices.
- ACEO trapping cell is embodied as a lab-on-a-chip device 320 in this preferred embodiment.
- the lab-on-a-chip provides rapid and sensitive biological and clinical analyses on a single, miniaturized device.
- Lab-on-a-chip devices are a subset of MEMS devices.
- lab-on-a-chip embodiment along with microalgae sensors, including rapid detection time from electrokinetic enrichment, specificity as a result of using microalgae as sensors, and simplicity since the detection components are located on a single platform.
- the lab-on-a-chip technology also provides portability and reduced analysis time. The reduction of sample and reactant volume increases the efficiency and reduces the costs associated with analytical chemistry and analytical biochemistry. Additionally, microfabrication provides the possibility of mass production. As shown by the dashed line in Fig. 3 which indicates a single chip, lab-on-a-chip device 320, as well as electronic components such as photodetector 157 and computing device 158 can be fabricated on the same chip.
- An AC power supply 231 provides the required bias to realize ACEO and forces the biosensors into at least one concentrated region.
- a battery (not shown) provides the power for the various components of system 300.
- Lab-on-a-chip device 320 includes a water inlet 315 and water outlet 318. Water is generally driven into inlet 315 by a small internal pump 316 that are commonly used for lab-on-a-chip devices. Water is also drawn out from outlet 318 by small internal pump 317. Periodically, new samples of water are preferably analyzed by system 100 using a "batch mode" rather than a "continuous mode".
- a "batch mode" rather than a "continuous mode”.
- This sensor material is external to the detecting instrument and can be continuously refreshed. Such systems thus may be used as continuous rapid-warning sentinels for detection of chemical warfare agents in sunlight-exposed drinking water supplies.
- System 100 includes a structure for communicating measured and/or analyzed data to one or more remote sites 359.
- the remote sites can be military or civilian sites.
- structure for communicating 359 can comprise Wi-FiTM card 150.
- Card 150 connects to a local area network (LAN) when near a network access point. The connection is made by radio frequency signals. If the local area network is connected to the Internet, the Wi-Fi device can have Internet access as well.
- structure for communicating 359 can comprise an RS 232 interface or equivalent for serial binary data interconnection of the measured data and or analyzed data.
- raw data received from the photodetector 157 is transmitted by Wi-FiTM 359 through a LAN to a remote cite where a processor/computer is located (not shown).
- the processor/computer obtains the measured photosynthetic activity of the photosynthetic organisms in the concentrated region, and applies an algorithm to determining a presence of chemical, biological or radiological agents, or precursors thereof, based on the measured photosynthetic activity, and in a preferred embodiment can also determine the specific agent as well as its concentration.
- water samples can be stored and time stamped.
- an operator can detect at what time and date the samples were collected to permit further analysis to comply with regulatory mandates (e.g. federal, state, city, industrial, etc.) in the event of the detection of a severe ' toxic agent.
- Microchannels on the lab-on-a-chip 320 can be used for this purpose.
- the system allows the operator to remove designated chips/cartridges containing the microchannels storing the water collected from such an event. By activating certain internal pumps or opening certain water lines and deactivating other pumps or closing certain water lines, the system could be designed to direct the water from the main set of microchannels to the ones used for storing purposes.
- PSII efficiency F max - F s F max where F s is the value at the stable time and F max is the maximum value of the fluorescence induction curve, as shown in Fig. 4 .
- the PSII efficiency represents a simple induction curve-based calculation of the fluorescence signal "signature", and significant deviations thereof indicate the potential presence of a toxic agent in the water.
- PSII efficiency is generally effective in detecting the presence of toxic agents, it fails in some cases due to the non-significant photochemical yield presented by certain toxic agents. Moreover, it cannot generally classify between different agents or the same agent with different concentrations. In addition, using this parameter it can take as long as 60 minutes to arrive at a decision regarding detection of a contamination event. The classification of different agents with a shorter response time is of profound importance, such as to reduce response time to a contamination event. With the knowledge of the type of toxic agent, appropriate medicine and rescue strategies can be used in time to save lives as well as counter the terrorist attacks.
- advanced signal processing algorithms are utilized to detect the existence of toxic agents.
- This advanced analysis methodology comprises the steps of providing at least one time-dependent control signal generated by a biosensor in a liquid (e.g. water) or a gas (e.g. air), and obtaining a time-dependent biosensor signal from the biosensor in a gas or liquid medium to be monitored or analyzed for the presence of one or more toxins selected from chemical, biological or radiological agents.
- the time-dependent biosensor signal is processed to obtain a plurality of feature vectors using at least one of amplitude statistics and a time-frequency analysis. At least one parameter relating to the toxicity of the gas or liquid medium is then determined from the feature vectors based on reference to the control signal provided.
- feature vector is defined as (i) summation based statistical measures as described below (amplitude statistics) and (ii) coefficients (e.g. wavelet coefficients), or statistical parameters derived from the coefficients (e.g. wavelet coefficient standard deviation) generated by application of a time-frequency analysis to the time-dependent sensor signal.
- a first new algorithm comprises high-order statistical analysis (referred to herein as "amplitude statistics") of the light signal in the time domain.
- amplitude statistics is defined as summation based statistical measures derived from a plurality of (N) time points in the signal curve, such as first order (mean), second order (standard deviation), third order (skewness), and fourth order (kurtosis).
- PS II efficiency such as disclosed in U.S. Pat. No. 6,569,384 to Greenbaum et al ., is thus clearly not amplitude statistics since the measurement therein is based on the simple difference between discrete points being the maximum value of the fluorescence induction curve ( F max ) and the fluorescence value at the stable time ( F s ).
- Amplitude statistics can capture more dynamic features of the signal than PSII efficiency, including how fast the signal approaches maximum and minimum, how far samples are from the mean value, and how symmetric the signal appears. These features are generally required in the detection and identification regarding the existence of different toxic agents.
- a first new algorithm comprises wavelet analysis of the light signal in the time-frequency domain referred to herein as "time-frequency analysis”. Because of the nature of the light signal captured by the aquatic biosensors, time-frequency analysis can reveal when and how the frequency of the signal changes. In a preferred embodiment, only three features extracted from the wavelet coefficients are used in the algorithm instead of the entire set of coefficients for signal characterization.
- Amplitude statistics and time-frequency analysis according to the invention can be used independently to provide detection results significantly improved as compared to algorithms based on the fluorescence signal signature. However, by combining amplitude statistics and time-frequency analysis, the confidence detection and identification can be improved to an even higher level.
- the gas or liquid medium to be monitored or analyzed is generally air in the case of gas and water in the case of liquid.
- the water can be primary-source drinking water.
- algae is the biosensor used to generate time-dependent biosensor signals such as fluorescence induction curves which are analyzed through extraction of feature vectors to permit classification of different toxic agents in sunlight-exposed primary-source drinking water based on feature vectors.
- Agents studied included methyl parathion (MPt), potassium cyanide (KCN), Diuron (DCMU), and Paraquat in both the samples of Clinch River (Tennessee) and the samples with lab-grown Chlamydomonas reinhardtii.
- Biosensors are generally cell-based, and can include genetically modified cells.
- a bacterium modified with lux genes can be used.
- algae can be used, either naturally-occurring or genetically modified.
- Naturally- occurring aquatic algae does not generally require culturing.
- Every water source that is exposed to sunlight contains populations of photosynthetic microorganisms (phytoplankton and algae, for example), at concentrations ranging from 10 to as high as 100,000 organisms/ml. Although always present in sunlight-exposed water, these microorganisms are often invisible to the unaided eye.
- Phytoplankton emits a characteristic fluorescence signal that, if detectable in solutions with low microorganism concentrations, can be utilized as an in situ indicator of chemical and/or biological warfare agents water supplies.
- Biosensors provide time-dependent biosensor signal while in a gas or liquid medium to be monitored or analyzed for the presence of one or more toxins selected from chemical, biological or radiological agents.
- Water-soluble toxic chemical and/or biological agents can include blood agents (cyanide, for example), pesticides (methyl parathion, for example) and herbicides (DCMU, for example), or radionuclide that could pose a threat to primary-source drinking water supplies.
- blood agents cyanide, for example
- pesticides methyl parathion, for example
- DCMU herbicides
- the time-dependent biosensor signal is modified by the toxin as compared to a control signal when the toxin is absent.
- the signals can be spectroscopic (e.g. fluorescent).
- spectroscopic signals see, e.g., Huang, G.G., Yang, J. 2005 "Development of infrared optical sensor for selective detection of tyrosine in biological fluids", Biosensors and Bioelectronics, 21(3):408-418 .
- acoustic signals see, e.g., U.S. Patent 6,486,588 to Doron, et al .
- the algae In the case of air monitoring using algae-based biosensors, the algae generally requires culturing.
- air to be analyzed can be drawn through filter paper having algae cultured thereon.
- Amplitude statistics provide statistical measurements of the biosensor signal to be analyzed, such as average fluorescence amplitude over time.
- the mathematical definition of amplitude statistics up to the fourth order is as follows:
- the first-order statistics is actually the average of amplitude.
- the second-order statistics the standard deviation, reflects how different each sample is from the mean.
- the third-order statistics the skewness, depicts how symmetric the curve is.
- the fourth order statistics, the kurtosis describes how flat the curve is. The flatter the curve, the less the kurtosis.
- Figure 5 compares the average amplitude statistics generated from the control and exposure signals of each toxic agent class.
- Figure 6 shows the 3-D plot regarding to the three amplitude statistics features (mean, standard deviation, and skewness). It can be seen from Figure 6 that data from different classes of toxic agents cluster at different positions within the 3D feature space that can be separated relatively easily. This data demonstrates the effectiveness of using amplitude statistics in feature extraction to classify among different toxic chemical agents.
- the wavelet transform is a generalization of the well-known Fourier transform in signal processing.
- the Fourier transform represents a signal in the frequency domain by decomposing a waveform into sinusoids of different frequencies with different amplitudes (weights) which sum to the original waveform.
- the Fourier transform reveals the amount of each frequency component needed to form the original waveform.
- the Fourier transform does not preserve any information concerning the time domain, e.g., when and how long in the time domain that a specific frequency component occurs.
- the lack of time-domain information in the Fourier transform presents a critical problem for the analysis of non-stationary signals which do not maintain the same frequency component throughout the duration of the signal. For example, a stationary signal with four frequency components (e.g. 10Hz, 25Hz, 50Hz, and 100Hz) at all times, and a non-stationary signal with the same four frequency components occurring at different time periods will have the same Fourier transform despite the obvious difference presented in the respective time-domain signals.
- time-frequency analysis such as provided by the wavelet transform, presents a time-frequency representation of the signal.
- a time-frequency representation of the signal provides time-domain information that a specific spectral component occurs. Since biosensor signals such as the fluorescence induction signals are generally non-stationary, it is beneficial to apply a time-frequency analysis such as the wavelet transform to present both the time-domain and the frequency-domain information.
- the parameter a changes the scale of the wavelet, that is, the greater
- the parameter b controls the translation of the wavelet.
- wavelet transforms use narrower windows when the signal frequencies are high and wider windows when the signal frequencies are low. This representation allows the wavelet transform to "enlarge" every high-frequency component, such as the transient in signals. This is one of the main advantages of the wavelet transform over the Fourier transform.
- DWT discrete wavelet transform
- exemplary mother wavelets are shown in Fig. 7 , including the Daubechies wavelet, the Coiflet wavelet, the Harr wavelet, the Symmlet wavelet, the Meyer wavelet and the Battle Lemarie wavelet.
- the Daubechies wavelet is popularly used in the engineering field.
- the forward and inverse wavelet transforms could be implemented using a set of sampling functions, called digital filter banks as shown in Fig. 8 .
- the sampled data f [ n ] is first input in parallel to a low-pass filter (H[n]) and a high-pass filter (G[n]).
- the outputs from the two filters are down-sampled and thus kept exactly one half of the size of the input signals.
- the output of the high-pass filter becomes the first-level wavelet coefficients, C1.
- the second stage uses the output from the low-pass filter of the previous step as the input, which is again sent to H[n] and G[n].
- the output of the down-sampled high-pass filter of this stage becomes the second-level wavelet coefficients, C2.
- the DWT uses filters of different cutoff frequencies to analyze the signal at different scales.
- the signal is passed through a series of high-pass and low-pass filters to analyze the high frequency and low frequency contents respectively.
- Figure 8 shows a three-level wavelet transform with four series of coefficients, C1 to C4.
- Figure 9 shows an example of a fluorescence induction curve exposed to 10 mM KCN and the corresponding 3-level wavelet decomposition.
- Figure 10(a)-(d) show fluorescence induction curves exposed to four classes of toxic agents and the corresponding wavelet transforms of these signals.
- each original induction curve is preprocessed by down-sampling them into signals with 256 discrete samples and then apply the DWT.
- the C1 wavelet coefficients of 128 samples correspond to spectral components within frequency band ( f max / 2, f max ) ; the C2 coefficients of 64 samples reflect frequency components of band ( f max l 4, f max / 2), the C3 coefficients of 32 samples correspond to band ( f max / /8, f max /4), and the C4 coefficients of 32 samples are the low-pass content of band (0; f max / 4).
- Figure 9 shows one example of the 3-level decomposition.
- the fluorescence induction signals are mainly composed of very-low-frequency components, only the first 64 wavelet coefficients (C4 and C3) that correspond to low-frequency spectral components are considered and shown in Fig. 10 .
- a supervised classifier is preferably used to differentiate among different toxic agents.
- a linear discriminant method is preferred, such as the support vector machine (SVM) technique ( Duda, R.O., Hart, P.E., Stork, D.G. 2001, Pattern classification; John Wiley & Sons, 2nd editi on).
- SVM support vector machine
- the SVM classifier relies on transforming the data to represent patterns in a much higher dimension than the original feature space.
- hyperplanes With an appropriate nonlinear mapping (which is application specific) to a sufficiently high dimension, data from different categories can be separated by hyperplanes.
- the optimal hyperplane between each pair of classes is decided by the support vectors that are the most informative training samples for the classification task.
- SVM solves the problem of overfitting since the complexity of the classifier is characterized by the number of support vectors instead of the dimensionality of the transformed space.
- a normalization phase is preferably conducted based on the features extracted from the raw data using algorithms described above.
- Toxic substances often appear in primary-source drinking waters because of unintentional industrial activity or potentially deliberate human action, and its real-time detection is of great importance because bioterrorism and environment contamination are on the rise around the globe.
- Current practices of prevention rely on real-time monitoring. Since the threat of toxins to societies could be substantially mitigated with early detection, the demand for rapid detection of low concentration toxins is expanding quickly for both civilian and military applications to improve homeland security.
- the invention can detect toxins at very low concentrations, particularly when embodied using the preferred lab-on-a chip cell, thus providing an earlier warning than previously possible.
- Systems according to the invention will provide a unique advantage to managers of water utility facilities at civilian and military installations for early detection in the event of a contamination event.
- Chlorella vulgaris (a green alga) was selected as the model bioparticle.
- thin film metal electrodes with feature sizes of micrometer and nanometer, comparable to those ofbioparticles, were used to study electrokinetic capture of bioparticles and their autofluorescence on these electrodes.
- Bioparticles attracted to the electrodes reduce the impedance measured between the pair of electrodes. So by comparing the measured impedance reading with a control sample, the difference in impedance will indicate the presence of the bioparticles.
- a video file was obtained with the alga Chlorella vulgaris. The results obtained demonstrated that electrofocusing can increase local concentration of microalgae by several orders of magnitude in real-time.
- the cells were seen to form a single file at the left electrode. Each electrode was about 70 micrometers ( ⁇ m) in diameter.
Landscapes
- Chemical & Material Sciences (AREA)
- Engineering & Computer Science (AREA)
- Organic Chemistry (AREA)
- Life Sciences & Earth Sciences (AREA)
- Health & Medical Sciences (AREA)
- Proteomics, Peptides & Aminoacids (AREA)
- Bioinformatics & Cheminformatics (AREA)
- Zoology (AREA)
- Wood Science & Technology (AREA)
- Molecular Biology (AREA)
- Biochemistry (AREA)
- Biotechnology (AREA)
- Immunology (AREA)
- Microbiology (AREA)
- Analytical Chemistry (AREA)
- Physics & Mathematics (AREA)
- Toxicology (AREA)
- Medicinal Chemistry (AREA)
- Biophysics (AREA)
- General Engineering & Computer Science (AREA)
- General Health & Medical Sciences (AREA)
- Genetics & Genomics (AREA)
- Investigating, Analyzing Materials By Fluorescence Or Luminescence (AREA)
- Apparatus Associated With Microorganisms And Enzymes (AREA)
- Sampling And Sample Adjustment (AREA)
- Glass Compositions (AREA)
- Separation Using Semi-Permeable Membranes (AREA)
- Investigating Or Analyzing Materials By The Use Of Electric Means (AREA)
Claims (17)
- Ein Verfahren zum Nachweis von Giftstoffen, basierend auf einem Biosensor, das folgende Schritte aufweist:Konzentration einer Mehrzahl fotosynthetischer Organismen in einer Flüssigkeit, um sie in einen konzentrierten Bereich unter Verwendung von polarisierter Wechselstromelektroosmose zu zergliedern;Erreichen einer gemessenen fotosynthetischen Aktivität der fotosynthetischen Organismen in der konzentrierten Region, dadurch gekennzeichnet, dass chemische, biologische oder radiologische Wirkstoffe die nominale fotosynthetische Aktivität der fotosynthetischen Organismen reduzieren, undErmittlung des Vorhandenseins von mindestens einem der besagten chemischen, biologischen oder radiologischen Wirkstoffe oder Vorläufer von diesen in der Flüssigkeit, basierend auf der gemessenen fotosynthetischen Aktivität.
- Das Verfahren nach Anspruch 1, dadurch gekennzeichnet, dass die Mehrzahl der fotosynthetischen Organismen natürlich vorkommende, freilebende, indigene Organismen in der Flüssigkeit sind.
- Das Verfahren nach Anspruch 1, dadurch gekennzeichnet, dass die fotosynthetische Tätigkeit Chlorophyllfluoreszenz-Induktion aufweist.
- Das Verfahren nach Anspruch 1, dadurch gekennzeichnet, dass ein Lab-on-a-Chip-System für den Konzentrationsschritt verwendet wird.
- Das Verfahren nach Anspruch 1, dadurch gekennzeichnet, dass die Flüssigkeit aus einer Primärtrinkwasserquelle entnommen wird.
- Das Verfahren nach Anspruch 5, das weiterhin den Schritt der Auffrischung der Versorgung mit den fotosynthetischen Organismen aufweist, indem eine frische Versorgung mit dem Trinkwasser vorgenommen und das Verfahren wiederholt wird.
- Das Verfahren nach Anspruch 1, dadurch gekennzeichnet, dass der Ermittlungsschritt weiterhin folgende Schritte aufweist:Schaffung von mindestens einem zeitabhängigen Steuersignal, das durch die fotosynthetischen Organismen in der Flüssigkeit generiert wird;Erwirken eines zeitabhängigen Biosensorsignals aus dem Biosensor in der Flüssigkeit für das Vorhandensein von einem oder mehreren Wirkstoffe;Verarbeitung des zeitabhängigen Biosensorsignals, um eine Mehrzahl der Eigenschaftsvektoren unter Verwendung von wenigstens einer Amplitudenstatistik und einer Zeit-Frequenz-Analyse zu erhalten, undErmittlung des Vorhandenseins von mindestens einem der chemischen, biologischen oder radiologischenWirkstoffe oder Vorläufer von diesen aus den Eigenschaftsvektoren, basierend auf der Referenz des Steuersignals.
- Das Verfahren nach Anspruch 7, dadurch gekennzeichnet, dass die Zeit-Frequenz-Analyse eine Wavelet-Koeffizienten-Analyse aufweist.
- Das Verfahren nach Anspruch 7, dadurch gekennzeichnet, dass sowohl Amplitudenstatistiken und Zeit-Frequenz Analyse in dem Verarbeitungsschritt eingesetzt werden.
- Das Verfahren nach Anspruch 7, das weiterhin den Schritt der Identifizierung aufweist, welche der Wirkstoffe in der Flüssigkeit vorhanden sind.
- Das Verfahren nach Anspruch 10, dadurch gekennzeichnet, dass ein lineares Diskriminanzverfahren für die Identifizierungsschritte angewendet wird.
- Das Verfahren nach Anspruch 11, dadurch gekennzeichnet, dass das lineare Diskriminanzverfahren eine Support Vector Machine (SVM)-Klassifizierung aufweist.
- Das Verfahren nach Anspruch 1, dadurch gekennzeichnet, dass die Gleichstrompolarisation für die polarisierte ACEO zwischen 1 und 10 Volt beträgt.
- Ein Wasserqualitätsanalysegerät, das Folgendes aufweist:eine polarisierte Wechselstromelektroosmose (ACEO) für das Erhalten einer zu analysierenden Flüssigkeit, die darin eine Mehrzahl von photosynthetischen Organismen enthält und die Konzentration der Mehrzahl der fotosynthetischen Organismen in wenigstens einen konzentrierten Bereich undeinen Fotodetektor für das Erhalten einer gemessenen fotosynthetischen Tätigkeit der Mehrzahl von fotosynthetischen Organismen in der konzentrierten Region, dadurch gekennzeichnet, dass chemische, biologische oder radiologische Wirkstoffe die nominale fotosynthetische Aktivität der fotosynthetischen Organismen verringern, undein Elektronikpaket für das Analysieren der gemessenen fotosynthetischen Aktivität, um das Vorhandensein von chemischen, biologischen oder radiologischen Wirkstoffen in der Flüssigkeit anzuzeigen,
- Der Sensor nach Anspruch 14, dadurch gekennzeichnet, dass die ACEO-Zelle eine Lab-on-a-Chip-Vorrichtung aufweist.
- Der Sensor nach Anspruch 15, dadurch gekennzeichnet, dass die Lab-ona-Chip-Vorrichtung mindestens eine elektronische Vorrichtung auf dem Chip beinhaltet.
- Der Sensor nach Anspruch 14, der weiterhin eine Struktur für die Übertragung der gemessenen fotosynthetischen Aktivität oder der gemessenen fotosynthetischen Aktivität nach der Analyse durch das Elektronikpaket zu einer oder mehreren entfernten Stellen aufweist.
Applications Claiming Priority (2)
| Application Number | Priority Date | Filing Date | Title |
|---|---|---|---|
| US11/271,643 US8198075B2 (en) | 2005-08-31 | 2005-11-10 | Method and apparatus for enhanced detection of toxic agents |
| PCT/US2006/042984 WO2008054394A2 (en) | 2005-11-10 | 2006-11-03 | Method and apparatus for detection of toxic agents using photosynthetic organisms |
Publications (2)
| Publication Number | Publication Date |
|---|---|
| EP1957663A2 EP1957663A2 (de) | 2008-08-20 |
| EP1957663B1 true EP1957663B1 (de) | 2009-09-02 |
Family
ID=39244703
Family Applications (1)
| Application Number | Title | Priority Date | Filing Date |
|---|---|---|---|
| EP06851909A Not-in-force EP1957663B1 (de) | 2005-11-10 | 2006-11-03 | Verfahren und vorrichtung für den verbesserten nachweis von giftstoffen |
Country Status (9)
| Country | Link |
|---|---|
| US (2) | US8198075B2 (de) |
| EP (1) | EP1957663B1 (de) |
| JP (1) | JP4990909B2 (de) |
| CN (1) | CN101356282B (de) |
| AT (1) | ATE441723T1 (de) |
| CA (1) | CA2629307C (de) |
| DE (1) | DE602006008979D1 (de) |
| IL (1) | IL191315A (de) |
| WO (1) | WO2008054394A2 (de) |
Families Citing this family (18)
| Publication number | Priority date | Publication date | Assignee | Title |
|---|---|---|---|---|
| US8158377B2 (en) | 2005-08-31 | 2012-04-17 | Ut-Battelle, Llc | Biosensor method and system based on feature vector extraction |
| US8198075B2 (en) | 2005-08-31 | 2012-06-12 | Ut-Battelle, Llc | Method and apparatus for enhanced detection of toxic agents |
| US7704457B2 (en) * | 2005-11-18 | 2010-04-27 | Patton Charles J | Automatic, field portable analyzer using discrete sample aliquots |
| CN101726575A (zh) * | 2008-10-16 | 2010-06-09 | 魏胜非 | 利用高压静电激活发光微生物检测饮用水急性毒物的方法 |
| KR101012056B1 (ko) * | 2008-11-28 | 2011-02-01 | 한국표준과학연구원 | 다채널 타원계측 표면 플라즈몬 공명 측정장치 |
| KR101029473B1 (ko) | 2008-11-28 | 2011-04-18 | 한국표준과학연구원 | 초점타원계측 표면 플라즈몬 공명 측정장치 |
| IT1392838B1 (it) | 2009-02-13 | 2012-03-23 | Univ Bologna Alma Mater | Dispositivo portatile per la rivelazione di sostanze comprendente cellule immobilizzate |
| US8666673B2 (en) | 2010-05-14 | 2014-03-04 | Biomerieux, Inc | Identification and/or characterization of a microbial agent using taxonomic hierarchical classification |
| US9222888B2 (en) * | 2012-04-03 | 2015-12-29 | Ut-Battelle, Llc | Pulse amplitude modulated chlorophyll fluorometer |
| CN103412051A (zh) * | 2013-08-22 | 2013-11-27 | 浙江工商大学 | 一种番荔枝储存时间的检测方法 |
| JP2014025951A (ja) * | 2013-10-28 | 2014-02-06 | Konica Minolta Inc | 測定方法及び表面プラズモン増強蛍光測定装置 |
| EP3114483A1 (de) | 2014-03-03 | 2017-01-11 | Yissum Research and Development Company of the Hebrew University of Jerusalem Ltd. | Verfahren und vorrichtung für den nachweis von pseudomonas aeruginosa |
| CN104931289B (zh) * | 2015-07-10 | 2018-08-10 | 天地科技股份有限公司 | 一种螺旋采样在线检测封装的装置和方法 |
| DE102015219023B3 (de) * | 2015-10-01 | 2017-02-23 | Technische Universität München | Vorrichtung zum Analysieren von biologischen Substanzen in einer Testlösung, Herstellungsverfahren und Betriebsverfahren |
| DE102017213158A1 (de) | 2017-07-31 | 2019-01-31 | Technische Universität München | Sensoranordnung zum Analysieren von Substanzen in einem Stoff und Verfahren zum Betreiben einer solchen Sensoranordnung |
| CN109142233A (zh) * | 2018-08-08 | 2019-01-04 | 安徽汇泽通环境技术有限公司 | 一种饮用水源地水质突变预警与监测系统和方法 |
| CN110186505B (zh) * | 2019-06-06 | 2020-02-14 | 浙江清华长三角研究院 | 一种基于支持向量机的农村生活污水处理设施出水达标情况的预测方法 |
| JP7766999B2 (ja) * | 2020-04-03 | 2025-11-11 | オルガノ株式会社 | 水質管理方法、情報処理装置および情報処理システム |
Family Cites Families (34)
| Publication number | Priority date | Publication date | Assignee | Title |
|---|---|---|---|---|
| US3790461A (en) * | 1971-05-20 | 1974-02-05 | G Yeh | Separation of a liquid containing charged particles or/and polarizable molecules |
| US4267038A (en) * | 1979-11-20 | 1981-05-12 | Thompson Worthington J | Controlled natural purification system for advanced wastewater treatment and protein conversion and recovery |
| SE462408B (sv) * | 1988-11-10 | 1990-06-18 | Pharmacia Ab | Optiskt biosensorsystem utnyttjande ytplasmonresonans foer detektering av en specific biomolekyl, saett att kalibrera sensoranordningen samt saett att korrigera foer baslinjedrift i systemet |
| US4909919A (en) * | 1988-11-22 | 1990-03-20 | The Regents Of The University Of Michigan | Velocity modulated capillary electrophoresis analysis system |
| DE4318519C2 (de) * | 1993-06-03 | 1996-11-28 | Fraunhofer Ges Forschung | Elektrochemischer Sensor |
| US5602446A (en) * | 1993-10-21 | 1997-02-11 | Associated Universities, Inc. | Fast repetition rate (FRR) flasher |
| US5426306A (en) * | 1993-10-21 | 1995-06-20 | Associated Universities, Inc. | Fast repetition rate (FRR) fluorometer and method for measuring fluorescence and photosynthetic parameters |
| US5437772A (en) * | 1993-11-01 | 1995-08-01 | The Electrosynthesis Co., Inc. | Portable lead detector |
| AU7340596A (en) * | 1995-10-09 | 1997-04-30 | Korea Ocean Research & Development Institute | An automated analyzing apparatus for measuring water quality with a cylinder-shaped syringe unit |
| US5661697A (en) | 1995-12-18 | 1997-08-26 | Atlantic Richfield Company | Method and apparatus for detection of sand formations in amplitude-versus-offset seismic surveys |
| US5779911A (en) * | 1996-04-10 | 1998-07-14 | Haug; Irving M. | Aqueous fluid purification monitoring and control system and process |
| US6891317B2 (en) * | 2001-05-22 | 2005-05-10 | Sri International | Rolled electroactive polymers |
| US6198107B1 (en) * | 1997-03-07 | 2001-03-06 | Clare Chemical Research, Inc. | Fluorometric detection using visible light |
| DE19723458A1 (de) * | 1997-06-04 | 1998-12-10 | Voith Sulzer Papiermasch Gmbh | Vorrichtung und Verfahren zum Auftragen eines flüssigen oder pastösen Mediums auf einen sich vorbeibewegenden Untergrund |
| US6511854B1 (en) * | 1997-07-31 | 2003-01-28 | The Uab Research Foundation | Regenerable biosensor using total internal reflection fluorescence with electrochemical control |
| US5876960A (en) * | 1997-08-11 | 1999-03-02 | The United States Of America As Represented By The Secretary Of The Army | Bacterial spore detection and quantification methods |
| US6486588B2 (en) | 1997-12-30 | 2002-11-26 | Remon Medical Technologies Ltd | Acoustic biosensor for monitoring physiological conditions in a body implantation site |
| US6051437A (en) * | 1998-05-04 | 2000-04-18 | American Research Corporation Of Virginia | Optical chemical sensor based on multilayer self-assembled thin film sensors for aquaculture process control |
| US6692696B1 (en) * | 1998-06-18 | 2004-02-17 | ARETé ASSOCIATES | Biosensor |
| US6573107B1 (en) * | 1998-08-05 | 2003-06-03 | The University Of Wyoming | Immunochemical detection of an explosive substance in the gas phase through surface plasmon resonance spectroscopy |
| US6740518B1 (en) * | 1998-09-17 | 2004-05-25 | Clinical Micro Sensors, Inc. | Signal detection techniques for the detection of analytes |
| US6569384B2 (en) * | 2000-08-21 | 2003-05-27 | Ut-Battelle, Llc | Tissue-based water quality biosensors for detecting chemical warfare agents |
| US7015484B2 (en) * | 2001-04-16 | 2006-03-21 | Dakota Technologies, Inc. | Multi-dimensional fluorescence apparatus and method for rapid and highly sensitive quantitative analysis of mixtures |
| WO2002095359A2 (en) | 2001-05-23 | 2002-11-28 | University Of Florida | Method and apparatus for detecting illicit substances |
| US6942765B2 (en) * | 2001-05-31 | 2005-09-13 | Surfect Technologies, Inc. | Submicron and nano size particle encapsulation by electrochemical process and apparatus |
| JP2003075447A (ja) * | 2001-09-03 | 2003-03-12 | Fuji Photo Film Co Ltd | 表面プラズモン共鳴バイオセンサー用測定チップ |
| US6783647B2 (en) * | 2001-10-19 | 2004-08-31 | Ut-Battelle, Llc | Microfluidic systems and methods of transport and lysis of cells and analysis of cell lysate |
| US7081189B2 (en) * | 2001-12-18 | 2006-07-25 | Massachusetts Institute Of Technology | Microfluidic pumps and mixers driven by induced-charge electro-osmosis |
| US7747391B2 (en) * | 2002-03-01 | 2010-06-29 | Maxygen, Inc. | Methods, systems, and software for identifying functional biomolecules |
| US7214427B2 (en) * | 2002-03-21 | 2007-05-08 | Aviva Biosciences Corporation | Composite beads comprising magnetizable substance and electro-conductive substance |
| US20050003396A1 (en) * | 2003-04-11 | 2005-01-06 | Mihrimah Ozkan | Biosensors having single reactant components immobilized over single electrodes and methods of making and using thereof |
| US7110920B2 (en) * | 2003-07-24 | 2006-09-19 | Bae Systems Land & Armaments L.P. | Water monitoring systems |
| US7615762B2 (en) * | 2004-12-03 | 2009-11-10 | Nano Science Diagnostics, Inc. | Method and apparatus for low quantity detection of bioparticles in small sample volumes |
| US8198075B2 (en) | 2005-08-31 | 2012-06-12 | Ut-Battelle, Llc | Method and apparatus for enhanced detection of toxic agents |
-
2005
- 2005-11-10 US US11/271,643 patent/US8198075B2/en active Active
-
2006
- 2006-11-03 JP JP2008542328A patent/JP4990909B2/ja not_active Expired - Fee Related
- 2006-11-03 DE DE602006008979T patent/DE602006008979D1/de active Active
- 2006-11-03 EP EP06851909A patent/EP1957663B1/de not_active Not-in-force
- 2006-11-03 CN CN2006800507715A patent/CN101356282B/zh not_active Expired - Fee Related
- 2006-11-03 CA CA2629307A patent/CA2629307C/en not_active Expired - Fee Related
- 2006-11-03 AT AT06851909T patent/ATE441723T1/de not_active IP Right Cessation
- 2006-11-03 WO PCT/US2006/042984 patent/WO2008054394A2/en not_active Ceased
-
2008
- 2008-05-07 IL IL191315A patent/IL191315A/en not_active IP Right Cessation
-
2012
- 2012-05-17 US US13/474,183 patent/US8546073B2/en not_active Expired - Fee Related
Also Published As
| Publication number | Publication date |
|---|---|
| JP4990909B2 (ja) | 2012-08-01 |
| WO2008054394A9 (en) | 2008-07-31 |
| CN101356282A (zh) | 2009-01-28 |
| EP1957663A2 (de) | 2008-08-20 |
| JP2009516203A (ja) | 2009-04-16 |
| CA2629307C (en) | 2014-05-27 |
| DE602006008979D1 (de) | 2009-10-15 |
| ATE441723T1 (de) | 2009-09-15 |
| US8546073B2 (en) | 2013-10-01 |
| US20120244572A1 (en) | 2012-09-27 |
| US20080032326A1 (en) | 2008-02-07 |
| IL191315A (en) | 2011-01-31 |
| US8198075B2 (en) | 2012-06-12 |
| CN101356282B (zh) | 2012-06-27 |
| WO2008054394A3 (en) | 2008-06-19 |
| WO2008054394A2 (en) | 2008-05-08 |
| CA2629307A1 (en) | 2008-05-08 |
Similar Documents
| Publication | Publication Date | Title |
|---|---|---|
| US8546073B2 (en) | Method and apparatus for enhanced detection of toxic agents | |
| US8476062B2 (en) | Biosensor method and system based on feature vector extraction | |
| Harz et al. | Vibrational spectroscopy—A powerful tool for the rapid identification of microbial cells at the single‐cell level | |
| Hamada et al. | Development of rapid oral bacteria detection apparatus based on dielectrophoretic impedance measurement method | |
| US8688384B2 (en) | Automated characterization and classification of microorganisms | |
| Karasinski et al. | Multiarray sensors with pattern recognition for the detection, classification, and differentiation of bacteria at subspecies and strain levels | |
| David et al. | Viability and membrane potential analysis of Bacillus megaterium cells by impedance flow cytometry | |
| Melnikov et al. | Optical Oxygen Sensing and Clark Electrode: Face-to-Face in a Biosensor Case Study | |
| Sui et al. | Electrical impedance as an indicator of microalgal cell health | |
| Takamura et al. | Spectral mining for discriminating blood origins in the presence of substrate interference via attenuated total reflection Fourier transform infrared spectroscopy: postmortem or antemortem blood? | |
| Tekaya et al. | Bi-Enzymatic conductometric biosensor for detection of heavy metal ions and pesticides in water samples based on enzymatic inhibition in arthrospira platensis | |
| Zieger et al. | Spectral characterization of eight marine phytoplankton phyla and assessing a pigment-based taxonomic discriminant analysis for the in situ classification of phytoplankton blooms | |
| Tung et al. | Use of discrete wavelet transform to assess impedance fluctuations obtained from cellular micromotion | |
| Kastanos et al. | A novel method for bacterial UTI diagnosis using Raman spectroscopy | |
| MX2008006112A (en) | Method and apparatus for detection of toxic agents using photosynthetic organisms | |
| Mehlawat et al. | Ultrafast and Ultrasensitive Bacterial Detection in Biofluids: Leveraging Resazurin as a Visible and Fluorescent Spectroscopic Marker | |
| Hadjigeorgiou et al. | Multi-bacteria multi-antibiotic testing using surface enhanced Raman spectroscopy (SERS) for urinary tract infection (UTI) diagnosis | |
| Vang et al. | Surface-enhanced raman spectroscopy and multivariate analysis for elucidating mechanisms of action in antibacterial agents | |
| EP1963519B1 (de) | Verfahren und system zur echtzeitanalyse von biosensordaten | |
| Mushenkov et al. | Surface-enhanced Raman spectroscopy on the membranes for antimicrobial resistance testing | |
| RU2401308C2 (ru) | Способ определения количества микробиологических объектов в процессе их культивирования | |
| Zhang et al. | Label-Free Cyanobacteria Quantification Using a Microflow Cytometry Platform for Early Warning Detection and Characterization of Hazardous Cyanobacteria Blooms |
Legal Events
| Date | Code | Title | Description |
|---|---|---|---|
| PUAI | Public reference made under article 153(3) epc to a published international application that has entered the european phase |
Free format text: ORIGINAL CODE: 0009012 |
|
| AK | Designated contracting states |
Kind code of ref document: A2 Designated state(s): AT BE BG CH CY CZ DE DK EE ES FI FR GB GR HU IE IS IT LI LT LU LV MC NL PL PT RO SE SI SK TR |
|
| AX | Request for extension of the european patent |
Extension state: AL BA HR MK RS |
|
| RIN1 | Information on inventor provided before grant (corrected) |
Inventor name: QI, HAIRONG Inventor name: RODRIGUEZ, MIGUEL, JR. Inventor name: WU, JIE, JAYNE Inventor name: GREENBAUM, ELIAS |
|
| RBV | Designated contracting states (corrected) |
Designated state(s): AT BE BG CH CY CZ DE DK EE ES FI FR GB GR HU IE IS IT LI LT LU LV MC NL PL PT RO SE SI SK TR |
|
| 17P | Request for examination filed |
Effective date: 20080827 |
|
| GRAP | Despatch of communication of intention to grant a patent |
Free format text: ORIGINAL CODE: EPIDOSNIGR1 |
|
| GRAS | Grant fee paid |
Free format text: ORIGINAL CODE: EPIDOSNIGR3 |
|
| GRAA | (expected) grant |
Free format text: ORIGINAL CODE: 0009210 |
|
| DAX | Request for extension of the european patent (deleted) | ||
| AK | Designated contracting states |
Kind code of ref document: B1 Designated state(s): AT BE BG CH CY CZ DE DK EE ES FI FR GB GR HU IE IS IT LI LT LU LV MC NL PL PT RO SE SI SK TR |
|
| REG | Reference to a national code |
Ref country code: CH Ref legal event code: EP |
|
| REG | Reference to a national code |
Ref country code: IE Ref legal event code: FG4D |
|
| REF | Corresponds to: |
Ref document number: 602006008979 Country of ref document: DE Date of ref document: 20091015 Kind code of ref document: P |
|
| PG25 | Lapsed in a contracting state [announced via postgrant information from national office to epo] |
Ref country code: SE Free format text: LAPSE BECAUSE OF FAILURE TO SUBMIT A TRANSLATION OF THE DESCRIPTION OR TO PAY THE FEE WITHIN THE PRESCRIBED TIME-LIMIT Effective date: 20090902 Ref country code: LT Free format text: LAPSE BECAUSE OF FAILURE TO SUBMIT A TRANSLATION OF THE DESCRIPTION OR TO PAY THE FEE WITHIN THE PRESCRIBED TIME-LIMIT Effective date: 20090902 Ref country code: FI Free format text: LAPSE BECAUSE OF FAILURE TO SUBMIT A TRANSLATION OF THE DESCRIPTION OR TO PAY THE FEE WITHIN THE PRESCRIBED TIME-LIMIT Effective date: 20090902 |
|
| NLV1 | Nl: lapsed or annulled due to failure to fulfill the requirements of art. 29p and 29m of the patents act | ||
| LTIE | Lt: invalidation of european patent or patent extension |
Effective date: 20090902 |
|
| PG25 | Lapsed in a contracting state [announced via postgrant information from national office to epo] |
Ref country code: PL Free format text: LAPSE BECAUSE OF FAILURE TO SUBMIT A TRANSLATION OF THE DESCRIPTION OR TO PAY THE FEE WITHIN THE PRESCRIBED TIME-LIMIT Effective date: 20090902 Ref country code: LV Free format text: LAPSE BECAUSE OF FAILURE TO SUBMIT A TRANSLATION OF THE DESCRIPTION OR TO PAY THE FEE WITHIN THE PRESCRIBED TIME-LIMIT Effective date: 20090902 Ref country code: SI Free format text: LAPSE BECAUSE OF FAILURE TO SUBMIT A TRANSLATION OF THE DESCRIPTION OR TO PAY THE FEE WITHIN THE PRESCRIBED TIME-LIMIT Effective date: 20090902 Ref country code: NL Free format text: LAPSE BECAUSE OF FAILURE TO SUBMIT A TRANSLATION OF THE DESCRIPTION OR TO PAY THE FEE WITHIN THE PRESCRIBED TIME-LIMIT Effective date: 20090902 |
|
| PG25 | Lapsed in a contracting state [announced via postgrant information from national office to epo] |
Ref country code: CY Free format text: LAPSE BECAUSE OF FAILURE TO SUBMIT A TRANSLATION OF THE DESCRIPTION OR TO PAY THE FEE WITHIN THE PRESCRIBED TIME-LIMIT Effective date: 20090902 |
|
| PG25 | Lapsed in a contracting state [announced via postgrant information from national office to epo] |
Ref country code: RO Free format text: LAPSE BECAUSE OF FAILURE TO SUBMIT A TRANSLATION OF THE DESCRIPTION OR TO PAY THE FEE WITHIN THE PRESCRIBED TIME-LIMIT Effective date: 20090902 Ref country code: ES Free format text: LAPSE BECAUSE OF FAILURE TO SUBMIT A TRANSLATION OF THE DESCRIPTION OR TO PAY THE FEE WITHIN THE PRESCRIBED TIME-LIMIT Effective date: 20091213 Ref country code: PT Free format text: LAPSE BECAUSE OF FAILURE TO SUBMIT A TRANSLATION OF THE DESCRIPTION OR TO PAY THE FEE WITHIN THE PRESCRIBED TIME-LIMIT Effective date: 20100104 Ref country code: IS Free format text: LAPSE BECAUSE OF FAILURE TO SUBMIT A TRANSLATION OF THE DESCRIPTION OR TO PAY THE FEE WITHIN THE PRESCRIBED TIME-LIMIT Effective date: 20100102 Ref country code: CZ Free format text: LAPSE BECAUSE OF FAILURE TO SUBMIT A TRANSLATION OF THE DESCRIPTION OR TO PAY THE FEE WITHIN THE PRESCRIBED TIME-LIMIT Effective date: 20090902 Ref country code: EE Free format text: LAPSE BECAUSE OF FAILURE TO SUBMIT A TRANSLATION OF THE DESCRIPTION OR TO PAY THE FEE WITHIN THE PRESCRIBED TIME-LIMIT Effective date: 20090902 |
|
| PG25 | Lapsed in a contracting state [announced via postgrant information from national office to epo] |
Ref country code: SK Free format text: LAPSE BECAUSE OF FAILURE TO SUBMIT A TRANSLATION OF THE DESCRIPTION OR TO PAY THE FEE WITHIN THE PRESCRIBED TIME-LIMIT Effective date: 20090902 |
|
| PG25 | Lapsed in a contracting state [announced via postgrant information from national office to epo] |
Ref country code: AT Free format text: LAPSE BECAUSE OF FAILURE TO SUBMIT A TRANSLATION OF THE DESCRIPTION OR TO PAY THE FEE WITHIN THE PRESCRIBED TIME-LIMIT Effective date: 20090902 Ref country code: MC Free format text: LAPSE BECAUSE OF NON-PAYMENT OF DUE FEES Effective date: 20091130 Ref country code: BE Free format text: LAPSE BECAUSE OF FAILURE TO SUBMIT A TRANSLATION OF THE DESCRIPTION OR TO PAY THE FEE WITHIN THE PRESCRIBED TIME-LIMIT Effective date: 20090902 |
|
| PLBE | No opposition filed within time limit |
Free format text: ORIGINAL CODE: 0009261 |
|
| STAA | Information on the status of an ep patent application or granted ep patent |
Free format text: STATUS: NO OPPOSITION FILED WITHIN TIME LIMIT |
|
| PG25 | Lapsed in a contracting state [announced via postgrant information from national office to epo] |
Ref country code: DK Free format text: LAPSE BECAUSE OF FAILURE TO SUBMIT A TRANSLATION OF THE DESCRIPTION OR TO PAY THE FEE WITHIN THE PRESCRIBED TIME-LIMIT Effective date: 20090902 |
|
| 26N | No opposition filed |
Effective date: 20100603 |
|
| REG | Reference to a national code |
Ref country code: FR Ref legal event code: ST Effective date: 20100730 |
|
| PG25 | Lapsed in a contracting state [announced via postgrant information from national office to epo] |
Ref country code: FR Free format text: LAPSE BECAUSE OF NON-PAYMENT OF DUE FEES Effective date: 20091130 Ref country code: IE Free format text: LAPSE BECAUSE OF NON-PAYMENT OF DUE FEES Effective date: 20091103 Ref country code: GR Free format text: LAPSE BECAUSE OF FAILURE TO SUBMIT A TRANSLATION OF THE DESCRIPTION OR TO PAY THE FEE WITHIN THE PRESCRIBED TIME-LIMIT Effective date: 20091203 |
|
| PG25 | Lapsed in a contracting state [announced via postgrant information from national office to epo] |
Ref country code: BG Free format text: LAPSE BECAUSE OF FAILURE TO SUBMIT A TRANSLATION OF THE DESCRIPTION OR TO PAY THE FEE WITHIN THE PRESCRIBED TIME-LIMIT Effective date: 20091130 Ref country code: IT Free format text: LAPSE BECAUSE OF FAILURE TO SUBMIT A TRANSLATION OF THE DESCRIPTION OR TO PAY THE FEE WITHIN THE PRESCRIBED TIME-LIMIT Effective date: 20090902 |
|
| PG25 | Lapsed in a contracting state [announced via postgrant information from national office to epo] |
Ref country code: LU Free format text: LAPSE BECAUSE OF NON-PAYMENT OF DUE FEES Effective date: 20091103 |
|
| PG25 | Lapsed in a contracting state [announced via postgrant information from national office to epo] |
Ref country code: HU Free format text: LAPSE BECAUSE OF FAILURE TO SUBMIT A TRANSLATION OF THE DESCRIPTION OR TO PAY THE FEE WITHIN THE PRESCRIBED TIME-LIMIT Effective date: 20100303 |
|
| REG | Reference to a national code |
Ref country code: CH Ref legal event code: PL |
|
| PG25 | Lapsed in a contracting state [announced via postgrant information from national office to epo] |
Ref country code: LI Free format text: LAPSE BECAUSE OF NON-PAYMENT OF DUE FEES Effective date: 20101130 Ref country code: CH Free format text: LAPSE BECAUSE OF NON-PAYMENT OF DUE FEES Effective date: 20101130 |
|
| PG25 | Lapsed in a contracting state [announced via postgrant information from national office to epo] |
Ref country code: TR Free format text: LAPSE BECAUSE OF FAILURE TO SUBMIT A TRANSLATION OF THE DESCRIPTION OR TO PAY THE FEE WITHIN THE PRESCRIBED TIME-LIMIT Effective date: 20090902 |
|
| PGFP | Annual fee paid to national office [announced via postgrant information from national office to epo] |
Ref country code: DE Payment date: 20141119 Year of fee payment: 9 Ref country code: GB Payment date: 20141119 Year of fee payment: 9 |
|
| REG | Reference to a national code |
Ref country code: DE Ref legal event code: R119 Ref document number: 602006008979 Country of ref document: DE |
|
| GBPC | Gb: european patent ceased through non-payment of renewal fee |
Effective date: 20151103 |
|
| PG25 | Lapsed in a contracting state [announced via postgrant information from national office to epo] |
Ref country code: DE Free format text: LAPSE BECAUSE OF NON-PAYMENT OF DUE FEES Effective date: 20160601 Ref country code: GB Free format text: LAPSE BECAUSE OF NON-PAYMENT OF DUE FEES Effective date: 20151103 |