EP1997049B1 - Système, procédé et programme informatique d'analyse de données spectrométriques pour identifier et quantifier des composants individuels dans un échantillon - Google Patents
Système, procédé et programme informatique d'analyse de données spectrométriques pour identifier et quantifier des composants individuels dans un échantillon Download PDFInfo
- Publication number
- EP1997049B1 EP1997049B1 EP07758894.5A EP07758894A EP1997049B1 EP 1997049 B1 EP1997049 B1 EP 1997049B1 EP 07758894 A EP07758894 A EP 07758894A EP 1997049 B1 EP1997049 B1 EP 1997049B1
- Authority
- EP
- European Patent Office
- Prior art keywords
- samples
- ions
- matrix
- factorization
- present
- Prior art date
- Legal status (The legal status is an assumption and is not a legal conclusion. Google has not performed a legal analysis and makes no representation as to the accuracy of the status listed.)
- Active
Links
Images




Classifications
-
- G—PHYSICS
- G01—MEASURING; TESTING
- G01N—INVESTIGATING OR ANALYSING MATERIALS BY DETERMINING THEIR CHEMICAL OR PHYSICAL PROPERTIES
- G01N30/00—Investigating or analysing materials by separation into components using adsorption, absorption or similar phenomena or using ion-exchange, e.g. chromatography or field flow fractionation
- G01N30/02—Column chromatography
- G01N30/86—Signal analysis
- G01N30/8675—Evaluation, i.e. decoding of the signal into analytical information
-
- G—PHYSICS
- G06—COMPUTING OR CALCULATING; COUNTING
- G06F—ELECTRIC DIGITAL DATA PROCESSING
- G06F18/00—Pattern recognition
- G06F18/20—Analysing
- G06F18/21—Design or setup of recognition systems or techniques; Extraction of features in feature space; Blind source separation
- G06F18/213—Feature extraction, e.g. by transforming the feature space; Summarisation; Mappings, e.g. subspace methods
- G06F18/2134—Feature extraction, e.g. by transforming the feature space; Summarisation; Mappings, e.g. subspace methods based on separation criteria, e.g. independent component analysis
-
- G—PHYSICS
- G16—INFORMATION AND COMMUNICATION TECHNOLOGY [ICT] SPECIALLY ADAPTED FOR SPECIFIC APPLICATION FIELDS
- G16C—COMPUTATIONAL CHEMISTRY; CHEMOINFORMATICS; COMPUTATIONAL MATERIALS SCIENCE
- G16C20/00—Chemoinformatics, i.e. ICT specially adapted for the handling of physicochemical or structural data of chemical particles, elements, compounds or mixtures
- G16C20/20—Identification of molecular entities, parts thereof or of chemical compositions
-
- G—PHYSICS
- G16—INFORMATION AND COMMUNICATION TECHNOLOGY [ICT] SPECIALLY ADAPTED FOR SPECIFIC APPLICATION FIELDS
- G16H—HEALTHCARE INFORMATICS, i.e. INFORMATION AND COMMUNICATION TECHNOLOGY [ICT] SPECIALLY ADAPTED FOR THE HANDLING OR PROCESSING OF MEDICAL OR HEALTHCARE DATA
- G16H10/00—ICT specially adapted for the handling or processing of patient-related medical or healthcare data
- G16H10/40—ICT specially adapted for the handling or processing of patient-related medical or healthcare data for data related to laboratory analysis, e.g. patient specimen analysis
-
- H—ELECTRICITY
- H01—ELECTRIC ELEMENTS
- H01J—ELECTRIC DISCHARGE TUBES OR DISCHARGE LAMPS
- H01J49/00—Particle spectrometers or separator tubes
- H01J49/0027—Methods for using particle spectrometers
- H01J49/0036—Step by step routines describing the handling of the data generated during a measurement
-
- G—PHYSICS
- G16—INFORMATION AND COMMUNICATION TECHNOLOGY [ICT] SPECIALLY ADAPTED FOR SPECIFIC APPLICATION FIELDS
- G16C—COMPUTATIONAL CHEMISTRY; CHEMOINFORMATICS; COMPUTATIONAL MATERIALS SCIENCE
- G16C20/00—Chemoinformatics, i.e. ICT specially adapted for the handling of physicochemical or structural data of chemical particles, elements, compounds or mixtures
- G16C20/80—Data visualisation
Definitions
- the present invention relates to the use of non-negative factorization functions and/or correlation functions to determine a characteristic value corresponding to one or more components (such as, for example, metabolites) or other compounds present in a plurality of samples and to use the characteristic value to identify and/or quantify individual components or other components that may be present in the samples.
- components such as, for example, metabolites
- correlation functions to determine a characteristic value corresponding to one or more components (such as, for example, metabolites) or other compounds present in a plurality of samples and to use the characteristic value to identify and/or quantify individual components or other components that may be present in the samples.
- metabolome refers to the collection of metabolites present in an organism.
- the human metabolome encompasses native small molecules (natively biosynthesizeable, non-polymeric compounds) that are participants in general metabolic reactions and that are required for the maintenance, growth and normal function of a cell.
- metabolomics is a direct observation of the status of cellular physiology, and may thus be predictive of disease in a given organism.
- Subtle biochemical changes are inherent in a given disease. Therefore, the accurate mapping of these changes to known pathways may allow researchers to build a biochemical hypothesis for a disease. Based on this hypothesis, the enzymes and proteins critical to the disease can be uncovered such that disease targets may be identified for treatment with targeted pharmaceutical compounds.
- genomics (study of the DNA-level biochemistry), transcript profiling (study of the RNA-level biochemistry), and proteomics (study of the protein-level biochemistry) are useful for identification of disease pathways, these methods are complicated by the fact that there exist over 25,000 genes, 100,000 to 200,000 RNA transcripts and up to 1,000,000 proteins in human cells. However, it is estimated that there may be as few as 2,500 small molecules in the human metabolome.
- metabolomic technology provides a significant leap beyond genomics, transcript profiling, and/or proteomics.
- metabolomics metabolites, and their role in the human metabolism may be readily identified.
- the identification of disease targets may be expedited with greater accuracy than with any other known methods.
- the collection of metabolomic data for use in identifying disease pathways is generally known in the art, as described generally in U.S. Patent No. 7,005,255 , entitled Methods for Drug Discovery, Disease Treatment, and Diagnosis Using Metabolomics.
- the collection and sorting of metabolomic data taken from a variety of biological samples consumes large amounts of time and computational power.
- spectrometry data for biological samples is collected and plotted in three dimensions and stored in an individual file corresponding to each biological sample.
- Such spectrometry data consists of known spectra corresponding to the detection of certain ions that may be present in a given sample. While individual ions may be detectable in such spectra, the combinations and interplay of such ions to indicate specific individual metabolite compounds may not be immediately discernable, especially in only a single biological sample.
- the spectrum of the component can be easily matched with the spectra of known components in order to identify the component. Furthermore, if there is an ion unique to a specific component, then the intensity (as discernible in the spectral plot) of the ion can be used for the relative quantification of the component in the sample.
- the fractionation of a particular biological sample in a liquid or gas chromatograph, for example
- two or more component compounds or small molecule components may "co-elute" from the physical separation process giving rise to an impure mixture of components going into the spectrometer. Thus, subtle spectral trends viewed over many individual biological samples of the same type may be indicative of the presence of one or more otherwise-obscured components.
- Metabolon, Inc. has developed a system and method for manipulating three-dimensional spectrometry data sets to produce plots that are more directly comparable to a plurality of characteristic plots corresponding to a plurality of selected metabolites, as disclosed in U.S. Patent Application No. 11/462,838 entitled A System, Method, and Computer Program Product Using an Automated Relational Database in a Computing System to Compile and Compare Metabolomic Data Obtained from a Plurality of Samples, which is incorporated herein by reference in its entirety.
- Such characteristic plots may enable a user to subjectively analyze a series of complex data sets in a visual display that may indicate the presence of selected sample components across the group of samples even in cases where the selected components have co-eluted from the physical separation processes prior to spectral analysis. While subjectively comparing deconstructed spectral plots to spectral characteristic plots may be useful for identifying the potential presence of more complex mixtures of components in a given type of biological sample, such subjective comparisons still do not provide quantitative information related to the relative amounts of particular components (such as metabolites, small molecule therapeutic agents, metabolized drugs, and xenobiotics, for example) that may be present in a particular sample.
- particular components such as metabolites, small molecule therapeutic agents, metabolized drugs, and xenobiotics, for example
- FA factor analysis
- PCA principal component analyses
- SVD singular value decomposition
- WO 03/081506 is disclosed a method of visualizing non-targeted metabolomics data generated from Fourier transform ion cyclotron resonance mass spectrometers.
- a system for analyzing spectral data received from an analytical device across a plurality of samples.
- the analytical device may further include any device that produces data that may be formatted into a 2-way table of samples for rows and measurements for columns.
- the analytical device may include, but is not limited to: a nuclear magnetic resonance imaging device; a spectrometry device (including for example, gas chromatography mass spectrometers (GC-MS) and liquid chromatography mass spectrometers (LC-MS)); and electrochemical array devices.
- the system comprises a database in communication with the analytical device for automatically receiving a data matrix corresponding to each of the plurality of samples.
- the data matrix includes a plurality of rows corresponding to each of the plurality of samples and a plurality of columns corresponding to a plurality of ions present in the samples. The columns also correspond to the plurality of ions that have eluted from each sample at a given point in time in the analytical device.
- the system also comprises a processor device in communication with the database for determining a characteristic value corresponding to at least one of a plurality of components present in the plurality of samples.
- the components comprise at least a portion of the plurality of ions present in the samples.
- the system also comprises a user interface in communication with the database and the processor device for displaying a visual indication of the characteristic value corresponding to at least one of a plurality of components across the plurality of samples.
- the processor device may be configured to be capable of performing a non-negative matrix factorization function and/or independent component analysis for determining the characteristic value.
- the processor device may perform a non-negative matrix factorization function and/or an independent component analysis to determine a characteristic value that may include, but is not limited to: a number of the plurality of components present in the plurality of samples; a relative concentration of at least one of the plurality of components present in each of the plurality of samples; and a spectra of at least one of the plurality of components, the spectra including an indication of at least a portion of the plurality of ions present in the at least one of the plurality of components.
- the processor device may also be configured to be capable of performing a correlation function for determining the characteristic value comprising a common spectrum of a particular component across the plurality of samples.
- the common spectrum includes a combination of at least a portion of the plurality of ions and may correspond to a substantially pure component (such as a particular metabolite of interest) present in the plurality of samples.
- the processor device may be further configured to be capable of comparing the spectrum of at least one of the plurality of components to a plurality of known spectra corresponding to a plurality of known components so as to screen the plurality of samples for a presence of the plurality of known components in the plurality of samples.
- the processor device may also be further configured to be capable of comparing the common spectrum corresponding to a substantially pure component to a plurality of known spectra corresponding to a plurality of known components so as to screen the plurality of samples for a presence of the plurality of known components in the plurality of samples.
- the system may also comprise a memory device in communication with the database for storing the plurality of known spectra.
- Some embodiments of the present invention also provide a method and/or computer program product for analyzing metabolomics data received from an analytical device across a plurality of samples.
- Such a method comprises automatically receiving a data matrix corresponding to each of the plurality of samples, wherein the data matrix includes a plurality of rows corresponding to each of the plurality of samples and a plurality of columns corresponding to a plurality of ions present in the samples.
- the method further comprises determining a characteristic value corresponding to at least one of a plurality of components present in the plurality of samples (wherein the components comprise at least a portion of the plurality of ions).
- the method further comprises a step for displaying a visual indication of the characteristic value corresponding to at least one of a plurality of components across the plurality of samples.
- the determining step comprises performing a non-negative matrix factorization (NNMF) function for determining the characteristic value.
- the determining step comprises performing an independent component analysis (ICA) for determining the characteristic value.
- the characteristic value determined via the determining step may include, but is not limited to: a number of the plurality of components present in the plurality of samples; a relative concentration of at least one of the plurality of components present in each of the plurality of samples; and a spectra of at least one of the plurality of components, wherein the spectra includes an indication of at least a portion of the plurality of ions present in the at least one of the plurality of components.
- the determining step may further comprise performing a correlation function for determining the characteristic value.
- the characteristic value may comprise a common spectra across the plurality of samples, wherein the common spectra includes a combination of at least a portion of the plurality of ions and wherein the common spectra corresponds to at least one of a substantially pure component present in the plurality of samples and imputed spectra of one or more pure components present in the plurality of samples.
- Various embodiments of the present invention may further comprise comparing the characteristic value (generated by the determining step) to a plurality of known spectra corresponding to a plurality of known components so as to screen the plurality of samples for a presence of the plurality of known components therein.
- the method may further comprise comparing the spectra of at least one of the plurality of components to a plurality of known spectra corresponding to a plurality of known components so as to screen the plurality of samples for a presence of the plurality of known components therein.
- the method may also further comprise comparing the common spectra corresponding to a substantially pure component to a plurality of known spectra corresponding to a plurality of known components so as to screen the plurality of samples for a presence of the plurality of known components therein.
- the systems, methods, and computer program products for compiling and comparing metabolomics data across a plurality of samples provide many advantages that may include, but are not limited to: providing a listing of substantially pure components and their spectra using spectrometry data from a plurality of samples, identifying target elution times or elution time intervals that may be used to partition a data matrix (defined by, for example, rows of samples and columns of ions) into submatrices wherein non-negative matrix factorization functions or independent component analysis factorization functions and/or correlation functions might be performed to determine one or more characteristic values corresponding to potentially masked and/or co-eluted components comprising one or more of the ions, and building a library of known spectra corresponding to various components that may be present in a variety of samples that may be compared to known spectra to identify the component (such as a specific metabolite).
- systems, methods, and computer program products of the present invention are described in conjunction with a mass spectrometer used to analyze metabolomic data, one skilled in the art will appreciate that such description is for exemplary purposes only. More particularly, the systems, methods, and computer program products of the present invention can be adapted to any number of processes that are used to generate complex sets of spectral data across a plurality of biological samples.
- embodiments of the present invention may be used with a variety of analytic devices and processes including, but not limited to: nuclear magnetic resonance imaging (NMR); gas chromatography-mass spectrometry (GC-MS); liquid chromatography-mass spectrometry (LC-MS); and electrochemical arrays (EC).
- NMR nuclear magnetic resonance imaging
- GC-MS gas chromatography-mass spectrometry
- LC-MS liquid chromatography-mass spectrometry
- EC electrochemical arrays
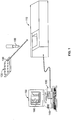
- Figure 1 illustrates an example of a system according to one embodiment of the present invention wherein the system is in communication with an analytical device such as a mass spectrometer 110.
- a biological sample 100 may be introduced at the top of a column of media within the spectrometer 110 and analyzed using mass spectrometric techniques that will be appreciated by those skilled in the art.
- the components of a particular biological sample 100 may pass through the column of the spectrometer at different elution rates and exhibit different spectral responses based upon their specific characteristics.
- the spectrometer 110 may generate a series of spectra corresponding to the ions eluted from each sample at a specific time during the separation process (such as liquid or gas chromatography).
- the spectrometer 110 may also generate a corresponding data matrix X (see Figure 3 , for example) wherein the rows of the matrix X correspond to each particular sample 210 and wherein the columns of the matrix X correspond to each particular ion 220 present in each sample 210. Furthermore, the values populating the matrix X comprise intensity values for each ion 220 present in each sample 210.
- alternate types of analytical devices may be used to generate spectra and the corresponding data matrix X based on an analysis of the series of biological samples 100.
- the analytical device may include, but is not limited to: nuclear magnetic resonance (NMR) imaging devices, liquid and/or gas chromatography-mass spectrometry devices (LG-MS and/or CG-MS), electrochemical array (EC) devices, and/or combinations of these devices.
- NMR nuclear magnetic resonance
- LG-MS and/or CG-MS liquid and/or gas chromatography-mass spectrometry devices
- EC electrochemical array
- a plurality of biological samples 100 may be taken individually from a well plate 120 and/or from other types of sample containers and introduced individually into the analytical device 110 for analysis and generation of the three-dimensional data set (see Figure 2a ).
- individual biological samples 100 may be transferred from a well plate 120 to the analytical device 110 via pipette, syringe, microfluidic passageways defined in a test array, and/or other systems for transferring biological samples in a laboratory environment.
- the biological samples may include, but are not limited to: blood samples, urine samples, cell cultures, saliva samples, and/or other types of biological samples in which the components (such as metabolites, for example) and/or chemical components of interest may be present.
- the system comprises a database (housed, for example in a memory device 140 ) in communication with a processor device 130 (such as a computer device, for example), which is further configured to be in communication with the analytical device 110 for automatically receiving a data matrix X (see Figures 3 and 4 ) corresponding to each of the plurality of samples 210.
- a data matrix X includes a plurality of rows corresponding to each of the plurality of samples 210 and a plurality of columns corresponding to a plurality of ions 220 present in the samples 210.
- the processor device 130 may be in communication with the analytical device 110 via wire (RS-232, and/or other types of wire connection) and/or wireless (such as, for example, RF, IR, or other wireless communication) techniques such that the database housed therein (and/or in communication therewith) may receive the data matrix X from the analytical device 110.
- the analytical device 110 may be in communication with one or more processor devices 130 (and associated user interfaces 150 ) via a wired and/or wireless computer network including, but not limited to: the internet, local area networks (LAN), wide area networks (WAN), or other networking types and/or techniques that will be appreciated by one skilled in the art.
- the database may be structured using commercially-available software, such as, for example, Oracle, Sybase, DB2, or other database software.
- the database (and/or processor device 130 housing said database) may be in further communication with a memory device 140 (such as a hard drive, memory chip, flash memory, RAM module, ROM module, and/or other memory device 140 ) for storing known spectra (for use in the comparing step 810 , shown for example, in the flow chart of Figure 8 ) and data matrices (such as, for example, matrix X automatically received from the analytical device 110 ).
- the memory device 140 may also be used to house other data received by the database and/or manipulated by the processor device 130.
- the memory device 14 0 may also be configured to store characteristic values determined by the processor device 13 0 of the present invention, such as, for example, the contents and structure of result matrices G and F (as shown in Figure 4 ), and the common spectra generated by the processor device when performing a correlation function across the plurality of samples 210 (see elements 410a, 410b, and 410c of Figure 5 ).
- the processor device 130 is capable of utilizing the data matrix X (see Figure 3 ) received by the database 130 to determine a characteristic value corresponding to at least one of a plurality of components present in the plurality of samples 210 wherein the components include some combination of at least a portion of the plurality of ions 220.
- embodiments of the present invention may also comprise a user interface 150 in communication with the database (and/or memory device 140 and the processor device 130 for displaying a visual indication (see, for example, the first and second result matrices, G and F , respectively, of Figure 4 ) of the characteristic value corresponding to at least one of a plurality of components across the plurality of samples 210 .
- the processor device 130 is configured to be capable of performing a factorization function (see generally, Figure 4 ) for determining the characteristic value.
- the factorization function performed by the processor device 130 may include, but is not limited to: non-negative matrix factorization (NNMF) (also called “positive matrix factorization” (PMF)); and/or independent component analysis (ICA) factorization.
- NNMF non-negative matrix factorization
- PMF positive matrix factorization
- ICA independent component analysis
- a survey of additional NNMF functions that may alternatively be performed by the processor device 130 , according to other embodiments of the present invention, is provided by Tropp ( see Tropp; Joel A., "Literature Survey: Non-negative matrix factorization,” (EE381K-14 Multidimensional Digital Signal Processing - Spring 2003 Projects), The University of Texas at Austin, (2003 ).), the contents of which are also incorporated herein by reference in their entirety.
- ICA functions may be used by the processor device 130 for performing the factorization.
- Exemplary ICA functions are described, for example, by Hyvärinen et al ( see Hyvärinen, A., Karhunen, J., and Oja, E., Independent Component Analysis, John Wiley & Sons (2001 ).), the contents of which are also incorporated herein by reference in their entirety.
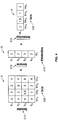
- the characteristic value determined by the factorization function may include, but is not limited to: a number of the plurality of components (such as, for example, metabolite compounds) present in the plurality of samples (as indicated by the number of columns 410 in the first result matrix G ); a relative concentration of at least one of the plurality of components present in each of the plurality of samples (for example, each column 410 of the first result matrix G generally indicates the relative concentration of each component 410 component in the samples 210 ); and a spectra (by individual ion 220 ) of at least one of the plurality of components 410 , the spectra including an indication of at least a portion of the plurality of ions 220 present in the at least one of the plurality of components 410 (as shown in the second result matrix F ).
- a number of the plurality of components such as, for example, metabolite compounds
- G and F represent the first and second result matrices (where G consists of n rows and k columns and where F consists of k rows and p columns).
- G consists of n rows and k columns and where F consists of k rows and p columns.
- k is typically less than p and that k may be determined, for example, from a Scree plot from a SVD of the input matrix X.
- An exemplary set of result matrices G, F (resulting from an exemplary data matrix X ) is shown, for example in Figure 4 .
- the resulting error estimates for each ion 220 may also be entered into an error matrix S.
- the processor device 130 is configured to be capable of calculating first and second result matrices G, F as a least squares solution which minimizes the error expressed as: ⁇ i , j X ⁇ GF i , j / S i , j 2 ; wherein the solution is further restricted in that every element of the result matrices G and F is required to be non-negative.
- G and F there are various other criteria that may also be optimized to determine G and F , as outlined, for example, by Lee and Seung. These constraints ensure that the processor device 130 generates characteristic values having positive basic components such that the spectra of components 410 within the samples may be reconstructed by the matrix multiplication of G and F. G may be used to estimate the relative concentrations of the substantially pure components with the samples and F reveals the ion sets and the relative intensities of the spectra of the substantially pure components, as described further herein.
- the result matrices G and F are not unique and may be modified and still reproduce X.
- Figure 4 shows a simplified set of result matrices G , F produced by the processor device 130 according to one example of a factorization function (specifically, NNMF and/or ICA).
- the sample set 210 contains only a single component 410 (indicated by the single column of result matrix G.
- result matrix G comprises a column vector with four rows corresponding to the four concentrations, one in each of the four samples 210 , (see Figure 3 , for example) generated by the analytical device 110 for four samples 210.
- result matrix F is a row vector with four columns corresponding to the ion intensities detected by the analytical device 110 for each of the four ions 220.
- the processor device 130 seeks to populate the result matrices G, F in order to approximate the data matrix X such that each row of X (corresponding to the various samples 210 in the analysis) should be approximately equal to F (which provides the intensities ("heights," for example) of the various ions 220 in the single component 410 present in the samples) multiplied by result matrix G (which provides an indication of a relative concentration of at least one of the plurality of components 410 present in each of the plurality of samples 210 ).
- the resulting "valley" shape in result matrix F is the weighted average of all ion spectra 220 in the single component 410 present.
- the processor device 130 may also be capable of performing an NNMF process with more complicated sets of samples such that the result matrix F is indicative of a larger number of components 410.
- every NNMF process performed by the processor device 130 may be considered as a sum of NNMF processes of rank one (i.e. the result matrix F includes additional rows indicating the presence of additional components 410 ).
- result matrix G may include additional columns to indicate characteristic values comprising the corresponding concentrations of each component in each of the plurality of samples 210.
- the factorization function is performed using ion spectra 220 across the plurality of samples 210 (as defined by matrix X ) at a particular elution time (where "elution time” refers to the time at which the particular ion spectra 220 are observed using the analytical device 110 ).
- the processor device 130 is further configured to repeat the performance of the factorization function described above for a number of elution times until the error function (see Equation (2), for example) is minimized for a particular combination of elution time, data matrix X (which will vary based on the elution time), and result matrices G, F.
- the repetition of the factorization function (as shown in Figure 4 ) across a broad range of elution times and for a large number of samples 210 may be expedited in some embodiments by selecting a specific elution time and/or a relatively narrow range of elution times over which the factorization function may be performed to determine the characteristic value or values.
- the processor device 130 is configured to be capable of correlating the plurality of ions 210 by the corresponding elution time to generate a data matrix (see data matrix X , for example) corresponding to each of the plurality of samples 210 at the particular elution time.
- the data matrix X may include a plurality of rows corresponding to each of the plurality of samples 210 and a plurality of columns corresponding to the plurality of ions 220 present in the respective samples 210.
- the ions 220 are first grouped by elution time to identify a starting point for the subsequent performance of a factorization function (see Equations (1) and (2), for example) by the processor device 130.
- Correlating the ions 210 by elution time may thus provide an initial estimation as to which ions 210 may be associated with one another as components of a component 410 of interest. This initial estimate may be used on its own or as an initial estimate for the result matrix G in the factorization function.
- a plurality of parallel processor devices 130 may be utilized to analyze the various matrices X that may correspond to a plurality of elution times and/or elution time ranges such that computation of the result matrices G and F may be expedited.
- the matrix X of ion spectra 220 versus sample 210 may be constructed and analyzed by the processor device 130 using a factorization function as described above, in order to determine a characteristic value based at least in part on the intensity of the portion of the plurality of ions 220.
- the characteristic value may correspond to at least one of a plurality of components 410 present in the plurality of samples 210, wherein the components 410 comprise at least two of the portion of the plurality of ions 220.
- the processor device 130 may also be configured to be capable of correlating ion spectra 210 (see Figure 2 , for example) at a specific elution time across a plurality of samples 220. In such embodiments, the processor device 130 may correlate the relative rise and fall of ion spectra across samples at a specific elution time.
- the processor device 130 may be configured to be capable of performing a correlation function for determining the characteristic value, wherein the characteristic value comprises a common spectra 410a, 410b, 410c across the plurality of samples 210.
- the common spectra 410a, 410b, 410c may include a combination of at least a portion of the plurality of ions 220 and corresponding to a component 410 present in the plurality of samples 210.
- the processor device may correlate the rise and fall of the intensity 230 of certain ions 220 across multiple samples 210.
- the processor device 130 may be configured to be capable of detecting common spectra (see element 410a, for example) that may be evident across a number of samples and presenting such a common spectrum 410a, as one of several characteristic values that may correspond to selected components 410 that may be present in the plurality of samples 210.
- the processor device may perform a correlation function across a plurality of samples that results in the identification of three separate common spectra 410a, 410b, 410c that may correspond, for example, to three distinct components 410 that may be present in the sample group.
- the common spectra 410a, 410b, 410c characteristic values generated by the processor device as part of the correlation function may be directly comparable to the result matrix F generated by the processor device 130 in embodiments wherein the processor device 130 performs a factorization function (as described generally above with respect to Figure 4 ).
- the processor device 130 may be further capable of comparing a characteristic value generated by a correlation function (such as a common spectrum 410a, for example) with a characteristic value generated by a factorization function (such as the result matrix F , as shown in Figure 4 ) because each of these characteristic value types is comparable as a spectrum of ions 220 making up a particular component 410 found within the sample 210 set.
- the processor device 130 may further be configured to be capable of comparing the spectra (as defined by, for example, the various rows of the result matrix F ) of at least one of the plurality of components 410 to a plurality of known spectra corresponding to a plurality of known components so as to screen the plurality of samples 210 for a presence of the plurality of known components in the plurality of samples 210.
- the processor device 130 may be further configured to be capable of comparing the common spectra (see element 410a of Figure 5 , for example) corresponding to a component 410 present in the plurality of samples 210 to a plurality of known spectra corresponding to a plurality of known components so as to screen the plurality of samples 210 for a presence of the plurality of known components in the plurality of samples 210.
- the processor device 130 may comprise and/or be configured to be in communication with a memory device 140 (such as a hard drive, memory chip, flash memory, RAM module, ROM module, and/or other memory device 140 ) for storing known spectra (for use in the comparing step 810 , shown in the flow chart of Figure 8 ) associated with known components.
- a memory device 140 such as a hard drive, memory chip, flash memory, RAM module, ROM module, and/or other memory device 140
- known spectra for use in the comparing step 810 , shown in the flow chart of Figure 8
- the processor device 130 may be capable, not only of determining the characteristic value (such as a spectra or result matrix, as described above), but also comparing the characteristic value to a known one of a plurality of known spectra stored in a library of known components in the memory device 140.
- embodiments of the present invention may be especially useful in identifying components 410 that may be obscured and/or not readily-detectable in a particular sample or group of samples 210 using subjective non-quantitative methods.
- some embodiments of the present invention may be used to identify a pattern of ions that are not present in an historical collection or existing library of ion patterns. The identification of such patterns may be suggestive of the presence of a compound that is unknown to the system of the present invention (such as a non-metabolite drug).
- the memory device 140 may also be configured to store characteristic values determined by the processor device 130 of the present invention, such as, for example, the contents and structure of result matrices G and F (as shown in Figure 4 ), and the common spectra generated by the processor device when performing a correlation function across the plurality of samples 210 (see elements 410a, 410b, and 410c of Figure 5 ).
- embodiments of the present invention may also be capable of storing characteristic values determined by the processor device 130 when performing, for example, the factorization and/or correlation functions described above in order to build a library of unknown components 410 (containing a plurality of ions 220 as shown in the result matrix F , for example) that may be associated with a particular disease state or other attribute associated with one or more of the plurality of samples 210.
- the system of the present invention comprises a user interface 150 in communication with said processor device 130 for displaying a visual indication of the characteristic value corresponding to at least one of a plurality of components 410 across the plurality of samples 210.
- the user interface 150 may be capable of displaying one or both the result matrices G, F produced by the processor device using a factorization function.
- the user interface 150 (in combination with the processor device 130 ) may be capable of converting the various rows of the result matrix F into a spectrum output of the ions 220 making up the various components 410 present in the plurality of samples 210.
- the user interface 150 may also be capable of displaying one or more of the common spectra (as a chart of intensity 230 versus ion 220 , for example) generated by the processor device when performing a correlation function across the plurality of samples 210 (see elements 410a , 410b , and 410c of Figure 5 ).
- the user interface 150 may comprise a display device, personal computer, and/or other electronic device having a display for graphical representation of various types of data including, but not limited to, the characteristic values determined by the processor device 130 of the embodiments described herein.
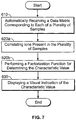
- embodiments of the present invention also include methods for analyzing metabolomics data received from an analytical device 110 across a plurality of samples 210 (see Figure 2 , for example).
- the method comprises a step 610 of automatically receiving a data matrix X corresponding to each of the plurality of samples 210.
- the data matrix X includes a plurality of rows corresponding to each of the plurality of samples 210 and a plurality of columns corresponding to a plurality of ions 220 present in the respective samples 210.
- the embodiment of Figure 6 further comprises a step 620 for determining a characteristic value (which may comprise, for example a relative intensity, concentration, and/or identity of a component 410 and/or ion component 220 of such a component 410 , as discussed further below) corresponding to at least one of a plurality of components 410 present in the plurality of samples 210 , wherein the components comprise at least a portion of the plurality of ions 220.
- the embodiment shown in Figure 6 further comprises a step 630 for displaying a visual indication of the characteristic value corresponding to at least one of a plurality of components 410 across the plurality of samples 210.
- the step 620 for determining the characteristic value may comprise performing a factorization function (such as, for example, a NNMF function as defined by Equations (1) and (2) and/or an ICA function) for determining the characteristic value.
- a factorization function such as, for example, a NNMF function as defined by Equations (1) and (2) and/or an ICA function
- the factorization function performed in the characteristic value determining step 620 may include, but is not limited to: non-negative matrix factorizations (NNMF), positive matrix factorizations (PMF), independent component analysis (ICA), and/or combinations of such factorization functions.
- the characteristic value generated in the characteristic value determining step 620 may comprise a number of the plurality of components 410 present in the plurality of samples 210.
- the number of the plurality of components 410 present in the plurality of samples 210 may be displayed in the displaying step 630 , for example, as a number of rows in result matrix F (shown in Figure 4 ).
- the number of the plurality of components 410 present in the plurality of samples 210 is also generated as a product of such a factorization function and is discernible as the number of columns in result matrix G (as shown in Figure 4 , which depicts a relatively simple single-component characteristic value).
- the characteristic value generated in the characteristic value determining step 620 may comprise a relative concentration of at least one of the plurality of components 410 present in each of the plurality of samples (as shown, for example in the result matrix G that may be generated using a factorization function as defined above by Equations (1) and (2)).
- the result matrix G (as shown, for example in Figure 4 ), generated in the characteristic value determining step 620 according to some embodiments of the present invention, comprises a two-dimensional matrix including rows corresponding to the plurality of samples 210 under investigation and columns corresponding to the concentration of each of the plurality of components 410 present in the plurality of samples 210.
- the characteristic value generated in the characteristic value determining step 620 may also comprise a spectra of at least one of the plurality of components 410 , the spectra including an indication of at least a portion of the plurality of ions 220 present in the at least one of the plurality of components 410.
- the numerical elements of the result matrix F represent the intensity spectrum of the single component 410 present in the depicted example. The relative numerical elements in matrix F may thus be plotted to generate a spectra of at least one of the plurality of components 410 present in the plurality of samples 210.
- the characteristic value determining step 620 may also comprise performing a correlation function for determining the characteristic value.
- the characteristic value comprises a common spectra (see, for example, elements 410a, 410b, 410c of Figure 5 ) across the plurality of samples 210.
- at least one of the common spectra 410a, 410b, 410c generated by the performance of a correlation function in the characteristic value determining step 620 may correspond to the rows of result matrix F generated by embodiments of the present invention wherein the characteristic value determining step 620 comprises the performance of a factorization function.
- various embodiments of the present invention may be used together in order to cross-check and/or ensure the accuracy of the characteristic value determining step 620.
- the common spectra 410a, 410b, 410c generated by the performance of a correlation function may be compared directly to the result matrix F generated by the performance of a factorization function to ensure that all of relevant characteristic values corresponding to a plurality of components 410 present in the plurality of samples 210 are revealed and displayed (step 630 ) to a user of the systems and methods of the present invention.
- utilizing a factorization function (as defined by Equations (1) and (2) discussed above, for example) to determine the characteristic value as part of the characteristic value determining step 620 may be further optimized by utilizing a correlation function to select particular elution times and/or elution time intervals during which the factorization function should be applied.
- a correlation function to select particular elution times and/or elution time intervals during which the factorization function should be applied.
- embodiments of the present invention may comprise a step 610a for automatically receiving a data set.
- the data set may be more complex that the generally two-dimensional data matrix X received in the receiving step 610 (shown in Figure 6 ) in that the data set may also include elution time information and intensity information corresponding to at least a portion of the plurality of ions 220 across the plurality of samples 210.
- some method embodiments of the present invention may comprise a step 620a for correlating the plurality of ions in the data set by the corresponding elution time to generate a data matrix (see, for example, element X shown in Figure 3 ) corresponding to each of the plurality of samples 210 at the elution time.
- the resulting data matrix X therefore includes a plurality of rows corresponding to each of the plurality of samples 210 and a plurality of columns corresponding to the plurality of ions 220 present in the respective samples 210.
- a step 620b may be performed, comprising performing a factorization function on the data matrix X for determining a characteristic value based at least in part on the intensity of the portion of the plurality of ions 210.
- the characteristic value may correspond to at least one of a plurality of components 410 present in the plurality of samples 210 , wherein the components comprise at least two of the portion of the plurality of ions 220.
- such a method may also further comprise a step 630 for displaying a visual indication of the characteristic value corresponding to at least one of the plurality of components 410 across the plurality of samples 210.
- embodiments of the present invention may further comprise a step 810 for comparing the spectra of at least one of the plurality of components 410 (as discernible, for example from result matrix F and/or from the common spectra 410a, 410b, 410c generated by a correlation function) to a plurality of known spectra corresponding to a plurality of known components so as to screen the plurality of samples 210 for a presence of the plurality of known components in the plurality of samples 210.
- embodiments of the present invention also include associated computer program products for performing the operations described herein.
- the computer program products have a computer readable storage medium with computer readable program code embodied in the medium.
- the computer readable storage medium may be part of the memory device 140 , and may implement the computer readable program code to perform the above discussed operations.
- Figures 6-8 are block diagram illustration of certain methods, systems and computer program products according to some embodiments of the present invention. It will be understood that each block or step of the block diagram and combinations of blocks in the block diagram can be implemented by computer program instructions. These computer program instructions may be loaded onto a computer or other programmable apparatus to produce a machine, such that the instructions which execute on the computer or other programmable apparatus implement the functions specified in the block diagram, flowchart or control flow block(s) or step(s).
- These computer program instructions may also be stored in a computer-readable memory that can direct a computer or other programmable apparatus to function in a particular manner, such that the instructions stored in the computer-readable memory produce an article of manufacture including instructions which implement the function specified in the block diagram, flowchart or control flow block(s) or step(s).
- the computer program instructions may also be loaded onto a computer or other programmable apparatus to cause a series of operational steps to be performed on the computer or other programmable apparatus to produce a computer implemented process such that the instructions which execute on the computer or other programmable apparatus provide steps for implementing the functions specified in the block diagram, flowchart or control flow block(s) or step(s).
- blocks or steps of the block diagram, flowchart or control flow illustrations support combinations for performing the specified functions, combinations of steps for performing the specified functions, and program instructions for performing the specified functions. It will also be understood that each block or step of the block diagram, flowchart or control flow illustrations, and combinations of blocks or steps in the block diagram, flowchart or control flow illustrations, can be implemented by special purpose hardware-based computer systems which perform the specified functions or steps, or combinations of special purpose hardware and computer instructions.
Landscapes
- Engineering & Computer Science (AREA)
- Physics & Mathematics (AREA)
- Chemical & Material Sciences (AREA)
- Life Sciences & Earth Sciences (AREA)
- Theoretical Computer Science (AREA)
- General Health & Medical Sciences (AREA)
- Computer Vision & Pattern Recognition (AREA)
- Bioinformatics & Computational Biology (AREA)
- Analytical Chemistry (AREA)
- Bioinformatics & Cheminformatics (AREA)
- Health & Medical Sciences (AREA)
- General Physics & Mathematics (AREA)
- Data Mining & Analysis (AREA)
- Evolutionary Biology (AREA)
- Immunology (AREA)
- Crystallography & Structural Chemistry (AREA)
- Computing Systems (AREA)
- Library & Information Science (AREA)
- General Engineering & Computer Science (AREA)
- Artificial Intelligence (AREA)
- Evolutionary Computation (AREA)
- Spectroscopy & Molecular Physics (AREA)
- Biochemistry (AREA)
- Pathology (AREA)
- Epidemiology (AREA)
- Medical Informatics (AREA)
- Primary Health Care (AREA)
- Public Health (AREA)
- Other Investigation Or Analysis Of Materials By Electrical Means (AREA)
Claims (22)
- Système destiné à analyser des données reçues en provenance d'un dispositif d'analyse à travers une pluralité d'échantillons, le système comprenant :une base de données en communication avec le dispositif d'analyse pour recevoir automatiquement une matrice de données X correspondant à chaque échantillon de la pluralité d'échantillons (210), chacun des échantillons présentant des composants et chacun des composants contenant des ions, la matrice de données X incluant une pluralité de lignes correspondant chacune à l'un des échantillons (210) et une pluralité de colonnes correspondant chacune à l'un des ions (220) présents dans les échantillons respectifs (210), à un temps d'élution particulier ;un dispositif de processeur (130) en communication avec ladite base de données, le dispositif de processeur (130) étant configuré de manière à :mettre en oeuvre une factorisation pour la matrice de données X en utilisant un groupement, selon un temps d'élution, d'ions associés à un composant d'intérêt (410) dans les échantillons pour former une estimation initiale d'une concentration relative du composant d'intérêt (410) à travers les échantillons pour une matrice résultante G, en corrélant chacun des ions par son temps d'élution correspondant, la matrice résultante G incluant des concentrations relatives du composant d'intérêt (410) dans chacun des échantillons, pour déterminer une matrice résultante F à partir de la relation X = GF, où la matrice résultante F inclut une intensité d'ions (220) dans le groupement d'ions associés au composant d'intérêt (410), dans lequel chaque composant d'intérêt (410) représente un métabolite non identifié présentant l'un des ions (220) présents dans les échantillons (210) ;multiplier la matrice résultante G par la matrice résultante F ;déterminer une estimation d'erreur E en tant qu'une différence entre la matrice de données X et les matrices résultantes multipliées G et F dans les quantités d'ions individuels (220), en utilisant ladite factorisation ; etrépéter la factorisation pour une autre matrice de données à un temps d'élution différent, jusqu'à ce que l'estimation d'erreur E soit minimisée, dans lequel la matrice résultante F, à l'estimation minimale d'erreur E, inclut les ions (220) dans le composant d'intérêt (410) à travers les échantillons (210) ; etune interface d'utilisateur (150) en communication avec ladite base de données et ledit dispositif de processeur (130), l'interface d'utilisateur (150) étant configurée de manière à afficher une indication visuelle du métabolite non identifié correspondant au composant d'intérêt (410) présent à travers les échantillons (210).
- Système selon la revendication 1, dans lequel la factorisation comprend une factorisation matricielle non négative.
- Système selon la revendication 1, dans lequel la factorisation comprend une factorisation d'analyse de composants indépendante.
- Système selon la revendication 1, dans lequel le dispositif de processeur est en outre configuré de manière à être en mesure de déterminer une valeur caractéristique à partir de la factorisation, dans lequel la valeur caractéristique est sélectionnée à partir du groupe constitué par :un nombre de la pluralité de métabolites non identifiés présents dans la pluralité d'échantillons ;une concentration relative d'au moins un métabolite de la pluralité de métabolites non identifiés présents dans chaque échantillon de la pluralité d'échantillons ; etun spectre d'au moins un métabolite de la pluralité de métabolites non identifiés, le spectre incluant une indication d'au moins une partie de la pluralité d'ions présents dans ledit au moins un métabolite de la pluralité de métabolites non identifiés.
- Système selon la revendication 4, dans lequel le dispositif de processeur est configuré de manière à être en mesure de mettre en oeuvre une fonction de corrélation pour déterminer la valeur caractéristique, et dans lequel la valeur caractéristique comprend un spectre commun à travers la pluralité d'échantillons, le spectre commun incluant une combinaison d'au moins une partie de la pluralité d'ions et correspondant à au moins un métabolite de la pluralité de métabolites non identifiés présents de la pluralité d'échantillons.
- Système selon la revendication 5, dans lequel le dispositif de processeur est en outre configuré de manière à être en mesure de comparer le spectre commun correspondant audit au moins un métabolite de la pluralité de métabolites non identifiés présents dans la pluralité d'échantillons, à une pluralité de spectres connus correspondant à une pluralité de métabolites connus, de manière à examiner la pluralité d'échantillons en vue de rechercher une présence d'un quelconque métabolite de la pluralité de métabolites connus dans la pluralité d'échantillons.
- Système selon la revendication 4, dans lequel le dispositif de processeur est en outre configuré de manière à être en mesure de comparer le spectre d'au moins un métabolite de la pluralité de métabolites non identifiés à une pluralité de spectres connus correspondant à une pluralité de métabolites connus, de manière à examiner la pluralité d'échantillons en vue de rechercher une présence de la pluralité de métabolites connus dans la pluralité d'échantillons.
- Système selon la revendication 6 ou 7, comprenant en outre un dispositif de mémoire en communication avec ladite base de données en vue de stocker la pluralité de spectres connus.
- Système selon la revendication 1, dans lequel le dispositif d'analyse correspond à au moins l'un parmi :un dispositif d'imagerie par résonance magnétique nucléaire ;un dispositif de spectrométrie ;un dispositif de réseau électrochimique ; etdes combinaisons de ceux-ci.
- Système selon la revendication 1, dans lequel la matrice de données fait partie d'un ensemble de données reçu automatiquement par la base de données, l'ensemble de données étant indicatif de la présence d'une pluralité d'ions dans les échantillons, et comprenant un temps d'élution et une intensité correspondant à au moins une partie de la pluralité d'ions à travers la pluralité d'échantillons.
- Système selon la revendication 10, dans lequel le dispositif de processeur est en outre configuré de manière à corréler la pluralité d'ions dans l'ensemble de données selon le temps d'élution correspondant, en vue de générer la matrice de données, dans lequel la matrice de données représente la pluralité d'échantillons au temps d'élution, de sorte que la matrice de données inclut la pluralité de lignes correspondant chacune à un échantillon de la pluralité d'échantillons et la pluralité de colonnes correspondant chacune à un ion de la pluralité d'ions présents dans les échantillons respectifs.
- Système selon la revendication 11, dans lequel le dispositif de processeur est en outre configuré de manière à mettre en oeuvre une factorisation sur la matrice de données en vue de déterminer une partie de la pluralité d'ions comprenant un composant d'une pluralité de composants de la pluralité d'échantillons, sur la base, au moins en partie, de l'intensité de la partie de la pluralité d'ions, où chaque composant comprend au moins deux ions de la partie de la pluralité d'ions.
- Procédé d'analyse de données reçues en provenance d'un dispositif d'analyse à travers une pluralité d'échantillons, le procédé comprenant les étapes ci-dessous consistant à :recevoir automatiquement une matrice de données X correspondant à chaque échantillon de la pluralité d'échantillons (210), chacun des échantillons présentant des composants et chacun des composants contenant des ions, la matrice de données X incluant une pluralité de lignes correspondant chacune à l'un des échantillons (210) et une pluralité de colonnes correspondant chacune à l'un des ions (220) présents dans les échantillons respectifs (210), à un temps d'élution particulier;mettre en oeuvre une factorisation pour la matrice de données X en utilisant un groupement, selon un temps d'élution, d'ions associés à un composant d'intérêt (410) dans les échantillons pour former une estimation initiale d'une concentration relative du composant d'intérêt (410) à travers les échantillons pour une matrice résultante G, en corrélant chacun des ions par son temps d'élution correspondant, la matrice résultante G incluant des concentrations relatives du composant d'intérêt (410) dans chacun des échantillons, pour déterminer une matrice résultante F à partir de la relation X = GF, où la matrice résultante F inclut une intensité d'ions (220) dans le groupement d'ions associés au composant d'intérêt (410), dans lequel chaque composant d'intérêt (410) représente un métabolite non identifié présentant l'un des ions (220) présents dans les échantillons (210) ;multiplier la matrice résultante G par la matrice résultante déterminée F ;déterminer une estimation d'erreur E en tant qu'une différence entre la matrice de données X et les matrices résultantes multipliées G et F dans les quantités d'ions individuels (220), en utilisant ladite factorisation ; etrépéter la factorisation pour une autre matrice de données à un temps d'élution différent, jusqu'à ce que l'estimation d'erreur E soit minimisée, dans lequel la matrice résultante F, à l'estimation minimale d'erreur E, inclut les ions (220) dans le composant d'intérêt (410) à travers les échantillons (210) ; etafficher une indication visuelle du métabolite non identifié correspondant au composant d'intérêt (410) présent à travers les échantillons (210).
- Procédé selon la revendication 13, dans lequel l'étape de mise en oeuvre d'une factorisation consiste en outre à mettre en oeuvre une factorisation matricielle non négative.
- Procédé selon la revendication 13, dans lequel l'étape de mise en oeuvre d'une factorisation consiste en outre à mettre en oeuvre une factorisation d'analyse de composants indépendante.
- Procédé selon la revendication 13, comprenant en outre l'étape consistant à déterminer une valeur caractéristique à partir de la factorisation, dans lequel la valeur caractéristique est sélectionnée à partir du groupe constitué par :un nombre de la pluralité de métabolites non identifiés présents dans la pluralité d'échantillons ;une concentration relative d'au moins un métabolite de la pluralité de métabolites non identifiés présents dans chaque échantillon de la pluralité d'échantillons ; etun spectre d'au moins un métabolite de la pluralité de métabolites non identifiés, le spectre incluant une indication d'au moins une partie de la pluralité d'ions présents dans ledit au moins un métabolite de la pluralité de métabolites non identifiés.
- Procédé selon la revendication 16, dans lequel l'étape de détermination comprend en outre l'étape consistant à mettre en oeuvre une fonction de corrélation pour déterminer la valeur caractéristique, et dans lequel la valeur caractéristique comprend un spectre commun à travers la pluralité d'échantillons, le spectre commun incluant une combinaison d'au moins une partie de la pluralité d'ions et correspondant à au moins un métabolite de la pluralité de métabolites non identifiés présents de la pluralité d'échantillons.
- Procédé selon la revendication 17, comprenant en outre l'étape consistant à comparer le spectre commun correspondant audit au moins un métabolite de la pluralité de métabolites non identifiés présents dans la pluralité d'échantillons, à une pluralité de spectres connus correspondant à une pluralité de métabolites connus, de manière à examiner la pluralité d'échantillons en vue de rechercher une présence d'un quelconque métabolite de la pluralité de métabolites connus dans la pluralité d'échantillons.
- Procédé selon la revendication 16, comprenant en outre l'étape consistant à comparer le spectre d'au moins un métabolite de la pluralité de métabolites non identifiés à une pluralité de spectres connus correspondant à une pluralité de métabolites connus, de manière à examiner la pluralité d'échantillons en vue de rechercher une présence de la pluralité de métabolites connus dans la pluralité d'échantillons.
- Procédé selon la revendication 13, dans lequel la matrice de données fait partie d'un ensemble de données, et dans lequel l'étape de réception automatique consiste en outre à recevoir automatiquement l'ensemble de données, l'ensemble de données étant indicatif de la présence d'une pluralité d'ions dans les échantillons, et incluant un temps d'élution et une intensité correspondant à au moins une partie de la pluralité d'ions à travers la pluralité d'échantillons.
- Procédé selon la revendication 20, comprenant en outre l'étape consistant à corréler la pluralité d'ions dans l'ensemble de données selon le temps d'élution correspondant, en vue de générer la matrice de données, dans lequel la matrice de données représente la pluralité d'échantillons au temps d'élution, de sorte que la matrice de données inclut la pluralité de lignes correspondant chacune à un échantillon de la pluralité d'échantillons et la pluralité de colonnes correspondant chacune à un ion de la pluralité d'ions présents dans les échantillons respectifs.
- Procédé selon la revendication 21, dans lequel l'étape de mise en oeuvre d'une factorisation sur la matrice de données consiste en outre à mettre en oeuvre une factorisation sur la matrice de données en vue de déterminer une partie de la pluralité d'ions comprenant un composant d'une pluralité de composants de la pluralité d'échantillons, sur la base, au moins en partie, de l'intensité de la partie de la pluralité d'ions, où chaque composant comprend au moins deux ions de la partie de la pluralité d'ions.
Applications Claiming Priority (2)
| Application Number | Priority Date | Filing Date | Title |
|---|---|---|---|
| US78429606P | 2006-03-21 | 2006-03-21 | |
| PCT/US2007/064385 WO2007109659A2 (fr) | 2006-03-21 | 2007-03-20 | Système, procédé et programme informatique d'analyse de données spectrométriques pour identifier et quantifier des composants individuels dans un échantillon |
Publications (2)
| Publication Number | Publication Date |
|---|---|
| EP1997049A2 EP1997049A2 (fr) | 2008-12-03 |
| EP1997049B1 true EP1997049B1 (fr) | 2019-03-13 |
Family
ID=38372312
Family Applications (1)
| Application Number | Title | Priority Date | Filing Date |
|---|---|---|---|
| EP07758894.5A Active EP1997049B1 (fr) | 2006-03-21 | 2007-03-20 | Système, procédé et programme informatique d'analyse de données spectrométriques pour identifier et quantifier des composants individuels dans un échantillon |
Country Status (5)
| Country | Link |
|---|---|
| US (1) | US7561975B2 (fr) |
| EP (1) | EP1997049B1 (fr) |
| JP (1) | JP5496650B2 (fr) |
| CA (1) | CA2646890C (fr) |
| WO (1) | WO2007109659A2 (fr) |
Families Citing this family (22)
| Publication number | Priority date | Publication date | Assignee | Title |
|---|---|---|---|---|
| US7981399B2 (en) | 2006-01-09 | 2011-07-19 | Mcgill University | Method to determine state of a cell exchanging metabolites with a fluid medium by analyzing the metabolites in the fluid medium |
| US8948488B2 (en) * | 2009-07-31 | 2015-02-03 | General Electric Company | Methods and systems for digitally enhancing an image of a stained material |
| CN102667789A (zh) | 2009-10-02 | 2012-09-12 | 梅塔博隆有限公司 | 用于分析复杂混合物中小分子成分的设备和相关方法 |
| US20130204582A1 (en) * | 2010-05-17 | 2013-08-08 | Dh Technologies Development Pte. Ltd | Systems and Methods for Feature Detection in Mass Spectrometry Using Singular Spectrum Analysis |
| JP5742749B2 (ja) * | 2012-02-23 | 2015-07-01 | 株式会社島津製作所 | クロマトグラフ用データ処理装置及びデータ処理方法 |
| US10860683B2 (en) | 2012-10-25 | 2020-12-08 | The Research Foundation For The State University Of New York | Pattern change discovery between high dimensional data sets |
| MX2016000293A (es) | 2013-07-09 | 2016-06-21 | Stemina Biomarker Discovery Inc | Biomarcadores del trastrono del espectro autista. |
| WO2015123615A1 (fr) * | 2014-02-13 | 2015-08-20 | Brewmetrix, Inc. | Système analytique avec procédé itératif d'analyse de données dans un processeur de données basé sur le web avec affichage des résultats conçu pour des non-experts |
| CN106537145B (zh) | 2014-04-08 | 2020-08-25 | 麦特博隆股份有限公司 | 用于疾病诊断和健康评估的个体受试者的小分子生物化学特征分析 |
| US9892895B2 (en) | 2014-05-30 | 2018-02-13 | Metabolon, Inc. | Method for analyzing small molecule components of a complex mixture in a multi-sample process, and associated apparatus and computer program product |
| US20170370954A1 (en) | 2014-11-19 | 2017-12-28 | Metabolon, Inc. | Biomarkers for Fatty Liver Disease and Methods Using the Same |
| US9646139B1 (en) | 2014-12-08 | 2017-05-09 | Hongjie Zhu | Chemical structure-informed metabolomics data analysis |
| CN104713971B (zh) * | 2015-04-01 | 2017-03-29 | 山东省肿瘤医院 | 一种利用食管癌初步筛查用血清代谢组学分析模型分析血清代谢组学的方法 |
| US10890592B2 (en) | 2015-11-04 | 2021-01-12 | Metabolon, Inc. | Automated sample quality assessment |
| US10380222B2 (en) | 2016-10-17 | 2019-08-13 | International Business Machines Corporation | Matrix factorization with two-stage data block dispatch associated with graphics processing units |
| EP3561702A1 (fr) * | 2018-04-23 | 2019-10-30 | Covestro Deutschland AG | Procédé de détermination d'une composition de produit pour un produit mélangé chimique |
| DE102018216637A1 (de) * | 2018-09-27 | 2019-09-12 | Carl Zeiss Smt Gmbh | Verfahren zur Faktor-Analyse bei der spektrometrischen Untersuchung einer Probe |
| JP2022534468A (ja) | 2019-05-31 | 2022-08-01 | ディーエイチ テクノロジーズ デベロップメント プライベート リミテッド | 走査型swathデータのリアルタイムエンコーディングおよび前駆体推測のための確率的フレームワークのための方法 |
| JP7460988B2 (ja) * | 2021-01-22 | 2024-04-03 | 株式会社島津製作所 | クロマトグラフ質量分析装置 |
| JP7628731B2 (ja) * | 2021-06-24 | 2025-02-12 | 国立研究開発法人物質・材料研究機構 | 検体に含まれる成分の含有量比の推定方法、組成推定装置、及び、プログラム |
| US12100484B2 (en) | 2021-11-01 | 2024-09-24 | Matterworks Inc | Methods and compositions for analyte quantification |
| US20230137741A1 (en) | 2021-11-01 | 2023-05-04 | Matterworks Inc | Methods and compositions for analyte quantification |
Family Cites Families (14)
| Publication number | Priority date | Publication date | Assignee | Title |
|---|---|---|---|---|
| WO2001078652A2 (fr) * | 2000-04-14 | 2001-10-25 | Metabolon, Inc. | Procedes permettant de decouvrir des medicaments, de traiter des maladies et de poser des diagnostics a l'aide de la metabolomique |
| US6996472B2 (en) * | 2000-10-10 | 2006-02-07 | The United States Of America As Represented By The Department Of Health And Human Services | Drift compensation method for fingerprint spectra |
| WO2002086478A2 (fr) * | 2001-04-23 | 2002-10-31 | Metabometrix Limited | Procedes d'analyse de donnees spectrales et leurs applications |
| US6584413B1 (en) * | 2001-06-01 | 2003-06-24 | Sandia Corporation | Apparatus and system for multivariate spectral analysis |
| US6675106B1 (en) * | 2001-06-01 | 2004-01-06 | Sandia Corporation | Method of multivariate spectral analysis |
| US7668697B2 (en) * | 2006-02-06 | 2010-02-23 | Andrei Volkov | Method for analyzing dynamic detectable events at the single molecule level |
| NZ534751A (en) * | 2002-03-22 | 2007-05-31 | Phenomenome Discoveries Inc | Method of visualizing non-targeted metabolomic data generated from fourier transform ion cyclotron resonance mass spectrometers |
| DE10392707B4 (de) * | 2002-05-31 | 2012-08-16 | Waters Technologies Corp. (N.D.Ges.D. Staates Delaware) | Verfahren zur Verwendung von Datenbinning bei der Analyse von Chromatographie-/Spektrometriedaten |
| JP4160558B2 (ja) * | 2002-08-22 | 2008-10-01 | アプレラ コーポレイション | 結果主導型ストラテジーを利用して生体分子を特徴付けるための方法 |
| DK1571970T3 (da) * | 2002-10-02 | 2011-11-28 | Dmi Biosciences Inc | Diagnose og monitorering af sygdomme |
| US7457708B2 (en) * | 2003-03-13 | 2008-11-25 | Agilent Technologies Inc | Methods and devices for identifying related ions from chromatographic mass spectral datasets containing overlapping components |
| ATE554458T1 (de) * | 2003-04-28 | 2012-05-15 | Cerno Bioscience Llc | Rechnerisches verfahren und system für die massenspektralanalyse |
| US7016219B1 (en) * | 2003-12-16 | 2006-03-21 | Xilinx, Inc. | Single transistor non-volatile memory system, design, and operation |
| US7433787B2 (en) * | 2005-08-08 | 2008-10-07 | Metabolon, Inc. | System, method, and computer program product using a database in a computing system to compile and compare metabolomic data obtained from a plurality of samples |
-
2007
- 2007-03-20 EP EP07758894.5A patent/EP1997049B1/fr active Active
- 2007-03-20 WO PCT/US2007/064385 patent/WO2007109659A2/fr not_active Ceased
- 2007-03-20 JP JP2009501695A patent/JP5496650B2/ja active Active
- 2007-03-20 CA CA2646890A patent/CA2646890C/fr active Active
- 2007-03-20 US US11/688,526 patent/US7561975B2/en active Active
Non-Patent Citations (1)
| Title |
|---|
| None * |
Also Published As
| Publication number | Publication date |
|---|---|
| CA2646890A1 (fr) | 2007-09-27 |
| WO2007109659A3 (fr) | 2007-11-08 |
| JP5496650B2 (ja) | 2014-05-21 |
| EP1997049A2 (fr) | 2008-12-03 |
| US7561975B2 (en) | 2009-07-14 |
| WO2007109659A2 (fr) | 2007-09-27 |
| CA2646890C (fr) | 2012-07-31 |
| US20070288174A1 (en) | 2007-12-13 |
| JP2009530648A (ja) | 2009-08-27 |
Similar Documents
| Publication | Publication Date | Title |
|---|---|---|
| CA2646890C (fr) | Systeme, procede et programme informatique d'analyse de donnees spectrometriques pour identifier et quantifier des composants individuels dans un echantillon | |
| Yu et al. | Isobaric matching between runs and novel PSM-level normalization in MaxQuant strongly improve reporter ion-based quantification | |
| Li et al. | Predicting network activity from high throughput metabolomics | |
| Spitzer et al. | Mass cytometry: single cells, many features | |
| Sumner et al. | Plant metabolomics: large-scale phytochemistry in the functional genomics era | |
| Delaney | Chemometrics | |
| Athersuch | Metabolome analyses in exposome studies: profiling methods for a vast chemical space | |
| CN113056672A (zh) | 信息处理装置、信息处理装置的控制方法、程序、计算装置和计算方法 | |
| Percival et al. | Univariate and multivariate statistical approaches to the analysis and interpretation of NMR-based metabolomics datasets of increasing complexity | |
| Fillet et al. | The emergence of metabolomics as a key discipline in the drug discovery process | |
| Korman et al. | Statistical methods in metabolomics | |
| WO2004106915A1 (fr) | Systeme et procede de traitement oriente metabonomique de donnees lc-ms ou lc-ms/ms | |
| Kalia et al. | Unsupervised dimensionality reduction for exposome research | |
| Barnes | Overview of experimental methods and study design in metabolomics, and statistical and pathway considerations | |
| CA2618123C (fr) | Systeme, procede et produit programme informatique utilisant une base de donnees dans un systeme informatique pour compiler et comparer des donnees metabolomiques obtenues a partir d'une pluralite d'echantillons | |
| Gahlaut et al. | Proteomics & metabolomics: Mapping biochemical regulations | |
| Yesiltepe et al. | An initial investigation of accuracy required for the identification of small molecules in complex samples using quantum chemical calculated NMR chemical shifts | |
| US10937525B2 (en) | System that generates pharmacokinetic analyses of oligonucleotide total effects from full-scan mass spectra | |
| Brereton | Data analysis and chemometrics for metabolomics | |
| Robinson et al. | Origins of metabolic profiling | |
| EP2684150B1 (fr) | Procédé permettant une comparaison robuste de données | |
| Ebbels et al. | Statistical methods in metabolomics | |
| JP7821887B2 (ja) | 高次元分析における検査回数を低減させるシステム及び方法 | |
| Sahu et al. | 3 Metabolic Computing | |
| Mattsson | Analysis of LC-MS data in untargeted nutritional metabolomics |
Legal Events
| Date | Code | Title | Description |
|---|---|---|---|
| PUAI | Public reference made under article 153(3) epc to a published international application that has entered the european phase |
Free format text: ORIGINAL CODE: 0009012 |
|
| 17P | Request for examination filed |
Effective date: 20080918 |
|
| AK | Designated contracting states |
Kind code of ref document: A2 Designated state(s): AT BE BG CH CY CZ DE DK EE ES FI FR GB GR HU IE IS IT LI LT LU LV MC MT NL PL PT RO SE SI SK TR |
|
| DAX | Request for extension of the european patent (deleted) | ||
| 17Q | First examination report despatched |
Effective date: 20160211 |
|
| REG | Reference to a national code |
Ref country code: DE Ref legal event code: R079 Ref document number: 602007057831 Country of ref document: DE Free format text: PREVIOUS MAIN CLASS: G06F0019000000 Ipc: G16H0010400000 |
|
| GRAP | Despatch of communication of intention to grant a patent |
Free format text: ORIGINAL CODE: EPIDOSNIGR1 |
|
| STAA | Information on the status of an ep patent application or granted ep patent |
Free format text: STATUS: GRANT OF PATENT IS INTENDED |
|
| RIC1 | Information provided on ipc code assigned before grant |
Ipc: G16H 10/40 20180101AFI20180919BHEP |
|
| INTG | Intention to grant announced |
Effective date: 20181024 |
|
| GRAS | Grant fee paid |
Free format text: ORIGINAL CODE: EPIDOSNIGR3 |
|
| GRAA | (expected) grant |
Free format text: ORIGINAL CODE: 0009210 |
|
| STAA | Information on the status of an ep patent application or granted ep patent |
Free format text: STATUS: THE PATENT HAS BEEN GRANTED |
|
| RIC1 | Information provided on ipc code assigned before grant |
Ipc: G16H 10/40 20180101AFI20180919BHEP |
|
| AK | Designated contracting states |
Kind code of ref document: B1 Designated state(s): AT BE BG CH CY CZ DE DK EE ES FI FR GB GR HU IE IS IT LI LT LU LV MC MT NL PL PT RO SE SI SK TR |
|
| REG | Reference to a national code |
Ref country code: GB Ref legal event code: FG4D |
|
| REG | Reference to a national code |
Ref country code: CH Ref legal event code: EP Ref country code: AT Ref legal event code: REF Ref document number: 1108817 Country of ref document: AT Kind code of ref document: T Effective date: 20190315 |
|
| REG | Reference to a national code |
Ref country code: DE Ref legal event code: R096 Ref document number: 602007057831 Country of ref document: DE |
|
| REG | Reference to a national code |
Ref country code: IE Ref legal event code: FG4D |
|
| REG | Reference to a national code |
Ref country code: CH Ref legal event code: NV Representative=s name: ING. MARCO ZARDI C/O M. ZARDI AND CO. S.A., CH |
|
| REG | Reference to a national code |
Ref country code: NL Ref legal event code: MP Effective date: 20190313 |
|
| REG | Reference to a national code |
Ref country code: LT Ref legal event code: MG4D |
|
| PG25 | Lapsed in a contracting state [announced via postgrant information from national office to epo] |
Ref country code: SE Free format text: LAPSE BECAUSE OF FAILURE TO SUBMIT A TRANSLATION OF THE DESCRIPTION OR TO PAY THE FEE WITHIN THE PRESCRIBED TIME-LIMIT Effective date: 20190313 Ref country code: LT Free format text: LAPSE BECAUSE OF FAILURE TO SUBMIT A TRANSLATION OF THE DESCRIPTION OR TO PAY THE FEE WITHIN THE PRESCRIBED TIME-LIMIT Effective date: 20190313 Ref country code: FI Free format text: LAPSE BECAUSE OF FAILURE TO SUBMIT A TRANSLATION OF THE DESCRIPTION OR TO PAY THE FEE WITHIN THE PRESCRIBED TIME-LIMIT Effective date: 20190313 |
|
| PG25 | Lapsed in a contracting state [announced via postgrant information from national office to epo] |
Ref country code: BG Free format text: LAPSE BECAUSE OF FAILURE TO SUBMIT A TRANSLATION OF THE DESCRIPTION OR TO PAY THE FEE WITHIN THE PRESCRIBED TIME-LIMIT Effective date: 20190613 Ref country code: NL Free format text: LAPSE BECAUSE OF FAILURE TO SUBMIT A TRANSLATION OF THE DESCRIPTION OR TO PAY THE FEE WITHIN THE PRESCRIBED TIME-LIMIT Effective date: 20190313 Ref country code: LV Free format text: LAPSE BECAUSE OF FAILURE TO SUBMIT A TRANSLATION OF THE DESCRIPTION OR TO PAY THE FEE WITHIN THE PRESCRIBED TIME-LIMIT Effective date: 20190313 Ref country code: GR Free format text: LAPSE BECAUSE OF FAILURE TO SUBMIT A TRANSLATION OF THE DESCRIPTION OR TO PAY THE FEE WITHIN THE PRESCRIBED TIME-LIMIT Effective date: 20190614 |
|
| REG | Reference to a national code |
Ref country code: AT Ref legal event code: MK05 Ref document number: 1108817 Country of ref document: AT Kind code of ref document: T Effective date: 20190313 |
|
| PG25 | Lapsed in a contracting state [announced via postgrant information from national office to epo] |
Ref country code: SK Free format text: LAPSE BECAUSE OF FAILURE TO SUBMIT A TRANSLATION OF THE DESCRIPTION OR TO PAY THE FEE WITHIN THE PRESCRIBED TIME-LIMIT Effective date: 20190313 Ref country code: IT Free format text: LAPSE BECAUSE OF FAILURE TO SUBMIT A TRANSLATION OF THE DESCRIPTION OR TO PAY THE FEE WITHIN THE PRESCRIBED TIME-LIMIT Effective date: 20190313 Ref country code: EE Free format text: LAPSE BECAUSE OF FAILURE TO SUBMIT A TRANSLATION OF THE DESCRIPTION OR TO PAY THE FEE WITHIN THE PRESCRIBED TIME-LIMIT Effective date: 20190313 Ref country code: PT Free format text: LAPSE BECAUSE OF FAILURE TO SUBMIT A TRANSLATION OF THE DESCRIPTION OR TO PAY THE FEE WITHIN THE PRESCRIBED TIME-LIMIT Effective date: 20190713 Ref country code: CZ Free format text: LAPSE BECAUSE OF FAILURE TO SUBMIT A TRANSLATION OF THE DESCRIPTION OR TO PAY THE FEE WITHIN THE PRESCRIBED TIME-LIMIT Effective date: 20190313 Ref country code: RO Free format text: LAPSE BECAUSE OF FAILURE TO SUBMIT A TRANSLATION OF THE DESCRIPTION OR TO PAY THE FEE WITHIN THE PRESCRIBED TIME-LIMIT Effective date: 20190313 Ref country code: ES Free format text: LAPSE BECAUSE OF FAILURE TO SUBMIT A TRANSLATION OF THE DESCRIPTION OR TO PAY THE FEE WITHIN THE PRESCRIBED TIME-LIMIT Effective date: 20190313 |
|
| PG25 | Lapsed in a contracting state [announced via postgrant information from national office to epo] |
Ref country code: LU Free format text: LAPSE BECAUSE OF NON-PAYMENT OF DUE FEES Effective date: 20190320 Ref country code: PL Free format text: LAPSE BECAUSE OF FAILURE TO SUBMIT A TRANSLATION OF THE DESCRIPTION OR TO PAY THE FEE WITHIN THE PRESCRIBED TIME-LIMIT Effective date: 20190313 |
|
| REG | Reference to a national code |
Ref country code: BE Ref legal event code: MM Effective date: 20190331 |
|
| REG | Reference to a national code |
Ref country code: DE Ref legal event code: R097 Ref document number: 602007057831 Country of ref document: DE |
|
| PG25 | Lapsed in a contracting state [announced via postgrant information from national office to epo] |
Ref country code: AT Free format text: LAPSE BECAUSE OF FAILURE TO SUBMIT A TRANSLATION OF THE DESCRIPTION OR TO PAY THE FEE WITHIN THE PRESCRIBED TIME-LIMIT Effective date: 20190313 Ref country code: IS Free format text: LAPSE BECAUSE OF FAILURE TO SUBMIT A TRANSLATION OF THE DESCRIPTION OR TO PAY THE FEE WITHIN THE PRESCRIBED TIME-LIMIT Effective date: 20190713 |
|
| PLBE | No opposition filed within time limit |
Free format text: ORIGINAL CODE: 0009261 |
|
| STAA | Information on the status of an ep patent application or granted ep patent |
Free format text: STATUS: NO OPPOSITION FILED WITHIN TIME LIMIT |
|
| PG25 | Lapsed in a contracting state [announced via postgrant information from national office to epo] |
Ref country code: DK Free format text: LAPSE BECAUSE OF FAILURE TO SUBMIT A TRANSLATION OF THE DESCRIPTION OR TO PAY THE FEE WITHIN THE PRESCRIBED TIME-LIMIT Effective date: 20190313 Ref country code: MC Free format text: LAPSE BECAUSE OF FAILURE TO SUBMIT A TRANSLATION OF THE DESCRIPTION OR TO PAY THE FEE WITHIN THE PRESCRIBED TIME-LIMIT Effective date: 20190313 Ref country code: IE Free format text: LAPSE BECAUSE OF NON-PAYMENT OF DUE FEES Effective date: 20190320 |
|
| 26N | No opposition filed |
Effective date: 20191216 |
|
| PG25 | Lapsed in a contracting state [announced via postgrant information from national office to epo] |
Ref country code: BE Free format text: LAPSE BECAUSE OF NON-PAYMENT OF DUE FEES Effective date: 20190331 Ref country code: SI Free format text: LAPSE BECAUSE OF FAILURE TO SUBMIT A TRANSLATION OF THE DESCRIPTION OR TO PAY THE FEE WITHIN THE PRESCRIBED TIME-LIMIT Effective date: 20190313 |
|
| PG25 | Lapsed in a contracting state [announced via postgrant information from national office to epo] |
Ref country code: TR Free format text: LAPSE BECAUSE OF FAILURE TO SUBMIT A TRANSLATION OF THE DESCRIPTION OR TO PAY THE FEE WITHIN THE PRESCRIBED TIME-LIMIT Effective date: 20190313 |
|
| PG25 | Lapsed in a contracting state [announced via postgrant information from national office to epo] |
Ref country code: MT Free format text: LAPSE BECAUSE OF NON-PAYMENT OF DUE FEES Effective date: 20190320 |
|
| PG25 | Lapsed in a contracting state [announced via postgrant information from national office to epo] |
Ref country code: CY Free format text: LAPSE BECAUSE OF FAILURE TO SUBMIT A TRANSLATION OF THE DESCRIPTION OR TO PAY THE FEE WITHIN THE PRESCRIBED TIME-LIMIT Effective date: 20190313 |
|
| PG25 | Lapsed in a contracting state [announced via postgrant information from national office to epo] |
Ref country code: HU Free format text: LAPSE BECAUSE OF FAILURE TO SUBMIT A TRANSLATION OF THE DESCRIPTION OR TO PAY THE FEE WITHIN THE PRESCRIBED TIME-LIMIT; INVALID AB INITIO Effective date: 20070320 |
|
| P01 | Opt-out of the competence of the unified patent court (upc) registered |
Effective date: 20230531 |
|
| REG | Reference to a national code |
Ref country code: CH Ref legal event code: U11 Free format text: ST27 STATUS EVENT CODE: U-0-0-U10-U11 (AS PROVIDED BY THE NATIONAL OFFICE) Effective date: 20260401 |
|
| PGFP | Annual fee paid to national office [announced via postgrant information from national office to epo] |
Ref country code: GB Payment date: 20260327 Year of fee payment: 20 |
|
| PGFP | Annual fee paid to national office [announced via postgrant information from national office to epo] |
Ref country code: DE Payment date: 20260327 Year of fee payment: 20 |
|
| PGFP | Annual fee paid to national office [announced via postgrant information from national office to epo] |
Ref country code: FR Payment date: 20260325 Year of fee payment: 20 |
|
| PGFP | Annual fee paid to national office [announced via postgrant information from national office to epo] |
Ref country code: CH Payment date: 20260401 Year of fee payment: 20 |