EP2034310A1 - Bilderkennungsverfahren für Diagnoseteststreifen - Google Patents
Bilderkennungsverfahren für Diagnoseteststreifen Download PDFInfo
- Publication number
- EP2034310A1 EP2034310A1 EP07253567A EP07253567A EP2034310A1 EP 2034310 A1 EP2034310 A1 EP 2034310A1 EP 07253567 A EP07253567 A EP 07253567A EP 07253567 A EP07253567 A EP 07253567A EP 2034310 A1 EP2034310 A1 EP 2034310A1
- Authority
- EP
- European Patent Office
- Prior art keywords
- detection method
- diagnostic
- diagnostic plates
- image detection
- difference
- Prior art date
- Legal status (The legal status is an assumption and is not a legal conclusion. Google has not performed a legal analysis and makes no representation as to the accuracy of the status listed.)
- Withdrawn
Links
Images


Classifications
-
- G—PHYSICS
- G06—COMPUTING OR CALCULATING; COUNTING
- G06T—IMAGE DATA PROCESSING OR GENERATION, IN GENERAL
- G06T7/00—Image analysis
- G06T7/0002—Inspection of images, e.g. flaw detection
- G06T7/0012—Biomedical image inspection
-
- G—PHYSICS
- G01—MEASURING; TESTING
- G01N—INVESTIGATING OR ANALYSING MATERIALS BY DETERMINING THEIR CHEMICAL OR PHYSICAL PROPERTIES
- G01N21/00—Investigating or analysing materials by the use of optical means, i.e. using sub-millimetre waves, infrared, visible or ultraviolet light
- G01N21/84—Systems specially adapted for particular applications
- G01N21/8483—Investigating reagent band
-
- G—PHYSICS
- G01—MEASURING; TESTING
- G01N—INVESTIGATING OR ANALYSING MATERIALS BY DETERMINING THEIR CHEMICAL OR PHYSICAL PROPERTIES
- G01N30/00—Investigating or analysing materials by separation into components using adsorption, absorption or similar phenomena or using ion-exchange, e.g. chromatography or field flow fractionation
- G01N30/90—Plate chromatography, e.g. thin layer or paper chromatography
- G01N30/95—Detectors specially adapted therefor; Signal analysis
Definitions
- the present invention relates to an image detection method, in particular to an image detection method for diagnostic plates, which detects the changes of signal lines in multiple assay regions at the same time, and promotes the detection efficiency remarkably.
- Biochemical examination has become one of the routine clinical tests.
- the generally known chromatography diagnosis belongs to the biochemical tests, which is an immunoassay makes the use of the binding between antigens and antibodies, and the result is read by naked eyes.
- Medical physicians evaluated the physiological condition or the drug addict condition of the patients according to these results.
- the present method for liquid chromatography depends on the presence of a signal line in single color. The operator has to be very careful on the sites for detection since signal lines are not at the same level with each other due to manufacturing and assembly error.
- a signal line in single color sometimes represents negative result, while sometimes represents positive result in different tests.
- the results might be mixed up when many items are tested at the same time, and caused wrong records for the tests.
- the primary objective of the present invention is to provide an image detection method for diagnostic plates, especially to the image detection method for diagnostic plates with multiple test items in an automatic analysis system.
- Another objective of the present invention is to provide an image detection method for diagnostic plates, which depends on reading the Radio frequency identification (RFID) tags of the diagnostic plates, or the alternative RFID tags provided with an RFID reader, or external files of computers.
- RFID Radio frequency identification
- the corresponding detection parameters are set to save the analytic time and to prevent the data entry error made by human input.
- Yet another objective of the present invention is to provide an image detection method for diagnostic plates, which locates the signal line in the diagnostic plates automatically, and shows consistency in judging negative/positive thresholds to further increase the detection accuracy and analytic efficiency of the automatic system.
- the diagnostic plates in the image detection method for diagnostic plates of the present invention comprises RFID tags, or can be read from alternative tags provided with an RFID reader, or downloads the parameters from external files of computer.
- the diagnostic plates comprise at least one assay region, and at least one signal line within the assay region.
- This method thus comprises: reading the parameters from the RFID tags of the diagnostic plates directly, or reading the alternative RFID tags provided with an RFID reader, or downloading the parameters from the external files; detecting the changes of the images to check the stability; analyzing and measuring the color of signal lines and the background in the image of the diagnostic plates after the images are stabilized; calculating the color intensity difference between the signal line image and the corresponding background; determining the result of the signal lines in the assay region based on the difference in intensity.
- the advantages of the method in the invention are locating the precise sites of the assay regions automatically, locating the signal lines in the diagnostic plates automatically, showing consistency in judging negative/positive thresholds, saving the analytic time and preventing the data entry error made by artificial input, further to increase the detection accuracy and analytic efficiency of the automatic system.
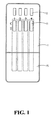
- FIG. 1 is a diagnostic plate diagram for the image detection method according to a preferred embodiment of the present invention.
- FIG. 2 is a flow chart showing the main steps of the image detection method for the diagnostic plate in the embodiment of the present invention.
- FIG. 3 is a flow chart showing the steps for stability determination of image changes of the image detection method for the diagnostic plate in the embodiment of the present invention.
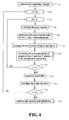
- FIG. 4 is a flow chart showing the steps for analysis and calculation of the signal lines according to the image detection method for the diagnostic plate in the embodiment of the present invention.
- FIG. 5 is a flow chart showing the steps for determining the test items of each assay region to be positive or negative according to the image detection method for the diagnostic plate in the embodiment of the present invention.
- the body of the diagnostic plate (1) comprises 4 assay regions (11), in correspondence to 4 test items (12) respectively, two signal lines (C and T) set in the assay regions (11) in the strips (represented by dot lines), and RFID tags (in the back of the diagnostic plate, not shown in the figure, not necessary to be attached to the diagnostic plate).
- the pattern of the diagnostic plate is shown by way of example but not limitation.
- the test items (12) include, but are not limited to, the physiological changes/disease screening, such as pregnancy, renal diseases; or medicines/drugs screening, such as benzodiazepines (BZD), marijuana, amphetamine, opium and the like.
- BZD benzodiazepines
- the operator takes out the lid (15) of the diagnostic plate (1), places the four test strips into the samples such as urine sample, let them immersed for several minutes, covers the lid (15) to prevent the leakage, then performs the image detection method for diagnostic plates of the present invention.
- Step 110 of the invention is to read the parameters from the RFID tags of the diagnostic plates, which used an RFID reader to read the RFID tags of the diagnostic plates (1) or in other positions, or downloaded the parameters from the external files to let the computer system read the RFID tag directly or set up the corresponding parameters inside the file.
- the corresponding parameters include, but are not limited to, the number of assay regions, the test items, the size of the diagnostic plate, the size of assay regions, the correction curves for the test items, the diagnostic negative/positive thresholds.
- Step 120 of FIG. 2 is to detect the image changes whether reaches the stable state.
- the stability can be further determined through the steps of 121 to 127 shown in FIG. 3 .
- an image capturing apparatus such as a CCD camera or Web camera, to take the first image of the diagnostic plate at the time point of t, after a certain time ( ⁇ t), and take the second image of the diagnostic plate at the time point of t+ ⁇ t during the steps 121 to 124.
- the image of the diagnostic plate is regarded stable if the image difference (such as the standard deviation) between the first image and the second image relative to the time ⁇ t is smaller than a threshold value during the steps 125 to 126.
- the ⁇ t for the embodiment is around 0.2 sec
- the threshold value ⁇ % is 0% ⁇ 2%, preferably 0% ⁇ 1%. That method of the present invention captures several images of the assay regions (11) automatically at the time intervals of every ⁇ t. And the image difference at the time point of t and t+ ⁇ t is calculated respectively. The image is regarded stable if the image difference is smaller than the threshold value as shown in step 127.
- Step 130 of FIG. 2 is to analyze and measure the color of signal lines and the background in the image of the diagnostic plates, and step 140 is to calculate the difference in color intensity between the signal line image and the corresponding background. Both steps of 130 and 140 can be carried out through the flow chart shown in FIG. 4 .
- the method of the present invention is based on repeatedly image-capturing operations, separately analyzing and measuring each assay regions or test items to reach the final judgment. Firstly, images are captured for n times when each image change reaches the stable state in steps of 131 to 133, in which i represent the indicator for m test items, and j represents the indicator for n images.
- the sites of assay regions (11) will be located automatically in steps of 134 to 136 for the frame of assay regions (11) as automatic location to further correct the manufacturing errors of the diagnostic plates such as configuration errors for the strips.
- the precise sites of signal lines are also located automatically, such as the sites for line C and line T, in which line C represents the control line while line T represents the reaction line.
- Line C shows the standards for quality and concentration of the test items.
- the color intensities of line C, line T and the background are analyzed to search the precise regions for signal lines in the diagnostic plates. The width of each line is properly defined to automatically locate line C and line T.
- the color intensities of line C, line T, and the background of line C and line T inside assay region (11) are calculated in step 137.
- the differences in color intensity of images of line C and line T relative to the corresponding background are calculated respectively.
- the intensity difference between the images of line C and the background is used as a standard to determine the validity of the test items. That is, line C is regarded as present and obvious when the difference in color intensity between the images of line C and the corresponding background is larger than a threshold value.
- the response and result of test item is regarded as successful and valid.
- the line C is regarded as not present when the difference in color intensity between the images of line C and the corresponding background is smaller than the threshold value.
- the result is regarded as failed and invalid.
- This assay has to be performed again.
- the threshold value is 7, preferably 5 based on grey levels (or pixel intensity values) at the range of 0-225.
- the serial images captured in step 131 are integrated and the individual test item is statistics calculated for each assay region in loop of steps from 133 to 141.
- the reported values are obtained by repeatedly screening (such as standard deviation) for each test item.
- the first difference in color intensity between images of the line C and the corresponding background of the assay region, and the second difference in color intensity between the images of the line T and the corresponding background of the assay region are determined.
- the ratio of the second difference in color intensity to the first difference in color intensity is used as the reported values.
- the reported values are not limited to the intensity difference or ratio.
- the reported value of this test item is recorded in step 143.
- the calculation and analysis of each test item is checked in step 144, the unfinished item will be redo until all the test items are done. All the calculation and analysis of the test items are finished and obtained in step 145.
- step 150 of FIG. 2 is to determine the results of the signal lines in the assay region, which can be further performed through steps of 151 to 153 shown in FIG. 5 to determine the results to be positive or negative for each test item.
- Each of the reported values of signal lines in each assay region, such as reported values of line C and line T, are compared to the negative/positive threshold values of each test items respectively during the steps 151 to 153.
- the positive or negative result for each test item is then determined.
- the test item is determined to be positive if the difference in color intensity between the image of the reaction line (line T) and the background is higher than the threshold value when the test item belongs to the category of physiological changes/disease screening such as pregnancy or renal disease and the like.
- test item is determined to be positive if the difference in color intensity between the image of the reaction line (line T) and the background is lower than the threshold value when the test item belongs to the category of medicines/drugs screening, such as benzodiazepines (BZD), marijuana, amphetamine, opium and the like.
- BZD benzodiazepines
- the test item will be regarded as failed and invalid and the assay has to be repeated if line C is not present, no matter line T is present or not.
- the signal line is the reaction line in another embodiment of the present invention.
- the test item in the corresponding assay region is determined to be positive or negative, and is depended on the difference in color intensity between the image of the reaction line and the corresponding background.
Landscapes
- Engineering & Computer Science (AREA)
- Health & Medical Sciences (AREA)
- General Health & Medical Sciences (AREA)
- Medical Informatics (AREA)
- Nuclear Medicine, Radiotherapy & Molecular Imaging (AREA)
- Radiology & Medical Imaging (AREA)
- Quality & Reliability (AREA)
- Computer Vision & Pattern Recognition (AREA)
- Physics & Mathematics (AREA)
- General Physics & Mathematics (AREA)
- Theoretical Computer Science (AREA)
- Investigating Or Analysing Materials By The Use Of Chemical Reactions (AREA)
Priority Applications (1)
| Application Number | Priority Date | Filing Date | Title |
|---|---|---|---|
| EP07253567A EP2034310A1 (de) | 2007-09-08 | 2007-09-08 | Bilderkennungsverfahren für Diagnoseteststreifen |
Applications Claiming Priority (1)
| Application Number | Priority Date | Filing Date | Title |
|---|---|---|---|
| EP07253567A EP2034310A1 (de) | 2007-09-08 | 2007-09-08 | Bilderkennungsverfahren für Diagnoseteststreifen |
Publications (1)
| Publication Number | Publication Date |
|---|---|
| EP2034310A1 true EP2034310A1 (de) | 2009-03-11 |
Family
ID=38979531
Family Applications (1)
| Application Number | Title | Priority Date | Filing Date |
|---|---|---|---|
| EP07253567A Withdrawn EP2034310A1 (de) | 2007-09-08 | 2007-09-08 | Bilderkennungsverfahren für Diagnoseteststreifen |
Country Status (1)
| Country | Link |
|---|---|
| EP (1) | EP2034310A1 (de) |
Citations (8)
| Publication number | Priority date | Publication date | Assignee | Title |
|---|---|---|---|---|
| US5331550A (en) * | 1991-03-05 | 1994-07-19 | E. I. Du Pont De Nemours And Company | Application of neural networks as an aid in medical diagnosis and general anomaly detection |
| EP0646784A1 (de) * | 1993-09-07 | 1995-04-05 | Bayer Corporation | Videoteststreifenleser und Verfahren zur Bewertung von Teststreifen |
| US5717778A (en) * | 1993-02-26 | 1998-02-10 | Chu; Albert E. | Optical specimen analysis system and method |
| EP0834848A2 (de) * | 1996-10-02 | 1998-04-08 | Texas Instruments Incorporated | System ortsfester optischer Sensoren, und verteiltes Sensor-Netz |
| EP1416275A1 (de) * | 2002-10-31 | 2004-05-06 | Oy Reagena Ltd | Schnelltestverfahren und Kontrolleinrichtung |
| WO2004046686A2 (en) * | 2002-11-19 | 2004-06-03 | Jin Po Lee | Method and system for analyzing test devices |
| US20070003120A1 (en) * | 2003-11-07 | 2007-01-04 | Celogos | Automatic analysis of cellular samples |
| US20070161103A1 (en) * | 2004-02-19 | 2007-07-12 | Prionics Ag | Device and method for the visual analysis of test strips |
-
2007
- 2007-09-08 EP EP07253567A patent/EP2034310A1/de not_active Withdrawn
Patent Citations (8)
| Publication number | Priority date | Publication date | Assignee | Title |
|---|---|---|---|---|
| US5331550A (en) * | 1991-03-05 | 1994-07-19 | E. I. Du Pont De Nemours And Company | Application of neural networks as an aid in medical diagnosis and general anomaly detection |
| US5717778A (en) * | 1993-02-26 | 1998-02-10 | Chu; Albert E. | Optical specimen analysis system and method |
| EP0646784A1 (de) * | 1993-09-07 | 1995-04-05 | Bayer Corporation | Videoteststreifenleser und Verfahren zur Bewertung von Teststreifen |
| EP0834848A2 (de) * | 1996-10-02 | 1998-04-08 | Texas Instruments Incorporated | System ortsfester optischer Sensoren, und verteiltes Sensor-Netz |
| EP1416275A1 (de) * | 2002-10-31 | 2004-05-06 | Oy Reagena Ltd | Schnelltestverfahren und Kontrolleinrichtung |
| WO2004046686A2 (en) * | 2002-11-19 | 2004-06-03 | Jin Po Lee | Method and system for analyzing test devices |
| US20070003120A1 (en) * | 2003-11-07 | 2007-01-04 | Celogos | Automatic analysis of cellular samples |
| US20070161103A1 (en) * | 2004-02-19 | 2007-07-12 | Prionics Ag | Device and method for the visual analysis of test strips |
Similar Documents
| Publication | Publication Date | Title |
|---|---|---|
| US20250283876A1 (en) | System for analyzing quantitative lateral flow chromatography | |
| US8911679B2 (en) | Color-based reaction testing of biological materials | |
| AU2018356358B2 (en) | Methods and devices for performing an analytical measurement based on a color formation reaction | |
| US20230366881A1 (en) | Image quantification system for estimation of viral load based on detection by rapid antigen test | |
| JP2002022748A (ja) | 臨床検査システム | |
| CN107292096A (zh) | 基于条码扫描的临床检验报告审核系统及方法 | |
| CA3088884A1 (en) | Methods for measuring analyte and/or protein in biological samples | |
| EP3527972B1 (de) | Verfahren und vorrichtungen zur durchführung analytischer messungen | |
| US20080304721A1 (en) | Image detection method for diagnostic plates | |
| Ghosh et al. | A low-cost test for anemia using an artificial neural network | |
| CN101311726B (zh) | 检测盘的影像检测方法 | |
| JP6791170B2 (ja) | 分析装置、分析方法、および、分析システム | |
| CN120009532B (zh) | 一种检验科用免疫层析检测方法及系统 | |
| EP2034310A1 (de) | Bilderkennungsverfahren für Diagnoseteststreifen | |
| US12579651B2 (en) | Impeded diffusion fraction for quantitative imaging diagnostic assay | |
| CN110867246A (zh) | 检测器材生命周期管理方法及检测器材套件 | |
| KR102581512B1 (ko) | 간단한 소변검사를 수행하기 위한 장치 및 방법 | |
| JP2025507363A (ja) | 体液中の少なくとも1つの被検物質の濃度を決定するための方法および装置 | |
| Paglinawan et al. | Measurement of specific gravity, urobilinogen, blood, protein and pH level of urine samples using raspberry Pi based portable urine test strip analyzer | |
| KR20230121535A (ko) | 시료 촬영 이미지를 이용한 반려 동물 건강 진단 방법 | |
| JP2024543760A (ja) | 試料撮影イメージを用いるペット健康診断方法及びシステム | |
| JP2008261850A (ja) | 検査プレートの画像検査方法 | |
| US20260095455A1 (en) | Methods and devices for providing blacklist information on the suitability of a mobile device for performing analytical measurements | |
| US20230375480A1 (en) | System, method and point of care device for image analysis of diagnostic assays | |
| KR20170122145A (ko) | 타액을 이용한 정보 제공 기기 |
Legal Events
| Date | Code | Title | Description |
|---|---|---|---|
| PUAI | Public reference made under article 153(3) epc to a published international application that has entered the european phase |
Free format text: ORIGINAL CODE: 0009012 |
|
| AK | Designated contracting states |
Kind code of ref document: A1 Designated state(s): AT BE BG CH CY CZ DE DK EE ES FI FR GB GR HU IE IS IT LI LT LU LV MC MT NL PL PT RO SE SI SK TR |
|
| AX | Request for extension of the european patent |
Extension state: AL BA HR MK RS |
|
| 17P | Request for examination filed |
Effective date: 20090911 |
|
| 17Q | First examination report despatched |
Effective date: 20091007 |
|
| AKX | Designation fees paid |
Designated state(s): AT BE BG CH CY CZ DE DK EE ES FI FR GB GR HU IE IS IT LI LT LU LV MC MT NL PL PT RO SE SI SK TR |
|
| STAA | Information on the status of an ep patent application or granted ep patent |
Free format text: STATUS: THE APPLICATION IS DEEMED TO BE WITHDRAWN |
|
| 18D | Application deemed to be withdrawn |
Effective date: 20100420 |