EP2083265A1 - Verfahren zur klassifizierung von protein/verbindung-paaren - Google Patents
Verfahren zur klassifizierung von protein/verbindung-paaren Download PDFInfo
- Publication number
- EP2083265A1 EP2083265A1 EP07830970A EP07830970A EP2083265A1 EP 2083265 A1 EP2083265 A1 EP 2083265A1 EP 07830970 A EP07830970 A EP 07830970A EP 07830970 A EP07830970 A EP 07830970A EP 2083265 A1 EP2083265 A1 EP 2083265A1
- Authority
- EP
- European Patent Office
- Prior art keywords
- chemical
- protein
- pair
- vector
- interaction
- Prior art date
- Legal status (The legal status is an assumption and is not a legal conclusion. Google has not performed a legal analysis and makes no representation as to the accuracy of the status listed.)
- Withdrawn
Links
- 102000004169 proteins and genes Human genes 0.000 title claims abstract description 142
- 108090000623 proteins and genes Proteins 0.000 title claims abstract description 142
- 238000000034 method Methods 0.000 title claims abstract description 105
- 150000001875 compounds Chemical class 0.000 title description 3
- 239000000126 substance Substances 0.000 claims abstract description 212
- 239000013598 vector Substances 0.000 claims abstract description 165
- 230000003993 interaction Effects 0.000 claims abstract description 71
- 238000012706 support-vector machine Methods 0.000 claims abstract description 37
- 238000001819 mass spectrum Methods 0.000 claims abstract description 28
- 125000003275 alpha amino acid group Chemical group 0.000 claims abstract description 16
- 239000000556 agonist Substances 0.000 claims description 7
- 239000005557 antagonist Substances 0.000 claims description 7
- 238000012216 screening Methods 0.000 claims description 4
- 238000012549 training Methods 0.000 claims description 3
- 230000008878 coupling Effects 0.000 abstract description 5
- 238000010168 coupling process Methods 0.000 abstract description 5
- 238000005859 coupling reaction Methods 0.000 abstract description 5
- 150000001413 amino acids Chemical class 0.000 description 29
- 230000014509 gene expression Effects 0.000 description 21
- 230000006870 function Effects 0.000 description 16
- 108060003345 Adrenergic Receptor Proteins 0.000 description 10
- 102000017910 Adrenergic receptor Human genes 0.000 description 10
- 238000004364 calculation method Methods 0.000 description 9
- 239000011159 matrix material Substances 0.000 description 9
- 108010016626 Dipeptides Proteins 0.000 description 8
- 102000038037 druggable proteins Human genes 0.000 description 8
- 108091007999 druggable proteins Proteins 0.000 description 8
- 238000003032 molecular docking Methods 0.000 description 8
- 239000012634 fragment Substances 0.000 description 7
- 239000003446 ligand Substances 0.000 description 7
- 239000003814 drug Substances 0.000 description 5
- 229940079593 drug Drugs 0.000 description 5
- 102000005962 receptors Human genes 0.000 description 5
- 108020003175 receptors Proteins 0.000 description 5
- 230000000694 effects Effects 0.000 description 4
- 238000011156 evaluation Methods 0.000 description 4
- 239000000203 mixture Substances 0.000 description 4
- 101000836540 Homo sapiens Aldo-keto reductase family 1 member B1 Proteins 0.000 description 3
- 101000809450 Homo sapiens Amphiregulin Proteins 0.000 description 3
- 101000928259 Homo sapiens NADPH:adrenodoxin oxidoreductase, mitochondrial Proteins 0.000 description 3
- 238000004458 analytical method Methods 0.000 description 3
- 238000013459 approach Methods 0.000 description 3
- 230000008901 benefit Effects 0.000 description 3
- 238000000738 capillary electrophoresis-mass spectrometry Methods 0.000 description 3
- 102000046818 human AR Human genes 0.000 description 3
- 238000007884 metabolite profiling Methods 0.000 description 3
- 102000039446 nucleic acids Human genes 0.000 description 3
- 108020004707 nucleic acids Proteins 0.000 description 3
- 150000007523 nucleic acids Chemical class 0.000 description 3
- 230000004850 protein–protein interaction Effects 0.000 description 3
- 150000003384 small molecules Chemical class 0.000 description 3
- 102000002004 Cytochrome P-450 Enzyme System Human genes 0.000 description 2
- 108010015742 Cytochrome P-450 Enzyme System Proteins 0.000 description 2
- 241000196324 Embryophyta Species 0.000 description 2
- 102000003688 G-Protein-Coupled Receptors Human genes 0.000 description 2
- 108090000045 G-Protein-Coupled Receptors Proteins 0.000 description 2
- 102000010909 Monoamine Oxidase Human genes 0.000 description 2
- 108010062431 Monoamine oxidase Proteins 0.000 description 2
- 239000003905 agrochemical Substances 0.000 description 2
- 238000004422 calculation algorithm Methods 0.000 description 2
- 238000007621 cluster analysis Methods 0.000 description 2
- 238000013461 design Methods 0.000 description 2
- 238000011161 development Methods 0.000 description 2
- 230000018109 developmental process Effects 0.000 description 2
- 238000007876 drug discovery Methods 0.000 description 2
- 238000001962 electrophoresis Methods 0.000 description 2
- 230000002068 genetic effect Effects 0.000 description 2
- 238000004949 mass spectrometry Methods 0.000 description 2
- 238000000302 molecular modelling Methods 0.000 description 2
- 238000000513 principal component analysis Methods 0.000 description 2
- 238000012360 testing method Methods 0.000 description 2
- 231100000419 toxicity Toxicity 0.000 description 2
- 230000001988 toxicity Effects 0.000 description 2
- 102000004190 Enzymes Human genes 0.000 description 1
- 108090000790 Enzymes Proteins 0.000 description 1
- 230000009471 action Effects 0.000 description 1
- 230000001270 agonistic effect Effects 0.000 description 1
- 125000000539 amino acid group Chemical group 0.000 description 1
- 230000003042 antagnostic effect Effects 0.000 description 1
- 230000001093 anti-cancer Effects 0.000 description 1
- 230000000975 bioactive effect Effects 0.000 description 1
- 238000011953 bioanalysis Methods 0.000 description 1
- 239000000090 biomarker Substances 0.000 description 1
- 238000012512 characterization method Methods 0.000 description 1
- 238000012412 chemical coupling Methods 0.000 description 1
- 238000000205 computational method Methods 0.000 description 1
- 238000004590 computer program Methods 0.000 description 1
- 238000002884 conformational search Methods 0.000 description 1
- 238000002790 cross-validation Methods 0.000 description 1
- 238000003795 desorption Methods 0.000 description 1
- 238000009510 drug design Methods 0.000 description 1
- 239000003596 drug target Substances 0.000 description 1
- 238000005516 engineering process Methods 0.000 description 1
- 239000002532 enzyme inhibitor Substances 0.000 description 1
- 230000002349 favourable effect Effects 0.000 description 1
- 238000002290 gas chromatography-mass spectrometry Methods 0.000 description 1
- 238000000126 in silico method Methods 0.000 description 1
- 230000005764 inhibitory process Effects 0.000 description 1
- 230000002452 interceptive effect Effects 0.000 description 1
- 229920002521 macromolecule Polymers 0.000 description 1
- 238000005259 measurement Methods 0.000 description 1
- 239000002207 metabolite Substances 0.000 description 1
- 238000012986 modification Methods 0.000 description 1
- 230000004048 modification Effects 0.000 description 1
- 230000007886 mutagenicity Effects 0.000 description 1
- 231100000299 mutagenicity Toxicity 0.000 description 1
- 238000005457 optimization Methods 0.000 description 1
- 231100000683 possible toxicity Toxicity 0.000 description 1
- 230000008569 process Effects 0.000 description 1
- 238000012545 processing Methods 0.000 description 1
- 238000003672 processing method Methods 0.000 description 1
- 230000006916 protein interaction Effects 0.000 description 1
- 238000000455 protein structure prediction Methods 0.000 description 1
- 230000002285 radioactive effect Effects 0.000 description 1
- 230000009467 reduction Effects 0.000 description 1
- 230000035945 sensitivity Effects 0.000 description 1
- 230000003595 spectral effect Effects 0.000 description 1
- 230000001225 therapeutic effect Effects 0.000 description 1
Images




















Classifications
-
- G—PHYSICS
- G16—INFORMATION AND COMMUNICATION TECHNOLOGY [ICT] SPECIALLY ADAPTED FOR SPECIFIC APPLICATION FIELDS
- G16B—BIOINFORMATICS, i.e. INFORMATION AND COMMUNICATION TECHNOLOGY [ICT] SPECIALLY ADAPTED FOR GENETIC OR PROTEIN-RELATED DATA PROCESSING IN COMPUTATIONAL MOLECULAR BIOLOGY
- G16B40/00—ICT specially adapted for biostatistics; ICT specially adapted for bioinformatics-related machine learning or data mining, e.g. knowledge discovery or pattern finding
-
- G—PHYSICS
- G16—INFORMATION AND COMMUNICATION TECHNOLOGY [ICT] SPECIALLY ADAPTED FOR SPECIFIC APPLICATION FIELDS
- G16B—BIOINFORMATICS, i.e. INFORMATION AND COMMUNICATION TECHNOLOGY [ICT] SPECIALLY ADAPTED FOR GENETIC OR PROTEIN-RELATED DATA PROCESSING IN COMPUTATIONAL MOLECULAR BIOLOGY
- G16B20/00—ICT specially adapted for functional genomics or proteomics, e.g. genotype-phenotype associations
- G16B20/30—Detection of binding sites or motifs
-
- G—PHYSICS
- G16—INFORMATION AND COMMUNICATION TECHNOLOGY [ICT] SPECIALLY ADAPTED FOR SPECIFIC APPLICATION FIELDS
- G16B—BIOINFORMATICS, i.e. INFORMATION AND COMMUNICATION TECHNOLOGY [ICT] SPECIALLY ADAPTED FOR GENETIC OR PROTEIN-RELATED DATA PROCESSING IN COMPUTATIONAL MOLECULAR BIOLOGY
- G16B40/00—ICT specially adapted for biostatistics; ICT specially adapted for bioinformatics-related machine learning or data mining, e.g. knowledge discovery or pattern finding
- G16B40/30—Unsupervised data analysis
-
- G—PHYSICS
- G16—INFORMATION AND COMMUNICATION TECHNOLOGY [ICT] SPECIALLY ADAPTED FOR SPECIFIC APPLICATION FIELDS
- G16B—BIOINFORMATICS, i.e. INFORMATION AND COMMUNICATION TECHNOLOGY [ICT] SPECIALLY ADAPTED FOR GENETIC OR PROTEIN-RELATED DATA PROCESSING IN COMPUTATIONAL MOLECULAR BIOLOGY
- G16B20/00—ICT specially adapted for functional genomics or proteomics, e.g. genotype-phenotype associations
Definitions
- the present invention relates to a method for predicting an interaction between a protein and a chemical.
- the present invention has been made to provide a versatile method for predicting an unknown interaction between a protein and a chemical.
- Amino acid sequences are such data as is most available about proteins at present and as is first obtained when a novel protein is discovered.
- the inventors have thus investigated statistic processing methods using the above data. That is, the inventors sampled protein-chemical interactions such as protein-chemical couplings and agonistic or antagonistic functional interactions between proteins and chemicals, studied amino acid sequences of available proteins and the mass spectrum data of available chemicals, vectorized the frequency of specific amino acid sequences and the position and intensity of each peak in the mass spectrum data, and applied a support vector machine (SVM) to the vectors and configured a pattern classifier by training the SVM with the interactions ( V. Vapnik, Statistical Learning Theory, Wiley, New York, 1998 ). And the inventors have found that the classification used highly correlates with the classification of bonds or functional interactions. The inventors have completed a method for predicting an unknown interaction between a pair of a protein and a chemical.
- SVM support vector machine
- a method for vectorizing "y" proteins into vectors b 1 to b y is as described below.
- the method for vectorizing the proteins is not particularly limited.
- the entire amino acid sequences or partial sequences, such as binding sites, of each protein may be vectorized.
- the proteins may be vectorized on the basis of the charge of each amino acid residue in the proteins, their hydrophobicity, their surface tension, and/or their three-dimensional structure ( J. R. Bock and D. A. Gough, Predicting protein-protein interactinos from primary structure, Bioinformatics, Vol. 17, No. 5, pp. 455-460, 2001 ; C. Yanover and T.
- C is the set of features c that appear at least once in the proteins to be vectorized and fp(c) is the frequency of a feature c that appears in a protein p.
- a usable feature of the amino acid sequences may be the frequency of all combinations of sequences of amino acids of which the number is n (n is a natural number) or may be the frequency of each group obtained by grouping partial sequences on the basis of physicochemical properties.
- the usable number of amino acids in the amino acid sequences is not particularly limited and partial sequences with two or three amino acids are preferably used because of the number of elements of a vector.
- the following vector is created as a vector C: a vector C od elements of the frequencies of all combinations of sequences of two amino acids ( M. Bhasin and G. P. S. Raghava, GPCR pred. and SVM-based method for prediction of families and subfamilies of g-protein coupled receptors, Nucleic Acids Res., Vol. 32, pp. 383-389, 2004 ). Since there are 20 kinds of amino acids in nature, this vector contains 20 2 elements, that is, 400 elements.
- the following vector may be created as a vector C: a vector C ot elements of the frequencies of all combinations of sequences of three amino acids. Since there are 20 kinds of amino acids in nature, this vector contains 20 3 elements, that is, 8000 elements and thus is 8000-dimensional.
- a vector containing elements of the frequencies of combinations of sequences of three amino acids may be created without distinguishing the terminal amino acids of each sequence from each other as reported by Martin et al. ( S. Martin, D. Roe, and J. L. Faulon, Predicting protein-protein interactions using signature products, Bioinformatics, Vol. 21, No. 2, pp. 218-226, 2005 ).
- This vector contains 4200 elements as determined from the expression (8000 - 400) / 2 + 400, and thus is 4200-dimensional.
- the following vector may be created as a vector C: a vector C id containing elements of the frequencies of groups obtained by grouping combinations of sequences of two amino acids on the basis of physicochemical properties.
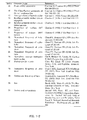
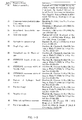
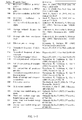
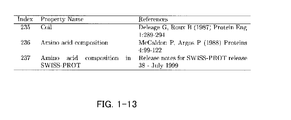
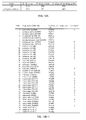
- Venkatarajan et al. have determined a five-dimensional vector from 237 physicochemical properties ( Fig. 1 ) of 20 amino acids as described below ( M. S. Venkatarajan and W. Braun, New quantitative descriptors of amino acids based on multidimensional scaling of a large number of physical-chemical properties, Journal of Molecular Modeling, Vol. 7, pp. 445-453, 2001 ).
- a matrix Q representing the similarity of amino acids was created using S ⁇ .
- Venkatarajan et al. finally expressed the amino acid i with a five-dimensional vector ⁇ (i) below using the five eigenvalues and the eigenvectors.
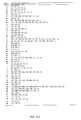
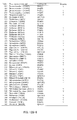
- the five eigenvalues and the eigenvector of each amino acid are shown in Fig. 2 .
- the vabayelMix package A. E. Teschendorff, Y. Wang, N. L.
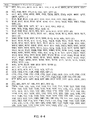
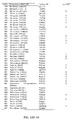
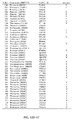
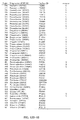
- the 89 types of clusters are obtained in such a manner that 400 five-dimensional vectors corresponding to the 400 types of dipeptides are clustered in two stages. In the first stage, the 400 vectors are divided into 25 clusters. In the second stage, vectors belonging to each cluster are clustered, whereby 89 clusters can be obtained from the 25 clusters. Dipeptides contained in the 89 clusters are shown in Fig. 3 .
- the following vector may be created as a vector C: a vector C 1t containing elements of the frequencies of groups obtained by grouping combinations of sequences of three amino acids on the basis of physicochemical properties.
- vabayelMix package A. E. Teschendorff, Y. Wang, N. L. Barbosa-Morais, J. D. Brenton, and C. Caldas, A variational Bayesian mixture modelling framework for cluster analysis of gene-expression data, Bioinformatics, Vol. 21, No. 13, pp. 3025-3033, 2005 ) of the statistical analysis software R (http://www.r-project.org/).
- the 199 types of clusters are obtained in such a manner that 4200 five-dimensional vectors corresponding to the 4200 types of dipeptides are clustered in two stages.
- the 4200 vectors are divided into 34 clusters.
- vectors belonging to each cluster are clustered, whereby 199 clusters can be obtained from the 34 clusters.
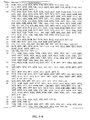
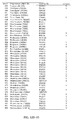
- Dipeptides contained in the 199 clusters are shown in Fig. 4 .
- a chemical is vectorized using the mass spectrum of the chemical. That is, at least one of parameters (the number thereof is herein x) of the mass spectrum data is vectorized, whereby vectors a 1 to a x (x is an integer of one or more) may be obtained. It is not limited which parameter is selected.
- x the number thereof is herein x
- information about the position and intensity of a peak observed may be digitized into a fragment vector (F) and information about the distance between peaks observed and the intensity of each peak may be digitized into a gap vector (G).
- a vector F(c) corresponding to the mass spectrum of a chemical c is given by the following equations when both the position and intensity of an observed peak are taken into account:
- a vector F'(c) is given by the following equations when the intensity of the peak is not taken into account but only its position is taken into account:
- M is the set of the m/z values of peaks observed from all chemical
- M(c) is the set of the m/z values of peaks observed from the chemical
- I(m) is the intensity of a peak observed from the chemical at an m/z value.
- the intensity gi(j-i) corresponding to the distance between two mass spectrum peaks, observed at an m/z value i or j (j > i), having an intensity Ii or Ij is defined by formulas below.
- the intensity I k of a mass spectrum belongs to the set (0, 1000) unless otherwise specified hereinafter.
- ⁇ i , j ; j - i ⁇ w , I i , I j ⁇ t , g i ⁇ j - i I i ⁇ ln I j ⁇ k ; k > i , I k ⁇ t ln I k
- t is the threshold of the intensity determined by taking a gap into account and w is the threshold of the difference between the m/z values of the two peaks. It should be noted that t is its threshold determined by taking the presence of noise into account and w is its threshold determined by taking the presence of a radioactive isotope into account.
- Mg is the set of gaps that are at least once observed in all chemicals to be vectorized and Mg(c) is the set of gaps that are observed in a chemical c.
- Equations (25) below may be used to calculate gi(j-i) instead of Formulas (21).
- Formulas (21) are preferably used because the accuracy of discrimination is high. 1.
- g i ⁇ j - i I i + I j 2 2.
- g i ⁇ j - i I i ⁇ 1 / I j ⁇ k ; k > i , I k ⁇ t 1 / I k 3.
- g i ⁇ j - i I i ⁇ I j ⁇ k ; k > i , I k ⁇ t I k 4 * .
- g i ⁇ j - i I i ⁇ - ln I j ⁇ k ; k > i , I k ⁇ t - ln I k 5.
- g i ⁇ j - i I i ⁇ ln I j ⁇ k ; k > i , I k ⁇ t ln I k 6 * .
- g i ⁇ j - i I i ⁇ exp I j ⁇ k ; k > i , I k ⁇ t exp I k * I k ⁇ 0 1
- Zernov et al. have vectorized chemicals using physicochemical properties in order to discriminate between drugs and non-drugs and in order to discriminate between agrichemicals and non-agrochemicals, ( V. V. Zernov, K. V. Balakin, A. A. Ivaschenko, N. P. Savchuk, and I. V. Pletnev, Drug discovery using support vector machines, the case studies of drug-likeness, agrochemical-likeness, and enzyme inhibition predictions, J. Chem. Inf. Comput. Sci., Vol. 43, pp. 2048-2056, 2003 ). Swamidass et al.
- a vector a which is created using at least one of vectors a 1 to a x derived from the mass spectrum data of a chemical and which corresponds to the chemical is combined with a vector b which is created using a vector b k (k is an integer of one to y) derived from an amino acid sequence of a protein and which corresponds to the protein.
- a method for combining the vectors is not particularly limited.
- Kernel functions may be used for Kaa, Kbb, and Kab.
- different parameters may be used. The adjustment of the parameters allows the relationships to be arbitrarily weighted.
- a vector derived from the protein and a vector derived from the protein may be adjusted in dimension number to each other such that these vectors have a constant length.
- the dimension number of the chemical-derived vector varies depending on the mass spectrum dataset or parameters of the chemical; however, the dimension number of the protein-derived vector does not depend on its mass spectrum dataset. Therefore, the dimension number of the protein-derived vector is preferably used. In this case, vectors having the same dimension number need to be created in such a manner that elements of which the number is equal to the dimension number of vectors used are extracted from the chemical-derived vector.
- a method for selecting the elements is not particularly limited.
- the elements may be selected at random, but, for example, features that are probably most important in classifying the protein-chemical pair may be selected from among elements of the chemical-derived vector.
- KFG(F1, G1) and the like in Formula (30) are calculated using one of Functions (31), the calculation results vary depending on the order of features of the vectors; hence, the order of the features may be determined in accordance with a standard below. If the number of the features needs to be reduced, the features are ranked in order of priority and a necessary number of the top features may be selected.
- MSE i F ⁇ c ⁇ C F i c - F i 2
- F i ⁇ c ⁇ C F i c C
- MSE G i for the protein vector C that is the set of all proteins listed in the dataset is used instead of .
- the features that appear frequently in the chemical or the protein and that vary significantly as calculated from Equation (32) or (33) are preferably ranked high. This is because these features probably have the highest expression power for discrimination.
- the features are extracted for the purpose of reducing the dimension number of each vector, different vectors are analyzed for relationships between expressive features and whereby relationships between different vectors with higher expression power for discrimination are preferably extracted.
- the combined vector may include a vector derived from the mass spectrum data of the chemical.
- the chemical-derived vector may be combined with a protein-derived vector created by vectorizing information other than information on the amino acid sequence or may be combined with multiple types of vectors such as chemical-derived vectors created by vectorizing information on physicochemical properties, chemical formulas, structural formulas, and/or three-dimensional structures.
- a method for combining the vectors is not particularly limited. The vectors may be combined by the above-mentioned method.
- a SVM As for a SVM, a commonly available program may be used.
- LIBSVM which is available on the web, may be used (C. C. Chang and C. J. Lin, LIBSVM: a library for support vector machines, 2001. Software available at http://www.csie.ntu.edu.tw/ ⁇ cjlin/libsvm).
- C-SVC C-support vector classification
- v-SVC v-support vector classification
- v-SVC v-support vector classification
- v-SVC v-support vector classification
- v-SVC v-support vector classification
- v-SVC v-support vector classification
- v-SVC v-support vector classification
- v-SVC v-support vector classification
- v-SVC v-support vector classification
- C-SVC C-support vector classification
- LIBSVM recommends that scaling is used for each dimension of input data.
- a SVM is extended for probability estimation.
- probability estimation may be used to predict large-scale combinations such as "combinations of drug groups and large-scale sequence groups". This is because when many candidates of interactions are obtained by large-scale prediction, estimated probabilities can be indexes effective in ranking the candidates in order of priority.
- Using two classes of pairs of proteins and chemicals (a first pair and a second pair), which have different interactions (a first interaction and a second interaction), at least one selected from four parameters is vectorized, the four parameters being the position of a peak in mass spectrum data obtained from each chemical, the position and intensity of the peak, the distance between two peaks, and the distance between two peaks and their corresponding intensities; the amino acid sequence of each protein is vectorized; the vectors are combined; and a SVM is applied to the combined vectors and trained to learn them.
- a pattern classifier discriminating the classes can be configured.
- the pattern classifier is configured on the basis of the mass spectrum data of the chemicals and the amino acid data of the proteins, the pattern classifier can highly correspond to the class of interactions by being trained on the basis of how they interact.
- the Interaction described herein is not particularly limited as long as it occurs between a protein and a chemical, and may be a structural binding that bind them physically, a functional binding that exerts some effect on them, or the like. An embodiment in which they do not interact in a specific way, such as a mode having no bond, is included in the interaction.
- the first and second interactions need not relate to each other and the second interaction is preferably the action that they do not have the second interaction.
- a pair that has not been analyzed for interaction and has not been proven to have the first interaction can be actually regarded as a pair having no first interaction. Therefore, in this specification, such a pair that has not been analyzed for interaction and has not been proven to have the first interaction can be included in the pair having the second interaction.
- the following proteins and chemicals were used: nine types of human AR-family proteins ( FIG. 5 ) having similar structures and 48 chemicals ( FIG. 6 ) which were specified in ARDB (adrenergic receptor database) (http://ardb.bjmu.edu.cn/.) as agonists or antagonists and of which the mass spectrum data was specified in NIST05 (NIST/EPA/NIH mass spectral library) (http://www.nist.gov/.).
- the protein-chemical pairs were classified by a classification method according to the present invention and were analyzed for interaction. Coupling schemes between the chemicals and AR were shown in Fig. 6b .
- pairs (142 pairs) of the chemicals and the proteins that were targets were specified to be positive and pairs (290 pairs) of the chemicals and the proteins that were not any targets were specified to be negative.
- each AR-chemical pair was expressed with a vector (F, G, C lt ) in concatenation expression and discriminating power obtained using different Kernel functions was evaluated on the basis of sensitivity (sens.), precision (prec.), and accuracy (acc.) in 10-fold cross validation.
- each sample was divided into "n” equal parts, whereby "n" groups of datasets were prepared.
- One of the datasets was used as a test set.
- a model was trained to learn the other "n - 1" groups of the datasets.
- the test set was evaluated with the resulting model. This procedure was repeated “n” times, whereby each of the "n” groups of the datasets was evaluated once.
- the datasets were evaluated for sens., prec., and acc.
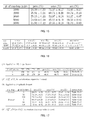
- Discriminating power obtained in such a manner that each protein was vectorized by different vectorizing methods and binding was expressed by concatenation was shown in Fig. 8 . Discriminating power was evaluated in the same manner as that described in Item (1).
- C lt and triclust have the highest accuracy, with the number of dimensions reduced. This shows the effectiveness of a method for linking partial character sequences to physicochemical properties.
- C ld and diclust which are based on the same concept, have low accuracy. This is probably because features important in discrimination are mixed together in the case of 89 dimensions and therefore the discrimination ability thereof is lost.
- C od has higher accuracy.
- C od which has 4200 dimensions, has higher sequence-expressing ability as compared to C od , which has 400 dimensions. The difference in accuracy between C od and C ot shows that there is no direct correlation between complexity in expression and accuracy.
- the fragment vector F and the gap vector G are preferably both taken into account.
- F has higher accuracy and sens. as compared to G; hence, F well expresses features of the chemical and therefore is probably a base for discrimination.
- G has higher prec. as compared to F and (F, G) has higher prec. as compared to G; hence, G has an auxiliary function of increasing prec.
- the accuracy of vectorization by the use of the intensity of a peak in mass spectrum data is higher than that of vectorization by the nonuse of the peak intensity in most cases ( Fig. 9 ).
- the use of F' instead of F causes a significant reduction in accuracy. Therefore, intensity is preferably used to express features of the chemical.
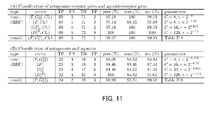
- Results ( Fig. 11A ) obtained by taking protein information into account using any vector are extremely high in accuracy and are higher in accuracy than results ( Fig. 11B ) obtained by taking no protein information into account.
- the drug-target protein pairs were classified with high accuracy using the samples in this example.
- the use of C lt or C od which is a method for vectorizing a protein, tends to provide high accuracy under conditions of this example.
- the use of C od provides higher accuracy.
- the use of combination expression for a method for combining vectors provides high accuracy.
- Pattern classifiers with recording process are obtained with high accuracy under every condition. Optimum conditions vary slightly depending on datasets used.
- pairs of proteins and chemicals acting as receptors and ligands, respectively, were selected from data stored in DrugBank, classified, and then used to evaluate discriminating power.
- this example provides accuracy higher than that obtained in Example 3 in which accuracy involved in interaction, that is, bonding was evaluated. Therefore, a pattern classifier is preferably trained to learn protein-chemical interactions depending on specific modes.
- a matrix Q F a matrix Q G , and a matrix Q C were applied to a fragment vector F, a gap vector G, and a protein vector C, respectively.
- the matrix Q F is as follows (Q G and Q C are as well as Q F and F is exemplified below):
- Q F F 1 F 2 ⁇ F C wherein is the set of all chemicals appearing in a dataset used (for Q C , is the set of all proteins appearing in a dataset used) .
- Fig. 17 shows discriminating power that was obtained in such a manner that features were selected and sequences were determined by applying PCA to the data of AR described in Example 1 and data specified in DrugBank described in Example 3.
- an SVM model trained to learn a DrugBank dataset was used as a pattern classifier to check proteins binding to Cytochrome P450 2El (UniProt P05181) and Monoamine Oxidase A (UniProt ID: P1397) for 519 chemicals in the DrugBank dataset.
- the accuracy of predicting the chemicals binding to Cytochrome P450 2El and that of predicting the chemicals binding to Monoamine Oxidase A were 92.29% and 94.61%, respectively. This shows that binding chemicals can be selected from chemical libraries.
- the following methods can be provided: a comprehensive method for classifying a pair of a protein and a chemical using versatile, readily available data and a method for predicting an unknown interaction between pairs using the classifying method.
Landscapes
- Engineering & Computer Science (AREA)
- Physics & Mathematics (AREA)
- Health & Medical Sciences (AREA)
- Life Sciences & Earth Sciences (AREA)
- Medical Informatics (AREA)
- Bioinformatics & Cheminformatics (AREA)
- Theoretical Computer Science (AREA)
- Bioinformatics & Computational Biology (AREA)
- Data Mining & Analysis (AREA)
- Spectroscopy & Molecular Physics (AREA)
- General Health & Medical Sciences (AREA)
- Evolutionary Biology (AREA)
- Biophysics (AREA)
- Biotechnology (AREA)
- Bioethics (AREA)
- Computer Vision & Pattern Recognition (AREA)
- Software Systems (AREA)
- Public Health (AREA)
- Evolutionary Computation (AREA)
- Epidemiology (AREA)
- Databases & Information Systems (AREA)
- Artificial Intelligence (AREA)
- Chemical & Material Sciences (AREA)
- Analytical Chemistry (AREA)
- Genetics & Genomics (AREA)
- Molecular Biology (AREA)
- Proteomics, Peptides & Aminoacids (AREA)
- Investigating Or Analysing Biological Materials (AREA)
- Other Investigation Or Analysis Of Materials By Electrical Means (AREA)
Applications Claiming Priority (2)
| Application Number | Priority Date | Filing Date | Title |
|---|---|---|---|
| JP2006297111 | 2006-10-31 | ||
| PCT/JP2007/071236 WO2008053924A1 (fr) | 2006-10-31 | 2007-10-31 | Procédé de classement de paires de protéines/composés |
Publications (1)
| Publication Number | Publication Date |
|---|---|
| EP2083265A1 true EP2083265A1 (de) | 2009-07-29 |
Family
ID=39344265
Family Applications (1)
| Application Number | Title | Priority Date | Filing Date |
|---|---|---|---|
| EP07830970A Withdrawn EP2083265A1 (de) | 2006-10-31 | 2007-10-31 | Verfahren zur klassifizierung von protein/verbindung-paaren |
Country Status (4)
| Country | Link |
|---|---|
| US (1) | US8185321B2 (de) |
| EP (1) | EP2083265A1 (de) |
| JP (1) | JP5211347B2 (de) |
| WO (1) | WO2008053924A1 (de) |
Cited By (3)
| Publication number | Priority date | Publication date | Assignee | Title |
|---|---|---|---|---|
| CN103577722A (zh) * | 2013-11-08 | 2014-02-12 | 中国人民解放军国防科学技术大学 | 预测蛋白质之间信号流走向的方法 |
| CN104615911A (zh) * | 2015-01-12 | 2015-05-13 | 上海交通大学 | 基于稀疏编码及链学习预测膜蛋白beta-barrel跨膜区域的方法 |
| CN106528668A (zh) * | 2016-10-23 | 2017-03-22 | 哈尔滨工业大学深圳研究生院 | 一种基于可视化网络的二阶代谢质谱化合物检测方法 |
Families Citing this family (7)
| Publication number | Priority date | Publication date | Assignee | Title |
|---|---|---|---|---|
| EP2031528A4 (de) * | 2006-05-26 | 2009-06-17 | Univ Kyoto | Schätzung der proteinverbindungswechselwirkung und rationaler entwurf einer verbindungsbibliothek auf der basis chemischer genomischer informationen |
| JP5946045B2 (ja) * | 2012-08-27 | 2016-07-05 | 国立大学法人京都大学 | 化合物設計装置、化合物設計方法、及びコンピュータプログラム |
| CN105354440B (zh) * | 2015-08-12 | 2019-06-21 | 中国科学技术大学 | 一种提取蛋白质-小分子相互作用模块的方法 |
| US10515715B1 (en) | 2019-06-25 | 2019-12-24 | Colgate-Palmolive Company | Systems and methods for evaluating compositions |
| CN110488020B (zh) * | 2019-08-09 | 2022-12-13 | 山东大学 | 一种蛋白质糖化位点鉴定方法 |
| US12159227B2 (en) | 2020-03-13 | 2024-12-03 | Korea University Research And Business Foundation | System for predicting optical properties of molecules based on machine learning and method thereof |
| US20250054571A1 (en) * | 2021-09-27 | 2025-02-13 | Boe Technology Group Co., Ltd. | Method and apparatus for predicting rna-protein interaction, medium and electronic device |
Family Cites Families (4)
| Publication number | Priority date | Publication date | Assignee | Title |
|---|---|---|---|---|
| US6909981B2 (en) * | 2003-01-27 | 2005-06-21 | Ciphergen Biosystems, Inc. | Data management system and method for processing signals from sample spots |
| US20040236603A1 (en) * | 2003-05-22 | 2004-11-25 | Biospect, Inc. | System of analyzing complex mixtures of biological and other fluids to identify biological state information |
| DE102005018811B4 (de) | 2005-04-22 | 2008-02-21 | Siemens Ag | Blendenvorrichtung für eine zur Abtastung eines Objektes vorgesehene Röntgeneinrichtung und Verfahren für eine Blendenvorrichtung |
| EP2031528A4 (de) * | 2006-05-26 | 2009-06-17 | Univ Kyoto | Schätzung der proteinverbindungswechselwirkung und rationaler entwurf einer verbindungsbibliothek auf der basis chemischer genomischer informationen |
-
2007
- 2007-10-31 US US12/447,814 patent/US8185321B2/en not_active Expired - Fee Related
- 2007-10-31 WO PCT/JP2007/071236 patent/WO2008053924A1/ja not_active Ceased
- 2007-10-31 JP JP2008542157A patent/JP5211347B2/ja not_active Expired - Fee Related
- 2007-10-31 EP EP07830970A patent/EP2083265A1/de not_active Withdrawn
Non-Patent Citations (1)
| Title |
|---|
| See references of WO2008053924A1 * |
Cited By (7)
| Publication number | Priority date | Publication date | Assignee | Title |
|---|---|---|---|---|
| CN103577722A (zh) * | 2013-11-08 | 2014-02-12 | 中国人民解放军国防科学技术大学 | 预测蛋白质之间信号流走向的方法 |
| CN103577722B (zh) * | 2013-11-08 | 2016-07-06 | 中国人民解放军国防科学技术大学 | 预测蛋白质之间信号流走向的方法 |
| CN104615911A (zh) * | 2015-01-12 | 2015-05-13 | 上海交通大学 | 基于稀疏编码及链学习预测膜蛋白beta-barrel跨膜区域的方法 |
| CN104615911B (zh) * | 2015-01-12 | 2017-07-18 | 上海交通大学 | 基于稀疏编码及链学习预测膜蛋白beta‑barrel跨膜区域的方法 |
| CN106528668A (zh) * | 2016-10-23 | 2017-03-22 | 哈尔滨工业大学深圳研究生院 | 一种基于可视化网络的二阶代谢质谱化合物检测方法 |
| WO2018072306A1 (zh) * | 2016-10-23 | 2018-04-26 | 哈尔滨工业大学深圳研究生院 | 一种基于可视化网络的二阶代谢质谱化合物检测方法 |
| CN106528668B (zh) * | 2016-10-23 | 2018-12-25 | 哈尔滨工业大学深圳研究生院 | 一种基于可视化网络的二阶代谢质谱化合物检测方法 |
Also Published As
| Publication number | Publication date |
|---|---|
| JPWO2008053924A1 (ja) | 2010-02-25 |
| JP5211347B2 (ja) | 2013-06-12 |
| US20100070438A1 (en) | 2010-03-18 |
| US8185321B2 (en) | 2012-05-22 |
| WO2008053924A1 (fr) | 2008-05-08 |
Similar Documents
| Publication | Publication Date | Title |
|---|---|---|
| US8185321B2 (en) | Method for predicting interaction between protein and chemical | |
| Northey et al. | IntPred: a structure-based predictor of protein–protein interaction sites | |
| Saigo et al. | Protein homology detection using string alignment kernels | |
| US8949157B2 (en) | Estimation of protein-compound interaction and rational design of compound library based on chemical genomic information | |
| Ben-Hur et al. | Kernel methods for predicting protein–protein interactions | |
| Kuznetsov et al. | Using evolutionary and structural information to predict DNA‐binding sites on DNA‐binding proteins | |
| Troyanskaya | Putting microarrays in a context: integrated analysis of diverse biological data | |
| Kowiel et al. | Automatic recognition of ligands in electron density by machine learning | |
| Yugandhar et al. | Feature selection and classification of protein–protein complexes based on their binding affinities using machine learning approaches | |
| Kountouris et al. | Prediction of backbone dihedral angles and protein secondary structure using support vector machines | |
| Erjavac et al. | Coupled encoding methods for antimicrobial peptide prediction: how sensitive is a highly accurate model? | |
| Manfredi et al. | DeepREx-WS: A web server for characterising protein–solvent interaction starting from sequence | |
| Weis et al. | Data mining PubChem using a support vector machine with the Signature molecular descriptor: classification of factor XIa inhibitors | |
| Zhang et al. | PreAlgPro: prediction of allergenic proteins with pre-trained protein language model and efficient neutral network | |
| Jia et al. | A comprehensive review of protein-centric predictors for biomolecular interactions: from proteins to nucleic acids and beyond | |
| Ruan et al. | Improving prediction of heterodimeric protein complexes using combination with pairwise kernel | |
| Grigas et al. | Using physical features of protein core packing to distinguish real proteins from decoys | |
| Arowolo et al. | A dimensional reduced model for the classification of RNA-seq Anopheles gambiae data | |
| Ali et al. | Interpretable machine learning identification of arginine methylation sites | |
| Regad et al. | A Hidden Markov Model applied to the protein 3D structure analysis | |
| Holloway et al. | Machine learning for regulatory analysis and transcription factor target prediction in yeast | |
| Feng et al. | Using a low correlation high orthogonality feature set and machine learning methods to identify plant pentatricopeptide repeat coding gene/protein | |
| Klon | Bayesian modeling in virtual high throughput screening | |
| Hu et al. | Recognition of β-hairpin motifs in proteins by using the composite vector | |
| Sonavane et al. | Prediction of active site cleft using support vector machines |
Legal Events
| Date | Code | Title | Description |
|---|---|---|---|
| PUAI | Public reference made under article 153(3) epc to a published international application that has entered the european phase |
Free format text: ORIGINAL CODE: 0009012 |
|
| 17P | Request for examination filed |
Effective date: 20090601 |
|
| AK | Designated contracting states |
Kind code of ref document: A1 Designated state(s): AT BE BG CH CY CZ DE DK EE ES FI FR GB GR HU IE IS IT LI LT LU LV MC MT NL PL PT RO SE SI SK TR |
|
| DAX | Request for extension of the european patent (deleted) | ||
| STAA | Information on the status of an ep patent application or granted ep patent |
Free format text: STATUS: THE APPLICATION IS DEEMED TO BE WITHDRAWN |
|
| 18D | Application deemed to be withdrawn |
Effective date: 20140501 |