EP2107470A2 - Bestimmung des Wendepunktes eines PCT-Graphen mittels quadratischem Test zur Kurvenanalyse einer Doppelsigmoidfunktion - Google Patents
Bestimmung des Wendepunktes eines PCT-Graphen mittels quadratischem Test zur Kurvenanalyse einer Doppelsigmoidfunktion Download PDFInfo
- Publication number
- EP2107470A2 EP2107470A2 EP08016729A EP08016729A EP2107470A2 EP 2107470 A2 EP2107470 A2 EP 2107470A2 EP 08016729 A EP08016729 A EP 08016729A EP 08016729 A EP08016729 A EP 08016729A EP 2107470 A2 EP2107470 A2 EP 2107470A2
- Authority
- EP
- European Patent Office
- Prior art keywords
- curve
- data set
- value
- pcr
- data
- Prior art date
- Legal status (The legal status is an assumption and is not a legal conclusion. Google has not performed a legal analysis and makes no representation as to the accuracy of the status listed.)
- Granted
Links
Images


Classifications
-
- G—PHYSICS
- G06—COMPUTING OR CALCULATING; COUNTING
- G06F—ELECTRIC DIGITAL DATA PROCESSING
- G06F17/00—Digital computing or data processing equipment or methods, specially adapted for specific functions
- G06F17/10—Complex mathematical operations
- G06F17/18—Complex mathematical operations for evaluating statistical data, e.g. average values, frequency distributions, probability functions, regression analysis
-
- C—CHEMISTRY; METALLURGY
- C12—BIOCHEMISTRY; BEER; SPIRITS; WINE; VINEGAR; MICROBIOLOGY; ENZYMOLOGY; MUTATION OR GENETIC ENGINEERING
- C12Q—MEASURING OR TESTING PROCESSES INVOLVING ENZYMES, NUCLEIC ACIDS OR MICROORGANISMS; COMPOSITIONS OR TEST PAPERS THEREFOR; PROCESSES OF PREPARING SUCH COMPOSITIONS; CONDITION-RESPONSIVE CONTROL IN MICROBIOLOGICAL OR ENZYMOLOGICAL PROCESSES
- C12Q1/00—Measuring or testing processes involving enzymes, nucleic acids or microorganisms; Compositions therefor; Processes of preparing such compositions
- C12Q1/68—Measuring or testing processes involving enzymes, nucleic acids or microorganisms; Compositions therefor; Processes of preparing such compositions involving nucleic acids
- C12Q1/6844—Nucleic acid amplification reactions
- C12Q1/686—Polymerase chain reaction [PCR]
Definitions
- the present invention relates generally to systems and methods for processing data representing sigmoid or growth curves.
- the present invention relates to determining whether the data for a growth curve represents or exhibits valid or significant growth, and if so determining characteristic transition values such as elbow values in sigmoid or growth-type curves such as a Polymerase Chain Reaction curve.
- PCR Polymerase Chain Reaction
- the Polymerase Chain Reaction is an in vitro method for enzymatically synthesizing or amplifying defined nucleic acid sequences.
- the reaction typically uses two oligonucleotide primers that hybridize to opposite strands and flank a template or target DNA sequence that is to be amplified. Elongation of the primers is catalyzed by a heat-stable DNA polymerase. A repetitive series of cycles involving template denaturation, primer annealing, and extension of the annealed primers by the polymerase results in an exponential accumulation of a specific DNA fragment.
- Fluorescent probes or markers are typically used in the process to facilitate detection and quantification of the amplification process.
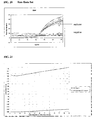
- FIG. 1 A typical real-time PCR curve is shown in FIG. 1 , where fluorescence intensity values are plotted vs. cycle number for a typical PCR process.
- the amplification is usually measured in thermocyclers which include components and devices for measuring fluorescence signals during the amplification reaction.
- An example of such a thermocycler is the Roche Diagnostics LightCycler (Cat. No. 20110468).
- the amplification products are, for example, detected by means of fluorescent labeled hybridization probes which only emit fluorescence signals when they are bound to the target nucleic acid or in certain cases also by means of fluorescent dyes that bind to double-stranded DNA.
- identifying a transition point at the end of the baseline region which is referred to commonly as the elbow value or cycle threshold (Ct) value, is extremely useful for understanding characteristics of the PCR amplification process.
- the Ct value may be used as a measure of efficiency of the PCR process. For example, typically a defined signal threshold is determined for all reactions to be analyzed and the number of cycles (Ct) required to reach this threshold value is determined for the target nucleic acid as well as for reference nucleic acids such as a standard or housekeeping gene.
- the absolute or relative copy numbers of the target molecule can be determined on the basis of the Ct values obtained for the target nucleic acid and the reference nucleic acid ( Gibson et al., Genome Research 6:995-1001 ; Bieche et al., Cancer Research 59:2759-2765, 1999 ; WO 97/46707 ; WO 97/46712 ; WO 97/46714 ).
- the elbow value in region 20 at the end of the baseline region 15 in FIG. 1 would be in the region of cycle number 30.
- the elbow value in a PCR curve can be determined using several existing methods. For example, various current methods determine the actual value of the elbow as the value where the fluorescence reaches a predetermined level called the AFL (arbitrary fluorescence value). Other current methods might use the cycle number where the second derivative of fluorescence vs. cycle number reaches a maximum. All of these methods have drawbacks. For example, some methods are very sensitive to outlier (noisy) data, and the AFL value approach does not work well for data sets with high baselines. Traditional methods to determine the baseline stop (or end of the baseline) for the growth curve shown in FIG. 1 may not work satisfactorily, especially in a high titer situation. Furthermore, these algorithms typically have many parameters (e.g., 50 or more) that are poorly defined, linearly dependent, and often very difficult, if not impossible, to optimize.
- parameters e.g., 50 or more
- the present invention provides novel, efficient systems and methods for determining whether the data for a growth curve represents or exhibits valid or significant growth, and if so determining characteristic transition values such as elbow values in sigmoid or growth-type curves.
- the systems and methods of the present invention are particularly useful for determining the cycle threshold (Ct) value in PCR amplification curves.
- a dataset representing a sigmoid or growth-type curve is processed to determine whether the data exhibits significant or valid growth.
- a first or a second degree polynomial curve that fits the data is determined, and a statistical significance value for the curve fit is determined. If the significance value exceeds a significance threshold, the data is considered to not represent significant or valid growth. If the data does not represent significant or valid growth, the data set may be discarded. If the significance value does not exceed the significance threshold, the data is considered to represent significant or valid growth. If the data set is determined to represent valid growth, the data is further processed to determine a transition value in the sigmoid or growth curve, such as the end of the baseline region or the elbow value or Ct value of a PCR amplification curve.
- a double sigmoid function with parameters determined by a Levenberg-Marquardt (LM) regression process is used to find an approximation to the curve that fits the dataset.
- the curve can be normalized using one or more of the determined parameters.
- the normalized curve is processed to determine the curvature of the curve at some or all points along the curve, e.g., to produce a dataset or plot representing the curvature vs. the cycle number for a PCR dataset.
- the cycle number at which the maximum curvature occurs corresponds to the Ct value for a PCR dataset.
- the curvature and/or the Ct value is then returned and may be displayed or otherwise used for further processing.
- a computer implemented method for determining whether data for a growth process exhibits significant growth.
- the method typically includes receiving a data set representing a growth process, the data set including a plurality of data points, each data point having a pair of coordinate values, and calculating a curve that fits the data set, the curve including one of a first or second degree polynomial.
- the method also typically includes determining a statistical significance value for the curve, determining whether the significance value exceeds a threshold, and if not, processing the data set further, and if so, indicating that the data set does not have significant growth and/or discarding the data set.
- the growth process is a Polymerase Chain Reaction (PCR) process.
- processing the data set further may include determining a cycle threshold (Ct) value of the PCR data set.
- the curve is an amplification curve for a kinetic Polymerase Chain Reaction (PCR) process, and a point at the end of the baseline region represents the elbow or cycle threshold (Ct) value for the kinetic PCR curve.
- the curve is processed to determine the curvature at some or all points along the curve, wherein the point with maximum curvature represents the Ct value.
- a received dataset includes a dataset that has been processed to remove one or more outliers or spike points.
- the statistical significance value is an R 2 value, and the threshold is greater than about 0.90.
- the statistical significance value is an R 2 value
- the threshold is about 0.99.
- the method further includes normalizing the data set prior to calculating a curve that fits the data set.
- determining the Ct value includes calculating an approximation of a curve that fits the data set by applying a Levenberg-Marquardt (LM) regression process to a double sigmoid function to determine parameters of the function; normalizing the curve using the determined parameters to produce a normalized curve; and processing the normalized curve to determine a point of maximum curvature, wherein the point of maximum curvature represents the Ct value of the PCR curve.
- LM Levenberg-Marquardt
- a computer-readable medium including code for controlling a processor to determine whether data for a growth process exhibits significant growth.
- the code typically includes instructions to receive a data set representing a growth process, the data set including a plurality of data points, each data point having a pair of coordinate values, and calculate a curve that fits the data set, the curve including one of a first or second degree polynomial.
- the code also typically includes instructions to determine a statistical significance value for the curve, determine whether the significance value exceeds a threshold, and if not, process the data set further, and if so, indicate that the data set does not have significant growth and/or discard the data set.
- the growth process is a Polymerase Chain Reaction (PCR) process.
- the computer readable medium may further include instructions to determine a cycle threshold (Ct) value of the PCR data set.
- the curve is an amplification curve for a kinetic Polymerase Chain Reaction (PCR) process, and a point at the end of a baseline region represents the elbow or cycle threshold (Ct) value for the kinetic PCR curve.
- the curve is processed to determine the curvature at some or all points along the curve, wherein the point with maximum curvature represents the Ct value.
- the statistical significance value is an R 2 value, and the threshold is greater than about 0.90. In one aspect, the statistical significance value is an R 2 value, and the threshold is about 0.99.
- the instructions to determine the Ct value include instructions to calculate an approximation of a curve that fits the data set by applying a Levenberg-Marquardt (LM) regression process to a double sigmoid function to determine parameters of the function; to normalize the curve using the determined parameters to produce a normalized curve; and to process the normalized curve to determine a point of maximum curvature, wherein the point of maximum curvature represents the Ct value of the PCR curve.
- the code further includes instructions to normalize the data set prior to calculating a curve that fits the data set.
- the code further includes instructions to output data representing the Ct value when the growth process is a PCR process.
- a kinetic Polymerase Chain Reaction (PCR) system typically includes a kinetic PCR analysis module that generates a PCR dataset representing a kinetic PCR amplification curve, the dataset including a plurality of data points, each having a pair of coordinate values, wherein the dataset includes data points in a region of interest which includes a cycle threshold (Ct) value, and an intelligence module adapted to whether the PCR data set exhibits significant growth.
- the intelligence module typically processes the PCR dataset by calculating a curve that fits the PCR data set, the curve including one of a first or second degree polynomial, and determining a statistical significance value for the curve.
- the intelligence module also typically processes the PCR dataset by determining whether the significance value exceeds a threshold, and if not, processing the PCR data set further, and if so, indicating that the PCR data set does not have significant growth and/or discarding the PCR data set.
- processing the data set further includes determining a cycle threshold (Ct) value of the PCR data set.
- Ct cycle threshold
- the curve is thereby processed to determine the curvature at some or all points along the curve, wherein the point with maximum curvature represents the Ct value.
- determining the Ct value includes calculating an approximation of a curve that fits the data set by applying a Levenberg-Marquardt (LM) regression process to a double sigmoid function to determine parameters of the function; normalizing the curve using the determined parameters to produce a normalized curve; and processing the normalized curve to determine a point of maximum curvature, wherein the point of maximum curvature represents the Ct value of the PCR curve.
- LM Levenberg-Marquardt
- the statistical significance value is an R 2 value
- the threshold is greater than about 0.90.
- the statistical significance value is an R 2 value
- the threshold is about 0.99.
- the intelligence module is further adapted to normalize the data set prior to calculating a curve that fits the data set.
- the kinetic PCR analysis module is resident in a kinetic thermocycler device and includes a processor communicably coupled to the analysis module.
- the intelligence module includes a processor resident in a computer system coupled to the analysis module by one of a network connection or a direct connection.
- the present invention provides systems and methods for determining whether data representing a sigmoid or growth-type curve exhibits significant growth.
- a first or a second degree polynomial curve that fits the data is determined, and a statistical significance value for the curve fit is determined. If the significance value exceeds a significance threshold, the data is considered to not represent significant or valid growth. If the data does not represent significant or valid growth, the data set may be discarded. If the significance value does not exceed the significance threshold, the data is considered to represent significant or valid growth. If the data set is determined to represent valid growth, the data is further processed to determine a transition value in the sigmoid or growth curve, such as the end of the baseline region or the elbow value or Ct value of a PCR amplification curve.
- a double sigmoid function with parameters determined by a Levenberg-Marquardt (LM) regression process is used to find an approximation to the curve.
- the curve can be normalized using one or more of the determined parameters.
- the normalized curve is processed to determine the curvature of the curve at some or all points along the curve, e.g., to produce a dataset or plot representing the curvature vs. the cycle number.
- the cycle number at which the maximum curvature occurs corresponds to the Ct value.
- the Ct value is then returned and may be displayed or otherwise used for further processing.
- the method may be implemented by using conventional personal computer systems including, but not limited to, an input device to input a data set, such as a keyboard, mouse, and the like; a display device to represent a specific point of interest in a region of a curve, such as a monitor; a processing device necessary to carry out each step in the method, such as a CPU; a network interface such as a modem, a data storage device to store the data set, a computer code running on the processor and the like.
- the method may also be implemented in a PCR device.
- Figure 24 shows a general block diagram explaining the relation between the software and hardware resources.
- the system may comprise a kinetic PCR analysis module which is located in a thermocycler device and an intelligence module which is part of the computer system.
- the data sets (PCR data sets) are transferred from the analysis module to the intelligence module or vice versa via a network connection or a direct connection.
- the data sets are processed according to the method as displayed in Fig. 2 or 9 by computer code running on the processor and being stored on the storage device of the intelligence module and after processing transferred back to the storage device of the analysis module, where the modified data may be displayed on a displaying device.
- FIG. 1 One example of a growth or amplification curve 10 in the context of a PCR process is shown in FIG. 1 .
- the curve 10 includes a lag phase region 15, and an exponential phase region 25.
- Lag phase region 15 is commonly referred to as the baseline or baseline region.
- Such a curve 10 includes a transitionary region of interest 20 linking the lag phase and the exponential phase regions.
- Region 20 is commonly referred to as the elbow or elbow region.
- the elbow region typically defines an end to the baseline and a transition in the growth or amplification rate of the underlying process. Identifying a specific transition point in region 20 can be useful for analyzing the behavior of the underlying process. In a typical PCR curve, identifying a transition point referred to as the elbow value or cycle threshold (Ct) value is useful for understanding efficiency characteristics of the PCR process.
- Ct cycle threshold
- SDA strand displacement amplification
- NASBA nucleic acid sequence-based amplification
- TMA transcription mediated amplification
- data for a typical PCR growth curve can be represented in a two-dimensional coordinate system, for example, with PCR cycle number defining the x-axis and an indicator of accumulated polynucleotide growth defining the y-axis.
- the indicator of accumulated growth is a fluorescence intensity value as the use of fluorescent markers is perhaps the most widely used labeling scheme. However, it should be understood that other indicators may be used depending on the particular labeling and/or detection scheme used.
- Examples of other useful indicators of accumulated signal growth include luminescence intensity, chemiluminescence intensity, bioluminescence intensity, phosphorescence intensity, charge transfer, voltage, current, power, energy, temperature, viscosity, light scatter, radioactive intensity, reflectivity, transmittance and absorbance.
- the definition of cycle can also include time, process cycles, unit operation cycles and reproductive cycles.
- step 110 an experimental data set representing the curve is received or otherwise acquired.
- An example of a plotted PCR data set is shown in FIG. 1 , where the y-axis and x-axis represent fluorescence intensity and cycle number, respectively, for a PCR curve.
- the data set should include data that is continuous and equally spaced along an axis.
- the data set may be provided to the intelligence module in real time as the data is being collected, or it may be stored in a memory unit or buffer and provided to the intelligence module after the experiment has been completed.
- the data set may be provided to a separate system such as a desktop computer system or other computer system, via a network connection (e.g., LAN, VPN, intranet, Internet, etc.) or direct connection (e.g., USB or other direct wired or wireless connection) to the acquiring device, or provided on a portable medium such as a CD, DVD, floppy disk or the like.
- a network connection e.g., LAN, VPN, intranet, Internet, etc.
- direct connection e.g., USB or other direct wired or wireless connection
- the data set includes data points having a pair of coordinate values (or a 2-dimensional vector).
- the pair of coordinate values typically represents the cycle number and the fluorescence intensity value.
- step 120 an approximation of the curve is calculated.
- a double sigmoid function with parameters determined by a Levenberg-Marquardt (LM) regression process or other regression process is used to find an approximation of a curve representing the data set.
- the approximation is said to be "robust" as outlier or spike points have a minimal effect on the quality of the curve fit.
- FIG. 13 which will be discussed below, illustrates an example of a plot of a received data set and a robust approximation of the data set determined by using a Levenberg-Marquardt regression process to determine the parameters of a double sigmoid function according to the present invention.
- outlier or spike points in the dataset are removed or replaced prior to processing the data set to determine the end of the baseline region.
- Spike removal may occur before or after the dataset is acquired in step 110.
- FIG. 3 illustrates the process flow for identifying and replacing spike points in datasets representing PCR or other growth curves. A more detailed description of a process for determining and removing or replacing spike points can be found in US 2007-0148632 .
- step 130 the parameters determined in step 120 are used to normalize the curve, e.g., to remove the baseline slope, as will be described in more detail below. Normalization in this manner allows for determining the Ct value without having to determine or specify the end of the baseline region of the curve or a baseline stop position.
- step 140 the normalized curve is then processed to determine the Ct value as will be discussed in more detail below.
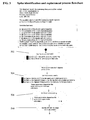
- Steps 502 through 524 of FIG. 3 illustrate a process flow for approximating the curve of a dataset and determining the parameters of a fit function (step 120). These parameters can be used in normalizing the curve, e.g., modifying or removing the baseline slope of the data set representing a sigmoid or growth type curve such as a PCR curve according to one embodiment of the present invention (step 130). Where the dataset has been processed to produce a modified dataset with removed or replaced spike points, the modified spikeless dataset may be processed according to steps 502 through 524 to identify the parameters of the fit function.
- a Levenberg-Marquardt (LM) method is used to calculate a robust curve approximation of a data set.
- the LM method is a non-linear regression process; it is an iterative technique that minimizes the distance between a non-linear function and a data set.
- the process behaves like a combination of a steepest descent process and a Gauss-Newton process: when the current approximation doesn't fit well it behaves like the steepest descent process (slower but more reliable convergence), but as the current approximation becomes more accurate it will then behave like the Gauss-Newton process (faster but less reliable convergence).
- the LM regression method is widely used to solve non-linear regression problems.
- the LM regression method includes an algorithm that requires various inputs and provides output.
- the inputs include a data set to be processed, a function that is used to fit the data, and an initial guess for the parameters or variables of the function.
- the output includes a set of parameters for the function that minimizes the distance between the function and the data set.
- f x a + bx + c 1 + exp - d ⁇ x - c ⁇ 1 + exp - f ⁇ x - g .
- the double sigmoid equation (1) has 7 parameters: a, b, c, d, e, f and g.
- the equation can be decomposed into a sum of a constant, a slope and a double sigmoid.
- the double sigmoid itself is the multiplication of two sigmoids.
- FIG. 4 illustrates a decomposition of the double sigmoid equation (1).
- the parameters d, e, f and g determine the shape of the two sigmoids.
- the "sharpness" parameters d and f of the double sigmoid equation should be constrained in order to prevent the curve from taking unrealistic shapes. Therefore, in one aspect, any iterations where d ⁇ -1 or d > 1.1 or where f ⁇ -1 or f > 1.1 is considered unsuccessful. In other aspects, different constraints on parameters d and f may be used.
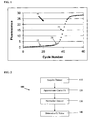
- the Levenberg-Marquardt algorithm is an iterative algorithm, an initial guess for the parameters of the function to fit is typically needed. The better the initial guess, the better the approximation will be and the less likely it is that the algorithm will converge towards a local minimum. Due to the complexity of the double sigmoid function and the various shapes of PCR curves or other growth curves, one initial guess for every parameter may not be sufficient to prevent the algorithm from sometimes converging towards local minima. Therefore, in one aspect, multiple (e.g., three or more) sets of initial parameters are input and the best result is kept. In one aspect, most of the parameters are held constant across the multiple sets of parameters used; only parameters c, d and f may be different for each of the multiple parameter sets. FIG. 6 shows an example of the three curve shapes for the different parameter sets. The choice of these three sets of parameters is indicative of three possible different shapes of curves representing PCR data. It should be understood that more than three sets of parameters may be processed and the best result kept.
- the initial input parameters of the LM method are identified in step 510. These parameters may be input by an operator or calculated. According to one aspect, the parameters are determined or set according to steps 502, 504 and 506 as discussed below.
- the parameter (a) is the height of the baseline; its value is the same for all sets of initial parameters.
- the parameter (a) is assigned the 3rd lowest y-axis value, e.g., fluorescence value, from the data set. This provides for a robust calculation.
- the parameter (a) may be assigned any other fluorescence value as desired such as the lowest y-axis value, second lowest value, etc.
- the parameter (b) is the slope of the baseline and plateau. Its value is the same for all sets of initial parameters. In one aspect, in step 502 a static value of 0.01 is assigned to (b) as ideally there shouldn't be any slope. In other aspects, the parameter (b) may be assigned a different value, for example, a value ranging from 0 to about 0.5.
- the parameter (c) represents the height of the plateau minus the height of the baseline, which is denoted as the absolute fluorescence increase, or AFI.
- AFI the absolute fluorescence increase
- the parameters (d) and (f) define the sharpness of the two sigmoids. As there is no way of giving an approximation based on the curve for these parameters, in one aspect three static representative values are used in step 502. It should be understood that other static or non-static values may be used for parameters (d) and/or (f). These pairs model the most common shapes on PCR curves encountered. Table 2, below, shows the values of (d) and (f) for the different sets of parameters as shown in FIG. 6 . Table 2: Values of parameters d and f Parameter set number Value of d Value of f 1 0.1 0.7 2 1.0 0.4 3 0.35 0.25
- the parameters (e) and (g) are determined.
- the parameters (e) and (g) define the inflexion points of the two sigmoids. In one aspect, they both take the same value across all the initial parameter sets. Parameters (e) and (g) may have the same or different values.
- the x-value of the first point above the mean of the intensity, e.g., fluorescence, (which isn't a spike) is used.
- a process for determining the value of (e) and (g) according to this aspect is shown in FIG. 7 and discussed below. A more detailed description of the process for determining the value of the parameters (e) and (g), and other parameters, according to this aspect can be found in US 2007-0148632 .
- the mean of the curve (e.g., fluorescence intensity) is determined.
- the first data point above the mean is identified. It is then determined whether:
- Table 3 shows examples of initial parameter values as used in FIG. 6 according to one aspect.
- a LM process 520 is executed using the input data set, function and parameters.
- the Levenberg-Marquardt method is used to solve non-linear least-square problems.
- the traditional LM method calculates a distance measure defined as the sum of the square of the errors between the curve approximation and the data set.
- it gives outliers an important weight as their distance is larger than the distance of non-spiky data points, often resulting in inappropriate curves or less desirable curves.
- the distance between the approximation and the data set is computed by minimizing the sum of absolute errors as this does not give as much weight to the outliers.
- each of the multiple (e.g., three) sets of initial parameters are input and processed and the best result is kept as shown in steps 522 and 524, where the best result is the parameter set that provides the smallest or minimum distance in equation (3).
- most of the parameters are held constant across the multiple sets of parameters; only c, d and f may be different for each set of parameters. It should be understood that any number of initial parameter sets may be used.
- FIG. 8 illustrates a process flow of LM process 520 for a set of parameters according to the present invention.
- the Levenberg-Marquardt method can behave either like a steepest descent process or like a Gauss-Newton process. Its behavior depends on a damping factor ⁇ . The larger ⁇ is, the more the Levenberg-Marquardt algorithm will behave like the steepest descent process. On the other hand, the smaller ⁇ is, the more the Levenberg-Marquardt algorithm will behave like the Gauss-Newton process.
- ⁇ is initiated at 0.001. It should be appreciated that ⁇ may be initiated at any other value, such as from about 0.000001 to about 1.0.
- the Levenberg-Marquardt method is an iterative technique. According to one aspect, as shown in FIG. 8 the following is done during each iteration:
- the LM process of FIG. 8 iterates until one of the following criteria is achieved:
- the curve is normalized (step 130) using one or more of the determined parameters.
- the curve may be normalized or adjusted to have zero baseline slope by subtracting out the linear growth portion of the curve.
- dataNew BLS data - a + bx
- dataNew(BLS) is the normalized signal after baseline subtraction, e.g., the data set (data) with the linear growth or baseline slope subtracted off or removed.
- the values of parameters a and b are those values determined by using the LM equation to regress the curve, and x is the cycle number.
- the constant a and the slope b times the x value is subtracted from the data to produce a data curve with a zero baseline slope.
- spike points are removed from the dataset prior to applying the LM regression process to the dataset to determine normalization parameters.
- the value of parameters a and b are those values determined by using the LM equation to regress the curve, and x is the cycle number.
- the constant a and the slope b times the x value is subtracted from the data and the result divided by the value of parameter a to produce a data curve with a zero baseline slope.
- spike points are removed from the dataset prior to applying the LM regression process to the dataset to determine normalization parameters.
- the values are the parameters a and b are those values determined by using the LM equation to regress to curve, and x is the cycle number.
- spike points are removed from the dataset prior to applying the LM regression process to the dataset to determine normalization parameters.
- dataNew(PGT) is the normalized signal after baseline subtraction with division, e.g., the data set (data) with the linear growth or baseline slope subtracted off or removed and the result divided by c.
- the value of parameters a, b and c are those values determined by using the LM equation to regress the curve, and x is the cycle number.
- the constant a and the slope b times the x value is subtracted from the data and the result divided by the value of parameter c to produce a data curve with a zero baseline slope.
- spike points are removed from the dataset prior to applying the LM regression process to the dataset to determine normalization parameters.
- the Ct value can be determined.
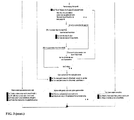
- a curvature determination process or method is applied to the normalized curve as will be described with reference to FIG. 9 , which shows a process flow for determining the elbow value or Ct value in a kinetic PCR curve.
- the data set is acquired.
- the determination process is implemented in an intelligence module (e.g., processor executing instructions) resident in a PCR data acquiring device such as a thermocycler
- the data set may be provided to the intelligence module in real time as the data is being collected, or it may be stored in a memory unit or buffer and provided to the module after the experiment has been completed.
- the data set may be provided to a separate system such as a desktop computer system via a network connection (e.g., LAN, VPN, intranet, Internet, etc. ) or direct connection (e.g., USB or other direct wired or wireless connection) to the acquiring device, or provided on a portable medium such as a CD, DVD, floppy disk or the like.
- a network connection e.g., LAN, VPN, intranet, Internet, etc.
- direct connection e.g., USB or other direct wired or wireless connection
- portable medium such as a CD, DVD, floppy disk or the like.
- step 920 an approximation to the curve is determined.
- a double sigmoid function with parameters determined by a Levenberg Marquardt regression process is used to find an approximation of a curve representing the dataset.
- spike points may be removed from the dataset prior to step 920 as described with reference to FIG. 3 .
- the dataset acquired in step 910 can be a dataset with spikes already removed.
- the curve is normalized. In certain aspects, the curve is normalized using one of equations (6), (7), (8) or (9) above.
- the baseline may be set to zero slope using the parameters of the double sigmoid equation as determined in step with 920 to subtract off the baseline slope as per equation (6) above.
- a process is applied to the normalized curve to determine the curvature at points along the normalized curve.
- a plot of the curvature vs. cycle number may be returned and/or displayed.
- the point of maximum curvature corresponds to the elbow or Ct value.
- the result is returned, for example to the system that performed the analysis, or to a separate system that requested the analysis.
- Ct value is displayed. Additional data such as the entire data set or the curve approximation may also be displayed.
- Graphical displays may be rendered with a display device, such as a monitor screen or printer, coupled with the system that performed the analysis of FIG. 9 , or data may be provided to a separate system for rendering on a display device.
- the maximum curvature is determined.
- the curvature is determined for some or all points on the normalized curve.
- a plot of the curvature vs. cycle number may be displayed.
- y x a 2 - x 2
- the radius of curvature is equal to the negative inverse of the curvature.
- FIG. 10b is a plot of the curvature of the fit of the PCR data set of FIG. 10a .
- a circle of this radius superimposed in the PCR growth curve in FIG. 10a is shown in FIG. 11 .
- a circle of radius corresponding to the maximum curvature represents the largest circle that can be superimposed at the start of the growth region of the PCR curve while remaining tangent to the curve. Curves with a small (maximum) radius of curvature may have steep growth curves while curves with a large (maximum) radius of curvature may have shallow growth curves.
- the radius of curvature is extremely large, this may be indicative of curves with no apparent signal, e.g., insignificant growth or non-valid growth.
- a growth validity test is provided to determine whether the dataset exhibits significant or valid growth. If the data set is found to have statistically significant growth, the curvature analysis algorithm can be applied to determine the Ct value. If not, the dataset may be discarded and/or an indication of invalid growth may be returned.
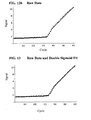
- FIG. 12a shows an example of raw data for a growth curve. Applying the double sigmoid/LM method to the raw data plot shown in FIG. 12b gives values of the seven parameters in equation (1) as shown in Table 4 below: Table 4 a 1.4707 b 0.0093 c 10.9421 d 0.7858 e 35.9089 f 0.1081 g 49.1868
- FIG. 13 The double sigmoid fit to the data shown in FIG. 12 is shown in FIG. 13 , indicating a very accurate assessment of the data points. These data were then normalized according to equation (6) (baseline subtraction) to yield the graph shown in FIG. 14 .
- the solid line shown in FIG. 14 is the double sigmoid/LM application of equation (1) to the data set, which has been normalized according to equation (6).
- FIG. 15 shows a plot of the curvature vs. cycle number for the normalized curve of FIG. 14 .
- the maximum in the curvature occurs at cycle number 34.42 at a curvature of 0.1378.
- Ct 34.42 based on the cycle number at maximum curvature
- a superposition of a circle with this radius of curvature and the normalized data set is shown in FIG. 16 .
- FIG. 17 An example of a "slow-grower" data set is shown in FIG. 17 .
- the corresponding curvature plot is shown in FIG. 19 .
- Table 5 indicates that the Curvature method of calculating Ct values (in this case after normalization with BLSD) gives a smaller Cv (coefficient of variation) than the existing Threshold method.
- the radius of curvature (ROC) calculated with the curvature method provides a simple method of suggesting whether a curve may be a linear curve or a real growth curve.
- a data set for a growth process is processed to determine whether the data exhibits significant growth. Initially, a first or second order polynomial curve that fits the data set is calculated (e.g., using equation (14)) and then a statistical significance value is determined for the curve fit. In certain aspects, the statistical significance is an R 2 value. If the statistical significance value does not exceed a threshold value, the data set is judged to exhibit statistically significant or valid growth and the data set is processed further, for example to determine a Ct value. In one aspect, the R 2 threshold is about 0.90; if R 2 exceeds 0.90, the data set is judged to be non-valid, e.g., lack significant growth. In another aspect, the R 2 threshold is 0.99.
- the R 2 threshold may be set at a value between about 0.90 and 0.99, or that the threshold may be greater than 0.99, or even lower than 0.90. If the statistical significance value does exceed the threshold, the data set is judged to exhibit insignificant, or non-valid, growth. A message indicating that the data set does not have significant growth may be returned and/or the data set may be discarded.
- FIG. 21 shows a real-time PCR data signal that does not contain a target, and which has a baseline intercept, slope and an AFI value within acceptable ranges.
- the curvature algorithm of equations (10), (12), and (13) indicates that the Ct value is 12.94 and that the (maximum) radius of curvature (ROC) is 481.
- the data is determined to have insufficient growth or insufficient curvature, meaning that the signal fits a first or second order quadratic function with a statistical significance value exceeding the threshold, e.g., R 2 > 0.90.
- FIG. 22 shows another real-time PCR data signal that also has an ROC of 481; in this case, the R 2 value was much less than the threshold, e.g., 0.99, so the process continued to calculate the Ct value.
- the curvature algorithm of equations (10), (12), and (13) correctly indicates that the maximum radius of curvature, and thus the Ct value, occurs at cycle 38.7. Comparing Figure 21 with FIG. 22 , it is apparent that knowledge of the ROC values alone is insufficient to identify whether a curve exhibits valid growth. Here both signals have the same maximum ROC, yet one has valid growth and the other does not.
- FIG. 23 shows another real-time PCR signal. Applying the ROC algorithm to determine the Ct value gives a Ct value at cycle 30.3 with a (maximum) ROC of 71. Applying the growth validity test indicates that there is insignificant, or non-valid, growth. Thus, at this much lower (maximum) ROC, the signal is invalid, showing that a low (maximum) ROC in and of itself is insufficient to declare a curve as invalid.
- the growth validity test and Ct determination processes may be implemented in computer code running on a processor of a computer system.
- the code includes instructions for controlling a processor to implement various aspects and steps of the growth validity Ct determination processes.
- the code is typically stored on a hard disk, RAM or portable medium such as a CD, DVD, etc.
- the processes may be implemented in a PCR device such as a thermocycler including a processor executing instructions stored in a memory unit coupled to the processor. Code including such instructions may be downloaded to the PCR device memory unit over a network connection or direct connection to a code source or using a portable medium as is well known.
- elbow determination processes of the present invention can be coded using a variety of programming languages such as C, C++, C#, Fortran, VisualBasic, etc., as well as applications such as Mathematica which provide pre-packaged routines, functions and procedures useful for data visualization and analysis.
- programming languages such as C, C++, C#, Fortran, VisualBasic, etc.
- Mathematica which provide pre-packaged routines, functions and procedures useful for data visualization and analysis.
- Mathematica which provide pre-packaged routines, functions and procedures useful for data visualization and analysis.
- MATLAB ® is a variety of programming languages such as C, C++, C#, Fortran, VisualBasic, etc.
Landscapes
- Engineering & Computer Science (AREA)
- Chemical & Material Sciences (AREA)
- Physics & Mathematics (AREA)
- Life Sciences & Earth Sciences (AREA)
- Organic Chemistry (AREA)
- General Physics & Mathematics (AREA)
- Data Mining & Analysis (AREA)
- Computational Mathematics (AREA)
- Chemical Kinetics & Catalysis (AREA)
- Mathematical Analysis (AREA)
- Mathematical Optimization (AREA)
- Wood Science & Technology (AREA)
- Bioinformatics & Cheminformatics (AREA)
- Pure & Applied Mathematics (AREA)
- Proteomics, Peptides & Aminoacids (AREA)
- Mathematical Physics (AREA)
- Health & Medical Sciences (AREA)
- Zoology (AREA)
- General Engineering & Computer Science (AREA)
- Theoretical Computer Science (AREA)
- Databases & Information Systems (AREA)
- Molecular Biology (AREA)
- Software Systems (AREA)
- Evolutionary Biology (AREA)
- Algebra (AREA)
- Biophysics (AREA)
- Biotechnology (AREA)
- Immunology (AREA)
- Microbiology (AREA)
- Bioinformatics & Computational Biology (AREA)
- Probability & Statistics with Applications (AREA)
- Operations Research (AREA)
- Analytical Chemistry (AREA)
- Biochemistry (AREA)
- General Health & Medical Sciences (AREA)
- Genetics & Genomics (AREA)
- Measuring Or Testing Involving Enzymes Or Micro-Organisms (AREA)
- Management, Administration, Business Operations System, And Electronic Commerce (AREA)
- Apparatus Associated With Microorganisms And Enzymes (AREA)
- Image Analysis (AREA)
Applications Claiming Priority (1)
| Application Number | Priority Date | Filing Date | Title |
|---|---|---|---|
| US11/861,188 US20090119020A1 (en) | 2007-09-25 | 2007-09-25 | Pcr elbow determination using quadratic test for curvature analysis of a double sigmoid |
Publications (3)
| Publication Number | Publication Date |
|---|---|
| EP2107470A2 true EP2107470A2 (de) | 2009-10-07 |
| EP2107470A3 EP2107470A3 (de) | 2017-09-06 |
| EP2107470B1 EP2107470B1 (de) | 2023-08-30 |
Family
ID=40475156
Family Applications (1)
| Application Number | Title | Priority Date | Filing Date |
|---|---|---|---|
| EP08016729.9A Active EP2107470B1 (de) | 2007-09-25 | 2008-09-24 | Bestimmung des Wendepunktes eines PCT-Graphen mittels quadratischem Test zur Kurvenanalyse einer Doppelsigmoidfunktion |
Country Status (5)
| Country | Link |
|---|---|
| US (1) | US20090119020A1 (de) |
| EP (1) | EP2107470B1 (de) |
| JP (1) | JP6009724B2 (de) |
| CN (1) | CN101526476B (de) |
| CA (1) | CA2639714A1 (de) |
Families Citing this family (22)
| Publication number | Priority date | Publication date | Assignee | Title |
|---|---|---|---|---|
| US8374795B2 (en) | 2008-05-13 | 2013-02-12 | Roche Molecular Systems, Inc. | Systems and methods for step discontinuity removal in real-time PCR fluorescence data |
| US8219366B2 (en) * | 2009-08-26 | 2012-07-10 | Roche Molecular Sytems, Inc. | Determination of elbow values for PCR for parabolic shaped curves |
| EP2475987B1 (de) * | 2009-09-12 | 2021-12-15 | Azure Vault Ltd | Identifizierung von übergangspunkten bei chemischen reaktionen |
| WO2011061568A1 (en) | 2009-11-22 | 2011-05-26 | Azure Vault Ltd. | Automatic chemical assay classification |
| US8666673B2 (en) | 2010-05-14 | 2014-03-04 | Biomerieux, Inc | Identification and/or characterization of a microbial agent using taxonomic hierarchical classification |
| US9988675B2 (en) | 2011-03-15 | 2018-06-05 | Azure Vault Ltd. | Rate based identification of reaction points |
| US8738303B2 (en) * | 2011-05-02 | 2014-05-27 | Azure Vault Ltd. | Identifying outliers among chemical assays |
| US8660968B2 (en) | 2011-05-25 | 2014-02-25 | Azure Vault Ltd. | Remote chemical assay classification |
| US20130096845A1 (en) | 2011-10-14 | 2013-04-18 | Ze'ev Russak | Cumulative differential chemical assay identification |
| US10475527B2 (en) | 2012-03-22 | 2019-11-12 | Biomerieux, Inc. | Method and system for detection of microbial growth in a specimen container |
| US10176293B2 (en) | 2012-10-02 | 2019-01-08 | Roche Molecular Systems, Inc. | Universal method to determine real-time PCR cycle threshold values |
| US9607128B2 (en) | 2013-12-30 | 2017-03-28 | Roche Molecular Systems, Inc. | Detection and correction of jumps in real-time PCR signals |
| US10519759B2 (en) | 2014-04-24 | 2019-12-31 | Conocophillips Company | Growth functions for modeling oil production |
| JP7493300B2 (ja) * | 2017-06-27 | 2024-05-31 | 東洋紡株式会社 | 解析用プログラムおよび解析装置 |
| JP7012151B2 (ja) | 2017-09-28 | 2022-01-27 | シージーン アイエヌシー | 試料内ターゲット分析物を分析する方法及び装置 |
| DE102020202363A1 (de) * | 2020-02-25 | 2021-08-26 | Robert Bosch Gesellschaft mit beschränkter Haftung | Verfahren und Vorrichtung zur Durchführung eines qPCR-Verfahrens |
| CN115312123B (zh) * | 2021-05-07 | 2026-01-23 | 台达电子工业股份有限公司 | 数据预筛方法及其数据预筛装置 |
| US20240418649A1 (en) | 2021-10-21 | 2024-12-19 | Seegene, Inc. | Device and method for reading positive/negative with respect to target assay substance in sample |
| CN114339768B (zh) * | 2021-12-24 | 2024-11-22 | 观源(上海)科技有限公司 | 一种usim卡抗侧信道攻击能力评估方法及其系统 |
| US20250336479A1 (en) | 2022-07-29 | 2025-10-30 | Seegene, Inc | Apparatus and method for providing interface for setting threshold value of parameter |
| WO2024128878A1 (ko) | 2022-12-15 | 2024-06-20 | 주식회사 씨젠 | 형광 데이터의 분석 알고리즘에 대한 성능 비교 결과를 디스플레이하는 장치 및 방법 |
| CN116473512B (zh) * | 2023-03-22 | 2024-05-03 | 上海交通大学 | 一种动物循环系统中外泌体的监测装置及监测方法 |
Citations (3)
| Publication number | Priority date | Publication date | Assignee | Title |
|---|---|---|---|---|
| WO1997046714A1 (en) | 1996-06-04 | 1997-12-11 | University Of Utah Research Foundation | Monitoring hybridization during pcr |
| WO1997046712A2 (en) | 1996-06-04 | 1997-12-11 | University Of Utah Research Foundation | System and method for carrying out and monitoring biological processes |
| US20070148632A1 (en) | 2005-12-20 | 2007-06-28 | Roche Molecular Systems, Inc. | Levenberg-Marquardt outlier spike removal method |
Family Cites Families (9)
| Publication number | Priority date | Publication date | Assignee | Title |
|---|---|---|---|---|
| US7228237B2 (en) * | 2002-02-07 | 2007-06-05 | Applera Corporation | Automatic threshold setting and baseline determination for real-time PCR |
| EP1335028B1 (de) * | 2002-02-12 | 2008-01-16 | University of Utah Research Foundation | Multi-Test-Analyse von Echzeit-Nukleinsäureamplifikationen |
| US20060009916A1 (en) * | 2004-07-06 | 2006-01-12 | Xitong Li | Quantitative PCR data analysis system (QDAS) |
| CA2603389C (en) * | 2005-05-13 | 2012-07-10 | Bio-Rad Laboratories, Inc. | Identifying statistically linear data |
| EP3168766B1 (de) * | 2005-09-20 | 2023-08-16 | University of Utah Research Foundation | Verfahren zur genotypisierung für eine vielzahl von proben |
| EP1798650A1 (de) * | 2005-12-19 | 2007-06-20 | Roche Diagnostics GmbH | Analytisches Verfahren und Instrument |
| US7844403B2 (en) * | 2005-12-20 | 2010-11-30 | Roche Molecular Systems, Inc. | Temperature step correction with double sigmoid Levenberg-Marquardt and robust linear regression |
| US7680868B2 (en) * | 2005-12-20 | 2010-03-16 | Roche Molecular Systems, Inc. | PCR elbow determination by use of a double sigmoid function curve fit with the Levenburg-Marquardt algorithm and normalization |
| EP1804172B1 (de) * | 2005-12-20 | 2021-08-11 | Roche Diagnostics GmbH | Bestimmung des Wendepunktes einer PCR-Kurve mittels Krümmungsanalyse einer Doppelsigmoidfunktion |
-
2007
- 2007-09-25 US US11/861,188 patent/US20090119020A1/en not_active Abandoned
-
2008
- 2008-09-22 JP JP2008242813A patent/JP6009724B2/ja active Active
- 2008-09-22 CA CA002639714A patent/CA2639714A1/en not_active Abandoned
- 2008-09-24 EP EP08016729.9A patent/EP2107470B1/de active Active
- 2008-09-25 CN CN2008101497410A patent/CN101526476B/zh active Active
Patent Citations (4)
| Publication number | Priority date | Publication date | Assignee | Title |
|---|---|---|---|---|
| WO1997046714A1 (en) | 1996-06-04 | 1997-12-11 | University Of Utah Research Foundation | Monitoring hybridization during pcr |
| WO1997046712A2 (en) | 1996-06-04 | 1997-12-11 | University Of Utah Research Foundation | System and method for carrying out and monitoring biological processes |
| WO1997046707A2 (en) | 1996-06-04 | 1997-12-11 | University Of Utah Research Foundation | System and method for monitoring for dna amplification by fluorescence |
| US20070148632A1 (en) | 2005-12-20 | 2007-06-28 | Roche Molecular Systems, Inc. | Levenberg-Marquardt outlier spike removal method |
Non-Patent Citations (4)
| Title |
|---|
| BIECHE ET AL., CANCER RESEARCH, vol. 59, 1999, pages 2759 - 2765 |
| GIBSON ET AL., GENOME RESEARCH, vol. 6, pages 995 - 1001 |
| WANG; SHA-SHA ET AL.: "Homogeneous Real-Time Detection of Single-Nucleotide Polymorphisms by Strand Displacement Amplification on the BD ProbeTec ET System", CLIN CHEM, vol. 49, no. 10, 2003, pages 1599, XP002435887, DOI: doi:10.1373/49.10.1599 |
| WEUSTEN; JOS J.A.M. ET AL.: "Principles of Quantitation of Viral Loads Using Nucleic Acid Sequence-Based Amplification in Combination With Homogeneous Detection Using Molecular Beacons", NUCLEIC ACIDS RESEARCH, vol. 30, no. 6, 2002, pages 26, XP002436126 |
Also Published As
| Publication number | Publication date |
|---|---|
| EP2107470A3 (de) | 2017-09-06 |
| CA2639714A1 (en) | 2009-03-25 |
| CN101526476A (zh) | 2009-09-09 |
| JP6009724B2 (ja) | 2016-10-19 |
| EP2107470B1 (de) | 2023-08-30 |
| CN101526476B (zh) | 2013-11-13 |
| JP2009080811A (ja) | 2009-04-16 |
| HK1133697A1 (en) | 2010-04-01 |
| US20090119020A1 (en) | 2009-05-07 |
Similar Documents
| Publication | Publication Date | Title |
|---|---|---|
| EP2107470B1 (de) | Bestimmung des Wendepunktes eines PCT-Graphen mittels quadratischem Test zur Kurvenanalyse einer Doppelsigmoidfunktion | |
| EP1801706B1 (de) | Bestimmung des Wendepunkts einer PCR-Kurve durch Anpassung einer doppelten sigmoiden Funktionskurve mittels Levenberg-Marquardt-Algorithmus und Normalisierung | |
| EP1804172B1 (de) | Bestimmung des Wendepunktes einer PCR-Kurve mittels Krümmungsanalyse einer Doppelsigmoidfunktion | |
| US7668663B2 (en) | Levenberg-Marquardt outlier spike removal method | |
| EP2163999B1 (de) | Echtzeit-pcr-wendepunkt-aufruf mittels eines algorithmus ohne gleichungen | |
| EP2120154B1 (de) | Systeme und Verfahren zum Entfernen der Diskontinuität in Echtzeit-PCR-Fluoreszenzdaten | |
| US7991562B2 (en) | PCR elbow determination using curvature analysis of a double sigmoid | |
| EP1701275A2 (de) | Bestimmung des Wendepunktes eines PCT-Graphen mittels Drehtransformation | |
| EP1801237B1 (de) | Temperaturstufenkorrektur mittels Levenberg-Marquardt Regression einer doppelten Sigmoide und robuster linearer Regression | |
| EP2471007B1 (de) | Bestimmung von schwellenwertzyklen für pcr-kurven mit parabolischer form | |
| HK1133697B (en) | A method for determining whether data for a pcr process exhibits significant growth, an apparatus and a pcr system to carry out the method | |
| HK1106304A (en) | Pcr elbow determination using curvature analysis of a double sigmoid | |
| HK1105689B (en) | Pcr elbow determination by use a double sigmoid function curve fit with the levenberg-marquardt and normalization | |
| HK1106305A (en) | Temperature step correction with double sigmoid levenberg-marquardt and robust linear regression |
Legal Events
| Date | Code | Title | Description |
|---|---|---|---|
| PUAI | Public reference made under article 153(3) epc to a published international application that has entered the european phase |
Free format text: ORIGINAL CODE: 0009012 |
|
| AK | Designated contracting states |
Kind code of ref document: A2 Designated state(s): AT BE BG CH CY CZ DE DK EE ES FI FR GB GR HR HU IE IS IT LI LT LU LV MC MT NL NO PL PT RO SE SI SK TR |
|
| AX | Request for extension of the european patent |
Extension state: AL BA MK RS |
|
| PUAL | Search report despatched |
Free format text: ORIGINAL CODE: 0009013 |
|
| AK | Designated contracting states |
Kind code of ref document: A3 Designated state(s): AT BE BG CH CY CZ DE DK EE ES FI FR GB GR HR HU IE IS IT LI LT LU LV MC MT NL NO PL PT RO SE SI SK TR |
|
| AX | Request for extension of the european patent |
Extension state: AL BA MK RS |
|
| RIC1 | Information provided on ipc code assigned before grant |
Ipc: C12Q 1/68 20060101ALI20170803BHEP Ipc: G06K 9/00 20060101ALI20170803BHEP Ipc: G06F 17/10 20060101AFI20170803BHEP |
|
| STAA | Information on the status of an ep patent application or granted ep patent |
Free format text: STATUS: REQUEST FOR EXAMINATION WAS MADE |
|
| 17P | Request for examination filed |
Effective date: 20180306 |
|
| RBV | Designated contracting states (corrected) |
Designated state(s): AT BE BG CH CY CZ DE DK EE ES FI FR GB GR HR HU IE IS IT LI LT LU LV MC MT NL NO PL PT RO SE SI SK TR |
|
| AKX | Designation fees paid |
Designated state(s): AT BE BG CH CY CZ DE DK EE ES FI FR GB GR HR HU IE IS IT LI LT LU LV MC MT NL NO PL PT RO SE SI SK TR |
|
| AXX | Extension fees paid |
Extension state: BA Extension state: AL Extension state: MK Extension state: RS |
|
| STAA | Information on the status of an ep patent application or granted ep patent |
Free format text: STATUS: EXAMINATION IS IN PROGRESS |
|
| 17Q | First examination report despatched |
Effective date: 20210309 |
|
| GRAP | Despatch of communication of intention to grant a patent |
Free format text: ORIGINAL CODE: EPIDOSNIGR1 |
|
| STAA | Information on the status of an ep patent application or granted ep patent |
Free format text: STATUS: GRANT OF PATENT IS INTENDED |
|
| RIC1 | Information provided on ipc code assigned before grant |
Ipc: C12Q 1/686 20180101ALI20230317BHEP Ipc: G06F 17/18 20060101AFI20230317BHEP |
|
| INTG | Intention to grant announced |
Effective date: 20230404 |
|
| GRAS | Grant fee paid |
Free format text: ORIGINAL CODE: EPIDOSNIGR3 |
|
| GRAA | (expected) grant |
Free format text: ORIGINAL CODE: 0009210 |
|
| STAA | Information on the status of an ep patent application or granted ep patent |
Free format text: STATUS: THE PATENT HAS BEEN GRANTED |
|
| AK | Designated contracting states |
Kind code of ref document: B1 Designated state(s): AT BE BG CH CY CZ DE DK EE ES FI FR GB GR HR HU IE IS IT LI LT LU LV MC MT NL NO PL PT RO SE SI SK TR |
|
| REG | Reference to a national code |
Ref country code: GB Ref legal event code: FG4D |
|
| REG | Reference to a national code |
Ref country code: CH Ref legal event code: EP |
|
| REG | Reference to a national code |
Ref country code: DE Ref legal event code: R096 Ref document number: 602008064850 Country of ref document: DE |
|
| REG | Reference to a national code |
Ref country code: IE Ref legal event code: FG4D |
|
| REG | Reference to a national code |
Ref country code: LT Ref legal event code: MG9D |
|
| REG | Reference to a national code |
Ref country code: NL Ref legal event code: MP Effective date: 20230830 |
|
| REG | Reference to a national code |
Ref country code: AT Ref legal event code: MK05 Ref document number: 1606341 Country of ref document: AT Kind code of ref document: T Effective date: 20230830 |
|
| PG25 | Lapsed in a contracting state [announced via postgrant information from national office to epo] |
Ref country code: GR Free format text: LAPSE BECAUSE OF FAILURE TO SUBMIT A TRANSLATION OF THE DESCRIPTION OR TO PAY THE FEE WITHIN THE PRESCRIBED TIME-LIMIT Effective date: 20231201 |
|
| PG25 | Lapsed in a contracting state [announced via postgrant information from national office to epo] |
Ref country code: IS Free format text: LAPSE BECAUSE OF FAILURE TO SUBMIT A TRANSLATION OF THE DESCRIPTION OR TO PAY THE FEE WITHIN THE PRESCRIBED TIME-LIMIT Effective date: 20231230 |
|
| PG25 | Lapsed in a contracting state [announced via postgrant information from national office to epo] |
Ref country code: SE Free format text: LAPSE BECAUSE OF FAILURE TO SUBMIT A TRANSLATION OF THE DESCRIPTION OR TO PAY THE FEE WITHIN THE PRESCRIBED TIME-LIMIT Effective date: 20230830 Ref country code: NO Free format text: LAPSE BECAUSE OF FAILURE TO SUBMIT A TRANSLATION OF THE DESCRIPTION OR TO PAY THE FEE WITHIN THE PRESCRIBED TIME-LIMIT Effective date: 20231130 Ref country code: LV Free format text: LAPSE BECAUSE OF FAILURE TO SUBMIT A TRANSLATION OF THE DESCRIPTION OR TO PAY THE FEE WITHIN THE PRESCRIBED TIME-LIMIT Effective date: 20230830 Ref country code: LT Free format text: LAPSE BECAUSE OF FAILURE TO SUBMIT A TRANSLATION OF THE DESCRIPTION OR TO PAY THE FEE WITHIN THE PRESCRIBED TIME-LIMIT Effective date: 20230830 Ref country code: IS Free format text: LAPSE BECAUSE OF FAILURE TO SUBMIT A TRANSLATION OF THE DESCRIPTION OR TO PAY THE FEE WITHIN THE PRESCRIBED TIME-LIMIT Effective date: 20231230 Ref country code: HR Free format text: LAPSE BECAUSE OF FAILURE TO SUBMIT A TRANSLATION OF THE DESCRIPTION OR TO PAY THE FEE WITHIN THE PRESCRIBED TIME-LIMIT Effective date: 20230830 Ref country code: GR Free format text: LAPSE BECAUSE OF FAILURE TO SUBMIT A TRANSLATION OF THE DESCRIPTION OR TO PAY THE FEE WITHIN THE PRESCRIBED TIME-LIMIT Effective date: 20231201 Ref country code: FI Free format text: LAPSE BECAUSE OF FAILURE TO SUBMIT A TRANSLATION OF THE DESCRIPTION OR TO PAY THE FEE WITHIN THE PRESCRIBED TIME-LIMIT Effective date: 20230830 Ref country code: AT Free format text: LAPSE BECAUSE OF FAILURE TO SUBMIT A TRANSLATION OF THE DESCRIPTION OR TO PAY THE FEE WITHIN THE PRESCRIBED TIME-LIMIT Effective date: 20230830 |
|
| PG25 | Lapsed in a contracting state [announced via postgrant information from national office to epo] |
Ref country code: PL Free format text: LAPSE BECAUSE OF FAILURE TO SUBMIT A TRANSLATION OF THE DESCRIPTION OR TO PAY THE FEE WITHIN THE PRESCRIBED TIME-LIMIT Effective date: 20230830 Ref country code: NL Free format text: LAPSE BECAUSE OF FAILURE TO SUBMIT A TRANSLATION OF THE DESCRIPTION OR TO PAY THE FEE WITHIN THE PRESCRIBED TIME-LIMIT Effective date: 20230830 |
|
| PG25 | Lapsed in a contracting state [announced via postgrant information from national office to epo] |
Ref country code: ES Free format text: LAPSE BECAUSE OF FAILURE TO SUBMIT A TRANSLATION OF THE DESCRIPTION OR TO PAY THE FEE WITHIN THE PRESCRIBED TIME-LIMIT Effective date: 20230830 |
|
| PG25 | Lapsed in a contracting state [announced via postgrant information from national office to epo] |
Ref country code: RO Free format text: LAPSE BECAUSE OF FAILURE TO SUBMIT A TRANSLATION OF THE DESCRIPTION OR TO PAY THE FEE WITHIN THE PRESCRIBED TIME-LIMIT Effective date: 20230830 Ref country code: ES Free format text: LAPSE BECAUSE OF FAILURE TO SUBMIT A TRANSLATION OF THE DESCRIPTION OR TO PAY THE FEE WITHIN THE PRESCRIBED TIME-LIMIT Effective date: 20230830 Ref country code: EE Free format text: LAPSE BECAUSE OF FAILURE TO SUBMIT A TRANSLATION OF THE DESCRIPTION OR TO PAY THE FEE WITHIN THE PRESCRIBED TIME-LIMIT Effective date: 20230830 Ref country code: DK Free format text: LAPSE BECAUSE OF FAILURE TO SUBMIT A TRANSLATION OF THE DESCRIPTION OR TO PAY THE FEE WITHIN THE PRESCRIBED TIME-LIMIT Effective date: 20230830 Ref country code: CZ Free format text: LAPSE BECAUSE OF FAILURE TO SUBMIT A TRANSLATION OF THE DESCRIPTION OR TO PAY THE FEE WITHIN THE PRESCRIBED TIME-LIMIT Effective date: 20230830 Ref country code: SK Free format text: LAPSE BECAUSE OF FAILURE TO SUBMIT A TRANSLATION OF THE DESCRIPTION OR TO PAY THE FEE WITHIN THE PRESCRIBED TIME-LIMIT Effective date: 20230830 Ref country code: PT Free format text: LAPSE BECAUSE OF FAILURE TO SUBMIT A TRANSLATION OF THE DESCRIPTION OR TO PAY THE FEE WITHIN THE PRESCRIBED TIME-LIMIT Effective date: 20240102 |
|
| PG25 | Lapsed in a contracting state [announced via postgrant information from national office to epo] |
Ref country code: LU Free format text: LAPSE BECAUSE OF NON-PAYMENT OF DUE FEES Effective date: 20230924 |
|
| REG | Reference to a national code |
Ref country code: BE Ref legal event code: MM Effective date: 20230930 |
|
| PG25 | Lapsed in a contracting state [announced via postgrant information from national office to epo] |
Ref country code: LU Free format text: LAPSE BECAUSE OF NON-PAYMENT OF DUE FEES Effective date: 20230924 Ref country code: IT Free format text: LAPSE BECAUSE OF FAILURE TO SUBMIT A TRANSLATION OF THE DESCRIPTION OR TO PAY THE FEE WITHIN THE PRESCRIBED TIME-LIMIT Effective date: 20230830 Ref country code: MC Free format text: LAPSE BECAUSE OF FAILURE TO SUBMIT A TRANSLATION OF THE DESCRIPTION OR TO PAY THE FEE WITHIN THE PRESCRIBED TIME-LIMIT Effective date: 20230830 |
|
| REG | Reference to a national code |
Ref country code: DE Ref legal event code: R097 Ref document number: 602008064850 Country of ref document: DE |
|
| REG | Reference to a national code |
Ref country code: IE Ref legal event code: MM4A |
|
| PG25 | Lapsed in a contracting state [announced via postgrant information from national office to epo] |
Ref country code: IE Free format text: LAPSE BECAUSE OF NON-PAYMENT OF DUE FEES Effective date: 20230924 |
|
| PLBE | No opposition filed within time limit |
Free format text: ORIGINAL CODE: 0009261 |
|
| STAA | Information on the status of an ep patent application or granted ep patent |
Free format text: STATUS: NO OPPOSITION FILED WITHIN TIME LIMIT |
|
| PG25 | Lapsed in a contracting state [announced via postgrant information from national office to epo] |
Ref country code: IE Free format text: LAPSE BECAUSE OF NON-PAYMENT OF DUE FEES Effective date: 20230924 Ref country code: SI Free format text: LAPSE BECAUSE OF FAILURE TO SUBMIT A TRANSLATION OF THE DESCRIPTION OR TO PAY THE FEE WITHIN THE PRESCRIBED TIME-LIMIT Effective date: 20230830 |
|
| 26N | No opposition filed |
Effective date: 20240603 |
|
| PG25 | Lapsed in a contracting state [announced via postgrant information from national office to epo] |
Ref country code: BE Free format text: LAPSE BECAUSE OF NON-PAYMENT OF DUE FEES Effective date: 20230930 |
|
| PG25 | Lapsed in a contracting state [announced via postgrant information from national office to epo] |
Ref country code: BG Free format text: LAPSE BECAUSE OF FAILURE TO SUBMIT A TRANSLATION OF THE DESCRIPTION OR TO PAY THE FEE WITHIN THE PRESCRIBED TIME-LIMIT Effective date: 20230830 |
|
| PG25 | Lapsed in a contracting state [announced via postgrant information from national office to epo] |
Ref country code: BG Free format text: LAPSE BECAUSE OF FAILURE TO SUBMIT A TRANSLATION OF THE DESCRIPTION OR TO PAY THE FEE WITHIN THE PRESCRIBED TIME-LIMIT Effective date: 20230830 |
|
| PG25 | Lapsed in a contracting state [announced via postgrant information from national office to epo] |
Ref country code: HU Free format text: LAPSE BECAUSE OF FAILURE TO SUBMIT A TRANSLATION OF THE DESCRIPTION OR TO PAY THE FEE WITHIN THE PRESCRIBED TIME-LIMIT; INVALID AB INITIO Effective date: 20080924 |
|
| PG25 | Lapsed in a contracting state [announced via postgrant information from national office to epo] |
Ref country code: CY Free format text: LAPSE BECAUSE OF FAILURE TO SUBMIT A TRANSLATION OF THE DESCRIPTION OR TO PAY THE FEE WITHIN THE PRESCRIBED TIME-LIMIT; INVALID AB INITIO Effective date: 20080924 |
|
| REG | Reference to a national code |
Ref country code: CH Ref legal event code: U11 Free format text: ST27 STATUS EVENT CODE: U-0-0-U10-U11 (AS PROVIDED BY THE NATIONAL OFFICE) Effective date: 20251001 |
|
| PGFP | Annual fee paid to national office [announced via postgrant information from national office to epo] |
Ref country code: DE Payment date: 20250820 Year of fee payment: 18 |
|
| PGFP | Annual fee paid to national office [announced via postgrant information from national office to epo] |
Ref country code: GB Payment date: 20250822 Year of fee payment: 18 |
|
| PGFP | Annual fee paid to national office [announced via postgrant information from national office to epo] |
Ref country code: FR Payment date: 20250820 Year of fee payment: 18 |
|
| PG25 | Lapsed in a contracting state [announced via postgrant information from national office to epo] |
Ref country code: TR Free format text: LAPSE BECAUSE OF FAILURE TO SUBMIT A TRANSLATION OF THE DESCRIPTION OR TO PAY THE FEE WITHIN THE PRESCRIBED TIME-LIMIT Effective date: 20230830 |
|
| PGFP | Annual fee paid to national office [announced via postgrant information from national office to epo] |
Ref country code: CH Payment date: 20251001 Year of fee payment: 18 |