EP2136325A2 - Visualisierungssystem und Verfahren - Google Patents
Visualisierungssystem und Verfahren Download PDFInfo
- Publication number
- EP2136325A2 EP2136325A2 EP09251054A EP09251054A EP2136325A2 EP 2136325 A2 EP2136325 A2 EP 2136325A2 EP 09251054 A EP09251054 A EP 09251054A EP 09251054 A EP09251054 A EP 09251054A EP 2136325 A2 EP2136325 A2 EP 2136325A2
- Authority
- EP
- European Patent Office
- Prior art keywords
- assets
- attributes
- subject
- visual representation
- asset
- Prior art date
- Legal status (The legal status is an assumption and is not a legal conclusion. Google has not performed a legal analysis and makes no representation as to the accuracy of the status listed.)
- Withdrawn
Links
Images


Classifications
-
- G—PHYSICS
- G06—COMPUTING OR CALCULATING; COUNTING
- G06Q—INFORMATION AND COMMUNICATION TECHNOLOGY [ICT] SPECIALLY ADAPTED FOR ADMINISTRATIVE, COMMERCIAL, FINANCIAL, MANAGERIAL OR SUPERVISORY PURPOSES; SYSTEMS OR METHODS SPECIALLY ADAPTED FOR ADMINISTRATIVE, COMMERCIAL, FINANCIAL, MANAGERIAL OR SUPERVISORY PURPOSES, NOT OTHERWISE PROVIDED FOR
- G06Q10/00—Administration; Management
- G06Q10/06—Resources, workflows, human or project management; Enterprise or organisation planning; Enterprise or organisation modelling
-
- G—PHYSICS
- G06—COMPUTING OR CALCULATING; COUNTING
- G06T—IMAGE DATA PROCESSING OR GENERATION, IN GENERAL
- G06T11/00—Two-dimensional [2D] image generation
- G06T11/20—Drawing from basic elements
- G06T11/26—Drawing of charts or graphs
Definitions
- the invention to which this application relates is to the provision of a system which allows assets, or other attributes of a predetermined subject such as, for example, an organisation, or a project or task, to be visually represented. More particularly the aim is to allow the said assets or attributes to be visible and represented graphically in conjunction with other related assets or attributes in a meaningful manner in a visualisation model, hereinafter referred to as a visualisation.
- the aim of the present invention is therefore to provide a method for generating one or more visual representations which allows various assets or attributes to be represented in combination and in a manner which allows the links between the respective assets or attributes to be visible and also in on embodiment, to allow the condition of the assets or attributes with respect to a predefined parameter with which they are compared, to be graphically represented.
- a method for generating a visual representation of a series of assets or attributes relating to a predetermined subject comprising the steps of identifying the said predetermined subject, identifying the assets or attributes of a first set, linked to the predetermined subject, positioning said assets or attributes of the first set radially around a central point, and wherein at least one further set of assets or attributes are identified and radially placing the- assets or attributes of the second set around those of the first set.
- the above steps can be repeated for as many sets of assets or attributes as required for the visualisation of the said predetermined subject.
- the location of the assets or attributes in a particular set are determined with respect to the assets or attributes in the preceding set which have already been located on the visualisation. For example, if there are three assets or attributes in the set which are linked to a particular asset or attribute in the preceding set then those will be positioned at or adjacent to the said linked asset or attribute in the preceding set.
- the method includes the step of assessing the assets or attributes in a set with respect to a particular parameter. Typically this is performed for each of the sets.
- the results of the assessment for each asset or attribute is visually represented by a visual indication on the visual representation.
- the visual indication may be to select a particular colour from a range of colours to provide a visual indication of the result.
- the method includes the step of determining a parameter against which the assessment is to be made for each asset or attribute in a particular set.
- the parameter may differ from set to set.
- the centre point of the visual representation includes a core centrally located thereon, said core representing the predetermined subject to which the assets or attribute sets are related.
- a method for generating a visual representation of a plurality of assets or attributes of a subject comprising a first set of assets or attributes relating to the subject and said assets or attributes in the first set is each allocated a segment depending radially outwardly from a centre point and wherein at least one further set of assets or attributes are provided and allocated a segment for each of said assets or attributes, said segments depending radially outwardly from the segments of first set of attributes or assets with respect to the centre point.
- the number of segments for each set of assets are located around the centre point around 360 degrees in a ring such that the width of each segment may vary from set to set, depending on the number of assets and attributes in each set and/or the distance of the ring from the centre point.
- the number of assets or attributes in the second and further sets increases successively.
- the width of the assets or attributes in the subsequent sets of assets and attributes reduces in sequence with subsequent sets or attributes.
- the assets or attributes in at least one set can be selectively distinguished with respect to the results of an assessment of the assets or attributes with respect to a predetermined parameter.
- the visual representation includes a core which is located at the centre point, said core representing the subject which the visual representation depicts.
- the subject is any of an organisation, project or task.
- the first set of assets or attributes depend radially from the core located at the centre point and then subsequent sets of assets or attributes, depend radially away from the first set of assets or attributes.
- the assets or attributes in the second set of assets or attributes are located with respect to an asset or attribute in the first sets of attributes with which the same are linked.
- each of the subsequent sets of assets or attributes represent a subset of the asset or attribute from the previous set of assets or attributes to which the same are linked.
- a visualisation of a predetermined subject comprising a centre point including a core representing said subject, and a plurality of rings depending successively radially therefrom, each of said rings representing a set of assets or attributes linked to the said subject, and wherein each of said rings includes a segment for each of the assets or attributes in said set.
- each set of assets or attributes is provided in an annular form around the centre point.
- a segment for an asset or attribute of one set is selectively positioned with respect to a segment of the ring representing the previously visualised set of assets or attributes.
- a plurality of visual representations formed in accordance with the invention can be generated and viewed in conjunction so as to allow the viewing and monitoring of the implication of the performance of each of these visual representations. It is also possible, for example, to identify a particular asset or attribute from a first visual representation and then to generate another visual representation for that specific, selected asset and attribute. It is found that the ability to generate visual representations in this form, allows an improved means of determining a rationale for options for action to be prepared to address specific concerns and to agree and effect relevant actions. It also allows the review of a particular position of an object or organisation from alternative view points, including aggregate view points, to assess the overall performance position for an asset or collection of assets and also to investigate specific details of selected assets or attributes.
- the first step to be performed is to select the subject and the scope of the subject for which it is to be generated.
- the subject is a Business as a whole and this title is therefore entered as the core 2 of the visual representation shown in Figure 1 .
- a first set of assets or attributes is then selected as shown in Figure 2 via a screen display of a selection tool.
- the assets or attributes 6 to be displayed are selected and at the same time the relationship with the subject is identified.
- a parameter 8 by which the performance of each of the assets or attributes is to be assessed and displayed is selected and the assessment is performed for each of the assets or attributes in the set 4.
- the assets or attributes for the first set are the "children" of the subject (i.e. the primary Business Units).
- the parameter 8 which is selected for assessment is the "criticality" of each of the Business Units 6.
- the result of the assessment is coded as Red (indicated as blank) or Yellow colour (indicated by hatching) indicating high or medium critically to the Business as a whole.
- the assets or attributes for the set 10 are identified.
- the relationship of the assets or attributes 12 with the assets or attributes 6 in the first set 4 are identified and the respective location of each of the assets or attributes in the visual representation are selected with respect to any links between the same.
- the parameter which is to be used to assess the assets or attributes in that set is also allocated.
- the assets or attributes 12 for the second set 10 specified are those Projects for which each of the Business Units is responsible.
- the parameter 11 selected is the "project Status".
- the results of the parameter assessment is coded as Red or Yellow or Green to indicated, for example, the calculation of projected slippage or budget variation.
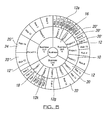
- Figure 4 illustrates a visual representation 15 generated for the first and second sets of assets or attributes generated as described above. It will be seen that the visual representation takes the form of a target with a succession of annular rings around the core 2 representing the business. A series of segments 14 make up each ring and depend radially from the core 2. These segments represent the assets or attributes 6 of the first set 4 and form an annular ring 16 around the core 2. The particular colour of each of the segments is selected to represent the result of the assessment of that particular segment with regard to the parameter 8.
- the outer annular ring 18 is formed of the segments 19 which are allocated to the assets or attributes 12 of the second set 10 and again the colour selected reflects the results of the parameter assessment.
- the assets or attributes for that set are selected and their relationship with the previous set is defined along with the parameter by which the assets and attributes performance is to be assessed and displayed and this can be repeated for as many sets as required.
- the assets or attributes 20 specified for the third set 22 are the Risks currently associated with each Project asset or attribute 12 of the second set 10.
- the parameter selected is the "severity" of the risk.
- severity is colour coded as the colours Red or Yellow or Green with the colour selected indicating the result of the assessment of the automatic calculation of the impact value on the business.
- This set 22 of assets or attributes are used to generate the third annular ring 24 as shown in Figure 5 with, once again, the location of the assets or attributes 20 being selected so that the appropriate segment depends from the linked project segment in the annular ring 18 such that for example, project e asset 12' has three relevant asset or attribute segments 20' depending therefrom, all of which are relevant to that project, while project b asset 12" only has two segments 20" depending therefore as only two risk assets or attributes are relevant thereto.
- a means for assembling an architecture comprising asset or attribute descriptions, measures of effectiveness of those assets or attributes and arbitrary reference information relating to the asset components and dependencies while at the same time using an architecture modelling environment to do so.
- the invention allows the connection of measures to source its performance data for all relevant performance view points and the ability to select an asset, or set of assets or asset components which can be analysed.
- For each of the assets or set of assets or asset components there can be generated one or more visual representations structures by, for each visual representation, selecting the logic for generating each successive annular ring, each of which represents a particular set of assets or attributes.
- the annular rings are progressively moved from the centre core.
Landscapes
- Engineering & Computer Science (AREA)
- Business, Economics & Management (AREA)
- Human Resources & Organizations (AREA)
- General Physics & Mathematics (AREA)
- Theoretical Computer Science (AREA)
- Physics & Mathematics (AREA)
- Economics (AREA)
- Strategic Management (AREA)
- Entrepreneurship & Innovation (AREA)
- Development Economics (AREA)
- Game Theory and Decision Science (AREA)
- Educational Administration (AREA)
- Marketing (AREA)
- Operations Research (AREA)
- Quality & Reliability (AREA)
- Tourism & Hospitality (AREA)
- General Business, Economics & Management (AREA)
- User Interface Of Digital Computer (AREA)
- Investigating Or Analysing Biological Materials (AREA)
- Magnetic Resonance Imaging Apparatus (AREA)
- Information Retrieval, Db Structures And Fs Structures Therefor (AREA)
Applications Claiming Priority (1)
| Application Number | Priority Date | Filing Date | Title |
|---|---|---|---|
| GBGB0806351.3A GB0806351D0 (en) | 2008-04-08 | 2008-04-08 | Visualisation system |
Publications (2)
| Publication Number | Publication Date |
|---|---|
| EP2136325A2 true EP2136325A2 (de) | 2009-12-23 |
| EP2136325A3 EP2136325A3 (de) | 2010-01-13 |
Family
ID=39433287
Family Applications (1)
| Application Number | Title | Priority Date | Filing Date |
|---|---|---|---|
| EP09251054A Withdrawn EP2136325A3 (de) | 2008-04-08 | 2009-04-07 | Visualisierungssystem und Verfahren |
Country Status (3)
| Country | Link |
|---|---|
| US (1) | US20090254864A1 (de) |
| EP (1) | EP2136325A3 (de) |
| GB (1) | GB0806351D0 (de) |
Cited By (1)
| Publication number | Priority date | Publication date | Assignee | Title |
|---|---|---|---|---|
| CN103886629A (zh) * | 2014-04-16 | 2014-06-25 | 广东威创视讯科技股份有限公司 | 图像处理方法和图像处理模块 |
Families Citing this family (12)
| Publication number | Priority date | Publication date | Assignee | Title |
|---|---|---|---|---|
| US8375329B2 (en) * | 2009-09-01 | 2013-02-12 | Maxon Computer Gmbh | Method of providing a graphical user interface using a concentric menu |
| US20110113368A1 (en) * | 2009-11-06 | 2011-05-12 | Santiago Carvajal | Audio/Visual Device Graphical User Interface |
| USD687843S1 (en) | 2009-11-06 | 2013-08-13 | Bose Corporation | Audio/video device with graphical user interface |
| US8601394B2 (en) * | 2009-11-06 | 2013-12-03 | Bose Corporation | Graphical user interface user customization |
| US9354726B2 (en) * | 2009-11-06 | 2016-05-31 | Bose Corporation | Audio/visual device graphical user interface submenu |
| GB201212484D0 (en) | 2012-07-13 | 2012-08-29 | Mood Entpr Ltd | System to allow model based decision making |
| USD722072S1 (en) * | 2012-09-28 | 2015-02-03 | Google Inc. | Display screen or portion thereof for a control unit with graphical user interface |
| US20150277678A1 (en) * | 2014-03-26 | 2015-10-01 | Kobo Incorporated | Information presentation techniques for digital content |
| US11321904B2 (en) | 2019-08-30 | 2022-05-03 | Maxon Computer Gmbh | Methods and systems for context passing between nodes in three-dimensional modeling |
| US11714928B2 (en) | 2020-02-27 | 2023-08-01 | Maxon Computer Gmbh | Systems and methods for a self-adjusting node workspace |
| US11373369B2 (en) | 2020-09-02 | 2022-06-28 | Maxon Computer Gmbh | Systems and methods for extraction of mesh geometry from straight skeleton for beveled shapes |
| CN119621061B (zh) * | 2025-02-14 | 2025-05-02 | 北京德京安科技有限公司 | 一种可视化数据构建及展示方法、系统、电子设备及介质 |
Citations (2)
| Publication number | Priority date | Publication date | Assignee | Title |
|---|---|---|---|---|
| WO2007131510A2 (en) | 2006-05-16 | 2007-11-22 | Targit A/S | A method of preparing an intelligent dashboard for data monitoring |
| US20080049013A1 (en) | 2006-04-12 | 2008-02-28 | Edsa Micro Corporation | Systems and methods for real-time advanced visualization for predicting the health, reliability and performance of an electrical power system |
Family Cites Families (4)
| Publication number | Priority date | Publication date | Assignee | Title |
|---|---|---|---|---|
| US6549219B2 (en) * | 1999-04-09 | 2003-04-15 | International Business Machines Corporation | Pie menu graphical user interface |
| US7669180B2 (en) * | 2004-06-18 | 2010-02-23 | International Business Machines Corporation | Method and apparatus for automated risk assessment in software projects |
| US7712049B2 (en) * | 2004-09-30 | 2010-05-04 | Microsoft Corporation | Two-dimensional radial user interface for computer software applications |
| US8332782B1 (en) * | 2008-02-22 | 2012-12-11 | Adobe Systems Incorporated | Network visualization and navigation |
-
2008
- 2008-04-08 GB GBGB0806351.3A patent/GB0806351D0/en not_active Ceased
-
2009
- 2009-04-07 US US12/384,569 patent/US20090254864A1/en not_active Abandoned
- 2009-04-07 EP EP09251054A patent/EP2136325A3/de not_active Withdrawn
Patent Citations (2)
| Publication number | Priority date | Publication date | Assignee | Title |
|---|---|---|---|---|
| US20080049013A1 (en) | 2006-04-12 | 2008-02-28 | Edsa Micro Corporation | Systems and methods for real-time advanced visualization for predicting the health, reliability and performance of an electrical power system |
| WO2007131510A2 (en) | 2006-05-16 | 2007-11-22 | Targit A/S | A method of preparing an intelligent dashboard for data monitoring |
Cited By (2)
| Publication number | Priority date | Publication date | Assignee | Title |
|---|---|---|---|---|
| CN103886629A (zh) * | 2014-04-16 | 2014-06-25 | 广东威创视讯科技股份有限公司 | 图像处理方法和图像处理模块 |
| CN103886629B (zh) * | 2014-04-16 | 2017-07-14 | 广东威创视讯科技股份有限公司 | 图像处理方法和图像处理模块 |
Also Published As
| Publication number | Publication date |
|---|---|
| US20090254864A1 (en) | 2009-10-08 |
| EP2136325A3 (de) | 2010-01-13 |
| GB0806351D0 (en) | 2008-05-14 |
Similar Documents
| Publication | Publication Date | Title |
|---|---|---|
| EP2136325A2 (de) | Visualisierungssystem und Verfahren | |
| Teizer | Right-time vs real-time pro-active construction safety and health system architecture | |
| US20090231339A1 (en) | System, method and product for graphically displaying project status information | |
| US9727447B1 (en) | System, method, and computer program for automated exploratory testing | |
| Marriott et al. | An integrated methodology to prioritise improvement initiatives in low volume‐high integrity product manufacturing organisations | |
| US20120179512A1 (en) | Change management system | |
| US10067655B2 (en) | Visual and quantitative factors annalysis systems for relating a hierarchy of factors including one or more resources, tasks, and cognitive models displayed in a hierarchical graphical interface enabling visual and quantitative evaluation of sufficiency of such factors in relation to one or more problem/solution sets | |
| Muñoz-La Rivera et al. | A critical review of how extended reality (XR) has addressed key factors influencing safety on construction projects (fSCPs) | |
| US8514228B2 (en) | Method for the visual display of the quality of power transmitted on a power transmission system | |
| US20120041796A1 (en) | Technical maturity management system | |
| US9984345B2 (en) | Rule adjustment by visualization of physical location data | |
| Oni et al. | Sustainable model for improving construction industry health and safety practices | |
| Alegre et al. | Infrastructure asset management–the TRUST approach and professional tools | |
| JP2006139163A (ja) | 保安作業訓練システム | |
| KR101591300B1 (ko) | 원전 기기의 인간 공학 적합성 평가를 위한 장치 및 방법 | |
| JP5336850B2 (ja) | プロセス産業プラントの安全性評価のためのコンピュータ・システムおよびコンピュータ・ベースの方法 | |
| US20210406844A1 (en) | Method for carrying out maintenance work on a complex structural component | |
| Carnero et al. | Optimum decision making in asset management | |
| EP3082079A1 (de) | Verfahren und system zur identifizierung von marinekonfigurationen durch auswertung von betriebs- und designparametern | |
| Torre et al. | Assess Digital Maturity to Set Digital Transformation Strategy in Oil and Gas | |
| Barreto et al. | Defining and monitoring strategically aligned software improvement goals | |
| Smalley | Cognitive factors in the analysis, design, and assessment of command and control systems | |
| Ludwig et al. | Challenges in explaining source code quality assessment | |
| Paraty | IT Delivery Risk Assessment Framework | |
| Mikkelsen | Quality of project work and project management |
Legal Events
| Date | Code | Title | Description |
|---|---|---|---|
| PUAI | Public reference made under article 153(3) epc to a published international application that has entered the european phase |
Free format text: ORIGINAL CODE: 0009012 |
|
| PUAL | Search report despatched |
Free format text: ORIGINAL CODE: 0009013 |
|
| AK | Designated contracting states |
Kind code of ref document: A2 Designated state(s): AT BE BG CH CY CZ DE DK EE ES FI FR GB GR HR HU IE IS IT LI LT LU LV MC MK MT NL NO PL PT RO SE SI SK TR |
|
| AK | Designated contracting states |
Kind code of ref document: A3 Designated state(s): AT BE BG CH CY CZ DE DK EE ES FI FR GB GR HR HU IE IS IT LI LT LU LV MC MK MT NL NO PL PT RO SE SI SK TR |
|
| 17P | Request for examination filed |
Effective date: 20100907 |
|
| 17Q | First examination report despatched |
Effective date: 20101008 |
|
| RAP1 | Party data changed (applicant data changed or rights of an application transferred) |
Owner name: MOOD ENTERPRISES LIMITED |
|
| STAA | Information on the status of an ep patent application or granted ep patent |
Free format text: STATUS: THE APPLICATION IS DEEMED TO BE WITHDRAWN |
|
| 18D | Application deemed to be withdrawn |
Effective date: 20120306 |