EP2148611B1 - Affichage haute résolution de données physiologiques - Google Patents
Affichage haute résolution de données physiologiques Download PDFInfo
- Publication number
- EP2148611B1 EP2148611B1 EP08743141.7A EP08743141A EP2148611B1 EP 2148611 B1 EP2148611 B1 EP 2148611B1 EP 08743141 A EP08743141 A EP 08743141A EP 2148611 B1 EP2148611 B1 EP 2148611B1
- Authority
- EP
- European Patent Office
- Prior art keywords
- dataset
- data
- transparency
- display
- plot
- Prior art date
- Legal status (The legal status is an assumption and is not a legal conclusion. Google has not performed a legal analysis and makes no representation as to the accuracy of the status listed.)
- Active
Links
Images


Classifications
-
- A—HUMAN NECESSITIES
- A61—MEDICAL OR VETERINARY SCIENCE; HYGIENE
- A61B—DIAGNOSIS; SURGERY; IDENTIFICATION
- A61B5/00—Measuring for diagnostic purposes; Identification of persons
- A61B5/03—Measuring fluid pressure within the body other than blood pressure, e.g. cerebral pressure ; Measuring pressure in body tissues or organs
- A61B5/036—Measuring fluid pressure within the body other than blood pressure, e.g. cerebral pressure ; Measuring pressure in body tissues or organs by means introduced into body tracts
- A61B5/037—Measuring oesophageal pressure
-
- A—HUMAN NECESSITIES
- A61—MEDICAL OR VETERINARY SCIENCE; HYGIENE
- A61B—DIAGNOSIS; SURGERY; IDENTIFICATION
- A61B5/00—Measuring for diagnostic purposes; Identification of persons
- A61B5/05—Detecting, measuring or recording for diagnosis by means of electric currents or magnetic fields; Measuring using microwaves or radio waves
- A61B5/053—Measuring electrical impedance or conductance of a portion of the body
- A61B5/0538—Measuring electrical impedance or conductance of a portion of the body invasively, e.g. using a catheter
-
- A—HUMAN NECESSITIES
- A61—MEDICAL OR VETERINARY SCIENCE; HYGIENE
- A61B—DIAGNOSIS; SURGERY; IDENTIFICATION
- A61B5/00—Measuring for diagnostic purposes; Identification of persons
- A61B5/42—Detecting, measuring or recording for evaluating the gastrointestinal, the endocrine or the exocrine systems
- A61B5/4222—Evaluating particular parts, e.g. particular organs
- A61B5/4233—Evaluating particular parts, e.g. particular organs oesophagus
-
- A—HUMAN NECESSITIES
- A61—MEDICAL OR VETERINARY SCIENCE; HYGIENE
- A61B—DIAGNOSIS; SURGERY; IDENTIFICATION
- A61B5/00—Measuring for diagnostic purposes; Identification of persons
- A61B5/74—Details of notification to user or communication with user or patient; User input means
- A61B5/742—Details of notification to user or communication with user or patient; User input means using visual displays
- A61B5/7445—Display arrangements, e.g. multiple display units
-
- G—PHYSICS
- G16—INFORMATION AND COMMUNICATION TECHNOLOGY [ICT] SPECIALLY ADAPTED FOR SPECIFIC APPLICATION FIELDS
- G16H—HEALTHCARE INFORMATICS, i.e. INFORMATION AND COMMUNICATION TECHNOLOGY [ICT] SPECIALLY ADAPTED FOR THE HANDLING OR PROCESSING OF MEDICAL OR HEALTHCARE DATA
- G16H10/00—ICT specially adapted for the handling or processing of patient-related medical or healthcare data
- G16H10/60—ICT specially adapted for the handling or processing of patient-related medical or healthcare data for patient-specific data, e.g. for electronic patient records
-
- G—PHYSICS
- G16—INFORMATION AND COMMUNICATION TECHNOLOGY [ICT] SPECIALLY ADAPTED FOR SPECIFIC APPLICATION FIELDS
- G16H—HEALTHCARE INFORMATICS, i.e. INFORMATION AND COMMUNICATION TECHNOLOGY [ICT] SPECIALLY ADAPTED FOR THE HANDLING OR PROCESSING OF MEDICAL OR HEALTHCARE DATA
- G16H30/00—ICT specially adapted for the handling or processing of medical images
- G16H30/20—ICT specially adapted for the handling or processing of medical images for handling medical images, e.g. DICOM, HL7 or PACS
-
- A—HUMAN NECESSITIES
- A61—MEDICAL OR VETERINARY SCIENCE; HYGIENE
- A61B—DIAGNOSIS; SURGERY; IDENTIFICATION
- A61B5/00—Measuring for diagnostic purposes; Identification of persons
- A61B5/05—Detecting, measuring or recording for diagnosis by means of electric currents or magnetic fields; Measuring using microwaves or radio waves
- A61B5/053—Measuring electrical impedance or conductance of a portion of the body
Definitions
- the esophagus is a tubular organ that carries food and liquid from the throat to the stomach. Accurate measurements of physiological parameters of the esophagus under realistic swallowing conditions are valuable in diagnosing esophageal diseases such as Achalasia, dysphagia, diffuse esophageal spasm, ineffective esophageal motility, and hypertensive lower esophageal sphincter (LES).
- LES hypertensive lower esophageal sphincter
- LES hypertensive lower esophageal sphincter
- the function of the peristaltic muscle contractions i.e., to propel food and drinks through the esophagus to the stomach, is sometimes called the motility function, but is also often referred to as peristalsis.
- An upper esophageal sphincter is located at an upper end of the esophagus.
- the UES is a muscle that serves as a valve between the esophagus and the pharynx from which the esophagus receives food and liquid when swallowing.
- the lower esophageal sphincter is located at a lower end of the esophagus.
- the LES is a muscle that serves as a valve between the esophagus and the stomach.
- the LES protects the lower esophagus from stomach acid and bile, which causes the discomfort of heartburn and in time can damage or scar the esophagus.
- the LES is normally closed, but it opens momentarily when a peristaltic contraction approaches it to admit any swallowed volume of food or drink, which is called a "bolus," into the stomach.
- a peristaltic contraction passes through each point along the esophagus, the esophageal pressure at that point rises to a maximum and then falls back to a base pressure at the relaxed state.
- This peristaltic propagation of the esophageal contraction tends to propel the "bolus,” ahead of the point of peak pressure and down the esophagus toward the stomach.
- the motility function of the esophagus i.e., the esophagus' ability to move a mass, is dependent on several factors, including the peristaltic pressure profile and the characteristics of the esophageal muscles.
- a typical esophageal manometer includes an elongated catheter or probe with pressure sensors located along its length.
- the catheter or probe is designed to be inserted into the esophagus, typically reaching the LES and extending into the stomach of a patient, with the pressure sensors positioned at the LES and at a plurality of other specific points along the length of the esophagus at predetermined distances above the LES.
- the patient swallows a specific amount of water with the manometer placed in the esophagus.
- the esophageal pressure at the pressure sensors can be measured and used as an indication of the magnitude and sequence of the peristaltic contractions.
- the velocity of the peristaltic motion can also be ascertained from the location of the peak pressure, or onset of pressure rise, at each location as a function of time. The test can be repeated a number of times to obtain a set of pressure and velocity values, a statistical analysis of which may be used for diagnostic purposes.
- High-resolution manometry involves collection of data with a catheter having closely spaced sensors. Such high-resolution data enables spatiotemporal contour plots visualization of contractile pressure physiology. Products such as ManoScanTM data acquisition software and ManoViewTM data analysis software may be used to aid in visualizing high-resolution manometry data.
- High-resolution impedance has also been researched independently and also provides for spatiotemporal plotting of bolus movement.
- Electrical impedance at a plurality of points in the esophagus can be used to detect and monitor movement of a bolus through the esophagus.
- a bolus of water or food will have different electrical impedance than the non-filled esophagus, so a change in impedance in the esophagus indicates presence of a bolus.
- an elongated probe positioned in the esophagus with a plurality of impedance and/or acidity sensors dispersed along its length can be used to detect and monitor the bolus transit, i.e., the movement of a bolus through the esophagus.
- EP 1 665 988 A1 describes a living body information signal processing system combining a living body optical measurement apparatus and a brain wave measurement apparatus and a probe device used for the same, which, in particular, permits displaying a measurement result of living body optical signals and brain wave signals on a common display device and permits an accurate living body optical measurement eliminating ineffective measurement by making use of the measured brain wave signal data
- EP 1 554 982 A1 describes an ultrasonographic device adapted to combine tomographic and elasticity images as semitransparent image, and selectively display tomogram, color elasticity image and semi-transparent image. The brightness information and the hue information of each pixel of the combined image are obtained by adding the respective information of the monochrome tomographic image and the color elasticity image at a combination ratio.
- the invention relates to a system for displaying physiological data related to a bodily lumen.
- the system comprises a data source, a computer, and a display.
- the data source is a source of physiological data in the form of a first dataset and a second dataset, the first dataset and the second dataset comprising measurements of different physiological properties in a shared spatial region.
- the computer receives the first dataset and second dataset from the data source and outputs a composite image.
- the computer has a determining module that calculates a transparency for the second dataset within at least a portion of the shared spatial region and a compositing module for forming a composite image representing the first dataset and the second dataset based on the transparency value.
- the display displays the composite image output from the computer.
- the invention relates to a computer storage medium encoded as defined in the independent claim 1.
- the invention relates to a method of displaying at least a portion of a first dataset and at least a portion of a second dataset, the first dataset comprising a plurality of data values relating to a first property along a bodily lumen during a time interval and the second dataset relating to a second property along the bodily lumen during the time interval, the method being as defined in the independent claim 8.
- manometry data and impedance measurements indicating bolus position provide adjunctive information.
- the two measurements when properly displayed together, provide a more complete picture of the physiology of an organism.
- manometry provides information about the contractile pressures that normally drive a bolus and identify the opening and closing of the UES and LES, in certain situations, manometry alone may not provide sufficient information to understand the movement of bolus necessary to make a definitive diagnosis of certain disorders, such as diffuse esophageal spasm or ineffective esophageal motility.
- the inventors have also recognized and appreciated that these two types of data can be effectively superimposed as contour plots.
- the plots can be formed by displaying bolus measurement values for low bolus signal strength as partially or wholly transparent so that the underlying pressure values in co-registered contour plots. This approach is made tenable through the observation the bolus and contractile pressure are largely mutually exclusive, i.e. contractile pressures tend to displace the bolus, thus the pressure data is largely visible through the bolus contour plot.
- a diagnostic system may display high-resolution physiological data of a second property superimposed on data of a first property in a way that is accurately distributed spatially and synchronized temporally.
- Such a system may be used for data collected along a tubular organ of the body having an axial direction, and the data may be distributed in the axial direction. These data may be superimposed on both a profile display (instantaneous distribution of values along the axial direction) and on a spatiotemporal display (time history of that distribution).
- At least a portion of the plot of the second property is at least partially transparent to allow the data of the first property to be viewed concurrently.
- the data may be used to identify anatomical landmarks using the high-resolution data signatures so that the system can depict the data relative to a depiction of the anatomy in a way that is spatially accurate.
- the diagnostic systems displays high-resolution manometry data as the first physiological property with superimposed data indicating a position of a gastrointestinal bolus, such as with high-resolution conductance or impedance measurements, as the second physiological property.
- the diagnostic system allows for an intuitive visualization of gastrointestinal motility and other visceral processes that are suitable for measurement along some axial (longitudinal) dimension. By superimposing the physiological data in a spatially co-registered fashion, the interpretation of these data are made qualitatively more intuitive. Superposition in a spatiotemporal plane is helpful in visualizing both the instantaneous relationship between the properties and the time history of this relationship.
- the intuitive aspects of this visualization method are further enhanced by the registration of these spatially correlated data with the anatomy as identified from the anatomical signatures within the high-resolution data itself. Thus, the data are presented correctly relative to the anatomical landmarks and to one another.
- the physiological data of the first property may be stored as a first dataset and the physiological data of the second property may be stored as a second dataset.
- the physiological data may come from data collected inside the esophagus, other portions of the GI tract, the urinary tract, the vascular network, and other visceral systems in which high-resolution measurements of more than one physical property are made extending along at least one spatial dimension. Though, some embodiments may have applications beyond the presentation of physiological data to other types of appropriate datasets.
- Different embodiments may provide a useful way to display physiological datasets having two, three, or more degrees of freedom.
- a degree of freedom is counted for each axis used to specify a coordinate of a data value and for the data value itself.
- the position of a sensor along a catheter and the time of a manometry or conductance measurement represent two of the degrees of freedom.
- the measurement such as pressure or conductance, represents a third degree of freedom.
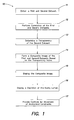
- a display may be formed according to the method 10 in FIG. 1 .
- Method 10 comprises steps 11 through 17, which may be performed in any order to the extent permitted by the dependency of the steps. Some steps may be optionally performed. Displays resulting from using exemplary embodiments of method 10 are shown in FIGs. 2B-2E and FIGs. 5-8 and referred to for illustration of the method. The embodiments shown in these drawings are described in detail following the description of method 10.
- a first dataset and a second dataset are obtained.
- the datasets may include high-resolution data acquired from a computer storage device, directly from a measurement apparatus, or by any other suitable means of acquiring data. At least a portion of both datasets correspond to the same spatial region, and the spatial relationship between the measurement sites of the two properties may be known.
- a time relationship between the data sets is also determinable.
- measurements for both data sets may be taken synchronously.
- timestamp for each measurement may be included in the datasets.
- any other suitable mechanism may be used to relate the values in each data set during period of time over which both data sets are collected.
- the first and second datasets represent pressure and conductance measurements, respectively, taken inside a bodily lumen, such as the esophagus, as measured by respective and closely spaced sensors along the length of a catheter.
- Electronics may perform measurements using these sensors and store the resulting data as first and second datasets.
- the electronics provide time information such as a time stamp or by synchronous data sampling.
- time information can be conveyed by providing a start or end time of the data set. This information, along with knowledge of sampling rate, allows one to synchronize the two data sets.
- the pressure dataset and conductance dataset in this example embodiment may both have three degrees of freedom: a measurement time coordinate, a measurement position coordinate (such as a position along the catheter), and a measurement value.
- the invention is not limited to use in conjunction with these specific properties.
- the datasets may represent any of temperature, acidity (pH), radiographic data, or any other measureable parameter.
- Correlation may include time synchronization.
- Correlation ensures that shared degrees of freedom, (e.g., time, position) between the first and second dataset, are in alignment with one another. For example, if both datasets have time as a coordinate axis, the relative times may be synchronized to a single reference timer so that simultaneous events in the first and second dataset have the same reference time. Correlation ensures that measurements from both datasets are properly registered with the coordinate system.
- the positions may be correlated.
- datasets may be correlated based on the manner in which the data is acquired. For example, datasets may be spatially correlated based on a predetermined spatial relationships of sensors used to collect the first and second data sets. The data sets may be correlated in time through the use of correlated sampling times. Accordingly, process at step 12 may not entail explicit data manipulation.
- a transparency is determined in step 13.
- the transparency determines the visibility of the second dataset when superimposed on the first.
- the inventors have recognized and appreciated that for certain types of physiological properties, selecting a transparency, which may be different for different portions of the second dataset or may be different at different times, can allow display of physiological data in a way that allows a human viewer of the information to better understand the physiological processes represented in the data.
- the data in plot 300 in ( FIG. 3 ), representing a manometry measurement, and the data in plot 400 ( FIG. 4 ), representing conductance each only take large values when the other is small (see legend 100 in FIG. 2A ).
- These figures provide an example of a scenario in which important information content of the second dataset may be substantially mutually exclusive to the important information content of the first dataset.
- transparency transformation captures which portion or portions of the second dataset contain important information and may be used to determine which portion of each dataset is used in generating a display. For example, in some embodiments it is preferable to display the second dataset with greatest transparency at coordinates where the data value is at a minimum and with least transparency (greatest opacity) at coordinates where the data value is at a maximum.
- the transparency at coordinates where the second dataset is at an intermediate value may be proportional to said value.
- plot 820 FIG. 8 ) shows a second dataset, represented by monochromatic color map, which appears to be superimposed over a first dataset when transparency is determined in this way.
- the transparency serves to weight the display at a coordinate towards either the first dataset (when the transparency value more closely represents a fully transparent state than an opaque state) or the second dataset (when the transparency value more closely represents an opaque state than a fully transparent state).
- the transparency at a coordinate is proportional to the value of the second dataset at the coordinate relative to its position between a minimum value ,and maximum value.
- the minimum value and maximum value may be user selected or determined by the second dataset directly. For example, a user may select the maximum value of the second dataset with upper limit control 124 and the minimum value of the second dataset with lower limit control 122 of legend 100 ( FIG 2A ).
- the transparency represents a fully transparent state; if the coordinate corresponds to a point of maximum value, the transparency represents an opaque state; and if the coordinate corresponds to a point with an intermediate value, the transparency represents a translucent, or semi-see-through state.
- the transparency of the second dataset at each coordinate location may be based on the data value of the second dataset at said coordinate location.
- a threshold value is selected between the minimum value and maximum value (absolute, or user selected) in the second dataset. In regions where the data values of the second dataset are above the upper threshold, the data values of the second dataset are represented without transparency. In regions where the data values of the second dataset are below the lower threshold, the data values of the second dataset are fully transparent (i.e., invisible) and the representation of the data values of the first dataset are visible.
- embodiment 500 FIG. 5
- a set of contour values may be selected for displaying the second dataset.
- the transparency at coordinates where the second dataset has a value equal to one of the contour values is highly opaque. Otherwise, the transparency may permit the first dataset to be visible. (See embodiment 600, FIG. 6 .)
- the transparency may be determined by a dithering pattern.
- the dithering pattern may be a random or predetermined pattern.
- the transparency may dither between indicating that the second dataset should be displayed with a highly transparent representation and indicating that the second dataset should be displayed with a highly opaque representation.
- the transparency of the second dataset may be determined according to any of the above example embodiments, or in any way suitable for combining the datasets into a single image for display.
- the transparency may be determined for some or all of the portion of the second dataset to be displayed.
- step 14 a composite image of the first and second datasets is formed based on the transparency of the second dataset. To form the composite image, a visual representation is selected for each dataset.
- the first and/or second datasets may be represented according to corresponding color maps (e.g., pressure color map 110 and conductance color map 120 in legend 100, FIG. 2A ).
- a color map indicates colors used to represent data values.
- Color maps may appear as a continuum of colors, each color being mapped to a data value, or as a discrete set of colors, each color representing an interval of data values.
- Color maps may appear as a transition between two or more colors. In one example, a color map transitions gradually from blue to green to yellow to red, and the dataset is represented by blue at a minimum value, by red at a maximum value, by green at a first intermediate value, and by yellow at a second intermediate value greater than the first.
- Color maps 810 and 815 are used in the embodiment 800 in the display of plot 820 ( FIG. 8 ).
- datasets are represented by discrete color maps according to legend 100 ( FIG. 2A ).
- each pattern may represent a unique color.
- These drawings include a limited number of colors, each corresponding to a relatively wide range of values. However, such a depiction is for simplicity of illustration and is not a limitation of the invention. Any suitable number of colors may be included in a color map and each color may be mapped to a small range of values. It should be appreciated that in many embodiments, a sufficient number of colors may be included in a color map to create the appearance of a continuum of colors. Though, it is not necessary that either or both datasets be represented by multiple colors. For example, one of the datasets may be depicted using a single color. For example, a single color may be used with varying transparency to represent ranges of values.
- the datasets may be displayed with visually distinctive representations.
- visual distinctiveness may be achieved by using different, and substantially non-overlapping colors to represent each dataset.
- the invention is not limited to creating visually distinctive representations for the dataset using different color maps.
- the composite image may be formed by determining, at some or all coordinates to be displayed, a display color.
- the display color is determined by mixing the colors from the respective color maps based on the transparency of the corresponding coordinate. The compositing calculation may be made as is known in the art or by any other suitable means.
- the display color may simply be the color representing the value of the first dataset.
- the displayed color may be the color associated with the value of the second dataset (e.g, embodiment 500, FIG. 5 ).
- the displayed color may correspond to a color determined by blending colors representing the value of the first dataset and the value of the second dataset at that coordinate. Techniques as known in the art for blending colors may be used, though any suitable technique may be employed. This approach for representing two data sets may be applied, regardless of the number of degrees of freedom of the data.
- the first dataset is represented by a color map
- the second dataset is represented by contour lines (e.g, embodiment 600, FIG. 6 ).
- the composite image may formed by rendering contour lines at the coordinates designated to be opaque in step 13.
- the contour lines may be rendered with a color corresponding to the values represented by those lines.
- the invention is not limited to display of values in color.
- step 15 the composite image is displayed.
- the display may be rendered by a computer on a display device, though any suitable device may be used. Regardless of how displayed, visually, in the composite image the second dataset may appear superimposed on the first dataset.
- the composite image may be displayed in the context of a user interface to the computer used to display the datasets.
- the user interface may include features that provide a user the ability to modify aspects of how method 10 is performed.
- Such control features may implemented as controls provided by the above mentioned ManoScanTM and ManoViewTM software. However, any suitable control mechanisms many be included
- a depiction of the bodily lumen is optionally displayed (e.g., embodiment 220, FIG. 2B ; embodiment 700, FIG. 7 ).
- the depiction may include reference features such as the pharynx, UES, esophagus, LES, stomach, and the like.
- the display may be initiated by a user interacting with controls that are provided by the user interface. Other controls may alter the appearance of the depiction of the anatomical features.
- controls for movement of anatomical landmarks are optionally displayed (e.g., controls 140 and 142 of embodiment 220, FIG 2B and embodiment 500, FIG. 5 ) as part of the user interface of the computer.
- These user adjustable controls may be provided as indicators of anatomical landmarks that can be discerned from displayed data. If the depiction of the bodily lumen in step 16 is performed, the depiction may be adjusted to correspond with the position of the controls.
- the anatomical landmark controls may be displayed along with guidelines across the data displayed in step 15 to facilitate a user positioning the indicators.
- the composite image displayed as a result of performing method 10 may present two sets of high-resolution physiological data such that the data are co-registered with respect to a position and time axis (e.g., embodiment 500, FIG. 5 ).
- the spatiotemporal relationship between the first and second datasets are maintained. Display of physiological data according to method 10 may ease the interpretation of physiological data and the diagnosis of a patient.
- Method 10 may be implemented in any suitable way.
- method 10 may be implemented through software code executable on a computing device using coding and display techniques as known for implementing data and analysis software, such as ManoScanTM data acquisition software and ManoViewTM data analysis software.
- data and analysis software such as ManoScanTM data acquisition software and ManoViewTM data analysis software.
- the software package may be stored on a computer storage medium encoded with instructions that, when executed by a computer system, perform the method 10.
- method 10 may be adapted to display more than two datasets.
- One degree of freedom corresponds to a coordinate axis common to each dataset, and the other corresponds to a data value.
- the illustrated displays may be displayed alone or may be displayed in conjunction with other displays.
- a display with two degrees of freedom may be displayed in conjunction with a display having three degrees of freedom.
- the display with two degrees of freedom may represent a portion of data along an axis in the display with three degrees of freedom.
- the display with two degrees of freedom may represent data for a specific time in the plot with three degrees of freedom.
- These displays may be static or dynamic. If static, the display with two degrees of freedom may represent values at a user specified time. If dynamic, the appearance of the display with two degrees of freedom may change over time.
- Measurement data of this type is indicative of peristaltic movements of a bolus through the upper GI tract including the esophagus.
- This data may, for example, be collected from a patient using a catheter with sensors to record pressure and conductivity measurements while a patient swallows a predetermined amount of water or other fluid.
- the datasets each have a positional coordinate.
- FIGs. 2B-2C show example embodiments where the datasets consist of manometry and conductance data collected along the length of an elongated catheter inside an esophagus.
- the manometry and conductance data are represented by the color map shown in plot legend 100 in FIG. 2A .
- the plot legend 100 has a pressure color map 110 and conductance color map 120.
- the colors of the pressure color map 110 are represented by patterns with increasing concentration of polka dots while the colors of the conductance color map 120 are represented by patterns with increasing concentration and/or thickness of diagonal lines.
- this representation is selected for simplicity and any suitable representation for values may be used.
- the pressure color map 110 illustrates the range of pressure measurement values.
- some embodiments of a user interface may have an upper limit control 114 and a lower limit control 112.
- the upper and lower limits controls are text fields or other display controls through which a user may enter a value.
- the color map may be scaled to these limits.
- the lower limit 112 and upper limit 114 have been assigned 0 and 160 mmHg, respectively.
- the color map may be scaled to the minimum and maximum values in the dataset or in any other suitable way.
- the conductance color map 120 illustrates the range of the conductance measurements.
- the colors of the conductance color map are distinct from the pressure color map.
- the lower limit 122 and upper limit 124 may also be adjustable. Here they are assigned values of 10 -4 and 10 -2 S, respectively.
- the scale of each dataset's legend may be adjusted to represent the dataset in an appropriate way.
- the scale may be linear such as for pressure color map 110 or logarithmic such as for conductance color map 120.
- the data values are presented side-by-side in two adjacent bars.
- An illustrative example is provided by adjacent embodiment 220 in FIG. 2B .
- the adjacent embodiment 220 shows a manometry data plot 222 and conductance data plot 224 side-by-side.
- Illustrative manometry and conductance data is represented according to the pressure color map 110 and conductance color map 120, respectively ( FIG. 2A ).
- a coordinate axis 130 may be provided alongside the data plots to provide coordinate information.
- an illustration of anatomy of the region where measurements were taken may be shown along with the data.
- the measurement data is collected along the upper gastrointestinal (GI) tract which is illustrated as reference rendering 210.
- the reference rendering 210 may have a number of reference features to clearly illustrate the position of the measurement data relative to important features of the surrounding area.
- the reference features may include the pharynx 211, UES 212, esophagus 213, LES 214, and stomach 215.
- a user interface presenting an illustration of anatomy may have one or more landmarks, such as landmarks 140 and 142, associated with the illustration.
- the landmarks may act as control features, allowing a user to specify the location of the certain portions of the anatomy relative to the axis 130.
- a user could position these landmarks based on displayed data.
- the illustration of the anatomy may be scaled and positioned relative to coordinate axis 130 for the specific situation, e.g., patients of different sizes.
- Embodiment 220 shown in FIG. 2B shows plots side-by-side.
- certain correlations exist that enable multiple datasets to be meaningfully combined in an overlapping display area.
- Such correlations may exist, for example, in datasets where pressure and conductance indicate the position of a bolus.
- the pressure data is relatively large. Below the transition point 226, the pressure is relatively small.
- the conductance data is relatively large below transition point 226, and relatively small above the transition point. Accordingly, it is possible to overlay the representation of the datasets without obscuring features of either data set likely to be used by a clinician analyzing the data.
- a combined embodiment 230 is provided in FIG. 2C .
- the manometry data and conductance data are combined onto a single data plot 232 here illustrated as a bar plot.
- a threshold 126 (see FIG. 2A ) associated with the conductance data (here the second dataset) is used to determine which data is displayed according to steps 13 and 14 of method 10 ( FIG. 1 ).
- only conductance data with values above the threshold 126 is displayed in combined embodiment 230 ( FIG. 2C ).
- pressure data is displayed.
- conductance information is displayed if it exceeds the threshold 126, otherwise the pressure data is displayed.
- the combined embodiment 230 is optionally displayed with coordinate axis 130 and reference rendering 210.
- FIG. 2D Another embodiment for displaying two types of physiological data is the line plot embodiment 240 illustrated in FIG. 2D .
- the illustrative example of pressure and conductance data are again illustrated, but here they are shown as lines 244 and 246, respectively, on data plot 242.
- coordinate axis 130 and reference rendering 210 are optionally displayed to provide context for the data.
- data may be displayed in mixed formats.
- a mixed plot embodiment 250 is shown in FIG. 2E .
- pressure data is displayed as line 254 and bolus data is displayed as a bar plot 252.
- coordinate axis 130 and reference rendering 210 are optionally displayed to provide context for the data.
- embodiments 220, 230, and 250 displayed some or part of the data in accordance with a color map, a pattern map or any other suitable representation or combination of representations may be used. It is preferable the representation of the first dataset and the second dataset be visually distinctive. Visual distinction may be achieved, for example, by using different color maps and/or pattern maps (embodiment 230, FIG. 2C ) or different line patterns (embodiment 240, FIG. 2D ). Though, embodiment 250 ( FIG. 2E ), in which a bar plot is used for one dataset and a line plot is used for another dataset, illustrates that visual distinctiveness may be achieved in other ways.
- the data processing and display techniques described above may be applied to the display of multiple datasets each having three degrees of freedom, two of the degrees representing a coordinate position (e.g., in a space-time plane) and a third representing a data value.
- these techniques may be used in a computer system rendering a display as part of a user interface to the computer system.
- the displays may be static, representing data at a user selected time or range of time.
- the data may be representing as a moving time plot in which data, representing measurements at later times, is added to one side of the display. As new data is added on one side, the previously presented data is shifted toward on apposite side. As new data is added, older data may be removed from the other side of the data.
- plot 300 presents pressure data as a function of position and time and shown according to pressure color map 110 ( FIG. 2A ).
- the two coordinate axes are position coordinate axis 130A and time coordinate axis 130B.
- the data from which plot 300 is created may constitute a first dataset.
- plot 400 presents conductance data as a function of position and time and shown according to conductance color map 120 ( FIG. 2A ).
- the data from which plot 400 is created may constitute a second dataset.
- the second dataset is collected over the same spatial region as the first dataset.
- plot 400 illustrates conductance data collected in about a 25 second interval
- plot 300 illustrates pressure data collected over a 40 second interval.
- the 25 second interval is a subset of the 40 second interval.
- the first dataset and the second dataset can be registered in time and space.
- FIG. 5 illustrates plot 500, which illustrates the composite image formed by combining the data of plot 300 ( FIG. 3 ) and plot 400 ( FIG. 4 ) using the same technique used for forming plot 232 in the combined embodiment 230 ( FIG. 2C ). Namely, in plot 500 conductance information is displayed if it exceeds threshold 126 ( FIG. 2A ). At a space-time coordinate where the conductance data is below the threshold 126, the pressure data is displayed.
- control 140 represents the position of the UES and control 142 represents the position of the LES.
- a user may position the adjustors through a user interface based on displayed data such that the computer system rendering the display receives inputs that the system can use in correctly displaying an image of anatomical features.
- the data values of the second dataset are displayed as contours.
- Plot 600 in FIG. 6 displays the pressure dataset according to the pressure color map 110 ( FIG. 2A ) but now displays the conductance data as contours 610, 620 and 630 representing equally valued points of 10 -3.1 , 10 -3 , and 10 -2.5 S/m, respectively.
- contours 610, 620 and 630 representing equally valued points of 10 -3.1 , 10 -3 , and 10 -2.5 S/m, respectively.
- different line patterns are used to distinguish contour 610, 620 and 630. Any suitable way of distinguishing the lines may be used, such as line markers, colors, line patterns, or a combination of such elements.
- the lines may be labeled with the data values they represent and/or a legend may be provided to indicate what each line represents.
- FIG. 7 An embodiment 700 is shown in FIG. 7 which combines embodiment 500 and embodiment 230, with the plot showing data with three degrees of freedom and the plot showing data with two degrees of freedom aligned along an axis representing a shared coordinate.
- this shared coordinate is the spatial dimension along the lumen where measurements were made.
- Embodiment 700 demonstrates that display techniques as described above may be used in a review mode for reviewing collected data. Coordinate axis 130 and position axis 130A both are for the same coordinate and are properly registered with one another.
- Embodiment 700 contains a time selector 710. The position of time selector 710 on the time axis 130B determines what data is rendered on single data plot 232.
- a user interface may provide a user the ability to select to the position of the time selector 710 on time axis 130B. When time selector 710 is repositioned, the single data plot 232 may be updated with data corresponding to the new position.
- embodiment 230 is integrated into embodiment 700, any embodiment for datasets having two degrees of freedom may be used. For example, embodiments 220, or 240 may be used in place of embodiment 230.
- the measurement profiles of the profile presented in embodiment 230, the plot 500, and the anatomical depiction 210 all have identical scaling and orientation in the spatial dimension.
- FIG. 8 illustrates an embodiment using the ManoViewTM software user interface adapted to display bolus location information superimposed on manometry data.
- Color map 810 is used to represent a first dataset containing pressure data in plot 820.
- Color map 820 is used to represent a second dataset containing conductance data in plot 820.
- color map 815 is a monochrome color map.
- Plot 830 displays pressure and conductance data corresponding to the position of time selector 840.
- the measurement profiles in plot 830, spatiotemporal plot 820, and anatomical depiction 850 all have identical scaling and orientation in the spatial dimension.
- Plot 820 may comprise data beyond the constraints of the plot window.
- the computer system rendering plot 820 may scroll the data across the display such that different windows in time are displayed. For example, plot 820 may scroll laterally along the direction of changing time. In some embodiments, plot 820 may scroll as additional values for the first dataset and/or second dataset are loaded. In other embodiments, the display may be scrolled in response to user input specifying a time to be displayed.
- the above discussed software for data analysis and viewing may, as is known in the art, may be executed on a system. Accordingly, method 10 ( FIG. 1 ) may be implemented by the system 900 shown in FIG. 9 .
- the system 900 includes a data source 910, a computer 920, and a display 930.
- the data source 910 provides the datasets to computer 920.
- the data source 910 is a computer storage medium.
- the data source 910 is a measurement device for performing experimental measurements.
- the data source 910 may be a catheter equipped with pressure and conductance sensors with appropriate drive electronics to perform measurements and transmit the measured values.
- the data source may provide datasets to computer 920 in real-time.
- the datasets may be provided in real-time to computer 920 such that computer 920 may process the datasets and output for display on display 930 before the physical parameters the datasets represent have significantly changed.
- Computer 920 may be embodied by any suitable computing device.
- Example embodiments of computer 920 include a PC, a microprocessor, a laptop computer, a personal digital assistants (PDAs), and the like.
- Computer 920 contains a determining module 922 and compositing module 924 which may be implemented in hardware, software, or a combination of the two. Determining module 922 may perform step 13 of method 10. Compositing module 924 may perform step 14 of method 10.
- Computer 920 outputs the composite image formed in step 14 to display 930.
- Display 930 may provide a visual presentation of the composite image according to step 15 of method 10.
- conductance As another example, the term "conductance" is used above.
- impedance measurements which are effectively the reciprocal of conductance measurements, also convey conductance information.
- the above-described embodiments invention can be implemented in any of numerous ways.
- the embodiments may be implemented using hardware, software or a combination thereof to obtain and produce the displays of physiological data.
- the software code can be executed on any suitable processor or collection of processors, whether provided in a single computer or distributed among multiple computers.
- a computer may be embodied in any of a number of forms, such as a rack-mounted computer, a desktop computer, a laptop computer, or a tablet computer. Additionally, a computer may be embedded in a device not generally regarded as a computer but with suitable processing capabilities, including a Personal Digital Assistant (PDA), a smart phone or any other suitable portable or fixed electronic device.
- PDA Personal Digital Assistant
- a computer may have one or more input and output devices. These devices can be used, among other things, to present a user interface. Examples of output devices that can be used to provide a user interface include printers or display screens for visual presentation of output and speakers or other sound generating devices for audible presentation of output. Examples of input devices that can be used for a user interface include keyboards, and pointing devices, such as mice, touch pads, and digitizing tablets. As another example, a computer may receive input information through speech recognition or in other audible format.
- Such computers may be interconnected by one or more networks in any suitable form, including as a local area network or a wide area network, such as an enterprise network or the Internet.
- networks may be based on any suitable technology and may operate according to any suitable protocol and may include wireless networks, wired networks or fiber optic networks.
- the various methods or processes outlined herein may be coded as software that is executable on one or more processors that employ any one of a variety of operating systems or platforms. Additionally, such software may be written using any of a number of suitable programming languages and/or programming or scripting tools, and also may be compiled as executable machine language code or intermediate code that is executed on a framework or virtual machine.
- the invention may be embodied as a computer readable medium (or multiple computer readable media) (e.g., a computer memory, one or more floppy discs, compact discs, optical discs, magnetic tapes, flash memories, circuit configurations in Field Programmable Gate Arrays or other semiconductor devices, or other tangible computer storage medium) encoded with one or more programs that, when executed on one or more computers or other processors, perform methods that implement the various embodiments discussed above.
- the computer readable medium or media can be transportable, such that the program or programs stored thereon can be loaded onto one or more different computers or other processors to implement various aspects of the present invention as discussed above.
- program or “software” are used herein in a generic sense to refer to any type of computer code or set of computer-executable instructions that can be employed to program a computer or other processor to implement various aspects of the present invention as discussed above. Additionally, it should be appreciated that according to one aspect of this embodiment, one or more computer programs that when executed perform methods of the present invention need not reside on a single computer or processor, but may be distributed in a modular fashion amongst a number of different computers or processors to implement various aspects of the present invention.
- Computer-executable instructions may be in many forms, such as program modules, executed by one or more computers or other devices.
- program modules include routines, programs, objects, components, data structures, etc. that perform particular tasks or implement particular abstract data types.
- functionality of the program modules may be combined or distributed as desired in various embodiments.
- data structures may be stored in computer-readable media in any suitable form.
- data structures may be shown to have fields that are related through location in the data structure. Such relationships may likewise be achieved by assigning storage for the fields with locations in a computer-readable medium that conveys relationship between the fields.
- any suitable mechanism may be used to establish a relationship between information in fields of a data structure, including through the use of pointers, tags or other mechanisms that establish relationship between data elements.
- the invention may be embodied as a method, of which an example has been provided.
- the acts performed as part of the method may be ordered in any suitable way. Accordingly, embodiments may be constructed in which acts are performed in an order different than illustrated, which may include performing some acts simultaneously, even though shown as sequential acts in illustrative embodiments.
Landscapes
- Health & Medical Sciences (AREA)
- Life Sciences & Earth Sciences (AREA)
- Public Health (AREA)
- Engineering & Computer Science (AREA)
- General Health & Medical Sciences (AREA)
- Medical Informatics (AREA)
- Biomedical Technology (AREA)
- Surgery (AREA)
- Physics & Mathematics (AREA)
- Veterinary Medicine (AREA)
- Biophysics (AREA)
- Pathology (AREA)
- Animal Behavior & Ethology (AREA)
- Heart & Thoracic Surgery (AREA)
- Molecular Biology (AREA)
- Epidemiology (AREA)
- Primary Health Care (AREA)
- Nuclear Medicine, Radiotherapy & Molecular Imaging (AREA)
- Radiology & Medical Imaging (AREA)
- Hematology (AREA)
- Endocrinology (AREA)
- Gastroenterology & Hepatology (AREA)
- Physiology (AREA)
- Measuring And Recording Apparatus For Diagnosis (AREA)
- Apparatus For Radiation Diagnosis (AREA)
Claims (20)
- Support de stockage informatique codé avec des instructions qui, lorsqu'elles sont exécutées par un système comprenant un ordinateur et un écran d'affichage, amènent ledit système à exécuter un procédé pour afficher des données physiologiques, le procédé comprenant les actes de :obtenir un premier ensemble de données et un deuxième ensemble de données d'une source de données des données physiologiques, le premier ensemble de données et le deuxième ensemble de données comprenant les mesures de différentes propriétés physiologiques dans une région spatiale partagée sur une période de temps ;déterminer une transparence du deuxième ensemble de données à des emplacements de coordonnées d'affichage dans au moins une portion de la région spatiale partagée sur la base d'une valeur de donnée du deuxième ensemble de données à chacun desdites emplacements de coordonnées ;former une image composite comprenant une représentation visuelle des premier et deuxième ensembles de données sur la base de la transparence ; etafficher l'image composite.
- Support de stockage informatique selon la revendication 1, dans lequel la détermination de la transparence comprend la détermination d'un motif d'activation pour afficher le deuxième ensemble de données.
- Support de stockage informatique selon la revendication 1, dans lequel la formation de l'image composite comprend :représenter le premier ensemble de données dans l'image composite en accord avec une première carte de couleurs ;représenter le deuxième ensemble de données dans l'image composite en accord avec une deuxième carte de couleurs, la deuxième carte de couleurs étant visuellement distincte de la première carte de couleurs ; etdéterminer les couleurs d'affichage, dans au moins une portion précitée de la région spatiale partagée, en mélangeant les premières et deuxièmes couleurs sur la base de la transparence, les premières couleurs représentant des valeurs de données physiologiques déterminées à partir du premier ensemble de données en accord avec la première carte de couleurs, et les deuxièmes couleurs représentant des valeurs de données physiologiques déterminées à partir du deuxième ensemble de données en accord avec la deuxième carte de couleurs.
- Support de stockage informatique selon la revendication 3, dans lequel :la détermination de la transparence comprend :déterminer une première région, dans la au moins une portion de la région spatiale partagée, où la transparence est entièrement transparente ;déterminer une deuxième région, dans la au moins une portion de la région spatiale partagée, où la transparence est opaque ; etla détermination des couleurs d'affichage comprend :sélectionner des premières couleurs représentant les valeurs de données physiologiques déterminées à partir du premier ensemble de données dans la première région ; etsélectionner des deuxièmes couleurs représentant les valeurs de données physiologiques déterminées à partir du deuxième ensemble de données dans la deuxième région.
- Support de stockage informatique selon la revendication 1, dans lequel le procédé comprend en outre :afficher une deuxième image adjacente à l'image composite, la deuxième image comprenant une première représentation d'au moins une portion du premier ensemble de données à un temps de mesure sélectionné et une deuxième représentation d'au moins une portion du deuxième ensemble de données au temps de mesure sélectionné ; etfaire coïncider un axe de position (130A) de l'image composite et un axe de coordonnées (130) de la deuxième image l'un avec l'autre.
- Support de stockage informatique selon la revendication 5, comprenant en outre :représenter une lumière corporelle avec des repères anatomiques enregistrés avec lesdits axes de position et de coordonnées ; etréaliser des marqueurs ajustables pour positionner les repères anatomiques.
- Support de stockage informatique selon l'une quelconque des revendications précédentes, dans lequel le procédé comprend en outre l'étape de :la synchronisation temporelle du premier ensemble de données et du deuxième ensemble de données.
- Procédé d'affichage d'au moins une portion d'un premier ensemble de données et d'au moins une portion d'un deuxième ensemble de données, le premier ensemble de données comprenant une pluralité de valeurs de données se rapportant à une première propriété le long d'une lumière corporelle durant un intervalle de temps, et le deuxième ensemble de données comprenant une pluralité de valeurs de données se rapportant à une deuxième propriété le long de la lumière corporelle durant l'intervalle de temps,
le procédé comprenant :déterminer une transparence du deuxième ensemble de données à des emplacements de coordonnées d'affichage dans au moins une portion de la région spatiale partagée sur la base d'une valeur de donnée du deuxième ensemble de données à chacun desdits emplacements de coordonnées ;former une image composite comprenant une représentation visuelle des premier et deuxième ensembles de données basée sur la transparence ; etafficher l'image composite. - Procédé selon la revendication 8, comprenant en outre :mettre en corrélation le premier ensemble de données et le deuxième ensemble de données dans l'espace et le temps ;sélectionner une portion du premier ensemble de données et une portion du deuxième ensemble de données sur la base de valeurs de données du deuxième ensemble de données ; etafficher sur un plot au moins la portion sélectionnée du premier ensemble de données et au moins la portion sélectionnée du deuxième ensemble de données corrélées dans l'espace et en temps, la portion sélectionnée du deuxième ensemble de données étant affichée en utilisant une représentation qui est visuellement distincte d'une représentation de la portion sélectionnée du premier ensemble de données.
- Procédé selon la revendication 9, dans lequel le premier ensemble de données comprend des valeurs représentant la pression dans la lumière corporelle.
- Procédé selon la revendication 10, dans lequel le deuxième ensemble de données comprend des valeurs représentant la conductance dans la lumière corporelle.
- Procédé selon la revendication 8, dans lequel la détermination d'une transparence du deuxième ensemble de données à chaque emplacement des coordonnées d'affichage comprend la sélection d'une transparence plus élevée pour l'emplacement des coordonnées d'affichage lorsque la valeur de donnée à l'emplacement des coordonnées d'affichage est plus basse et une transparence plus basse lorsque la valeur de donnée à l'emplacement des coordonnées d'affichage est plus élevée.
- Procédé selon la revendication 9, dans lequel la sélection de la portion du deuxième ensemble de données comprend la sélection de valeurs de données dans le deuxième ensemble de données au-dessus d'un seuil.
- Procédé selon la revendication 9, dans lequel le plot est un premier plot, et le procédé comprend en outre :afficher sur un deuxième plot adjacent au premier plot, pendant un temps de mesure sélectionné, au moins une de :la portion sélectionnée des premières données correspondant au temps de mesure sélectionné et au moins la portion sélectionnée des deuxièmes données correspondant au temps de mesure sélectionné ; ouune première portion des premières données correspondant au temps de mesure sélectionné côte-à-côté avec une deuxième portion des deuxièmes données correspondant au temps de mesure sélectionné.
- Procédé selon la revendication 9, dans lequel, à l'étape d'affichage, la portion sélectionnée du premier ensemble de données est affichée en accord avec une première carte de couleurs, et la portion sélectionnée du deuxième ensemble de données est affichée en accord avec une deuxième carte de couleurs, la deuxième carte de couleurs consistant essentiellement en couleurs qui se trouvent pas dans la première carte de couleurs.
- Procédé selon la revendication 9, dans lequel, à l'étape d'affichage, la portion sélectionnée du premier ensemble de données est affichée en accord avec une carte de couleurs, et la portion sélectionnée du deuxième ensemble de données est affichée comme un plot de ligne de contour.
- Procédé selon l'une quelconque des revendications 9 à 16, comprenant en outre :afficher, conjointement avec le plot, une représentation de la lumière corporelle avec des repères anatomiques en coïncidence avec un axe spatial du plot.
- Système d'affichage de données physiologiques se rapportant à une lumière corporelle, le système comprenant :une source de données (910) de données physiologiques sous la forme d'un premier ensemble de données et d'un deuxième ensemble de données, le premier ensemble de données et le deuxième ensemble de données comprenant des mesures de différentes propriétés physiologiques dans une région spatiale partagée sur une période de temps ;un ordinateur (920) destiné à recevoir le premier ensemble de données et le deuxième ensemble de données de la source de données et à émettre une image composite, l'ordinateur comprenant :un module de détermination (922) pour calculer une valeur de transparence pour le deuxième ensemble de données dans au moins une portion de la région spatiale partagée, où ledit module de détermination est configuré pour calculer la valeur de transparence du deuxième ensemble de données à l'emplacement des coordonnées d'affichage sur la base d'une valeur des données du deuxième ensemble de données à l'emplacement des coordonnées d'affichage ; etun module de composition (924) pour former une image composite représentant le premier ensemble de données et le deuxième ensemble de données sur la base de la valeur de transparence ; etun écran d'affichage (930) pour afficher l'image composite.
- Système selon la revendication 18, dans lequel la source de données comprend un cathéter comprenant une pluralité de capteurs de pression et une pluralité de capteurs d'impédance ayant une relation positionnelle prédéterminée.
- Système selon la revendication 18, dans lequel :le module de composition forme en outre une deuxième image représentant le premier ensemble de données et le deuxième ensemble de données à un temps sélectionné ; etl'écran d'affichage affiche la deuxième image en coïncidence avec un axe de coordonnées (130) de la deuxième image et un axe spatial (130A) de l'image composite en coïncidence l'une avec l'autre.
Applications Claiming Priority (2)
| Application Number | Priority Date | Filing Date | Title |
|---|---|---|---|
| US92554107P | 2007-04-20 | 2007-04-20 | |
| PCT/US2008/005120 WO2008130692A1 (fr) | 2007-04-20 | 2008-04-20 | Système de diagnostic pour affichage de données physiologiques haute résolution de multiples propriétés |
Publications (3)
| Publication Number | Publication Date |
|---|---|
| EP2148611A1 EP2148611A1 (fr) | 2010-02-03 |
| EP2148611A4 EP2148611A4 (fr) | 2013-03-27 |
| EP2148611B1 true EP2148611B1 (fr) | 2015-01-28 |
Family
ID=39875837
Family Applications (1)
| Application Number | Title | Priority Date | Filing Date |
|---|---|---|---|
| EP08743141.7A Active EP2148611B1 (fr) | 2007-04-20 | 2008-04-20 | Affichage haute résolution de données physiologiques |
Country Status (5)
| Country | Link |
|---|---|
| US (1) | US8306290B2 (fr) |
| EP (1) | EP2148611B1 (fr) |
| CN (1) | CN101754716B (fr) |
| CA (1) | CA2695599A1 (fr) |
| WO (1) | WO2008130692A1 (fr) |
Families Citing this family (20)
| Publication number | Priority date | Publication date | Assignee | Title |
|---|---|---|---|---|
| US10032236B2 (en) * | 2007-04-26 | 2018-07-24 | General Electric Company | Electronic health record timeline and the human figure |
| US9204858B2 (en) * | 2010-02-05 | 2015-12-08 | Ultrasonix Medical Corporation | Ultrasound pulse-wave doppler measurement of blood flow velocity and/or turbulence |
| US9526449B2 (en) * | 2010-06-07 | 2016-12-27 | The Medical College Of Wisconsin, Inc. | Detection and treatment of abnormal esophageal sphincter functionality |
| US9763587B2 (en) | 2010-06-10 | 2017-09-19 | Biosense Webster (Israel), Ltd. | Operator-controlled map point density |
| EP2593029A4 (fr) * | 2010-07-13 | 2015-03-04 | Sandhill Scient Inc | Appareil et procédé de détection et de mesure de l'état de la muqueuse oesophagienne et des indications de reflux gastro-oesophagien pathologique |
| GB2497492B (en) * | 2010-09-13 | 2016-10-05 | Women's And Children's Health Network Incorporated | Methods for assessing swallowing motor function |
| US9430831B2 (en) * | 2011-03-15 | 2016-08-30 | Koninklijke Philips N.V. | Correlated image mapping pointer |
| EP2720605B1 (fr) | 2011-06-14 | 2020-03-11 | Gravitas Medical Inc. | Appareil de guidage de soins médicaux sur la base d'une fonction gastrique détectée |
| US9782118B2 (en) * | 2013-05-17 | 2017-10-10 | Wisconsin Alumni Research Foundation | Diagnosis of swallowing disorders using high resolution manometry |
| BR112015028683A2 (pt) | 2013-05-17 | 2017-07-25 | Somna Therapeutics Llc | dispositivo de compressão e sensor de pressão para tratamento de funcionalidade de esfíncter de esôfago superior anormal |
| WO2015017837A1 (fr) * | 2013-08-01 | 2015-02-05 | The Regents Of The University Of California | Estimation de paramètres du tractus gastro-entérologique |
| US11141105B2 (en) | 2016-03-11 | 2021-10-12 | Respiratory Technology Corporation | Long-term therapeutic pressure applicator and real-time monitoring system |
| CN107041741A (zh) * | 2017-05-03 | 2017-08-15 | 刘珊珊 | 一种胆道测压管 |
| CN110709135B (zh) * | 2017-05-03 | 2024-04-16 | 皇家飞利浦有限公司 | 容积旋转调强放疗(vmat)计划的可视化 |
| DE102017006879B4 (de) | 2017-07-21 | 2021-01-28 | Krüger & Gothe GmbH | Vorrichtung zur manometrischen Messung von Druckverläufen in der Speiseröhre, dem Harn- und Darmtrakt von Mensch und Tier mittels gasperfundierten Kathetern zur Diagnostik von Funktionsstörungen |
| US11291382B2 (en) | 2018-06-01 | 2022-04-05 | Diversatek Healthcare, Inc. | System and method for detecting and measuring the condition of intraluminal esophageal mucosa |
| CN108814560B (zh) * | 2018-06-26 | 2021-03-02 | 重庆金山医疗器械有限公司 | 胃食管阻抗、pH和可视图像的同步显示方法及系统 |
| CN109091110B (zh) * | 2018-08-13 | 2021-04-13 | 重庆金山医疗器械有限公司 | 一种食道测压标识识别系统及电子设备和存储介质 |
| CN111345780B (zh) * | 2020-03-06 | 2023-02-28 | 重庆金山医疗技术研究院有限公司 | 一种高分辨率消化道测压数据分析方法及系统 |
| JP2023548155A (ja) * | 2020-10-30 | 2023-11-15 | ザ リージェンツ オブ ザ ユニバーシティ オブ カリフォルニア | 胃腸管パラメータを決定するための管腔内インピーダンス(hrmz)による高分解能内圧測定 |
Family Cites Families (31)
| Publication number | Priority date | Publication date | Assignee | Title |
|---|---|---|---|---|
| DE3516018A1 (de) * | 1985-05-02 | 1986-12-18 | Holger 1000 Berlin Kruse | Tragbares geraet zur feststellung der magenfunktion auf der grundlage der magensaeure |
| US5024240A (en) * | 1989-01-03 | 1991-06-18 | Mcconnel Fred M S | Manofluorography system, method for forming a manofluorogram and method for preparing a swallowing profile |
| US5117827A (en) * | 1990-10-26 | 1992-06-02 | Sandhill Scientific, Inc. | Apparatus and method for ambulatory reflux monitoring |
| US5438985A (en) * | 1993-01-25 | 1995-08-08 | Synectics Medical, Incorporated | Ambulatory recording of the presence and activity of substances in gastro-intestinal compartments |
| US5479935A (en) * | 1993-10-21 | 1996-01-02 | Synectics Medical, Inc. | Ambulatory reflux monitoring system |
| US5533515A (en) * | 1994-08-11 | 1996-07-09 | Foster-Miller | Solid state sphincter myometers |
| US6104941A (en) * | 1998-03-26 | 2000-08-15 | Ge Marquette Medical Systems, Inc. | Physiological sensor |
| US7052474B2 (en) * | 2000-10-02 | 2006-05-30 | Sandhill Scientific, Inc. | Pharyngoesophageal monitoring systems |
| WO2002102223A2 (fr) * | 2001-06-20 | 2002-12-27 | Given Imaging Ltd. | Analyse de motilité dans le tractus gastro-intestinal |
| JP2005507083A (ja) * | 2001-10-24 | 2005-03-10 | プレッシャー・プロファイル・システムズ・インコーポレーテッド | アレイ・センサ電子回路 |
| US6740047B2 (en) * | 2002-01-25 | 2004-05-25 | Harlan K. Holmes | Motility analysis, display, and interpretation system |
| US7708705B2 (en) * | 2002-07-03 | 2010-05-04 | Given Imaging Ltd. | System and method for sensing in-vivo stress and pressure |
| US20040143182A1 (en) * | 2002-08-08 | 2004-07-22 | Pavel Kucera | System and method for monitoring and stimulating gastro-intestinal motility |
| JP3932482B2 (ja) * | 2002-10-18 | 2007-06-20 | 株式会社日立メディコ | 超音波診断装置 |
| WO2004069032A2 (fr) * | 2003-01-29 | 2004-08-19 | Sandhill Scientific, Inc. | Milieu normalise provocant la deglutition et procede d'utilisation pour tester la fonction oesophagienne |
| JP3788977B2 (ja) * | 2003-03-31 | 2006-06-21 | 富士通株式会社 | データ表示装置 |
| US7082327B2 (en) * | 2003-04-16 | 2006-07-25 | Medtronic, Inc. | Biomedical signal analysis techniques using wavelets |
| US7184812B2 (en) * | 2003-05-13 | 2007-02-27 | Maquet Critical Care Ab | Control of inter-electrode resistivity to improve quality of measured electrical biological signals |
| CN100488449C (zh) * | 2003-05-13 | 2009-05-20 | 马奎特紧急护理公司 | 控制电极间电阻率从而改善测得的电生物信号的质量 |
| US7493158B2 (en) * | 2003-09-05 | 2009-02-17 | Sandhill Scientific, Inc. | Esophageal function display and playback system and method for displaying esophageal function |
| US20050080832A1 (en) * | 2003-09-05 | 2005-04-14 | Stuebe Thomas D. | Esophageal waveform analysis for detection and quantification of reflux episodes |
| EP1665988A4 (fr) * | 2003-09-19 | 2011-06-22 | Hitachi Medical Corp | Systeme de traitement de signaux d'informations d'un organisme comprenant une combinaison d'un dispositif de mesure de la lumiere d'un organisme et d'un dispositif de mesure des ondes cerebrales et sonde utilisee dans ce systeme |
| AU2004277001B2 (en) * | 2003-10-02 | 2010-08-19 | Given Imaging Ltd. | System and method for presentation of data streams |
| EP2417906B1 (fr) * | 2003-10-10 | 2015-04-15 | Given Imaging (Los Angeles) LLC | Procédé de configuration d'un cathéter de prise de pression, et gaine de cathéter |
| US8164672B2 (en) * | 2003-12-31 | 2012-04-24 | Given Imaging Ltd. | System and method for displaying an image stream |
| SE0401151D0 (sv) * | 2004-05-04 | 2004-05-04 | Benf Ab | Arrangement and method for assessing the motility of a generally tubular anatomical organ |
| US8790275B2 (en) * | 2004-05-17 | 2014-07-29 | Given Imaging (Los Angeles) Llc | Analysis and visualization methods using manometry data |
| US20060169294A1 (en) * | 2004-12-15 | 2006-08-03 | Kaler Karan V | Inertial navigation method and apparatus for wireless bolus transit monitoring in gastrointestinal tract |
| US20070060798A1 (en) * | 2005-09-15 | 2007-03-15 | Hagai Krupnik | System and method for presentation of data streams |
| US20070276196A1 (en) * | 2006-05-15 | 2007-11-29 | General Electric Company | Single acquisition system for electrophysiology and hemodynamic physiological diagnostic monitoring during a clinical invasive procedure |
| JP5513394B2 (ja) * | 2007-10-11 | 2014-06-04 | ギヴン イメージング(ロサンジェルス)エルエルシー | 管腔臓器内部の放射線学的に造影された材料の位置を測定、表示するシステム |
-
2008
- 2008-04-20 EP EP08743141.7A patent/EP2148611B1/fr active Active
- 2008-04-20 US US12/148,679 patent/US8306290B2/en active Active
- 2008-04-20 CN CN2008800207029A patent/CN101754716B/zh active Active
- 2008-04-20 WO PCT/US2008/005120 patent/WO2008130692A1/fr not_active Ceased
- 2008-04-20 CA CA2695599A patent/CA2695599A1/fr not_active Abandoned
Also Published As
| Publication number | Publication date |
|---|---|
| CN101754716A (zh) | 2010-06-23 |
| EP2148611A1 (fr) | 2010-02-03 |
| CA2695599A1 (fr) | 2008-10-30 |
| CN101754716B (zh) | 2013-05-15 |
| US20090003669A1 (en) | 2009-01-01 |
| WO2008130692A1 (fr) | 2008-10-30 |
| EP2148611A4 (fr) | 2013-03-27 |
| US8306290B2 (en) | 2012-11-06 |
Similar Documents
| Publication | Publication Date | Title |
|---|---|---|
| EP2148611B1 (fr) | Affichage haute résolution de données physiologiques | |
| US12333087B2 (en) | Interactive 3D cursor | |
| US8306604B2 (en) | Method of measuring and displaying the position of radiographically contrasted material within luminal body organs | |
| US8790275B2 (en) | Analysis and visualization methods using manometry data | |
| JP4740212B2 (ja) | データストリームを表示するためのシステム及び方法 | |
| US8075502B2 (en) | Visualization of values of a physical property detected in an organism over time | |
| US20070060798A1 (en) | System and method for presentation of data streams | |
| US20150173697A1 (en) | System and method for spatiotemporally synchronizing and displaying bodily organ images and physiological parameter(s) related thereto | |
| US10143416B2 (en) | Quantitation and display of impedance data for estimating gastroenterology tract parameters | |
| CN112740285A (zh) | 在虚拟环境中对医学图像的叠加和操纵 | |
| WO2011041262A2 (fr) | Rétroaction en temps réel de réalisation de tâche | |
| US9805161B2 (en) | Medical care data display control device, method and program | |
| KR102500378B1 (ko) | 자동 의료그림 생성시스템, 이를 이용한 자동 의료그림 생성 방법 및 머신 러닝 기반의 자동 의료그림 생성 시스템 | |
| EP3045100A1 (fr) | Dispositif d'affichage d'image, procédé d'affichage d'image et programme d'affichage d'image | |
| WO2016054775A1 (fr) | Système et méthode d'imagerie endoscopique virtuelle ultrasonore, et appareil associé | |
| US12423805B2 (en) | Image display apparatus, non-transitory computer readable storage medium storing control program, and image display system |
Legal Events
| Date | Code | Title | Description |
|---|---|---|---|
| PUAI | Public reference made under article 153(3) epc to a published international application that has entered the european phase |
Free format text: ORIGINAL CODE: 0009012 |
|
| 17P | Request for examination filed |
Effective date: 20091120 |
|
| AK | Designated contracting states |
Kind code of ref document: A1 Designated state(s): AT BE BG CH CY CZ DE DK EE ES FI FR GB GR HR HU IE IS IT LI LT LU LV MC MT NL NO PL PT RO SE SI SK TR |
|
| AX | Request for extension of the european patent |
Extension state: AL BA MK RS |
|
| DAX | Request for extension of the european patent (deleted) | ||
| RAP1 | Party data changed (applicant data changed or rights of an application transferred) |
Owner name: SIERRA SCIENTIFIC INSTRUMENTS, LLC |
|
| RAP1 | Party data changed (applicant data changed or rights of an application transferred) |
Owner name: GIVEN IMAGING (LOS ANGELES) LLC |
|
| A4 | Supplementary search report drawn up and despatched |
Effective date: 20130227 |
|
| RIC1 | Information provided on ipc code assigned before grant |
Ipc: A61B 5/03 20060101ALI20130221BHEP Ipc: A61B 5/053 20060101AFI20130221BHEP |
|
| 17Q | First examination report despatched |
Effective date: 20140219 |
|
| REG | Reference to a national code |
Ref country code: DE Ref legal event code: R079 Ref document number: 602008036555 Country of ref document: DE Free format text: PREVIOUS MAIN CLASS: A61B0005044000 Ipc: A61B0005000000 |
|
| GRAP | Despatch of communication of intention to grant a patent |
Free format text: ORIGINAL CODE: EPIDOSNIGR1 |
|
| RIC1 | Information provided on ipc code assigned before grant |
Ipc: G06Q 50/24 20120101ALI20140717BHEP Ipc: A61B 5/03 20060101ALI20140717BHEP Ipc: A61B 5/00 20060101AFI20140717BHEP Ipc: A61B 5/053 20060101ALI20140717BHEP |
|
| INTG | Intention to grant announced |
Effective date: 20140806 |
|
| GRAS | Grant fee paid |
Free format text: ORIGINAL CODE: EPIDOSNIGR3 |
|
| GRAA | (expected) grant |
Free format text: ORIGINAL CODE: 0009210 |
|
| AK | Designated contracting states |
Kind code of ref document: B1 Designated state(s): AT BE BG CH CY CZ DE DK EE ES FI FR GB GR HR HU IE IS IT LI LT LU LV MC MT NL NO PL PT RO SE SI SK TR |
|
| REG | Reference to a national code |
Ref country code: GB Ref legal event code: FG4D |
|
| REG | Reference to a national code |
Ref country code: CH Ref legal event code: EP |
|
| REG | Reference to a national code |
Ref country code: IE Ref legal event code: FG4D |
|
| REG | Reference to a national code |
Ref country code: NL Ref legal event code: T3 |
|
| REG | Reference to a national code |
Ref country code: DE Ref legal event code: R096 Ref document number: 602008036555 Country of ref document: DE Effective date: 20150312 |
|
| REG | Reference to a national code |
Ref country code: AT Ref legal event code: REF Ref document number: 707877 Country of ref document: AT Kind code of ref document: T Effective date: 20150315 |
|
| REG | Reference to a national code |
Ref country code: AT Ref legal event code: MK05 Ref document number: 707877 Country of ref document: AT Kind code of ref document: T Effective date: 20150128 |
|
| REG | Reference to a national code |
Ref country code: LT Ref legal event code: MG4D |
|
| PG25 | Lapsed in a contracting state [announced via postgrant information from national office to epo] |
Ref country code: HR Free format text: LAPSE BECAUSE OF FAILURE TO SUBMIT A TRANSLATION OF THE DESCRIPTION OR TO PAY THE FEE WITHIN THE PRESCRIBED TIME-LIMIT Effective date: 20150128 Ref country code: NO Free format text: LAPSE BECAUSE OF FAILURE TO SUBMIT A TRANSLATION OF THE DESCRIPTION OR TO PAY THE FEE WITHIN THE PRESCRIBED TIME-LIMIT Effective date: 20150428 Ref country code: LT Free format text: LAPSE BECAUSE OF FAILURE TO SUBMIT A TRANSLATION OF THE DESCRIPTION OR TO PAY THE FEE WITHIN THE PRESCRIBED TIME-LIMIT Effective date: 20150128 Ref country code: FI Free format text: LAPSE BECAUSE OF FAILURE TO SUBMIT A TRANSLATION OF THE DESCRIPTION OR TO PAY THE FEE WITHIN THE PRESCRIBED TIME-LIMIT Effective date: 20150128 Ref country code: ES Free format text: LAPSE BECAUSE OF FAILURE TO SUBMIT A TRANSLATION OF THE DESCRIPTION OR TO PAY THE FEE WITHIN THE PRESCRIBED TIME-LIMIT Effective date: 20150128 Ref country code: BG Free format text: LAPSE BECAUSE OF FAILURE TO SUBMIT A TRANSLATION OF THE DESCRIPTION OR TO PAY THE FEE WITHIN THE PRESCRIBED TIME-LIMIT Effective date: 20150428 Ref country code: SE Free format text: LAPSE BECAUSE OF FAILURE TO SUBMIT A TRANSLATION OF THE DESCRIPTION OR TO PAY THE FEE WITHIN THE PRESCRIBED TIME-LIMIT Effective date: 20150128 |
|
| PG25 | Lapsed in a contracting state [announced via postgrant information from national office to epo] |
Ref country code: AT Free format text: LAPSE BECAUSE OF FAILURE TO SUBMIT A TRANSLATION OF THE DESCRIPTION OR TO PAY THE FEE WITHIN THE PRESCRIBED TIME-LIMIT Effective date: 20150128 Ref country code: LV Free format text: LAPSE BECAUSE OF FAILURE TO SUBMIT A TRANSLATION OF THE DESCRIPTION OR TO PAY THE FEE WITHIN THE PRESCRIBED TIME-LIMIT Effective date: 20150128 Ref country code: GR Free format text: LAPSE BECAUSE OF FAILURE TO SUBMIT A TRANSLATION OF THE DESCRIPTION OR TO PAY THE FEE WITHIN THE PRESCRIBED TIME-LIMIT Effective date: 20150429 Ref country code: IS Free format text: LAPSE BECAUSE OF FAILURE TO SUBMIT A TRANSLATION OF THE DESCRIPTION OR TO PAY THE FEE WITHIN THE PRESCRIBED TIME-LIMIT Effective date: 20150528 Ref country code: PL Free format text: LAPSE BECAUSE OF FAILURE TO SUBMIT A TRANSLATION OF THE DESCRIPTION OR TO PAY THE FEE WITHIN THE PRESCRIBED TIME-LIMIT Effective date: 20150128 |
|
| REG | Reference to a national code |
Ref country code: DE Ref legal event code: R097 Ref document number: 602008036555 Country of ref document: DE |
|
| PG25 | Lapsed in a contracting state [announced via postgrant information from national office to epo] |
Ref country code: CZ Free format text: LAPSE BECAUSE OF FAILURE TO SUBMIT A TRANSLATION OF THE DESCRIPTION OR TO PAY THE FEE WITHIN THE PRESCRIBED TIME-LIMIT Effective date: 20150128 Ref country code: RO Free format text: LAPSE BECAUSE OF FAILURE TO SUBMIT A TRANSLATION OF THE DESCRIPTION OR TO PAY THE FEE WITHIN THE PRESCRIBED TIME-LIMIT Effective date: 20150128 Ref country code: EE Free format text: LAPSE BECAUSE OF FAILURE TO SUBMIT A TRANSLATION OF THE DESCRIPTION OR TO PAY THE FEE WITHIN THE PRESCRIBED TIME-LIMIT Effective date: 20150128 Ref country code: DK Free format text: LAPSE BECAUSE OF FAILURE TO SUBMIT A TRANSLATION OF THE DESCRIPTION OR TO PAY THE FEE WITHIN THE PRESCRIBED TIME-LIMIT Effective date: 20150128 Ref country code: SK Free format text: LAPSE BECAUSE OF FAILURE TO SUBMIT A TRANSLATION OF THE DESCRIPTION OR TO PAY THE FEE WITHIN THE PRESCRIBED TIME-LIMIT Effective date: 20150128 |
|
| PG25 | Lapsed in a contracting state [announced via postgrant information from national office to epo] |
Ref country code: MC Free format text: LAPSE BECAUSE OF FAILURE TO SUBMIT A TRANSLATION OF THE DESCRIPTION OR TO PAY THE FEE WITHIN THE PRESCRIBED TIME-LIMIT Effective date: 20150128 Ref country code: LU Free format text: LAPSE BECAUSE OF FAILURE TO SUBMIT A TRANSLATION OF THE DESCRIPTION OR TO PAY THE FEE WITHIN THE PRESCRIBED TIME-LIMIT Effective date: 20150420 |
|
| REG | Reference to a national code |
Ref country code: CH Ref legal event code: PL |
|
| PLBE | No opposition filed within time limit |
Free format text: ORIGINAL CODE: 0009261 |
|
| STAA | Information on the status of an ep patent application or granted ep patent |
Free format text: STATUS: NO OPPOSITION FILED WITHIN TIME LIMIT |
|
| 26N | No opposition filed |
Effective date: 20151029 |
|
| REG | Reference to a national code |
Ref country code: IE Ref legal event code: MM4A |
|
| PG25 | Lapsed in a contracting state [announced via postgrant information from national office to epo] |
Ref country code: LI Free format text: LAPSE BECAUSE OF NON-PAYMENT OF DUE FEES Effective date: 20150430 Ref country code: CH Free format text: LAPSE BECAUSE OF NON-PAYMENT OF DUE FEES Effective date: 20150430 |
|
| PG25 | Lapsed in a contracting state [announced via postgrant information from national office to epo] |
Ref country code: SI Free format text: LAPSE BECAUSE OF FAILURE TO SUBMIT A TRANSLATION OF THE DESCRIPTION OR TO PAY THE FEE WITHIN THE PRESCRIBED TIME-LIMIT Effective date: 20150128 |
|
| REG | Reference to a national code |
Ref country code: FR Ref legal event code: PLFP Year of fee payment: 9 |
|
| PG25 | Lapsed in a contracting state [announced via postgrant information from national office to epo] |
Ref country code: IE Free format text: LAPSE BECAUSE OF NON-PAYMENT OF DUE FEES Effective date: 20150420 |
|
| PG25 | Lapsed in a contracting state [announced via postgrant information from national office to epo] |
Ref country code: BE Free format text: LAPSE BECAUSE OF FAILURE TO SUBMIT A TRANSLATION OF THE DESCRIPTION OR TO PAY THE FEE WITHIN THE PRESCRIBED TIME-LIMIT Effective date: 20150128 |
|
| PG25 | Lapsed in a contracting state [announced via postgrant information from national office to epo] |
Ref country code: MT Free format text: LAPSE BECAUSE OF FAILURE TO SUBMIT A TRANSLATION OF THE DESCRIPTION OR TO PAY THE FEE WITHIN THE PRESCRIBED TIME-LIMIT Effective date: 20150128 |
|
| REG | Reference to a national code |
Ref country code: FR Ref legal event code: PLFP Year of fee payment: 10 |
|
| PG25 | Lapsed in a contracting state [announced via postgrant information from national office to epo] |
Ref country code: HU Free format text: LAPSE BECAUSE OF FAILURE TO SUBMIT A TRANSLATION OF THE DESCRIPTION OR TO PAY THE FEE WITHIN THE PRESCRIBED TIME-LIMIT; INVALID AB INITIO Effective date: 20080420 |
|
| PG25 | Lapsed in a contracting state [announced via postgrant information from national office to epo] |
Ref country code: CY Free format text: LAPSE BECAUSE OF FAILURE TO SUBMIT A TRANSLATION OF THE DESCRIPTION OR TO PAY THE FEE WITHIN THE PRESCRIBED TIME-LIMIT Effective date: 20150128 |
|
| PG25 | Lapsed in a contracting state [announced via postgrant information from national office to epo] |
Ref country code: PT Free format text: LAPSE BECAUSE OF FAILURE TO SUBMIT A TRANSLATION OF THE DESCRIPTION OR TO PAY THE FEE WITHIN THE PRESCRIBED TIME-LIMIT Effective date: 20150528 |
|
| PG25 | Lapsed in a contracting state [announced via postgrant information from national office to epo] |
Ref country code: TR Free format text: LAPSE BECAUSE OF FAILURE TO SUBMIT A TRANSLATION OF THE DESCRIPTION OR TO PAY THE FEE WITHIN THE PRESCRIBED TIME-LIMIT Effective date: 20150128 |
|
| REG | Reference to a national code |
Ref country code: FR Ref legal event code: PLFP Year of fee payment: 11 |
|
| PGFP | Annual fee paid to national office [announced via postgrant information from national office to epo] |
Ref country code: NL Payment date: 20200319 Year of fee payment: 13 |
|
| PGFP | Annual fee paid to national office [announced via postgrant information from national office to epo] |
Ref country code: IT Payment date: 20200318 Year of fee payment: 13 |
|
| REG | Reference to a national code |
Ref country code: NL Ref legal event code: MM Effective date: 20210501 |
|
| PG25 | Lapsed in a contracting state [announced via postgrant information from national office to epo] |
Ref country code: NL Free format text: LAPSE BECAUSE OF NON-PAYMENT OF DUE FEES Effective date: 20210501 |
|
| PG25 | Lapsed in a contracting state [announced via postgrant information from national office to epo] |
Ref country code: IT Free format text: LAPSE BECAUSE OF NON-PAYMENT OF DUE FEES Effective date: 20200420 |
|
| PGFP | Annual fee paid to national office [announced via postgrant information from national office to epo] |
Ref country code: DE Payment date: 20250319 Year of fee payment: 18 |
|
| PG25 | Lapsed in a contracting state [announced via postgrant information from national office to epo] |
Ref country code: IT Free format text: LAPSE BECAUSE OF NON-PAYMENT OF DUE FEES Effective date: 20210420 |
|
| PGFP | Annual fee paid to national office [announced via postgrant information from national office to epo] |
Ref country code: GB Payment date: 20260319 Year of fee payment: 19 |
|
| PGFP | Annual fee paid to national office [announced via postgrant information from national office to epo] |
Ref country code: FR Payment date: 20260320 Year of fee payment: 19 |