EP2161348A1 - Profilage d'expression génétique pour la surveillance d'identification et le traitement de l'arthrite rhumatoïde - Google Patents
Profilage d'expression génétique pour la surveillance d'identification et le traitement de l'arthrite rhumatoïde Download PDFInfo
- Publication number
- EP2161348A1 EP2161348A1 EP09075548A EP09075548A EP2161348A1 EP 2161348 A1 EP2161348 A1 EP 2161348A1 EP 09075548 A EP09075548 A EP 09075548A EP 09075548 A EP09075548 A EP 09075548A EP 2161348 A1 EP2161348 A1 EP 2161348A1
- Authority
- EP
- European Patent Office
- Prior art keywords
- constituent
- rheumatoid arthritis
- subject
- gene
- constituents
- Prior art date
- Legal status (The legal status is an assumption and is not a legal conclusion. Google has not performed a legal analysis and makes no representation as to the accuracy of the status listed.)
- Withdrawn
Links
- 206010039073 rheumatoid arthritis Diseases 0.000 title claims abstract description 349
- 238000011282 treatment Methods 0.000 title description 51
- 238000012544 monitoring process Methods 0.000 title description 6
- 238000011223 gene expression profiling Methods 0.000 title description 3
- 239000000470 constituent Substances 0.000 claims abstract description 178
- 238000000034 method Methods 0.000 claims abstract description 86
- 238000005259 measurement Methods 0.000 claims abstract description 68
- 108091032973 (ribonucleotides)n+m Proteins 0.000 claims abstract description 57
- 230000004968 inflammatory condition Effects 0.000 claims abstract description 39
- 230000003321 amplification Effects 0.000 claims abstract description 36
- 238000003199 nucleic acid amplification method Methods 0.000 claims abstract description 36
- 102000040650 (ribonucleotides)n+m Human genes 0.000 claims abstract description 13
- 101000831567 Homo sapiens Toll-like receptor 2 Proteins 0.000 claims description 206
- 102100024333 Toll-like receptor 2 Human genes 0.000 claims description 206
- 101000716102 Homo sapiens T-cell surface glycoprotein CD4 Proteins 0.000 claims description 121
- 102100036011 T-cell surface glycoprotein CD4 Human genes 0.000 claims description 121
- 101000990902 Homo sapiens Matrix metalloproteinase-9 Proteins 0.000 claims description 113
- 102100030412 Matrix metalloproteinase-9 Human genes 0.000 claims description 112
- 102100039928 Gamma-interferon-inducible protein 16 Human genes 0.000 claims description 91
- 101000960209 Homo sapiens Gamma-interferon-inducible protein 16 Proteins 0.000 claims description 91
- 101001037759 Homo sapiens Heat shock 70 kDa protein 1A Proteins 0.000 claims description 91
- 102100040352 Heat shock 70 kDa protein 1A Human genes 0.000 claims description 89
- 102100023050 Nuclear factor NF-kappa-B p105 subunit Human genes 0.000 claims description 79
- 101000635938 Homo sapiens Transforming growth factor beta-1 proprotein Proteins 0.000 claims description 77
- 102100030742 Transforming growth factor beta-1 proprotein Human genes 0.000 claims description 76
- 101000979342 Homo sapiens Nuclear factor NF-kappa-B p105 subunit Proteins 0.000 claims description 72
- 102100038280 Prostaglandin G/H synthase 2 Human genes 0.000 claims description 71
- 108010037462 Cyclooxygenase 2 Proteins 0.000 claims description 70
- 101000946889 Homo sapiens Monocyte differentiation antigen CD14 Proteins 0.000 claims description 54
- 101001030211 Homo sapiens Myc proto-oncogene protein Proteins 0.000 claims description 54
- 102100035877 Monocyte differentiation antigen CD14 Human genes 0.000 claims description 54
- 102100038895 Myc proto-oncogene protein Human genes 0.000 claims description 54
- 238000002560 therapeutic procedure Methods 0.000 claims description 54
- 108010022233 Plasminogen Activator Inhibitor 1 Proteins 0.000 claims description 52
- 102100039418 Plasminogen activator inhibitor 1 Human genes 0.000 claims description 52
- 101000599852 Homo sapiens Intercellular adhesion molecule 1 Proteins 0.000 claims description 50
- 102100037877 Intercellular adhesion molecule 1 Human genes 0.000 claims description 50
- 102100037077 Complement C1q subcomponent subunit A Human genes 0.000 claims description 46
- 101000740726 Homo sapiens Complement C1q subcomponent subunit A Proteins 0.000 claims description 46
- 101001019591 Homo sapiens Interleukin-18-binding protein Proteins 0.000 claims description 45
- 102100035017 Interleukin-18-binding protein Human genes 0.000 claims description 45
- 102100037907 High mobility group protein B1 Human genes 0.000 claims description 43
- 101100339431 Arabidopsis thaliana HMGB2 gene Proteins 0.000 claims description 42
- 108700010013 HMGB1 Proteins 0.000 claims description 42
- 101150021904 HMGB1 gene Proteins 0.000 claims description 42
- 210000004369 blood Anatomy 0.000 claims description 41
- 239000008280 blood Substances 0.000 claims description 41
- 101000980825 Homo sapiens B-lymphocyte antigen CD19 Proteins 0.000 claims description 40
- 102100024222 B-lymphocyte antigen CD19 Human genes 0.000 claims description 39
- 101001076418 Homo sapiens Interleukin-1 receptor type 1 Proteins 0.000 claims description 39
- 102100026016 Interleukin-1 receptor type 1 Human genes 0.000 claims description 39
- -1 CD86 Proteins 0.000 claims description 34
- 101000669513 Homo sapiens Metalloproteinase inhibitor 1 Proteins 0.000 claims description 34
- 102100023226 Early growth response protein 1 Human genes 0.000 claims description 32
- 101001049697 Homo sapiens Early growth response protein 1 Proteins 0.000 claims description 32
- 102100039364 Metalloproteinase inhibitor 1 Human genes 0.000 claims description 32
- 101000577891 Homo sapiens Myeloid cell nuclear differentiation antigen Proteins 0.000 claims description 28
- FDFPSNISSMYYDS-UHFFFAOYSA-N 2-ethyl-N,2-dimethylheptanamide Chemical compound CCCCCC(C)(CC)C(=O)NC FDFPSNISSMYYDS-UHFFFAOYSA-N 0.000 claims description 27
- 102100027994 Myeloid cell nuclear differentiation antigen Human genes 0.000 claims description 27
- 101001076407 Homo sapiens Interleukin-1 receptor antagonist protein Proteins 0.000 claims description 26
- 101000946843 Homo sapiens T-cell surface glycoprotein CD8 alpha chain Proteins 0.000 claims description 25
- 102100034922 T-cell surface glycoprotein CD8 alpha chain Human genes 0.000 claims description 25
- 102100026018 Interleukin-1 receptor antagonist protein Human genes 0.000 claims description 22
- 102100034524 Apoptotic protease-activating factor 1 Human genes 0.000 claims description 20
- 101000924629 Homo sapiens Apoptotic protease-activating factor 1 Proteins 0.000 claims description 20
- 101000738771 Homo sapiens Receptor-type tyrosine-protein phosphatase C Proteins 0.000 claims description 20
- 108700040183 Complement C1 Inhibitor Proteins 0.000 claims description 19
- 102100037422 Receptor-type tyrosine-protein phosphatase C Human genes 0.000 claims description 19
- 101150097162 SERPING1 gene Proteins 0.000 claims description 19
- 101000764535 Homo sapiens Lymphotoxin-alpha Proteins 0.000 claims description 18
- 102100026238 Lymphotoxin-alpha Human genes 0.000 claims description 18
- 101000868215 Homo sapiens CD40 ligand Proteins 0.000 claims description 17
- 102100032937 CD40 ligand Human genes 0.000 claims description 16
- 102100031988 Tumor necrosis factor ligand superfamily member 6 Human genes 0.000 claims description 16
- 230000004044 response Effects 0.000 claims description 16
- 101001089108 Lotus tetragonolobus Anti-H(O) lectin Proteins 0.000 claims description 15
- 101000638161 Homo sapiens Tumor necrosis factor ligand superfamily member 6 Proteins 0.000 claims description 14
- 102100025012 Dipeptidyl peptidase 4 Human genes 0.000 claims description 10
- 101000908391 Homo sapiens Dipeptidyl peptidase 4 Proteins 0.000 claims description 10
- 102100025621 Cytochrome b-245 heavy chain Human genes 0.000 claims description 9
- 108010082739 NADPH Oxidase 2 Proteins 0.000 claims description 9
- 210000001124 body fluid Anatomy 0.000 claims description 9
- 102100039696 Glutamate-cysteine ligase catalytic subunit Human genes 0.000 claims description 8
- 101001097889 Homo sapiens Platelet-activating factor acetylhydrolase Proteins 0.000 claims description 8
- 102100037518 Platelet-activating factor acetylhydrolase Human genes 0.000 claims description 8
- 239000010839 body fluid Substances 0.000 claims description 8
- 229940090124 dipeptidyl peptidase 4 (dpp-4) inhibitors for blood glucose lowering Drugs 0.000 claims description 8
- 101001034527 Homo sapiens Glutamate-cysteine ligase catalytic subunit Proteins 0.000 claims description 7
- 230000033001 locomotion Effects 0.000 claims description 7
- 102100027637 Plasma protease C1 inhibitor Human genes 0.000 claims 6
- 102000000849 HMGB Proteins Human genes 0.000 claims 1
- 108010001860 HMGB Proteins Proteins 0.000 claims 1
- 101001033249 Homo sapiens Interleukin-1 beta Proteins 0.000 claims 1
- 102100039065 Interleukin-1 beta Human genes 0.000 claims 1
- 230000014509 gene expression Effects 0.000 description 250
- 108090000623 proteins and genes Proteins 0.000 description 213
- 239000000523 sample Substances 0.000 description 109
- 239000003102 growth factor Substances 0.000 description 73
- 206010061218 Inflammation Diseases 0.000 description 64
- 230000004054 inflammatory process Effects 0.000 description 64
- 108010067802 HLA-DR alpha-Chains Proteins 0.000 description 63
- 102000019034 Chemokines Human genes 0.000 description 61
- 108010012236 Chemokines Proteins 0.000 description 61
- 102000004127 Cytokines Human genes 0.000 description 59
- 108090000695 Cytokines Proteins 0.000 description 59
- 210000004027 cell Anatomy 0.000 description 59
- 101000860430 Homo sapiens Versican core protein Proteins 0.000 description 51
- 102100028437 Versican core protein Human genes 0.000 description 51
- 230000006870 function Effects 0.000 description 44
- 208000037265 diseases, disorders, signs and symptoms Diseases 0.000 description 34
- 239000000203 mixture Substances 0.000 description 34
- 102000003810 Interleukin-18 Human genes 0.000 description 33
- 108090000171 Interleukin-18 Proteins 0.000 description 33
- 201000010099 disease Diseases 0.000 description 33
- 239000003814 drug Substances 0.000 description 30
- 238000004458 analytical method Methods 0.000 description 29
- 230000000770 proinflammatory effect Effects 0.000 description 29
- 239000003795 chemical substances by application Substances 0.000 description 28
- 238000012360 testing method Methods 0.000 description 28
- 239000003446 ligand Substances 0.000 description 26
- 235000018102 proteins Nutrition 0.000 description 25
- 102000004169 proteins and genes Human genes 0.000 description 25
- 101000611183 Homo sapiens Tumor necrosis factor Proteins 0.000 description 23
- 102100024040 Signal transducer and activator of transcription 3 Human genes 0.000 description 23
- 102100040247 Tumor necrosis factor Human genes 0.000 description 23
- 108010017324 STAT3 Transcription Factor Proteins 0.000 description 22
- 230000004913 activation Effects 0.000 description 22
- 229940079593 drug Drugs 0.000 description 22
- 230000000694 effects Effects 0.000 description 22
- 230000001225 therapeutic effect Effects 0.000 description 22
- 101150090724 3 gene Proteins 0.000 description 21
- 108010057466 NF-kappa B Proteins 0.000 description 21
- 210000001744 T-lymphocyte Anatomy 0.000 description 21
- 238000003556 assay Methods 0.000 description 21
- 230000008859 change Effects 0.000 description 21
- 230000002757 inflammatory effect Effects 0.000 description 21
- 108010018650 MEF2 Transcription Factors Proteins 0.000 description 20
- 102100039229 Myocyte-specific enhancer factor 2C Human genes 0.000 description 20
- 239000000137 peptide hydrolase inhibitor Substances 0.000 description 20
- 101150028074 2 gene Proteins 0.000 description 19
- 102100026550 Caspase-9 Human genes 0.000 description 19
- 101000983523 Homo sapiens Caspase-9 Proteins 0.000 description 19
- 108010082684 Transforming Growth Factor-beta Type II Receptor Proteins 0.000 description 19
- 102000004060 Transforming Growth Factor-beta Type II Receptor Human genes 0.000 description 19
- 229960000485 methotrexate Drugs 0.000 description 19
- FBOZXECLQNJBKD-ZDUSSCGKSA-N L-methotrexate Chemical compound C=1N=C2N=C(N)N=C(N)C2=NC=1CN(C)C1=CC=C(C(=O)N[C@@H](CCC(O)=O)C(O)=O)C=C1 FBOZXECLQNJBKD-ZDUSSCGKSA-N 0.000 description 18
- 102000003945 NF-kappa B Human genes 0.000 description 18
- 102000035195 Peptidases Human genes 0.000 description 18
- 108091005804 Peptidases Proteins 0.000 description 18
- 230000006907 apoptotic process Effects 0.000 description 18
- PCHJSUWPFVWCPO-UHFFFAOYSA-N gold Chemical compound [Au] PCHJSUWPFVWCPO-UHFFFAOYSA-N 0.000 description 18
- 102000003814 Interleukin-10 Human genes 0.000 description 17
- 108090000174 Interleukin-10 Proteins 0.000 description 17
- 230000001965 increasing effect Effects 0.000 description 17
- 150000007523 nucleic acids Chemical class 0.000 description 17
- 230000027455 binding Effects 0.000 description 16
- 230000005754 cellular signaling Effects 0.000 description 16
- 239000010931 gold Substances 0.000 description 16
- 229910052737 gold Inorganic materials 0.000 description 16
- 210000001519 tissue Anatomy 0.000 description 16
- 102100022712 Alpha-1-antitrypsin Human genes 0.000 description 15
- 101000823116 Homo sapiens Alpha-1-antitrypsin Proteins 0.000 description 15
- 102000000589 Interleukin-1 Human genes 0.000 description 15
- 108010002352 Interleukin-1 Proteins 0.000 description 15
- 239000002771 cell marker Substances 0.000 description 15
- 238000009826 distribution Methods 0.000 description 15
- 102000051628 Interleukin-1 receptor antagonist Human genes 0.000 description 14
- 230000003110 anti-inflammatory effect Effects 0.000 description 14
- 150000001875 compounds Chemical class 0.000 description 14
- 206010016256 fatigue Diseases 0.000 description 14
- 210000001503 joint Anatomy 0.000 description 14
- 210000001616 monocyte Anatomy 0.000 description 14
- 102000039446 nucleic acids Human genes 0.000 description 14
- 108020004707 nucleic acids Proteins 0.000 description 14
- 229940046728 tumor necrosis factor alpha inhibitor Drugs 0.000 description 14
- 239000002451 tumor necrosis factor inhibitor Substances 0.000 description 14
- 102000055157 Complement C1 Inhibitor Human genes 0.000 description 13
- 102000004890 Interleukin-8 Human genes 0.000 description 13
- 108090001007 Interleukin-8 Proteins 0.000 description 13
- 238000004422 calculation algorithm Methods 0.000 description 13
- 230000020411 cell activation Effects 0.000 description 13
- 239000002299 complementary DNA Substances 0.000 description 13
- 238000001514 detection method Methods 0.000 description 12
- 235000019833 protease Nutrition 0.000 description 12
- 238000013518 transcription Methods 0.000 description 12
- 230000035897 transcription Effects 0.000 description 12
- 101150084750 1 gene Proteins 0.000 description 11
- 101150033839 4 gene Proteins 0.000 description 11
- 206010023232 Joint swelling Diseases 0.000 description 11
- 238000012512 characterization method Methods 0.000 description 11
- 210000003979 eosinophil Anatomy 0.000 description 11
- 230000036541 health Effects 0.000 description 11
- 229940116176 remicade Drugs 0.000 description 11
- 108091007505 ADAM17 Proteins 0.000 description 10
- 102100031111 Disintegrin and metalloproteinase domain-containing protein 17 Human genes 0.000 description 10
- 108010008165 Etanercept Proteins 0.000 description 10
- 210000003719 b-lymphocyte Anatomy 0.000 description 10
- 238000011156 evaluation Methods 0.000 description 10
- 239000003550 marker Substances 0.000 description 10
- 239000000047 product Substances 0.000 description 10
- 108020004414 DNA Proteins 0.000 description 9
- 102100028006 Heme oxygenase 1 Human genes 0.000 description 9
- 101001079623 Homo sapiens Heme oxygenase 1 Proteins 0.000 description 9
- 108010050904 Interferons Proteins 0.000 description 9
- 102000018697 Membrane Proteins Human genes 0.000 description 9
- 108010052285 Membrane Proteins Proteins 0.000 description 9
- 239000000427 antigen Substances 0.000 description 9
- 108091007433 antigens Proteins 0.000 description 9
- 102000036639 antigens Human genes 0.000 description 9
- 238000013459 approach Methods 0.000 description 9
- 230000003399 chemotactic effect Effects 0.000 description 9
- 230000000875 corresponding effect Effects 0.000 description 9
- 229940096397 interleukin-8 Drugs 0.000 description 9
- XKTZWUACRZHVAN-VADRZIEHSA-N interleukin-8 Chemical compound C([C@H](NC(=O)[C@H](CC(O)=O)NC(=O)[C@H](CC=1C2=CC=CC=C2NC=1)NC(=O)[C@@H](NC(C)=O)CCSC)C(=O)N[C@@H](CC(O)=O)C(=O)N[C@@H](CC(O)=O)C(=O)N[C@@H](CC(C)C)C(=O)N[C@@H](CC(N)=O)C(=O)N[C@@H](CC=1C=CC=CC=1)C(=O)N[C@@H]([C@@H](C)O)C(=O)NCC(=O)N[C@@H](CCSC)C(=O)N1[C@H](CCC1)C(=O)N1[C@H](CCC1)C(=O)N[C@@H](C)C(=O)N[C@H](CC(O)=O)C(=O)N[C@H](CCC(O)=O)C(=O)N[C@H](CC(O)=O)C(=O)N[C@H](CC=1C=CC(O)=CC=1)C(=O)N[C@H](CO)C(=O)N1[C@H](CCC1)C(N)=O)C1=CC=CC=C1 XKTZWUACRZHVAN-VADRZIEHSA-N 0.000 description 9
- 102000005962 receptors Human genes 0.000 description 9
- 108020003175 receptors Proteins 0.000 description 9
- 230000000638 stimulation Effects 0.000 description 9
- 101001046683 Homo sapiens Integrin alpha-L Proteins 0.000 description 8
- 102100022339 Integrin alpha-L Human genes 0.000 description 8
- 102000014150 Interferons Human genes 0.000 description 8
- 108010002350 Interleukin-2 Proteins 0.000 description 8
- 102000000588 Interleukin-2 Human genes 0.000 description 8
- 208000002193 Pain Diseases 0.000 description 8
- 102000002689 Toll-like receptor Human genes 0.000 description 8
- 108020000411 Toll-like receptor Proteins 0.000 description 8
- 102000040945 Transcription factor Human genes 0.000 description 8
- 108091023040 Transcription factor Proteins 0.000 description 8
- 108060008682 Tumor Necrosis Factor Proteins 0.000 description 8
- 210000004698 lymphocyte Anatomy 0.000 description 8
- 210000002540 macrophage Anatomy 0.000 description 8
- 238000004519 manufacturing process Methods 0.000 description 8
- 210000000440 neutrophil Anatomy 0.000 description 8
- 230000003287 optical effect Effects 0.000 description 8
- 208000024891 symptom Diseases 0.000 description 8
- 102000016605 B-Cell Activating Factor Human genes 0.000 description 7
- 102100032752 C-reactive protein Human genes 0.000 description 7
- 101000851058 Homo sapiens Neutrophil elastase Proteins 0.000 description 7
- 101000760337 Homo sapiens Urokinase plasminogen activator surface receptor Proteins 0.000 description 7
- 229940119178 Interleukin 1 receptor antagonist Drugs 0.000 description 7
- 108700021006 Interleukin-1 receptor antagonist Proteins 0.000 description 7
- 102000000852 Tumor Necrosis Factor-alpha Human genes 0.000 description 7
- 102100024689 Urokinase plasminogen activator surface receptor Human genes 0.000 description 7
- 230000021164 cell adhesion Effects 0.000 description 7
- 230000010261 cell growth Effects 0.000 description 7
- 238000006243 chemical reaction Methods 0.000 description 7
- 230000004069 differentiation Effects 0.000 description 7
- 229940073621 enbrel Drugs 0.000 description 7
- 210000003714 granulocyte Anatomy 0.000 description 7
- 230000028993 immune response Effects 0.000 description 7
- 239000003407 interleukin 1 receptor blocking agent Substances 0.000 description 7
- 108090000765 processed proteins & peptides Proteins 0.000 description 7
- 230000019491 signal transduction Effects 0.000 description 7
- 102000011727 Caspases Human genes 0.000 description 6
- 108010076667 Caspases Proteins 0.000 description 6
- 102000004190 Enzymes Human genes 0.000 description 6
- 108090000790 Enzymes Proteins 0.000 description 6
- 102100034221 Growth-regulated alpha protein Human genes 0.000 description 6
- 101001069921 Homo sapiens Growth-regulated alpha protein Proteins 0.000 description 6
- 239000004365 Protease Substances 0.000 description 6
- 239000012190 activator Substances 0.000 description 6
- 239000012472 biological sample Substances 0.000 description 6
- 239000003153 chemical reaction reagent Substances 0.000 description 6
- 230000000295 complement effect Effects 0.000 description 6
- 230000006378 damage Effects 0.000 description 6
- 238000011161 development Methods 0.000 description 6
- 230000018109 developmental process Effects 0.000 description 6
- 238000003745 diagnosis Methods 0.000 description 6
- 239000002158 endotoxin Substances 0.000 description 6
- 229940088598 enzyme Drugs 0.000 description 6
- 238000000338 in vitro Methods 0.000 description 6
- 238000001727 in vivo Methods 0.000 description 6
- 230000028709 inflammatory response Effects 0.000 description 6
- 230000002401 inhibitory effect Effects 0.000 description 6
- 230000000977 initiatory effect Effects 0.000 description 6
- NOESYZHRGYRDHS-UHFFFAOYSA-N insulin Chemical compound N1C(=O)C(NC(=O)C(CCC(N)=O)NC(=O)C(CCC(O)=O)NC(=O)C(C(C)C)NC(=O)C(NC(=O)CN)C(C)CC)CSSCC(C(NC(CO)C(=O)NC(CC(C)C)C(=O)NC(CC=2C=CC(O)=CC=2)C(=O)NC(CCC(N)=O)C(=O)NC(CC(C)C)C(=O)NC(CCC(O)=O)C(=O)NC(CC(N)=O)C(=O)NC(CC=2C=CC(O)=CC=2)C(=O)NC(CSSCC(NC(=O)C(C(C)C)NC(=O)C(CC(C)C)NC(=O)C(CC=2C=CC(O)=CC=2)NC(=O)C(CC(C)C)NC(=O)C(C)NC(=O)C(CCC(O)=O)NC(=O)C(C(C)C)NC(=O)C(CC(C)C)NC(=O)C(CC=2NC=NC=2)NC(=O)C(CO)NC(=O)CNC2=O)C(=O)NCC(=O)NC(CCC(O)=O)C(=O)NC(CCCNC(N)=N)C(=O)NCC(=O)NC(CC=3C=CC=CC=3)C(=O)NC(CC=3C=CC=CC=3)C(=O)NC(CC=3C=CC(O)=CC=3)C(=O)NC(C(C)O)C(=O)N3C(CCC3)C(=O)NC(CCCCN)C(=O)NC(C)C(O)=O)C(=O)NC(CC(N)=O)C(O)=O)=O)NC(=O)C(C(C)CC)NC(=O)C(CO)NC(=O)C(C(C)O)NC(=O)C1CSSCC2NC(=O)C(CC(C)C)NC(=O)C(NC(=O)C(CCC(N)=O)NC(=O)C(CC(N)=O)NC(=O)C(NC(=O)C(N)CC=1C=CC=CC=1)C(C)C)CC1=CN=CN1 NOESYZHRGYRDHS-UHFFFAOYSA-N 0.000 description 6
- 239000000463 material Substances 0.000 description 6
- 210000000822 natural killer cell Anatomy 0.000 description 6
- 210000000056 organ Anatomy 0.000 description 6
- 239000002243 precursor Substances 0.000 description 6
- 102000004196 processed proteins & peptides Human genes 0.000 description 6
- 235000019419 proteases Nutrition 0.000 description 6
- 210000003491 skin Anatomy 0.000 description 6
- 239000000126 substance Substances 0.000 description 6
- 108010028006 B-Cell Activating Factor Proteins 0.000 description 5
- 102100035875 C-C chemokine receptor type 5 Human genes 0.000 description 5
- 102100031780 Endonuclease Human genes 0.000 description 5
- 102000010834 Extracellular Matrix Proteins Human genes 0.000 description 5
- 108010037362 Extracellular Matrix Proteins Proteins 0.000 description 5
- 101000998158 Homo sapiens NF-kappa-B inhibitor beta Proteins 0.000 description 5
- 102100033457 NF-kappa-B inhibitor beta Human genes 0.000 description 5
- 102100033174 Neutrophil elastase Human genes 0.000 description 5
- 108010092799 RNA-directed DNA polymerase Proteins 0.000 description 5
- 238000000540 analysis of variance Methods 0.000 description 5
- 230000008901 benefit Effects 0.000 description 5
- 239000000090 biomarker Substances 0.000 description 5
- 230000015572 biosynthetic process Effects 0.000 description 5
- 230000015556 catabolic process Effects 0.000 description 5
- 230000023549 cell-cell signaling Effects 0.000 description 5
- 230000009266 disease activity Effects 0.000 description 5
- 210000003743 erythrocyte Anatomy 0.000 description 5
- 210000002744 extracellular matrix Anatomy 0.000 description 5
- 230000012010 growth Effects 0.000 description 5
- 239000003112 inhibitor Substances 0.000 description 5
- 230000015788 innate immune response Effects 0.000 description 5
- 229940079322 interferon Drugs 0.000 description 5
- 229940054136 kineret Drugs 0.000 description 5
- 239000002609 medium Substances 0.000 description 5
- 229940021182 non-steroidal anti-inflammatory drug Drugs 0.000 description 5
- 235000016709 nutrition Nutrition 0.000 description 5
- 230000037081 physical activity Effects 0.000 description 5
- 229920001184 polypeptide Polymers 0.000 description 5
- 239000000758 substrate Substances 0.000 description 5
- 230000008961 swelling Effects 0.000 description 5
- XLYOFNOQVPJJNP-UHFFFAOYSA-N water Substances O XLYOFNOQVPJJNP-UHFFFAOYSA-N 0.000 description 5
- 229940088872 Apoptosis inhibitor Drugs 0.000 description 4
- 208000023275 Autoimmune disease Diseases 0.000 description 4
- 101710149870 C-C chemokine receptor type 5 Proteins 0.000 description 4
- 102100032367 C-C motif chemokine 5 Human genes 0.000 description 4
- 102100028990 C-X-C chemokine receptor type 3 Human genes 0.000 description 4
- 101150013553 CD40 gene Proteins 0.000 description 4
- 108090000397 Caspase 3 Proteins 0.000 description 4
- 102100029855 Caspase-3 Human genes 0.000 description 4
- 108010055166 Chemokine CCL5 Proteins 0.000 description 4
- 230000004544 DNA amplification Effects 0.000 description 4
- 102100039620 Granulocyte-macrophage colony-stimulating factor Human genes 0.000 description 4
- 101000916050 Homo sapiens C-X-C chemokine receptor type 3 Proteins 0.000 description 4
- 101000746367 Homo sapiens Granulocyte colony-stimulating factor Proteins 0.000 description 4
- 101000582950 Homo sapiens Platelet factor 4 Proteins 0.000 description 4
- 102000008070 Interferon-gamma Human genes 0.000 description 4
- 108010074328 Interferon-gamma Proteins 0.000 description 4
- 101710144554 Interleukin-1 receptor antagonist protein Proteins 0.000 description 4
- 102000003812 Interleukin-15 Human genes 0.000 description 4
- 108090000172 Interleukin-15 Proteins 0.000 description 4
- 102100037791 Macrophage migration inhibitory factor Human genes 0.000 description 4
- TWRXJAOTZQYOKJ-UHFFFAOYSA-L Magnesium chloride Chemical compound [Mg+2].[Cl-].[Cl-] TWRXJAOTZQYOKJ-UHFFFAOYSA-L 0.000 description 4
- 206010052904 Musculoskeletal stiffness Diseases 0.000 description 4
- 108091034117 Oligonucleotide Proteins 0.000 description 4
- 102100030304 Platelet factor 4 Human genes 0.000 description 4
- MTCFGRXMJLQNBG-UHFFFAOYSA-N Serine Natural products OCC(N)C(O)=O MTCFGRXMJLQNBG-UHFFFAOYSA-N 0.000 description 4
- 230000006044 T cell activation Effects 0.000 description 4
- 102100040245 Tumor necrosis factor receptor superfamily member 5 Human genes 0.000 description 4
- 230000009471 action Effects 0.000 description 4
- 238000011366 aggressive therapy Methods 0.000 description 4
- 239000000158 apoptosis inhibitor Substances 0.000 description 4
- YZXBAPSDXZZRGB-DOFZRALJSA-N arachidonic acid Chemical compound CCCCC\C=C/C\C=C/C\C=C/C\C=C/CCCC(O)=O YZXBAPSDXZZRGB-DOFZRALJSA-N 0.000 description 4
- 210000003651 basophil Anatomy 0.000 description 4
- RZEKVGVHFLEQIL-UHFFFAOYSA-N celecoxib Chemical compound C1=CC(C)=CC=C1C1=CC(C(F)(F)F)=NN1C1=CC=C(S(N)(=O)=O)C=C1 RZEKVGVHFLEQIL-UHFFFAOYSA-N 0.000 description 4
- 231100000433 cytotoxic Toxicity 0.000 description 4
- 230000001472 cytotoxic effect Effects 0.000 description 4
- 230000003247 decreasing effect Effects 0.000 description 4
- 238000013461 design Methods 0.000 description 4
- 210000002889 endothelial cell Anatomy 0.000 description 4
- 238000009472 formulation Methods 0.000 description 4
- 210000002443 helper t lymphocyte Anatomy 0.000 description 4
- 238000003384 imaging method Methods 0.000 description 4
- 230000001506 immunosuppresive effect Effects 0.000 description 4
- 230000001939 inductive effect Effects 0.000 description 4
- 208000015181 infectious disease Diseases 0.000 description 4
- 229960000598 infliximab Drugs 0.000 description 4
- 229920006008 lipopolysaccharide Polymers 0.000 description 4
- 238000007477 logistic regression Methods 0.000 description 4
- 239000011159 matrix material Substances 0.000 description 4
- 230000008569 process Effects 0.000 description 4
- 238000003753 real-time PCR Methods 0.000 description 4
- 238000000926 separation method Methods 0.000 description 4
- 210000002966 serum Anatomy 0.000 description 4
- 230000004936 stimulating effect Effects 0.000 description 4
- 229940124597 therapeutic agent Drugs 0.000 description 4
- 206010048998 Acute phase reaction Diseases 0.000 description 3
- 102000011767 Acute-Phase Proteins Human genes 0.000 description 3
- 108010062271 Acute-Phase Proteins Proteins 0.000 description 3
- 102100021569 Apoptosis regulator Bcl-2 Human genes 0.000 description 3
- 208000006820 Arthralgia Diseases 0.000 description 3
- 102100024167 C-C chemokine receptor type 3 Human genes 0.000 description 3
- 101710149862 C-C chemokine receptor type 3 Proteins 0.000 description 3
- 102100023702 C-C motif chemokine 13 Human genes 0.000 description 3
- 102100032366 C-C motif chemokine 7 Human genes 0.000 description 3
- 108010074051 C-Reactive Protein Proteins 0.000 description 3
- 108010008978 Chemokine CXCL10 Proteins 0.000 description 3
- 102000010911 Enzyme Precursors Human genes 0.000 description 3
- 108010062466 Enzyme Precursors Proteins 0.000 description 3
- 102100023688 Eotaxin Human genes 0.000 description 3
- 101710139422 Eotaxin Proteins 0.000 description 3
- 241000282412 Homo Species 0.000 description 3
- 101001090860 Homo sapiens Myeloblastin Proteins 0.000 description 3
- 101001057750 Human cytomegalovirus (strain AD169) Uncharacterized protein IRL2 Proteins 0.000 description 3
- 102000004877 Insulin Human genes 0.000 description 3
- 108090001061 Insulin Proteins 0.000 description 3
- 102000019223 Interleukin-1 receptor Human genes 0.000 description 3
- 108050006617 Interleukin-1 receptor Proteins 0.000 description 3
- 102000004889 Interleukin-6 Human genes 0.000 description 3
- 108090001005 Interleukin-6 Proteins 0.000 description 3
- AYFVYJQAPQTCCC-GBXIJSLDSA-N L-threonine Chemical compound C[C@@H](O)[C@H](N)C(O)=O AYFVYJQAPQTCCC-GBXIJSLDSA-N 0.000 description 3
- 101710119980 Macrophage migration inhibitory factor Proteins 0.000 description 3
- 102000012750 Membrane Glycoproteins Human genes 0.000 description 3
- 108010090054 Membrane Glycoproteins Proteins 0.000 description 3
- 102000005741 Metalloproteases Human genes 0.000 description 3
- 108010006035 Metalloproteases Proteins 0.000 description 3
- 229940124158 Protease/peptidase inhibitor Drugs 0.000 description 3
- 238000002123 RNA extraction Methods 0.000 description 3
- 108060008683 Tumor Necrosis Factor Receptor Proteins 0.000 description 3
- 241000700605 Viruses Species 0.000 description 3
- JLCPHMBAVCMARE-UHFFFAOYSA-N [3-[[3-[[3-[[3-[[3-[[3-[[3-[[3-[[3-[[3-[[3-[[5-(2-amino-6-oxo-1H-purin-9-yl)-3-[[3-[[3-[[3-[[3-[[3-[[5-(2-amino-6-oxo-1H-purin-9-yl)-3-[[5-(2-amino-6-oxo-1H-purin-9-yl)-3-hydroxyoxolan-2-yl]methoxy-hydroxyphosphoryl]oxyoxolan-2-yl]methoxy-hydroxyphosphoryl]oxy-5-(5-methyl-2,4-dioxopyrimidin-1-yl)oxolan-2-yl]methoxy-hydroxyphosphoryl]oxy-5-(6-aminopurin-9-yl)oxolan-2-yl]methoxy-hydroxyphosphoryl]oxy-5-(6-aminopurin-9-yl)oxolan-2-yl]methoxy-hydroxyphosphoryl]oxy-5-(6-aminopurin-9-yl)oxolan-2-yl]methoxy-hydroxyphosphoryl]oxy-5-(6-aminopurin-9-yl)oxolan-2-yl]methoxy-hydroxyphosphoryl]oxyoxolan-2-yl]methoxy-hydroxyphosphoryl]oxy-5-(5-methyl-2,4-dioxopyrimidin-1-yl)oxolan-2-yl]methoxy-hydroxyphosphoryl]oxy-5-(4-amino-2-oxopyrimidin-1-yl)oxolan-2-yl]methoxy-hydroxyphosphoryl]oxy-5-(5-methyl-2,4-dioxopyrimidin-1-yl)oxolan-2-yl]methoxy-hydroxyphosphoryl]oxy-5-(5-methyl-2,4-dioxopyrimidin-1-yl)oxolan-2-yl]methoxy-hydroxyphosphoryl]oxy-5-(6-aminopurin-9-yl)oxolan-2-yl]methoxy-hydroxyphosphoryl]oxy-5-(6-aminopurin-9-yl)oxolan-2-yl]methoxy-hydroxyphosphoryl]oxy-5-(4-amino-2-oxopyrimidin-1-yl)oxolan-2-yl]methoxy-hydroxyphosphoryl]oxy-5-(4-amino-2-oxopyrimidin-1-yl)oxolan-2-yl]methoxy-hydroxyphosphoryl]oxy-5-(4-amino-2-oxopyrimidin-1-yl)oxolan-2-yl]methoxy-hydroxyphosphoryl]oxy-5-(6-aminopurin-9-yl)oxolan-2-yl]methoxy-hydroxyphosphoryl]oxy-5-(4-amino-2-oxopyrimidin-1-yl)oxolan-2-yl]methyl [5-(6-aminopurin-9-yl)-2-(hydroxymethyl)oxolan-3-yl] hydrogen phosphate Polymers Cc1cn(C2CC(OP(O)(=O)OCC3OC(CC3OP(O)(=O)OCC3OC(CC3O)n3cnc4c3nc(N)[nH]c4=O)n3cnc4c3nc(N)[nH]c4=O)C(COP(O)(=O)OC3CC(OC3COP(O)(=O)OC3CC(OC3COP(O)(=O)OC3CC(OC3COP(O)(=O)OC3CC(OC3COP(O)(=O)OC3CC(OC3COP(O)(=O)OC3CC(OC3COP(O)(=O)OC3CC(OC3COP(O)(=O)OC3CC(OC3COP(O)(=O)OC3CC(OC3COP(O)(=O)OC3CC(OC3COP(O)(=O)OC3CC(OC3COP(O)(=O)OC3CC(OC3COP(O)(=O)OC3CC(OC3COP(O)(=O)OC3CC(OC3COP(O)(=O)OC3CC(OC3COP(O)(=O)OC3CC(OC3COP(O)(=O)OC3CC(OC3CO)n3cnc4c(N)ncnc34)n3ccc(N)nc3=O)n3cnc4c(N)ncnc34)n3ccc(N)nc3=O)n3ccc(N)nc3=O)n3ccc(N)nc3=O)n3cnc4c(N)ncnc34)n3cnc4c(N)ncnc34)n3cc(C)c(=O)[nH]c3=O)n3cc(C)c(=O)[nH]c3=O)n3ccc(N)nc3=O)n3cc(C)c(=O)[nH]c3=O)n3cnc4c3nc(N)[nH]c4=O)n3cnc4c(N)ncnc34)n3cnc4c(N)ncnc34)n3cnc4c(N)ncnc34)n3cnc4c(N)ncnc34)O2)c(=O)[nH]c1=O JLCPHMBAVCMARE-UHFFFAOYSA-N 0.000 description 3
- 230000001154 acute effect Effects 0.000 description 3
- 230000001640 apoptogenic effect Effects 0.000 description 3
- 210000000988 bone and bone Anatomy 0.000 description 3
- 230000024245 cell differentiation Effects 0.000 description 3
- 230000001684 chronic effect Effects 0.000 description 3
- 238000004891 communication Methods 0.000 description 3
- 230000007423 decrease Effects 0.000 description 3
- 238000005516 engineering process Methods 0.000 description 3
- 229960000403 etanercept Drugs 0.000 description 3
- 238000010195 expression analysis Methods 0.000 description 3
- 210000001508 eye Anatomy 0.000 description 3
- 230000003394 haemopoietic effect Effects 0.000 description 3
- 230000036039 immunity Effects 0.000 description 3
- 230000004957 immunoregulator effect Effects 0.000 description 3
- 230000006698 induction Effects 0.000 description 3
- 208000027866 inflammatory disease Diseases 0.000 description 3
- 229940125396 insulin Drugs 0.000 description 3
- 229940047124 interferons Drugs 0.000 description 3
- 108020004999 messenger RNA Proteins 0.000 description 3
- 230000002503 metabolic effect Effects 0.000 description 3
- 230000004060 metabolic process Effects 0.000 description 3
- 210000004940 nucleus Anatomy 0.000 description 3
- 239000002417 nutraceutical Substances 0.000 description 3
- 230000035790 physiological processes and functions Effects 0.000 description 3
- 229940012957 plasmin Drugs 0.000 description 3
- 238000004393 prognosis Methods 0.000 description 3
- 230000035755 proliferation Effects 0.000 description 3
- 238000003908 quality control method Methods 0.000 description 3
- 230000007115 recruitment Effects 0.000 description 3
- 239000013074 reference sample Substances 0.000 description 3
- 230000002441 reversible effect Effects 0.000 description 3
- 239000003161 ribonuclease inhibitor Substances 0.000 description 3
- 230000011664 signaling Effects 0.000 description 3
- 239000007787 solid Substances 0.000 description 3
- 238000003860 storage Methods 0.000 description 3
- 238000003786 synthesis reaction Methods 0.000 description 3
- 230000032258 transport Effects 0.000 description 3
- 210000004881 tumor cell Anatomy 0.000 description 3
- 102000003298 tumor necrosis factor receptor Human genes 0.000 description 3
- GIANIJCPTPUNBA-QMMMGPOBSA-N (2s)-3-(4-hydroxyphenyl)-2-nitramidopropanoic acid Chemical compound [O-][N+](=O)N[C@H](C(=O)O)CC1=CC=C(O)C=C1 GIANIJCPTPUNBA-QMMMGPOBSA-N 0.000 description 2
- HMLGSIZOMSVISS-ONJSNURVSA-N (7r)-7-[[(2z)-2-(2-amino-1,3-thiazol-4-yl)-2-(2,2-dimethylpropanoyloxymethoxyimino)acetyl]amino]-3-ethenyl-8-oxo-5-thia-1-azabicyclo[4.2.0]oct-2-ene-2-carboxylic acid Chemical compound N([C@@H]1C(N2C(=C(C=C)CSC21)C(O)=O)=O)C(=O)\C(=N/OCOC(=O)C(C)(C)C)C1=CSC(N)=N1 HMLGSIZOMSVISS-ONJSNURVSA-N 0.000 description 2
- 108020004463 18S ribosomal RNA Proteins 0.000 description 2
- HVAUUPRFYPCOCA-AREMUKBSSA-N 2-O-acetyl-1-O-hexadecyl-sn-glycero-3-phosphocholine Chemical compound CCCCCCCCCCCCCCCCOC[C@@H](OC(C)=O)COP([O-])(=O)OCC[N+](C)(C)C HVAUUPRFYPCOCA-AREMUKBSSA-N 0.000 description 2
- 101150034014 48 gene Proteins 0.000 description 2
- 101150111197 76 gene Proteins 0.000 description 2
- 108091005508 Acid proteases Proteins 0.000 description 2
- XHVAWZZCDCWGBK-WYRLRVFGSA-M Aurothioglucose Chemical compound OC[C@H]1O[C@H](S[Au])[C@H](O)[C@@H](O)[C@@H]1O XHVAWZZCDCWGBK-WYRLRVFGSA-M 0.000 description 2
- 108091012583 BCL2 Proteins 0.000 description 2
- 208000031729 Bacteremia Diseases 0.000 description 2
- 102100031172 C-C chemokine receptor type 1 Human genes 0.000 description 2
- 101710149814 C-C chemokine receptor type 1 Proteins 0.000 description 2
- 102100031151 C-C chemokine receptor type 2 Human genes 0.000 description 2
- 101710149815 C-C chemokine receptor type 2 Proteins 0.000 description 2
- 101710149863 C-C chemokine receptor type 4 Proteins 0.000 description 2
- 102100036305 C-C chemokine receptor type 8 Human genes 0.000 description 2
- 101710112613 C-C motif chemokine 13 Proteins 0.000 description 2
- 102100021935 C-C motif chemokine 26 Human genes 0.000 description 2
- 101710155834 C-C motif chemokine 7 Proteins 0.000 description 2
- 102100025248 C-X-C motif chemokine 10 Human genes 0.000 description 2
- 102100039398 C-X-C motif chemokine 2 Human genes 0.000 description 2
- 102100036189 C-X-C motif chemokine 3 Human genes 0.000 description 2
- 108700013048 CCL2 Proteins 0.000 description 2
- 108700012434 CCL3 Proteins 0.000 description 2
- 102100032976 CCR4-NOT transcription complex subunit 6 Human genes 0.000 description 2
- 102000017420 CD3 protein, epsilon/gamma/delta subunit Human genes 0.000 description 2
- 108050005493 CD3 protein, epsilon/gamma/delta subunit Proteins 0.000 description 2
- OYPRJOBELJOOCE-UHFFFAOYSA-N Calcium Chemical compound [Ca] OYPRJOBELJOOCE-UHFFFAOYSA-N 0.000 description 2
- 108090000426 Caspase-1 Proteins 0.000 description 2
- 102000000018 Chemokine CCL2 Human genes 0.000 description 2
- 108010083698 Chemokine CCL26 Proteins 0.000 description 2
- 102000000013 Chemokine CCL3 Human genes 0.000 description 2
- 102000001327 Chemokine CCL5 Human genes 0.000 description 2
- 108010014419 Chemokine CXCL1 Proteins 0.000 description 2
- 102000016950 Chemokine CXCL1 Human genes 0.000 description 2
- 102000006579 Chemokine CXCL10 Human genes 0.000 description 2
- 102000009410 Chemokine receptor Human genes 0.000 description 2
- 108050000299 Chemokine receptor Proteins 0.000 description 2
- 208000017667 Chronic Disease Diseases 0.000 description 2
- 102000029816 Collagenase Human genes 0.000 description 2
- 108060005980 Collagenase Proteins 0.000 description 2
- 108010071942 Colony-Stimulating Factors Proteins 0.000 description 2
- 102100030497 Cytochrome c Human genes 0.000 description 2
- 108010075031 Cytochromes c Proteins 0.000 description 2
- 102100032218 Cytokine-inducible SH2-containing protein Human genes 0.000 description 2
- 101710132484 Cytokine-inducible SH2-containing protein Proteins 0.000 description 2
- 230000004568 DNA-binding Effects 0.000 description 2
- 108010053770 Deoxyribonucleases Proteins 0.000 description 2
- 102000016911 Deoxyribonucleases Human genes 0.000 description 2
- 108010016626 Dipeptides Proteins 0.000 description 2
- 238000002965 ELISA Methods 0.000 description 2
- 102000016942 Elastin Human genes 0.000 description 2
- 108010014258 Elastin Proteins 0.000 description 2
- 108010091443 Exopeptidases Proteins 0.000 description 2
- 102000018389 Exopeptidases Human genes 0.000 description 2
- 108010039471 Fas Ligand Protein Proteins 0.000 description 2
- 102000016359 Fibronectins Human genes 0.000 description 2
- 108010067306 Fibronectins Proteins 0.000 description 2
- 108060003393 Granulin Proteins 0.000 description 2
- 102100039619 Granulocyte colony-stimulating factor Human genes 0.000 description 2
- 108010017213 Granulocyte-Macrophage Colony-Stimulating Factor Proteins 0.000 description 2
- 102100040505 HLA class II histocompatibility antigen, DR alpha chain Human genes 0.000 description 2
- 108010027992 HSP70 Heat-Shock Proteins Proteins 0.000 description 2
- 102000018932 HSP70 Heat-Shock Proteins Human genes 0.000 description 2
- NTYJJOPFIAHURM-UHFFFAOYSA-N Histamine Chemical compound NCCC1=CN=CN1 NTYJJOPFIAHURM-UHFFFAOYSA-N 0.000 description 2
- 101000716063 Homo sapiens C-C chemokine receptor type 8 Proteins 0.000 description 2
- 101000797762 Homo sapiens C-C motif chemokine 5 Proteins 0.000 description 2
- 101000889128 Homo sapiens C-X-C motif chemokine 2 Proteins 0.000 description 2
- 101000947193 Homo sapiens C-X-C motif chemokine 3 Proteins 0.000 description 2
- 101000725401 Homo sapiens Cytochrome c oxidase subunit 2 Proteins 0.000 description 2
- 101000889276 Homo sapiens Cytotoxic T-lymphocyte protein 4 Proteins 0.000 description 2
- 101000746373 Homo sapiens Granulocyte-macrophage colony-stimulating factor Proteins 0.000 description 2
- 101000959794 Homo sapiens Interferon alpha-2 Proteins 0.000 description 2
- 101000852992 Homo sapiens Interleukin-12 subunit beta Proteins 0.000 description 2
- 101001076408 Homo sapiens Interleukin-6 Proteins 0.000 description 2
- 101000764294 Homo sapiens Lymphotoxin-beta Proteins 0.000 description 2
- 101001082142 Homo sapiens Pentraxin-related protein PTX3 Proteins 0.000 description 2
- 101000702559 Homo sapiens Probable global transcription activator SNF2L2 Proteins 0.000 description 2
- 101000605127 Homo sapiens Prostaglandin G/H synthase 2 Proteins 0.000 description 2
- 101000617830 Homo sapiens Sterol O-acyltransferase 1 Proteins 0.000 description 2
- 101000738335 Homo sapiens T-cell surface glycoprotein CD3 zeta chain Proteins 0.000 description 2
- 241000713772 Human immunodeficiency virus 1 Species 0.000 description 2
- HEFNNWSXXWATRW-UHFFFAOYSA-N Ibuprofen Chemical compound CC(C)CC1=CC=C(C(C)C(O)=O)C=C1 HEFNNWSXXWATRW-UHFFFAOYSA-N 0.000 description 2
- 108060003951 Immunoglobulin Proteins 0.000 description 2
- 206010062016 Immunosuppression Diseases 0.000 description 2
- 102000003816 Interleukin-13 Human genes 0.000 description 2
- 108090000176 Interleukin-13 Proteins 0.000 description 2
- 102100039064 Interleukin-3 Human genes 0.000 description 2
- 108010002386 Interleukin-3 Proteins 0.000 description 2
- 102000004388 Interleukin-4 Human genes 0.000 description 2
- 108090000978 Interleukin-4 Proteins 0.000 description 2
- 108010002616 Interleukin-5 Proteins 0.000 description 2
- 102100026019 Interleukin-6 Human genes 0.000 description 2
- 102000015696 Interleukins Human genes 0.000 description 2
- 108010063738 Interleukins Proteins 0.000 description 2
- 108010031801 Lipopolysaccharide Receptors Proteins 0.000 description 2
- 102000005482 Lipopolysaccharide Receptors Human genes 0.000 description 2
- 102100026894 Lymphotoxin-beta Human genes 0.000 description 2
- 102100027998 Macrophage metalloelastase Human genes 0.000 description 2
- 102000001776 Matrix metalloproteinase-9 Human genes 0.000 description 2
- 108010015302 Matrix metalloproteinase-9 Proteins 0.000 description 2
- 102100025169 Max-binding protein MNT Human genes 0.000 description 2
- 102000003939 Membrane transport proteins Human genes 0.000 description 2
- 108090000301 Membrane transport proteins Proteins 0.000 description 2
- 102100034681 Myeloblastin Human genes 0.000 description 2
- 206010028980 Neoplasm Diseases 0.000 description 2
- 102100030411 Neutrophil collagenase Human genes 0.000 description 2
- 102000007999 Nuclear Proteins Human genes 0.000 description 2
- 108010089610 Nuclear Proteins Proteins 0.000 description 2
- 108091028043 Nucleic acid sequence Proteins 0.000 description 2
- 208000008589 Obesity Diseases 0.000 description 2
- 108010058846 Ovalbumin Proteins 0.000 description 2
- 102100027351 Pentraxin-related protein PTX3 Human genes 0.000 description 2
- 108091000080 Phosphotransferase Proteins 0.000 description 2
- 108010047620 Phytohemagglutinins Proteins 0.000 description 2
- 108010003541 Platelet Activating Factor Proteins 0.000 description 2
- 102100031021 Probable global transcription activator SNF2L2 Human genes 0.000 description 2
- 201000004681 Psoriasis Diseases 0.000 description 2
- 239000013614 RNA sample Substances 0.000 description 2
- 108010083644 Ribonucleases Proteins 0.000 description 2
- 102000006382 Ribonucleases Human genes 0.000 description 2
- 102100021993 Sterol O-acyltransferase 1 Human genes 0.000 description 2
- 101000697584 Streptomyces lavendulae Streptothricin acetyltransferase Proteins 0.000 description 2
- 102100037906 T-cell surface glycoprotein CD3 zeta chain Human genes 0.000 description 2
- 101710101607 Toxic shock syndrome toxin-1 Proteins 0.000 description 2
- 102100023132 Transcription factor Jun Human genes 0.000 description 2
- 108010040002 Tumor Suppressor Proteins Proteins 0.000 description 2
- 102000001742 Tumor Suppressor Proteins Human genes 0.000 description 2
- 102100036922 Tumor necrosis factor ligand superfamily member 13B Human genes 0.000 description 2
- 102100031358 Urokinase-type plasminogen activator Human genes 0.000 description 2
- 108090000435 Urokinase-type plasminogen activator Proteins 0.000 description 2
- 102000004962 Voltage-dependent anion channels Human genes 0.000 description 2
- 108090001129 Voltage-dependent anion channels Proteins 0.000 description 2
- JOOSFXXMIOXKAZ-UHFFFAOYSA-H [Au+3].[Au+3].[O-]C(=O)CC(S)C([O-])=O.[O-]C(=O)CC(S)C([O-])=O.[O-]C(=O)CC(S)C([O-])=O Chemical compound [Au+3].[Au+3].[O-]C(=O)CC(S)C([O-])=O.[O-]C(=O)CC(S)C([O-])=O.[O-]C(=O)CC(S)C([O-])=O JOOSFXXMIOXKAZ-UHFFFAOYSA-H 0.000 description 2
- 239000002253 acid Substances 0.000 description 2
- 230000003213 activating effect Effects 0.000 description 2
- 230000004658 acute-phase response Effects 0.000 description 2
- 239000000654 additive Substances 0.000 description 2
- 230000000996 additive effect Effects 0.000 description 2
- 230000032683 aging Effects 0.000 description 2
- 239000000556 agonist Substances 0.000 description 2
- 229960004238 anakinra Drugs 0.000 description 2
- 230000033115 angiogenesis Effects 0.000 description 2
- 230000002424 anti-apoptotic effect Effects 0.000 description 2
- 230000003460 anti-nuclear Effects 0.000 description 2
- 230000003356 anti-rheumatic effect Effects 0.000 description 2
- 230000000840 anti-viral effect Effects 0.000 description 2
- 230000030741 antigen processing and presentation Effects 0.000 description 2
- 210000000612 antigen-presenting cell Anatomy 0.000 description 2
- 229940114079 arachidonic acid Drugs 0.000 description 2
- 235000021342 arachidonic acid Nutrition 0.000 description 2
- 239000012911 assay medium Substances 0.000 description 2
- AUJRCFUBUPVWSZ-XTZHGVARSA-M auranofin Chemical compound CCP(CC)(CC)=[Au]S[C@@H]1O[C@H](COC(C)=O)[C@@H](OC(C)=O)[C@H](OC(C)=O)[C@H]1OC(C)=O AUJRCFUBUPVWSZ-XTZHGVARSA-M 0.000 description 2
- 229960005207 auranofin Drugs 0.000 description 2
- 229960001799 aurothioglucose Drugs 0.000 description 2
- 230000001580 bacterial effect Effects 0.000 description 2
- 230000008512 biological response Effects 0.000 description 2
- 230000005540 biological transmission Effects 0.000 description 2
- 238000001574 biopsy Methods 0.000 description 2
- 210000000601 blood cell Anatomy 0.000 description 2
- 238000004820 blood count Methods 0.000 description 2
- 239000011575 calcium Substances 0.000 description 2
- 229910052791 calcium Inorganic materials 0.000 description 2
- 229940047495 celebrex Drugs 0.000 description 2
- 229960000590 celecoxib Drugs 0.000 description 2
- 230000003915 cell function Effects 0.000 description 2
- 230000012292 cell migration Effects 0.000 description 2
- 230000004663 cell proliferation Effects 0.000 description 2
- 230000036755 cellular response Effects 0.000 description 2
- 239000002975 chemoattractant Substances 0.000 description 2
- 238000005345 coagulation Methods 0.000 description 2
- 230000015271 coagulation Effects 0.000 description 2
- 229960002424 collagenase Drugs 0.000 description 2
- 230000004154 complement system Effects 0.000 description 2
- 238000004590 computer program Methods 0.000 description 2
- 239000003246 corticosteroid Substances 0.000 description 2
- 229960001334 corticosteroids Drugs 0.000 description 2
- 229940111134 coxibs Drugs 0.000 description 2
- 239000003255 cyclooxygenase 2 inhibitor Substances 0.000 description 2
- 235000018417 cysteine Nutrition 0.000 description 2
- XUJNEKJLAYXESH-UHFFFAOYSA-N cysteine Natural products SCC(N)C(O)=O XUJNEKJLAYXESH-UHFFFAOYSA-N 0.000 description 2
- 230000016396 cytokine production Effects 0.000 description 2
- 230000001086 cytosolic effect Effects 0.000 description 2
- 230000007123 defense Effects 0.000 description 2
- 230000007850 degeneration Effects 0.000 description 2
- 238000006731 degradation reaction Methods 0.000 description 2
- 238000000326 densiometry Methods 0.000 description 2
- 230000001419 dependent effect Effects 0.000 description 2
- FOCAHLGSDWHSAH-UHFFFAOYSA-N difluoromethanethione Chemical compound FC(F)=S FOCAHLGSDWHSAH-UHFFFAOYSA-N 0.000 description 2
- 229920002549 elastin Polymers 0.000 description 2
- 230000002996 emotional effect Effects 0.000 description 2
- 239000003623 enhancer Substances 0.000 description 2
- 230000007613 environmental effect Effects 0.000 description 2
- 238000002474 experimental method Methods 0.000 description 2
- 108010052621 fas Receptor Proteins 0.000 description 2
- 102000018823 fas Receptor Human genes 0.000 description 2
- 239000012530 fluid Substances 0.000 description 2
- 239000012634 fragment Substances 0.000 description 2
- 239000003862 glucocorticoid Substances 0.000 description 2
- RWSXRVCMGQZWBV-WDSKDSINSA-N glutathione Chemical compound OC(=O)[C@@H](N)CCC(=O)N[C@@H](CS)C(=O)NCC(O)=O RWSXRVCMGQZWBV-WDSKDSINSA-N 0.000 description 2
- 210000000224 granular leucocyte Anatomy 0.000 description 2
- 210000004524 haematopoietic cell Anatomy 0.000 description 2
- 230000001632 homeopathic effect Effects 0.000 description 2
- 229940048921 humira Drugs 0.000 description 2
- 229960001680 ibuprofen Drugs 0.000 description 2
- 210000000987 immune system Anatomy 0.000 description 2
- 102000018358 immunoglobulin Human genes 0.000 description 2
- 239000000411 inducer Substances 0.000 description 2
- 210000004969 inflammatory cell Anatomy 0.000 description 2
- 208000014674 injury Diseases 0.000 description 2
- 229960003130 interferon gamma Drugs 0.000 description 2
- 238000002955 isolation Methods 0.000 description 2
- 238000009533 lab test Methods 0.000 description 2
- VHOGYURTWQBHIL-UHFFFAOYSA-N leflunomide Chemical compound O1N=CC(C(=O)NC=2C=CC(=CC=2)C(F)(F)F)=C1C VHOGYURTWQBHIL-UHFFFAOYSA-N 0.000 description 2
- 229960000681 leflunomide Drugs 0.000 description 2
- 230000000670 limiting effect Effects 0.000 description 2
- 238000012417 linear regression Methods 0.000 description 2
- 230000007774 longterm Effects 0.000 description 2
- 210000004072 lung Anatomy 0.000 description 2
- 210000003563 lymphoid tissue Anatomy 0.000 description 2
- 229910001629 magnesium chloride Inorganic materials 0.000 description 2
- 238000002595 magnetic resonance imaging Methods 0.000 description 2
- 238000013507 mapping Methods 0.000 description 2
- 230000001404 mediated effect Effects 0.000 description 2
- 239000012528 membrane Substances 0.000 description 2
- 230000003340 mental effect Effects 0.000 description 2
- 230000002297 mitogenic effect Effects 0.000 description 2
- 230000004048 modification Effects 0.000 description 2
- 238000012986 modification Methods 0.000 description 2
- 239000003607 modifier Substances 0.000 description 2
- 230000007935 neutral effect Effects 0.000 description 2
- 239000000041 non-steroidal anti-inflammatory agent Substances 0.000 description 2
- 235000020824 obesity Nutrition 0.000 description 2
- 229940092253 ovalbumin Drugs 0.000 description 2
- 244000052769 pathogen Species 0.000 description 2
- 230000001717 pathogenic effect Effects 0.000 description 2
- 102000020233 phosphotransferase Human genes 0.000 description 2
- 230000004962 physiological condition Effects 0.000 description 2
- 230000008288 physiological mechanism Effects 0.000 description 2
- 230000001885 phytohemagglutinin Effects 0.000 description 2
- 229960004618 prednisone Drugs 0.000 description 2
- XOFYZVNMUHMLCC-ZPOLXVRWSA-N prednisone Chemical compound O=C1C=C[C@]2(C)[C@H]3C(=O)C[C@](C)([C@@](CC4)(O)C(=O)CO)[C@@H]4[C@@H]3CCC2=C1 XOFYZVNMUHMLCC-ZPOLXVRWSA-N 0.000 description 2
- 235000013930 proline Nutrition 0.000 description 2
- 125000001500 prolyl group Chemical class [H]N1C([H])(C(=O)[*])C([H])([H])C([H])([H])C1([H])[H] 0.000 description 2
- ZCCUUQDIBDJBTK-UHFFFAOYSA-N psoralen Chemical compound C1=C2OC(=O)C=CC2=CC2=C1OC=C2 ZCCUUQDIBDJBTK-UHFFFAOYSA-N 0.000 description 2
- 230000022983 regulation of cell cycle Effects 0.000 description 2
- 230000025053 regulation of cell proliferation Effects 0.000 description 2
- 230000001105 regulatory effect Effects 0.000 description 2
- 230000010076 replication Effects 0.000 description 2
- 230000028327 secretion Effects 0.000 description 2
- 238000004062 sedimentation Methods 0.000 description 2
- 230000035945 sensitivity Effects 0.000 description 2
- 238000004088 simulation Methods 0.000 description 2
- 239000000243 solution Substances 0.000 description 2
- 238000010561 standard procedure Methods 0.000 description 2
- 230000001629 suppression Effects 0.000 description 2
- 230000002195 synergetic effect Effects 0.000 description 2
- 210000001258 synovial membrane Anatomy 0.000 description 2
- 229940037128 systemic glucocorticoids Drugs 0.000 description 2
- 238000005382 thermal cycling Methods 0.000 description 2
- 229960002898 threonine Drugs 0.000 description 2
- 230000025366 tissue development Effects 0.000 description 2
- 230000002588 toxic effect Effects 0.000 description 2
- 230000001988 toxicity Effects 0.000 description 2
- 231100000419 toxicity Toxicity 0.000 description 2
- 230000002110 toxicologic effect Effects 0.000 description 2
- 231100000759 toxicological effect Toxicity 0.000 description 2
- 239000003053 toxin Substances 0.000 description 2
- 231100000765 toxin Toxicity 0.000 description 2
- 108700012359 toxins Proteins 0.000 description 2
- 108091006107 transcriptional repressors Proteins 0.000 description 2
- 238000011269 treatment regimen Methods 0.000 description 2
- 238000002604 ultrasonography Methods 0.000 description 2
- 238000010200 validation analysis Methods 0.000 description 2
- PGOHTUIFYSHAQG-LJSDBVFPSA-N (2S)-6-amino-2-[[(2S)-5-amino-2-[[(2S)-2-[[(2S)-2-[[(2S)-2-[[(2S)-4-amino-2-[[(2S)-2-[[(2S)-2-[[(2S)-2-[[(2S)-2-[[(2S)-5-amino-2-[[(2S)-5-amino-2-[[(2S)-2-[[(2S)-2-[[(2S)-2-[[(2S,3R)-2-[[(2S)-5-amino-2-[[(2S)-2-[[(2S)-2-[[(2S,3R)-2-[[(2S)-2-[[(2S)-2-[[(2S)-2-[[(2S)-2-[[(2S)-5-amino-2-[[(2S)-1-[(2S,3R)-2-[[(2S)-2-[[(2S)-2-[[(2R)-2-[[(2S)-2-[[(2S)-2-[[2-[[(2S)-2-[[(2S)-2-[[(2S)-2-[[(2S)-1-[(2S)-2-[[(2S)-2-[[(2S)-2-[[(2S)-2-amino-4-methylsulfanylbutanoyl]amino]-3-(1H-indol-3-yl)propanoyl]amino]-5-carbamimidamidopentanoyl]amino]propanoyl]pyrrolidine-2-carbonyl]amino]-3-methylbutanoyl]amino]-4-methylpentanoyl]amino]-4-methylpentanoyl]amino]acetyl]amino]-3-hydroxypropanoyl]amino]-4-methylpentanoyl]amino]-3-sulfanylpropanoyl]amino]-4-methylsulfanylbutanoyl]amino]-5-carbamimidamidopentanoyl]amino]-3-hydroxybutanoyl]pyrrolidine-2-carbonyl]amino]-5-oxopentanoyl]amino]-3-hydroxypropanoyl]amino]-3-hydroxypropanoyl]amino]-3-(1H-imidazol-5-yl)propanoyl]amino]-4-methylpentanoyl]amino]-3-hydroxybutanoyl]amino]-3-(1H-indol-3-yl)propanoyl]amino]-5-carbamimidamidopentanoyl]amino]-5-oxopentanoyl]amino]-3-hydroxybutanoyl]amino]-3-hydroxypropanoyl]amino]-3-carboxypropanoyl]amino]-3-hydroxypropanoyl]amino]-5-oxopentanoyl]amino]-5-oxopentanoyl]amino]-3-phenylpropanoyl]amino]-5-carbamimidamidopentanoyl]amino]-3-methylbutanoyl]amino]-4-methylpentanoyl]amino]-4-oxobutanoyl]amino]-5-carbamimidamidopentanoyl]amino]-3-(1H-indol-3-yl)propanoyl]amino]-4-carboxybutanoyl]amino]-5-oxopentanoyl]amino]hexanoic acid Chemical compound CSCC[C@H](N)C(=O)N[C@@H](Cc1c[nH]c2ccccc12)C(=O)N[C@@H](CCCNC(N)=N)C(=O)N[C@@H](C)C(=O)N1CCC[C@H]1C(=O)N[C@@H](C(C)C)C(=O)N[C@@H](CC(C)C)C(=O)N[C@@H](CC(C)C)C(=O)NCC(=O)N[C@@H](CO)C(=O)N[C@@H](CC(C)C)C(=O)N[C@@H](CS)C(=O)N[C@@H](CCSC)C(=O)N[C@@H](CCCNC(N)=N)C(=O)N[C@@H]([C@@H](C)O)C(=O)N1CCC[C@H]1C(=O)N[C@@H](CCC(N)=O)C(=O)N[C@@H](CO)C(=O)N[C@@H](CO)C(=O)N[C@@H](Cc1cnc[nH]1)C(=O)N[C@@H](CC(C)C)C(=O)N[C@@H]([C@@H](C)O)C(=O)N[C@@H](Cc1c[nH]c2ccccc12)C(=O)N[C@@H](CCCNC(N)=N)C(=O)N[C@@H](CCC(N)=O)C(=O)N[C@@H]([C@@H](C)O)C(=O)N[C@@H](CO)C(=O)N[C@@H](CC(O)=O)C(=O)N[C@@H](CO)C(=O)N[C@@H](CCC(N)=O)C(=O)N[C@@H](CCC(N)=O)C(=O)N[C@@H](Cc1ccccc1)C(=O)N[C@@H](CCCNC(N)=N)C(=O)N[C@@H](C(C)C)C(=O)N[C@@H](CC(C)C)C(=O)N[C@@H](CC(N)=O)C(=O)N[C@@H](CCCNC(N)=N)C(=O)N[C@@H](Cc1c[nH]c2ccccc12)C(=O)N[C@@H](CCC(O)=O)C(=O)N[C@@H](CCC(N)=O)C(=O)N[C@@H](CCCCN)C(O)=O PGOHTUIFYSHAQG-LJSDBVFPSA-N 0.000 description 1
- 101150094083 24 gene Proteins 0.000 description 1
- 102100039377 28 kDa heat- and acid-stable phosphoprotein Human genes 0.000 description 1
- 101710176122 28 kDa heat- and acid-stable phosphoprotein Proteins 0.000 description 1
- VXGRJERITKFWPL-UHFFFAOYSA-N 4',5'-Dihydropsoralen Natural products C1=C2OC(=O)C=CC2=CC2=C1OCC2 VXGRJERITKFWPL-UHFFFAOYSA-N 0.000 description 1
- 108020005075 5S Ribosomal RNA Proteins 0.000 description 1
- 102000043279 ADAM17 Human genes 0.000 description 1
- 108010022579 ATP dependent 26S protease Proteins 0.000 description 1
- 102100022524 Alpha-1-antichymotrypsin Human genes 0.000 description 1
- 102000013455 Amyloid beta-Peptides Human genes 0.000 description 1
- 108010090849 Amyloid beta-Peptides Proteins 0.000 description 1
- 102000000412 Annexin Human genes 0.000 description 1
- 108050008874 Annexin Proteins 0.000 description 1
- 102100028118 Annexin A11 Human genes 0.000 description 1
- 108020000948 Antisense Oligonucleotides Proteins 0.000 description 1
- 102000004411 Antithrombin III Human genes 0.000 description 1
- 108090000935 Antithrombin III Proteins 0.000 description 1
- 102100027308 Apoptosis regulator BAX Human genes 0.000 description 1
- 108091023037 Aptamer Proteins 0.000 description 1
- 108010024976 Asparaginase Proteins 0.000 description 1
- 201000001320 Atherosclerosis Diseases 0.000 description 1
- 241000271566 Aves Species 0.000 description 1
- 208000035143 Bacterial infection Diseases 0.000 description 1
- 102100033735 Bactericidal permeability-increasing protein Human genes 0.000 description 1
- 102000015081 Blood Coagulation Factors Human genes 0.000 description 1
- 108010039209 Blood Coagulation Factors Proteins 0.000 description 1
- 210000003771 C cell Anatomy 0.000 description 1
- 101710085496 C-X-C motif chemokine 2 Proteins 0.000 description 1
- 108091008927 CC chemokine receptors Proteins 0.000 description 1
- 108700011778 CCR5 Proteins 0.000 description 1
- 102000007499 CD27 Ligand Human genes 0.000 description 1
- 108010046080 CD27 Ligand Proteins 0.000 description 1
- 102100027207 CD27 antigen Human genes 0.000 description 1
- 102000010910 CD28 Antigens Human genes 0.000 description 1
- 108010062433 CD28 Antigens Proteins 0.000 description 1
- 210000001266 CD8-positive T-lymphocyte Anatomy 0.000 description 1
- 108091007914 CDKs Proteins 0.000 description 1
- 108010021064 CTLA-4 Antigen Proteins 0.000 description 1
- 229940045513 CTLA4 antagonist Drugs 0.000 description 1
- 108050006947 CXC Chemokine Proteins 0.000 description 1
- 102000019388 CXC chemokine Human genes 0.000 description 1
- BHPQYMZQTOCNFJ-UHFFFAOYSA-N Calcium cation Chemical compound [Ca+2] BHPQYMZQTOCNFJ-UHFFFAOYSA-N 0.000 description 1
- 208000005623 Carcinogenesis Diseases 0.000 description 1
- 208000024172 Cardiovascular disease Diseases 0.000 description 1
- 102100035904 Caspase-1 Human genes 0.000 description 1
- 102100038918 Caspase-6 Human genes 0.000 description 1
- 102100038902 Caspase-7 Human genes 0.000 description 1
- 102000004039 Caspase-9 Human genes 0.000 description 1
- 108090000566 Caspase-9 Proteins 0.000 description 1
- 206010057248 Cell death Diseases 0.000 description 1
- 108010055288 Chemokine CCL1 Proteins 0.000 description 1
- 102000000021 Chemokine CCL1 Human genes 0.000 description 1
- 108010055165 Chemokine CCL4 Proteins 0.000 description 1
- 102000001326 Chemokine CCL4 Human genes 0.000 description 1
- 108010014414 Chemokine CXCL2 Proteins 0.000 description 1
- 102000016951 Chemokine CXCL2 Human genes 0.000 description 1
- 102000016948 Chemokine CXCL5 Human genes 0.000 description 1
- 108010014421 Chemokine CXCL5 Proteins 0.000 description 1
- 108010077544 Chromatin Proteins 0.000 description 1
- 208000000094 Chronic Pain Diseases 0.000 description 1
- 102000008186 Collagen Human genes 0.000 description 1
- 108010035532 Collagen Proteins 0.000 description 1
- 108091035707 Consensus sequence Proteins 0.000 description 1
- 108090000266 Cyclin-dependent kinases Proteins 0.000 description 1
- 102000003903 Cyclin-dependent kinases Human genes 0.000 description 1
- 102100032522 Cyclin-dependent kinases regulatory subunit 2 Human genes 0.000 description 1
- 102100039498 Cytotoxic T-lymphocyte protein 4 Human genes 0.000 description 1
- 101150077031 DAXX gene Proteins 0.000 description 1
- 102000053602 DNA Human genes 0.000 description 1
- 230000033616 DNA repair Effects 0.000 description 1
- 102100022931 DNA repair protein RAD52 homolog Human genes 0.000 description 1
- 230000004543 DNA replication Effects 0.000 description 1
- 102100028559 Death domain-associated protein 6 Human genes 0.000 description 1
- 201000004624 Dermatitis Diseases 0.000 description 1
- 206010061818 Disease progression Diseases 0.000 description 1
- 101800001224 Disintegrin Proteins 0.000 description 1
- 206010013710 Drug interaction Diseases 0.000 description 1
- 102100023795 Elafin Human genes 0.000 description 1
- 241000588724 Escherichia coli Species 0.000 description 1
- 241000206602 Eukaryota Species 0.000 description 1
- 108050001049 Extracellular proteins Proteins 0.000 description 1
- 101150064015 FAS gene Proteins 0.000 description 1
- 102100037815 Fas apoptotic inhibitory molecule 3 Human genes 0.000 description 1
- 206010017533 Fungal infection Diseases 0.000 description 1
- 102000003688 G-Protein-Coupled Receptors Human genes 0.000 description 1
- 108090000045 G-Protein-Coupled Receptors Proteins 0.000 description 1
- 108010010803 Gelatin Proteins 0.000 description 1
- WQZGKKKJIJFFOK-GASJEMHNSA-N Glucose Natural products OC[C@H]1OC(O)[C@H](O)[C@@H](O)[C@@H]1O WQZGKKKJIJFFOK-GASJEMHNSA-N 0.000 description 1
- 206010018429 Glucose tolerance impaired Diseases 0.000 description 1
- 108010081687 Glutamate-cysteine ligase Proteins 0.000 description 1
- 108010024636 Glutathione Proteins 0.000 description 1
- 102100030385 Granzyme B Human genes 0.000 description 1
- 208000031886 HIV Infections Diseases 0.000 description 1
- 102100040485 HLA class II histocompatibility antigen, DRB1 beta chain Human genes 0.000 description 1
- 108010039343 HLA-DRB1 Chains Proteins 0.000 description 1
- 102100039855 Histone H1.2 Human genes 0.000 description 1
- 108010033040 Histones Proteins 0.000 description 1
- 102000006947 Histones Human genes 0.000 description 1
- 101000678026 Homo sapiens Alpha-1-antichymotrypsin Proteins 0.000 description 1
- 101000768066 Homo sapiens Annexin A11 Proteins 0.000 description 1
- 101000871785 Homo sapiens Bactericidal permeability-increasing protein Proteins 0.000 description 1
- 101000978379 Homo sapiens C-C motif chemokine 13 Proteins 0.000 description 1
- 101000797758 Homo sapiens C-C motif chemokine 7 Proteins 0.000 description 1
- 101000858088 Homo sapiens C-X-C motif chemokine 10 Proteins 0.000 description 1
- 101000793880 Homo sapiens Caspase-3 Proteins 0.000 description 1
- 101000741087 Homo sapiens Caspase-6 Proteins 0.000 description 1
- 101000741014 Homo sapiens Caspase-7 Proteins 0.000 description 1
- 101000942317 Homo sapiens Cyclin-dependent kinases regulatory subunit 2 Proteins 0.000 description 1
- 101000620747 Homo sapiens DNA repair protein RAD52 homolog Proteins 0.000 description 1
- 101000777461 Homo sapiens Disintegrin and metalloproteinase domain-containing protein 17 Proteins 0.000 description 1
- 101001048718 Homo sapiens Elafin Proteins 0.000 description 1
- 101001021410 Homo sapiens G-protein coupled receptor-associated sorting protein 1 Proteins 0.000 description 1
- 101001009603 Homo sapiens Granzyme B Proteins 0.000 description 1
- 101001025337 Homo sapiens High mobility group protein B1 Proteins 0.000 description 1
- 101001035375 Homo sapiens Histone H1.2 Proteins 0.000 description 1
- 101000598002 Homo sapiens Interferon regulatory factor 1 Proteins 0.000 description 1
- 101001032342 Homo sapiens Interferon regulatory factor 7 Proteins 0.000 description 1
- 101001034842 Homo sapiens Interferon-induced transmembrane protein 2 Proteins 0.000 description 1
- 101000852980 Homo sapiens Interleukin-23 subunit alpha Proteins 0.000 description 1
- 101000998139 Homo sapiens Interleukin-32 Proteins 0.000 description 1
- 101000983747 Homo sapiens MHC class II transactivator Proteins 0.000 description 1
- 101000577881 Homo sapiens Macrophage metalloelastase Proteins 0.000 description 1
- 101000950695 Homo sapiens Mitogen-activated protein kinase 8 Proteins 0.000 description 1
- 101000990908 Homo sapiens Neutrophil collagenase Proteins 0.000 description 1
- 101001124991 Homo sapiens Nitric oxide synthase, inducible Proteins 0.000 description 1
- 101000983161 Homo sapiens Phospholipase A2, membrane associated Proteins 0.000 description 1
- 101000620009 Homo sapiens Polyunsaturated fatty acid 5-lipoxygenase Proteins 0.000 description 1
- 101000826373 Homo sapiens Signal transducer and activator of transcription 3 Proteins 0.000 description 1
- 101000990915 Homo sapiens Stromelysin-1 Proteins 0.000 description 1
- 101000687855 Homo sapiens Suppressor of cytokine signaling 3 Proteins 0.000 description 1
- 101000914514 Homo sapiens T-cell-specific surface glycoprotein CD28 Proteins 0.000 description 1
- 101000914484 Homo sapiens T-lymphocyte activation antigen CD80 Proteins 0.000 description 1
- 101000946850 Homo sapiens T-lymphocyte activation antigen CD86 Proteins 0.000 description 1
- 101000596277 Homo sapiens TSC22 domain family protein 3 Proteins 0.000 description 1
- 101000844686 Homo sapiens Thioredoxin reductase 1, cytoplasmic Proteins 0.000 description 1
- 101000669447 Homo sapiens Toll-like receptor 4 Proteins 0.000 description 1
- 101000894525 Homo sapiens Transforming growth factor-beta-induced protein ig-h3 Proteins 0.000 description 1
- 101000851434 Homo sapiens Tumor necrosis factor ligand superfamily member 13B Proteins 0.000 description 1
- 101000795167 Homo sapiens Tumor necrosis factor receptor superfamily member 13B Proteins 0.000 description 1
- 101000801255 Homo sapiens Tumor necrosis factor receptor superfamily member 17 Proteins 0.000 description 1
- 101000638886 Homo sapiens Urokinase-type plasminogen activator Proteins 0.000 description 1
- 101000730644 Homo sapiens Zinc finger protein PLAGL2 Proteins 0.000 description 1
- 241000725303 Human immunodeficiency virus Species 0.000 description 1
- 102000053646 Inducible T-Cell Co-Stimulator Human genes 0.000 description 1
- 108700013161 Inducible T-Cell Co-Stimulator Proteins 0.000 description 1
- 108010001127 Insulin Receptor Proteins 0.000 description 1
- 102100036721 Insulin receptor Human genes 0.000 description 1
- 102100025087 Insulin receptor substrate 1 Human genes 0.000 description 1
- 101710201824 Insulin receptor substrate 1 Proteins 0.000 description 1
- 102100036981 Interferon regulatory factor 1 Human genes 0.000 description 1
- 102100040020 Interferon-induced transmembrane protein 2 Human genes 0.000 description 1
- 108010028784 Interleukin-18 Receptor alpha Subunit Proteins 0.000 description 1
- 102100039340 Interleukin-18 receptor 1 Human genes 0.000 description 1
- 102100036705 Interleukin-23 subunit alpha Human genes 0.000 description 1
- 102100033501 Interleukin-32 Human genes 0.000 description 1
- 108010055717 JNK Mitogen-Activated Protein Kinases Proteins 0.000 description 1
- 102000019145 JUN kinase activity proteins Human genes 0.000 description 1
- WHUUTDBJXJRKMK-VKHMYHEASA-N L-glutamic acid Chemical compound OC(=O)[C@@H](N)CCC(O)=O WHUUTDBJXJRKMK-VKHMYHEASA-N 0.000 description 1
- 108010085895 Laminin Proteins 0.000 description 1
- 102000052508 Lipopolysaccharide-binding protein Human genes 0.000 description 1
- 108010053632 Lipopolysaccharide-binding protein Proteins 0.000 description 1
- 108090000128 Lipoxygenases Proteins 0.000 description 1
- 108010075654 MAP Kinase Kinase Kinase 1 Proteins 0.000 description 1
- 108700012928 MAPK14 Proteins 0.000 description 1
- 102100026371 MHC class II transactivator Human genes 0.000 description 1
- 108010009474 Macrophage Inflammatory Proteins Proteins 0.000 description 1
- 102000009571 Macrophage Inflammatory Proteins Human genes 0.000 description 1
- 108010048043 Macrophage Migration-Inhibitory Factors Proteins 0.000 description 1
- 108030001712 Macrophage elastases Proteins 0.000 description 1
- 108700018351 Major Histocompatibility Complex Proteins 0.000 description 1
- 241000124008 Mammalia Species 0.000 description 1
- 102000000422 Matrix Metalloproteinase 3 Human genes 0.000 description 1
- 238000007476 Maximum Likelihood Methods 0.000 description 1
- 108010037255 Member 7 Tumor Necrosis Factor Receptor Superfamily Proteins 0.000 description 1
- 241001465754 Metazoa Species 0.000 description 1
- 102000054819 Mitogen-activated protein kinase 14 Human genes 0.000 description 1
- 102100037808 Mitogen-activated protein kinase 8 Human genes 0.000 description 1
- 102100033115 Mitogen-activated protein kinase kinase kinase 1 Human genes 0.000 description 1
- 108010006519 Molecular Chaperones Proteins 0.000 description 1
- 102000005431 Molecular Chaperones Human genes 0.000 description 1
- 208000000112 Myalgia Diseases 0.000 description 1
- 208000031888 Mycoses Diseases 0.000 description 1
- 102100038610 Myeloperoxidase Human genes 0.000 description 1
- 108090000235 Myeloperoxidases Proteins 0.000 description 1
- 206010028851 Necrosis Diseases 0.000 description 1
- 101100117488 Neurospora crassa (strain ATCC 24698 / 74-OR23-1A / CBS 708.71 / DSM 1257 / FGSC 987) mip-1 gene Proteins 0.000 description 1
- 108030001564 Neutrophil collagenases Proteins 0.000 description 1
- 102100029438 Nitric oxide synthase, inducible Human genes 0.000 description 1
- 101710089543 Nitric oxide synthase, inducible Proteins 0.000 description 1
- 101000610236 Nostoc sp. (strain PCC 7120 / SAG 25.82 / UTEX 2576) Protein PatA Proteins 0.000 description 1
- 101710163270 Nuclease Proteins 0.000 description 1
- 108020004711 Nucleic Acid Probes Proteins 0.000 description 1
- 108010047956 Nucleosomes Proteins 0.000 description 1
- 108020005187 Oligonucleotide Probes Proteins 0.000 description 1
- 108700020796 Oncogene Proteins 0.000 description 1
- 101710160107 Outer membrane protein A Proteins 0.000 description 1
- 102000004316 Oxidoreductases Human genes 0.000 description 1
- 108090000854 Oxidoreductases Proteins 0.000 description 1
- 239000012807 PCR reagent Substances 0.000 description 1
- 241001111421 Pannus Species 0.000 description 1
- 208000030852 Parasitic disease Diseases 0.000 description 1
- 102100037882 Perilipin-5 Human genes 0.000 description 1
- 206010057249 Phagocytosis Diseases 0.000 description 1
- 102100026831 Phospholipase A2, membrane associated Human genes 0.000 description 1
- 102000013566 Plasminogen Human genes 0.000 description 1
- 108010051456 Plasminogen Proteins 0.000 description 1
- 239000004743 Polypropylene Substances 0.000 description 1
- 102100022364 Polyunsaturated fatty acid 5-lipoxygenase Human genes 0.000 description 1
- 108050003267 Prostaglandin G/H synthase 2 Proteins 0.000 description 1
- 108010090931 Proto-Oncogene Proteins c-bcl-2 Proteins 0.000 description 1
- 102000013535 Proto-Oncogene Proteins c-bcl-2 Human genes 0.000 description 1
- 238000010802 RNA extraction kit Methods 0.000 description 1
- 108091027981 Response element Proteins 0.000 description 1
- 208000009921 Rheumatoid Nodule Diseases 0.000 description 1
- 108091006229 SLC7A1 Proteins 0.000 description 1
- 101150078876 SORBS3 gene Proteins 0.000 description 1
- 102000005886 STAT4 Transcription Factor Human genes 0.000 description 1
- 108010019992 STAT4 Transcription Factor Proteins 0.000 description 1
- BUGBHKTXTAQXES-UHFFFAOYSA-N Selenium Chemical compound [Se] BUGBHKTXTAQXES-UHFFFAOYSA-N 0.000 description 1
- 229940122055 Serine protease inhibitor Drugs 0.000 description 1
- 101710102218 Serine protease inhibitor Proteins 0.000 description 1
- 108020004459 Small interfering RNA Proteins 0.000 description 1
- 241000295644 Staphylococcaceae Species 0.000 description 1
- 101710172711 Structural protein Proteins 0.000 description 1
- 238000000692 Student's t-test Methods 0.000 description 1
- 208000002847 Surgical Wound Diseases 0.000 description 1
- 206010042674 Swelling Diseases 0.000 description 1
- 102100027213 T-cell-specific surface glycoprotein CD28 Human genes 0.000 description 1
- 102100027222 T-lymphocyte activation antigen CD80 Human genes 0.000 description 1
- 102100034924 T-lymphocyte activation antigen CD86 Human genes 0.000 description 1
- 108090000925 TNF receptor-associated factor 2 Proteins 0.000 description 1
- 102100034779 TRAF family member-associated NF-kappa-B activator Human genes 0.000 description 1
- 102100035260 TSC22 domain family protein 3 Human genes 0.000 description 1
- 108010017842 Telomerase Proteins 0.000 description 1
- 210000004241 Th2 cell Anatomy 0.000 description 1
- 241000011102 Thera Species 0.000 description 1
- 102000002933 Thioredoxin Human genes 0.000 description 1
- 102100031208 Thioredoxin reductase 1, cytoplasmic Human genes 0.000 description 1
- 108010000499 Thromboplastin Proteins 0.000 description 1
- 102000002262 Thromboplastin Human genes 0.000 description 1
- 102100039360 Toll-like receptor 4 Human genes 0.000 description 1
- 108010018242 Transcription Factor AP-1 Proteins 0.000 description 1
- 108050005223 Transcription factor Jun Proteins 0.000 description 1
- 108010009583 Transforming Growth Factors Proteins 0.000 description 1
- 102000009618 Transforming Growth Factors Human genes 0.000 description 1
- 102100021398 Transforming growth factor-beta-induced protein ig-h3 Human genes 0.000 description 1
- 101710181056 Tumor necrosis factor ligand superfamily member 13B Proteins 0.000 description 1
- 102100029675 Tumor necrosis factor receptor superfamily member 13B Human genes 0.000 description 1
- 102100033732 Tumor necrosis factor receptor superfamily member 1A Human genes 0.000 description 1
- 101710187743 Tumor necrosis factor receptor superfamily member 1A Proteins 0.000 description 1
- 102000003990 Urokinase-type plasminogen activator Human genes 0.000 description 1
- 108010073929 Vascular Endothelial Growth Factor A Proteins 0.000 description 1
- 108010019530 Vascular Endothelial Growth Factors Proteins 0.000 description 1
- 208000024248 Vascular System injury Diseases 0.000 description 1
- 208000012339 Vascular injury Diseases 0.000 description 1
- 102100023479 Vinexin Human genes 0.000 description 1
- 208000036142 Viral infection Diseases 0.000 description 1
- 101710101493 Viral myc transforming protein Proteins 0.000 description 1
- 102100036021 WAP, Kazal, immunoglobulin, Kunitz and NTR domain-containing protein 2 Human genes 0.000 description 1
- 102100038138 WD repeat-containing protein 26 Human genes 0.000 description 1
- 208000010399 Wasting Syndrome Diseases 0.000 description 1
- 208000027418 Wounds and injury Diseases 0.000 description 1
- 102100032571 Zinc finger protein PLAGL2 Human genes 0.000 description 1
- 238000002835 absorbance Methods 0.000 description 1
- 238000009825 accumulation Methods 0.000 description 1
- 229960002964 adalimumab Drugs 0.000 description 1
- 210000000577 adipose tissue Anatomy 0.000 description 1
- 230000002411 adverse Effects 0.000 description 1
- 230000004520 agglutination Effects 0.000 description 1
- 238000011256 aggressive treatment Methods 0.000 description 1
- 210000001552 airway epithelial cell Anatomy 0.000 description 1
- 230000000172 allergic effect Effects 0.000 description 1
- 235000001014 amino acid Nutrition 0.000 description 1
- 229940024606 amino acid Drugs 0.000 description 1
- 150000001413 amino acids Chemical class 0.000 description 1
- 230000003466 anti-cipated effect Effects 0.000 description 1
- 239000003435 antirheumatic agent Substances 0.000 description 1
- 239000000074 antisense oligonucleotide Substances 0.000 description 1
- 238000012230 antisense oligonucleotides Methods 0.000 description 1
- 229960005348 antithrombin iii Drugs 0.000 description 1
- 230000004596 appetite loss Effects 0.000 description 1
- 230000002917 arthritic effect Effects 0.000 description 1
- 239000012298 atmosphere Substances 0.000 description 1
- 208000010668 atopic eczema Diseases 0.000 description 1
- 230000003305 autocrine Effects 0.000 description 1
- 230000001363 autoimmune Effects 0.000 description 1
- 230000006472 autoimmune response Effects 0.000 description 1
- 208000022362 bacterial infectious disease Diseases 0.000 description 1
- 230000004888 barrier function Effects 0.000 description 1
- 230000006399 behavior Effects 0.000 description 1
- 108010079452 beta Adrenergic Receptors Proteins 0.000 description 1
- 102000012740 beta Adrenergic Receptors Human genes 0.000 description 1
- WQZGKKKJIJFFOK-VFUOTHLCSA-N beta-D-glucose Chemical compound OC[C@H]1O[C@@H](O)[C@H](O)[C@@H](O)[C@@H]1O WQZGKKKJIJFFOK-VFUOTHLCSA-N 0.000 description 1
- 239000003124 biologic agent Substances 0.000 description 1
- 230000008827 biological function Effects 0.000 description 1
- 230000033228 biological regulation Effects 0.000 description 1
- 239000003114 blood coagulation factor Substances 0.000 description 1
- 210000004204 blood vessel Anatomy 0.000 description 1
- 229910001424 calcium ion Inorganic materials 0.000 description 1
- 230000003185 calcium uptake Effects 0.000 description 1
- 102000036203 calcium-dependent phospholipid binding proteins Human genes 0.000 description 1
- 108091011005 calcium-dependent phospholipid binding proteins Proteins 0.000 description 1
- 238000004364 calculation method Methods 0.000 description 1
- 201000011510 cancer Diseases 0.000 description 1
- 230000036952 cancer formation Effects 0.000 description 1
- 231100000504 carcinogenesis Toxicity 0.000 description 1
- 210000000845 cartilage Anatomy 0.000 description 1
- 238000006555 catalytic reaction Methods 0.000 description 1
- 230000011712 cell development Effects 0.000 description 1
- 230000010307 cell transformation Effects 0.000 description 1
- 230000033383 cell-cell recognition Effects 0.000 description 1
- 230000002032 cellular defenses Effects 0.000 description 1
- 230000001413 cellular effect Effects 0.000 description 1
- 230000035605 chemotaxis Effects 0.000 description 1
- 210000003483 chromatin Anatomy 0.000 description 1
- 230000002759 chromosomal effect Effects 0.000 description 1
- 208000037976 chronic inflammation Diseases 0.000 description 1
- 230000006020 chronic inflammation Effects 0.000 description 1
- 210000003040 circulating cell Anatomy 0.000 description 1
- 238000003776 cleavage reaction Methods 0.000 description 1
- 229920001436 collagen Polymers 0.000 description 1
- 230000011382 collagen catabolic process Effects 0.000 description 1
- 238000010276 construction Methods 0.000 description 1
- 230000002596 correlated effect Effects 0.000 description 1
- 238000010219 correlation analysis Methods 0.000 description 1
- 230000000139 costimulatory effect Effects 0.000 description 1
- 230000008878 coupling Effects 0.000 description 1
- 238000010168 coupling process Methods 0.000 description 1
- 238000005859 coupling reaction Methods 0.000 description 1
- 210000004748 cultured cell Anatomy 0.000 description 1
- 238000011461 current therapy Methods 0.000 description 1
- 230000009089 cytolysis Effects 0.000 description 1
- 210000000805 cytoplasm Anatomy 0.000 description 1
- 230000003436 cytoskeletal effect Effects 0.000 description 1
- 238000013500 data storage Methods 0.000 description 1
- 230000005860 defense response to virus Effects 0.000 description 1
- 230000007812 deficiency Effects 0.000 description 1
- 238000012217 deletion Methods 0.000 description 1
- 230000037430 deletion Effects 0.000 description 1
- 206010012601 diabetes mellitus Diseases 0.000 description 1
- 239000010432 diamond Substances 0.000 description 1
- 235000005911 diet Nutrition 0.000 description 1
- 230000037213 diet Effects 0.000 description 1
- 235000015872 dietary supplement Nutrition 0.000 description 1
- 238000007865 diluting Methods 0.000 description 1
- 239000002988 disease modifying antirheumatic drug Substances 0.000 description 1
- 230000005750 disease progression Effects 0.000 description 1
- 208000035475 disorder Diseases 0.000 description 1
- 230000003828 downregulation Effects 0.000 description 1
- 238000009509 drug development Methods 0.000 description 1
- 238000002651 drug therapy Methods 0.000 description 1
- 238000009547 dual-energy X-ray absorptiometry Methods 0.000 description 1
- 238000013399 early diagnosis Methods 0.000 description 1
- 230000002888 effect on disease Effects 0.000 description 1
- 150000002066 eicosanoids Chemical class 0.000 description 1
- 230000003511 endothelial effect Effects 0.000 description 1
- 210000002615 epidermis Anatomy 0.000 description 1
- 210000002919 epithelial cell Anatomy 0.000 description 1
- 230000003628 erosive effect Effects 0.000 description 1
- 230000029142 excretion Effects 0.000 description 1
- 230000001747 exhibiting effect Effects 0.000 description 1
- 238000013401 experimental design Methods 0.000 description 1
- 230000002349 favourable effect Effects 0.000 description 1
- 239000000835 fiber Substances 0.000 description 1
- 210000002950 fibroblast Anatomy 0.000 description 1
- 210000003811 finger Anatomy 0.000 description 1
- 235000013305 food Nutrition 0.000 description 1
- 239000012520 frozen sample Substances 0.000 description 1
- 229920000159 gelatin Polymers 0.000 description 1
- 239000008273 gelatin Substances 0.000 description 1
- 235000019322 gelatine Nutrition 0.000 description 1
- 235000011852 gelatine desserts Nutrition 0.000 description 1
- 230000002068 genetic effect Effects 0.000 description 1
- 239000008103 glucose Substances 0.000 description 1
- 229930195712 glutamate Natural products 0.000 description 1
- 229960003180 glutathione Drugs 0.000 description 1
- 239000001963 growth medium Substances 0.000 description 1
- 210000004247 hand Anatomy 0.000 description 1
- 210000002216 heart Anatomy 0.000 description 1
- 210000003958 hematopoietic stem cell Anatomy 0.000 description 1
- 210000000777 hematopoietic system Anatomy 0.000 description 1
- 210000000087 hemolymph Anatomy 0.000 description 1
- 208000007475 hemolytic anemia Diseases 0.000 description 1
- 229920000669 heparin Polymers 0.000 description 1
- ZFGMDIBRIDKWMY-PASTXAENSA-N heparin Chemical compound CC(O)=N[C@@H]1[C@@H](O)[C@H](O)[C@@H](COS(O)(=O)=O)O[C@@H]1O[C@@H]1[C@@H](C(O)=O)O[C@@H](O[C@H]2[C@@H]([C@@H](OS(O)(=O)=O)[C@@H](O[C@@H]3[C@@H](OC(O)[C@H](OS(O)(=O)=O)[C@H]3O)C(O)=O)O[C@@H]2O)CS(O)(=O)=O)[C@H](O)[C@H]1O ZFGMDIBRIDKWMY-PASTXAENSA-N 0.000 description 1
- 208000006454 hepatitis Diseases 0.000 description 1
- 239000000833 heterodimer Substances 0.000 description 1
- 229960001340 histamine Drugs 0.000 description 1
- 230000013632 homeostatic process Effects 0.000 description 1
- 230000004727 humoral immunity Effects 0.000 description 1
- 238000009396 hybridization Methods 0.000 description 1
- 230000007062 hydrolysis Effects 0.000 description 1
- 238000006460 hydrolysis reaction Methods 0.000 description 1
- 230000005965 immune activity Effects 0.000 description 1
- 230000003308 immunostimulating effect Effects 0.000 description 1
- 230000001976 improved effect Effects 0.000 description 1
- 238000012606 in vitro cell culture Methods 0.000 description 1
- 239000012678 infectious agent Substances 0.000 description 1
- 230000008595 infiltration Effects 0.000 description 1
- 238000001764 infiltration Methods 0.000 description 1
- 108091006086 inhibitor proteins Proteins 0.000 description 1
- 230000005764 inhibitory process Effects 0.000 description 1
- 238000011221 initial treatment Methods 0.000 description 1
- 229910052500 inorganic mineral Inorganic materials 0.000 description 1
- 102000006495 integrins Human genes 0.000 description 1
- 108010044426 integrins Proteins 0.000 description 1
- 230000002452 interceptive effect Effects 0.000 description 1
- 230000004073 interleukin-2 production Effects 0.000 description 1
- 230000017307 interleukin-4 production Effects 0.000 description 1
- 230000003834 intracellular effect Effects 0.000 description 1
- 230000008407 joint function Effects 0.000 description 1
- 229940043355 kinase inhibitor Drugs 0.000 description 1
- 238000002372 labelling Methods 0.000 description 1
- 230000002045 lasting effect Effects 0.000 description 1
- 210000000265 leukocyte Anatomy 0.000 description 1
- 230000021633 leukocyte mediated immunity Effects 0.000 description 1
- 150000002617 leukotrienes Chemical class 0.000 description 1
- 208000018191 liver inflammation Diseases 0.000 description 1
- 208000019017 loss of appetite Diseases 0.000 description 1
- 235000021266 loss of appetite Nutrition 0.000 description 1
- 210000002751 lymph Anatomy 0.000 description 1
- 239000012139 lysis buffer Substances 0.000 description 1
- 238000007726 management method Methods 0.000 description 1
- 238000004949 mass spectrometry Methods 0.000 description 1
- 238000007620 mathematical function Methods 0.000 description 1
- 230000007246 mechanism Effects 0.000 description 1
- 238000002483 medication Methods 0.000 description 1
- 101150014102 mef-2 gene Proteins 0.000 description 1
- 201000001441 melanoma Diseases 0.000 description 1
- 208000010658 metastatic prostate carcinoma Diseases 0.000 description 1
- 230000003641 microbiacidal effect Effects 0.000 description 1
- 230000005012 migration Effects 0.000 description 1
- 238000013508 migration Methods 0.000 description 1
- 239000011707 mineral Substances 0.000 description 1
- 230000002438 mitochondrial effect Effects 0.000 description 1
- 230000000394 mitotic effect Effects 0.000 description 1
- 230000036651 mood Effects 0.000 description 1
- 230000007659 motor function Effects 0.000 description 1
- 210000003097 mucus Anatomy 0.000 description 1
- 201000006417 multiple sclerosis Diseases 0.000 description 1
- 208000013465 muscle pain Diseases 0.000 description 1
- 230000003387 muscular Effects 0.000 description 1
- 210000003007 myelin sheath Anatomy 0.000 description 1
- 210000000066 myeloid cell Anatomy 0.000 description 1
- 230000017074 necrotic cell death Effects 0.000 description 1
- 239000013642 negative control Substances 0.000 description 1
- 210000002569 neuron Anatomy 0.000 description 1
- 238000006386 neutralization reaction Methods 0.000 description 1
- 108091027963 non-coding RNA Proteins 0.000 description 1
- 102000042567 non-coding RNA Human genes 0.000 description 1
- 238000010606 normalization Methods 0.000 description 1
- 239000011824 nuclear material Substances 0.000 description 1
- 239000002853 nucleic acid probe Substances 0.000 description 1
- 210000001623 nucleosome Anatomy 0.000 description 1
- 239000002773 nucleotide Substances 0.000 description 1
- 125000003729 nucleotide group Chemical group 0.000 description 1
- 239000002751 oligonucleotide probe Substances 0.000 description 1
- 230000036542 oxidative stress Effects 0.000 description 1
- 230000037361 pathway Effects 0.000 description 1
- 239000008188 pellet Substances 0.000 description 1
- 230000008782 phagocytosis Effects 0.000 description 1
- YHHSONZFOIEMCP-UHFFFAOYSA-O phosphocholine Chemical compound C[N+](C)(C)CCOP(O)(O)=O YHHSONZFOIEMCP-UHFFFAOYSA-O 0.000 description 1
- 150000003904 phospholipids Chemical class 0.000 description 1
- 230000026731 phosphorylation Effects 0.000 description 1
- 238000006366 phosphorylation reaction Methods 0.000 description 1
- 229950004354 phosphorylcholine Drugs 0.000 description 1
- 238000001126 phototherapy Methods 0.000 description 1
- 230000010399 physical interaction Effects 0.000 description 1
- 230000035479 physiological effects, processes and functions Effects 0.000 description 1
- 102000054765 polymorphisms of proteins Human genes 0.000 description 1
- 108010005636 polypeptide C Proteins 0.000 description 1
- 229920001155 polypropylene Polymers 0.000 description 1
- 239000013641 positive control Substances 0.000 description 1
- 238000009258 post-therapy Methods 0.000 description 1
- 238000012545 processing Methods 0.000 description 1
- 230000002035 prolonged effect Effects 0.000 description 1
- 230000001737 promoting effect Effects 0.000 description 1
- 230000000069 prophylactic effect Effects 0.000 description 1
- 229940127293 prostanoid Drugs 0.000 description 1
- 150000003814 prostanoids Chemical class 0.000 description 1
- 210000004908 prostatic fluid Anatomy 0.000 description 1
- 239000003909 protein kinase inhibitor Substances 0.000 description 1
- 208000020016 psychiatric disease Diseases 0.000 description 1
- 238000012207 quantitative assay Methods 0.000 description 1
- 239000002096 quantum dot Substances 0.000 description 1
- 230000002285 radioactive effect Effects 0.000 description 1
- 239000011541 reaction mixture Substances 0.000 description 1
- 230000006798 recombination Effects 0.000 description 1
- 238000005215 recombination Methods 0.000 description 1
- 230000009467 reduction Effects 0.000 description 1
- 230000002829 reductive effect Effects 0.000 description 1
- 230000008439 repair process Effects 0.000 description 1
- 238000010839 reverse transcription Methods 0.000 description 1
- 238000003757 reverse transcription PCR Methods 0.000 description 1
- 102220065736 rs543286136 Human genes 0.000 description 1
- 238000003118 sandwich ELISA Methods 0.000 description 1
- 230000007017 scission Effects 0.000 description 1
- 238000007790 scraping Methods 0.000 description 1
- 208000012672 seasonal affective disease Diseases 0.000 description 1
- 229910052711 selenium Inorganic materials 0.000 description 1
- 239000011669 selenium Substances 0.000 description 1
- 210000000582 semen Anatomy 0.000 description 1
- 239000004065 semiconductor Substances 0.000 description 1
- 230000037152 sensory function Effects 0.000 description 1
- 239000003001 serine protease inhibitor Substances 0.000 description 1
- 125000003607 serino group Chemical group [H]N([H])[C@]([H])(C(=O)[*])C(O[H])([H])[H] 0.000 description 1
- 230000009870 specific binding Effects 0.000 description 1
- 208000010110 spontaneous platelet aggregation Diseases 0.000 description 1
- 150000003431 steroids Chemical class 0.000 description 1
- 239000011550 stock solution Substances 0.000 description 1
- 108091007196 stromelysin Proteins 0.000 description 1
- 238000001356 surgical procedure Methods 0.000 description 1
- 230000004083 survival effect Effects 0.000 description 1
- 230000002459 sustained effect Effects 0.000 description 1
- 230000009897 systematic effect Effects 0.000 description 1
- 230000009885 systemic effect Effects 0.000 description 1
- 238000012353 t test Methods 0.000 description 1
- 230000008685 targeting Effects 0.000 description 1
- 108060008226 thioredoxin Proteins 0.000 description 1
- 230000002103 transcriptional effect Effects 0.000 description 1
- 230000009466 transformation Effects 0.000 description 1
- 230000001052 transient effect Effects 0.000 description 1
- 238000013519 translation Methods 0.000 description 1
- 230000008733 trauma Effects 0.000 description 1
- 230000002476 tumorcidal effect Effects 0.000 description 1
- 238000002562 urinalysis Methods 0.000 description 1
- 210000002700 urine Anatomy 0.000 description 1
- 210000003462 vein Anatomy 0.000 description 1
- 230000009385 viral infection Effects 0.000 description 1
- 230000003612 virological effect Effects 0.000 description 1
- 238000013389 whole blood assay Methods 0.000 description 1
- 210000000707 wrist Anatomy 0.000 description 1
Images






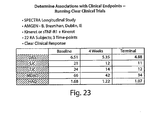



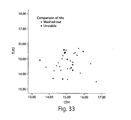

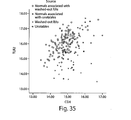


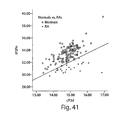
Classifications
-
- C—CHEMISTRY; METALLURGY
- C12—BIOCHEMISTRY; BEER; SPIRITS; WINE; VINEGAR; MICROBIOLOGY; ENZYMOLOGY; MUTATION OR GENETIC ENGINEERING
- C12Q—MEASURING OR TESTING PROCESSES INVOLVING ENZYMES, NUCLEIC ACIDS OR MICROORGANISMS; COMPOSITIONS OR TEST PAPERS THEREFOR; PROCESSES OF PREPARING SUCH COMPOSITIONS; CONDITION-RESPONSIVE CONTROL IN MICROBIOLOGICAL OR ENZYMOLOGICAL PROCESSES
- C12Q1/00—Measuring or testing processes involving enzymes, nucleic acids or microorganisms; Compositions therefor; Processes of preparing such compositions
- C12Q1/68—Measuring or testing processes involving enzymes, nucleic acids or microorganisms; Compositions therefor; Processes of preparing such compositions involving nucleic acids
- C12Q1/6876—Nucleic acid products used in the analysis of nucleic acids, e.g. primers or probes
- C12Q1/6883—Nucleic acid products used in the analysis of nucleic acids, e.g. primers or probes for diseases caused by alterations of genetic material
-
- C—CHEMISTRY; METALLURGY
- C12—BIOCHEMISTRY; BEER; SPIRITS; WINE; VINEGAR; MICROBIOLOGY; ENZYMOLOGY; MUTATION OR GENETIC ENGINEERING
- C12Q—MEASURING OR TESTING PROCESSES INVOLVING ENZYMES, NUCLEIC ACIDS OR MICROORGANISMS; COMPOSITIONS OR TEST PAPERS THEREFOR; PROCESSES OF PREPARING SUCH COMPOSITIONS; CONDITION-RESPONSIVE CONTROL IN MICROBIOLOGICAL OR ENZYMOLOGICAL PROCESSES
- C12Q2600/00—Oligonucleotides characterized by their use
- C12Q2600/106—Pharmacogenomics, i.e. genetic variability in individual responses to drugs and drug metabolism
-
- C—CHEMISTRY; METALLURGY
- C12—BIOCHEMISTRY; BEER; SPIRITS; WINE; VINEGAR; MICROBIOLOGY; ENZYMOLOGY; MUTATION OR GENETIC ENGINEERING
- C12Q—MEASURING OR TESTING PROCESSES INVOLVING ENZYMES, NUCLEIC ACIDS OR MICROORGANISMS; COMPOSITIONS OR TEST PAPERS THEREFOR; PROCESSES OF PREPARING SUCH COMPOSITIONS; CONDITION-RESPONSIVE CONTROL IN MICROBIOLOGICAL OR ENZYMOLOGICAL PROCESSES
- C12Q2600/00—Oligonucleotides characterized by their use
- C12Q2600/158—Expression markers
Definitions
- the present invention relates generally to the identification of biological markers associated with the identification of rheumatoid arthritis (RA). More specifically, the present invention relates to the use of gene expression data in the identification, monitoring and treatment of rheumatoid arthritis and in characterization and evaluation of inflammatory conditions induced or related to rheumatoid arthritis.
- RA rheumatoid arthritis
- Rheumatoid arthritis is an autoimmune disease which causes chronic inflammation of the joints, the tissue around the joints, as well as other organs in the body. Because it can affect multiple other organs of the body, rheumatoid arthritis is a systemic illness and is sometimes called rheumatoid disease. Rheumatoid arthritis is a chronic disease, mainly characterized by inflammation of the lining, or synovium, of the joints. It can lead to long-term joint damage, resulting in chronic pain, loss of function and disability.
- RA can start in any joint, but it most commonly begins in the smaller joints of the fingers, hands and wrists. In general, more joint erosion indicates more severe disease activity.
- RA progresses in three stages. The first stage is the swelling of the synovial lining, causing pain, warmth, stiffness, redness and swelling around the joint. Other common physical symptoms include fatigue, weakness, pain associated with prolonged sitting, occurrence of flares of disease activity followed by remission, rheumatoid nodules (lumps of tissue under the skin, typically found on the elbows); and muscle pain.
- Second is the rapid division and growth of cells, or pannus, which causes the synovium to thicken.
- the inflamed cells release enzymes that may digest bone and cartilage, often causing the involved joint to lose its shape and alignment, more pain, and loss of movement.
- RA chronic disease
- RA continues indefinitely and may not go away. Frequent flares in disease activity can occur.
- Early diagnosis and treatment of RA is critical to living a productive lifestyle. Studies have shown that early aggressive treatment of RA can limit joint damage, which in turn limits loss of movement, decreased ability to work, higher medical costs and potential surgery.
- the characterization of a disease condition related to RA is imprecise. There is no one test which positively indicates a subject has RA.
- ESR erythrocyte sedimentation rate
- C-Reactive Protein levels C-Reactive Protein levels
- Rheumatoid Factor and Antinuclear Antibodies
- imaging studies including but not limited to X-rays, magnetic resonance imaging (MRI), joint ultrasound, and bone densitometry (DEXA).
- NSAIDs non-steroidal anti-inflammatory drugs
- COX-2 inhibitors e.g. , celecoxib (Celebrex)
- DMARDs disease-modifying anti-rheumatic drugs
- TNF Tumor necrosis factor
- etanercept Engelbrel
- infliximab Remicade
- adalimumab Humira
- interleukin-1 inhibitors e.g. , injectible anakinra (Kineret)
- BRMs biologic response modifiers
- the invention is based in part upon the identification of gene expression profiles associated with rheumatoid arthritis (RA). Theses genes are referred to herein as RA-associated genes. More specifically, the invention is based upon the surprising discovery that detection of as few as two RA-associated genes is capable of identifying individuals with or without RA with at least 75% accuracy.
- RA rheumatoid arthritis
- the invention provides a method for determining a profile data set for characterizing a subject with rheumatoid arthritis or an inflammatory condition related to Rheumatoid arthritis based on a sample from the subject, the sample providing a source of RNAs, by using amplification for measuring the amount ofRNA in a panel of constituents including at least 2 constituents from any of Tables 1, 2, 3, 4, 5, 6, 7, 8, 9 or 10 and arriving at a measure of each constituent.
- the profile data set contains the measure of each constituent of the panel.
- Also provided by the invention is a method of characterizing rheumatoid arthritis or inflammatory condition related to rheumatoid arthritis in a subject, based on a sample from the subject, the sample providing a source of RNAs, by assessing a profile data set of a plurality of members, each member being a quantitative measure of the amount of a distinct RNA constituent in a panel of constituents selected so that measurement of the constituents .. enables characterization of rheumatoid arthritis.
- the invention provides a method of characterizing rheumatoid arthritis or an inflammatory condition related to rheumatoid arthritis in a subject, based on a sample from the subject, the sample providing a source of RNAs, by determining a quantitative measure of the amount of at least one constituent from Table 4 and 7.
- the panel of constituents are selected so as to distinguish from a normal and a RA-diagnosed subject.
- the RA-diagnosed subject is washed out from therapy.
- the subjects is washed out from therapy for at least 1 week, 2 weeks, 3 weeks, 1 month, two months, or up to three or more months.
- the panel of constituents is selected as to permit characterizing the severity of RA in relation to a normal subject over time so as to track movement toward normal as a result of successful therapy and away from normal in response to symptomatic flare.
- the panel of constituents are selected so as to distinguish, e.g. , classify stable RA subjects from unstable RA subjects.
- a stable RA subject it is meant that the subject was responsive to the therapeutic being administered.
- an unstable RA subject is meant that the disease was not responding to the therapeutic being administered.
- the methods of the invention are used to determine efficacy of treatment of a particular subject.
- the panel of constituents are selected so as to distinguish, e.g. , classify between a normal and a RA-diagnosed subject or an stable and a unstable subject with at least 75%, 80%, 85%, 90%, 95%, 97%, 98%, 99% or greater accuracy.
- accuracy is meant that the method has the ability to distinguish, e.g. , classify, between subjects having rheumatoid arthritis, or an inflammatory condition associated with rheumatoid arthritis, and those that do not.
- the term "accuracy" is meant that the method has the ability to distinguish, e.g., classify, between subjects that are responding to therapy and those that do not. Accuracy is determined for example by comparing the results of the Gene Expression Prowling to standard accepted clinical methods of diagnosing RA, e.g. , one or more symptoms of RA such as tender and swollen joints, fatigue, pain and stiffness in the joints, inflammation, or increased serum CRP levels.
- the panel contains 10, 8, 5, 4, 3 or fewer constituents.
- the panel of constituents includes TLR2, MMP9, IFI16, TGFB1, NFKB1, TEMP1, ICAM1, STAT3, CSPG2 or HLADRA.
- the panel includes two or more constituents from Table 5.
- the panel includes any 2, 3, 4, or 5 genes in the combination shown in Tables, 5, 6, 8, 9 and 10 respectively.
- the panel contains i) TLR2 and one or more or the following: CD4, PTGS2, IL18BP, HSPA1A, HMBG1, C1QA, MNDA, CD19, CD86, SERPING1, CD8A, PTPRC, MYC, NFKB1, TNFSFS, LTA, TGFB1, DPP4, EGR1, IL1R1, ICAM1, IL1RN, TIMP1, NINDA, MPO, GCLC, PAP1, MMP9, TNFSF6, PLA2G7, CYBB, CD14, SERPINE1, HLADRA, MEF2C, MMP9, CASP9 pr IL1B; ii) MMP9 and one or more of the following: SERPING1, PTGS2, IFI16, HSPA1A, CD4, C1QA, MNDA, IL18BP, IL1R1, MYC, APAF1, CD86, CD19, SERPINE1, HMGB1, MPO, NFKB1, TGFB1, EGR
- assessing may further include comparing the profile data set to a baseline profile data set for the panel.
- the baseline profile data set is related to the rheumatoid arthritis or an inflammatory condition related to rheumatoid arthritis to be characterized.
- the baseline profile data set is derived from one or more other samples from the same subject, taken when the subject is in a biological condition different from that in which the subject was at the time the first sample was taken, with respect to at least one of age, nutritional history, medical condition, clinical indicator, medication, physical activity, body mass, and environmental exposure, and the baseline-profile data set may be derived from one or more other samples from one or more different subjects.
- the one or more different subjects may have in common with the subject at least one of age group, gender, ethnicity, geographic location, nutritional history, medical condition, clinical indicator, medication, physical activity, body mass, and environmental exposure.
- a clinical indicator may be used to assess rheumatoid arthritis or an inflammatory condition related to rheumatoid arthritis of the one or more different subjects, and may also include interpreting the calibrated profile data set in the context of at least one other clinical indicator, wherein the at least one other clinical indicator includes blood chemistry, X-ray or other radiological or metabolic imaging technique, other chemical assays, and physical findings.
- the baseline profile data set may be derived from one or more other samples from the same subject taken under circumstances different from those of the first sample, and the circumstances may be selected from the group consisting of (i) the time at which the first sample is taken, (ii) the site from which the first sample is taken, (iii) the biological condition of the subject when the first sample is taken.
- rheumatoid arthritis or an inflammatory condition related to rheumatoid arthritis is meant that the condition is an autoimmune condition, an environmental condition, a viral infection, a bacterial infection, a eukaryotic parasitic infection, or a fungal infection.
- the sample is any sample derived from a subject which contains RNA.
- the sample is blood, a blood fraction, body fluid, and a population of cells or tissue from the subject.
- one or more other samples can be taken over an interval of time that is at least one month between the first sample and the one or more other samples, or taken over an interval of time that is at least twelve months between the first sample and the one or more samples, or they may be taken pre-therapy intervention or post-therapy intervention.
- the first sample may be derived from blood and the baseline profile data set may be derived from tissue or body fluid of the subject other than blood.
- the first sample is derived from tissue or bodily fluid of the subject and the baseline profile data set is derived from blood.
- the measurement conditions are substantially repeatable, particularly within a degree of repeatability of better than five percent or more particularly within a degree of repeatability of better than three percent, and/or wherein efficiencies of amplification for all constituents are substantially similar, more particularly wherein the efficiency of amplification is within two percent, and still more particularly wherein the efficiency of amplification for all constituents is less than one percent.
- the invention includes storing the profile data set in a digital storage medium.
- storing the profile data set includes storing it as a record in a database.
- Gene Expression Panels may be used for measurement of therapeutic efficacy of natural or synthetic compositions or stimuli that may be formulated individually or in combinations or mixtures for a range of targeted biological conditions; prediction of toxicological effects and dose effectiveness of a composition or mixture of compositions for an individual or for a population or set of individuals or for a population of cells; determination of how two or more different agents administered in a single treatment might interact so as to detect any of synergistic, additive, negative, neutral or toxic activity; performing pro-clinical and clinical trials by providing new criteria for pre-selecting subjects according to informative profile data sets for revealing disease status; and conducting preliminary dosage studies for these patients prior to conducting phase 1 or 2 trials.
- These Gene Expression Panels may be employed with respect to samples derived from subjects in order to evaluate their biological condition.
- the present invention provides Gene Expression Panels for the evaluation or characterization of rheumatoid arthritis and inflammatory condition related to rheumatoid arthritis in a subject.
- the Gene Expression Profiles described herein also provided the evaluation of the effect of one or more agents for the treatment of rheumatoid arthritis and inflammatory condition related to rheumatoid arthritis.
- RA Expression Panel This Gene expression panel is refered to herein as "RA Expression Panel”.
- a RA Expression panel includes one or more genes, e.g. , constituent, listed in Tables I-2, and Tables 4-10. Each gene of the RA Expression panel is refered to herein as an RNA associated gene or an RA associated constituent.
- rheumatoid arthritis By evaluating or characterizing rheumatoid arthritis is meant diagnosising rheumatoid arthritis, assessing the risk of developing rheumatoid arthritis or asssing the prognosis of a subject with rheumatoid arthritis. Similarly, by evaluating or characterizing an agent for treatment of rheumatoid arthritis is meant identifying agents suitable for the treatment of rheumatoid arthritis. The agents can be compounds known to treat RA or compounds that have not been shown to treat RA.
- Rheumatoid arthritis and inflammatory condition related to rheumatoid arthritis is evaluated by determinining the level of expression (e.g, a quantitative measure) of one or more RA genes.
- the level of expression is determined by any means known in the art, such as for example quantitative PCR. The measurement is obtained under conditions that are substantially repeatable.
- the qualitative measure of the constituent is compared to a baseline level (e.g. baseline profile set).
- a baseline level is a level expression of the constituent in one or more subjects known not to be suffering from rheumatoid arthritis (e.g., a heathy individual).
- the baseline level is derived from one or more subjects known to be suffering from rheumatoid arthritis.
- the baseline level is derived from the same subject from which the first measure is derived.
- the baseline is taken from a subject prior to receiving treatment for RA, or at different time periods during a course of treatment
- Comparison can be performed on test (e.g. , patient) and reference samples (e.g. , baseline) measured concurrently or at temporally distinct times.
- test e.g. , patient
- reference samples e.g. , baseline
- An example of the latter is the use of compiled expression information, e.g., a sequence database, which assembles information about expression levels RA genes.
- a change in the expression pattern in the patient-derived sample of a RA gene compared to the normal baseline level indicates that the subject is suffering from or is at risk of developing rheumatoid arthritis.
- a similar level compared to the normal control level in the patient-derived sample of a RA gene indicates that the subject is not suffering from or is at risk of developing rheumatoid arthritis.
- a similarity in the expression pattern in the patient-derived sample of a RNA gene compared to the RA baseline level indicates that the subject is suffering from or is at risk of developing rheumatoid arthritis.
- Expression of an effective amount of an RA gene also allows for the course of treatment of rheumatoid arthritis to be monitored.
- a biological sample is provided from a subject undergoing treatment, e.g., if desired, biological samples are obtained from the subject at various time points before, during, or after treatment.
- Expression of an effective amount of RA gene is then determined and compared to baseline profile.
- the baseline profile may be taken or derived from one or more individuals who have been exposed to the treatment.
- the baseline level may be taken or dervived from one or more individuals who have not been exposed to the treatment.
- samples may be collected from subjects who have received initial treatment for rheumatoid arthritis and subsequent treatment for rheumatoid arthritis to monitor the progress of the treatment.
- the RA Geen expression panels disclosed herein allow for a putative therapeutic or prophylactic to be tested from a selected subject in order to determine if the agent is a suitable for treating or preventing rheumatoid arthritis in the subject.
- test sample from the subject is exposed to a candidate therapeutic agent, and the expression of one or more of RA genes is determined.
- a subject sample is incubated in the presence of a candidate agent and the pattern of RA gene expression in the test sample is measured and compared to a baseline profile, e.g. , a rheumatoid arthritis baseline profile or an non- rheumatoid arthritis baseline profile or an index value.
- the test agent can be any compound or composition.
- the reference sample e.g., baseline is from a subject that does not have rheumatoid arthritis a similarity in the pattern ofRA genes in the test sample and the reference sample indicates that the treatment is efficacious. However, a change in the pattern of RA genes in the test sample and the reference sample indicates a less favorable clinical outcome or prognosis.
- Efficacious is meant that the treatment leads to a decrease of a sign or symptom of rheumatoid arthritis in the subject. Assessment rheumatoid arthritis is made using standard clinical protocols. Efficacy is determined in association with any known method for diagnosing or treating rheumatoid arthritis.
- a Gene Expression Panel is selected in a manner so that quantitative measurement of RNA or protein constituents in the Panel constitutes a measurement of a biological condition of a subject.
- a calibrated profile data set is employed. Each member of the calibrated profile data set is a function of (i) a measure of a distinct constituent of a Gene Expression Panel and (ii) a baseline quantity.
- the criterion of repeatability means that all measurements for this constituent, if skewed, will nevertheless be skewed systematically, and therefore measurements of expression level of the constituent may be compared meaningfully. In this fashion valuable information may be obtained and compared concerning expression of the constituent under varied circumstances.
- a second criterion also be satisfied, namely that quantitative measurement of constituents is performed under conditions wherein efficiencies of amplification for all constituents are substantially similar as defined herein.
- measurement of the expression level of one constituent may be meaningfully compared with measurement of the expression level of another constituent in a given sample and from sample to sample.
- Additional embodiments relate to the use of an index or algorithm resulting from quantitative measurement of constituents, and optionally in addition, derived from either expert analysis or computational biology (a) in the analysis of complex data sets; (b) to control or normalize the influence of uninformative or otherwise minor variances in gene expression values between samples or subjects; (c) to simplify the characterization of a complex data set for comparison to other complex data sets, databases or indices or algorithms derived from complex data sets; (d) to monitor a biological condition of a subject; (e) for measurement of therapeutic efficacy of natural or synthetic compositions or stimuli that may be formulated individually or in combinations or mixtures for a range of targeted biological conditions; (f) for predictions of toxicological effects and dose effectiveness of a composition or mixture of compositions for an individual or for a population or set of individuals or for a population of cells; (g) for determination of how two or more different agents administered in a single treatment might interact so as to detect any of synergistic, additive, negative, neutral of toxic activity (h) for performing pre-clin
- Gene expression profiling and the use of index characterization for a particular condition or agent or both may be used to reduce the cost of phase 3 clinical trials and may be used beyond phase 3 trials; labeling for approved drugs; selection of suitable medication in a class of medications for a particular patient that is directed to their unique physiology; diagnosing or determining a prognosis of a medical condition or an infection which may precede onset of symptoms or alternatively diagnosing adverse side effects associated with administration of a therapeutic agent; managing the health care of a patient; and quality control for different batches of an agent or a mixture of agents.
- the methods disclosed here may be applied to cells of humans, mammals or other organisms without the need for undue experimentation by one of ordinary skill in the art because all cells transcribe RNA and it is known in the art how to extract RNA from all types of cells.
- a subject can include those who have not been previously diagnosed as having rheumatoid arthritis or an inflammatory condition related to rheumatoid arthritis. Alternatively, a subject can also include those who have already been diagnosed as having rheumatoid arthritis or an inflammatory condition related to rheumatoid arthritis.
- Diagnosis of RA is made, for example, from any one or combination of the following procedures: a medical history; a physical exam looking for common features reported in RA, including but not limited to joint swelling, joint tenderness, loss of motion in the joints, and joint malalignment; signs of RA in other organs, including but not limited to skin, lungs and eyes; lab tests including but limited to measuring blood cell count, erythrocyte sedimentation rate, C-Reactive Protein levels, Rheumatoid Factor, and/or Antinuclear Antibodies; and imaging studies including but not limited to X-rays, MRI, joint ultrasound, and/or bone densitometry.
- the subject has been previously treated with therapeutic agents, or with other therapies and treatment regimens for rheumatoid arthritis or an inflammatory condition related to rheumatoid arthritis, including but not limited to any one or combination of the following therapeutics: NSAIDS, e.g., ibuprofen; COX-2 inhibitors, e.g., celecoxib (Celebrex); low dose corticosteroids; DMARDs, e.g. , methotrexate, leflunomide, gold thiomalate, aurothioglucose, or auranofin; TNF inhibitors, e.g.
- NSAIDS e.g., ibuprofen
- COX-2 inhibitors e.g., celecoxib (Celebrex)
- DMARDs e.g. , methotrexate, leflunomide, gold thiomalate, aurothioglucose, or auranofin
- a subject can also include those who are suffering from, or at risk of developing rheumatoid arthritis or an inflammatory condition related to rheumatoid arthritis, such as those who exhibit known risk factors for rheumatoid arthritis or an inflammatory condition related to rheumatoid arthritis.
- Known risk factors for RA include, but are not limited to blood transfusions, age (increased susceptibility between ages 25-55), gender (women are 2.5 to 3 times more likely to develop RA than men), family history of RA or other autoimmune disorders, ethnic background (increased susceptibility in Caucasians and Native Americans), and obesity.
- RNA RNA-induced RNA-induced RNA-induced RNA-induced RNA-induced RNA-induced RNA-induced RNA-induced RNA-induced RNA-induced RNA-induced RNA-induced RNA-induced RNA-induced RNA-induced RNA-induced RNA-induced RNA-induced RNA-induced RNA-induced RNA-induced RNA-induced RNA-induced RNA-induced RNA-induced RNA-induced RNA-induced RNA.
- symptoms include but are not limited to fatigue, morning stiffness (lasting more than one hour), diffuse muscular aches, loss of appetite, and weakness.
- joint pain appears, with warmth, swelling, tenderness, and stiffness of the joint after inactivity.
- Tables 1-2 and Tables 4-10 listed below, include relevant genes which may be selected for a given Gene Expression Panel, such as the Gene Expression Panels demonstrated herein to be useful in the evaluation of rheumatoid arthritis and inflammatory condition related to rheumatoid arthritis.
- Table 1 is a panel of 83 genes whose expression is associated with Rheumatoid Arthritis or inflammatory conditions related to Rheumatoid Arthritis.
- Table 2 is a panel of 103 genes whose expression is associated with Inflammation.
- Tables 4-6 were derived from a longitudinal study of RA patients after initiating Interleukin-1 receptor antagonist (IL1ra) or IL1ra plus soluble TNF- ⁇ receptor 1 (sTNFRl) therapy, described in Example 5 below.
- Table 4 is a panel of genes derived from latent class modeling of the subjects from this study using a 1-gene model to distinguish between subjects suffering from RA and normal subjects.
- Tables 5-6 are panels of gene models derived from latent class modeling of the subjects from this study using a 2-gene and 3-gene model repectively, to distinguish between subjects suffering from RA and normal subjects. Constituent models selected from Tables 5 and 6 are capable of correctly classifying RA-afflicted and/or normal subjects with at least 75% accuracy.
- the two gene model TLR2 and CD4 correctly classifies RA-afflicted subjects with 91% accuracy, and normal subjects with 98% accuracy.
- the 2-gene model TLR2 and C1QA correctly classifies RA-afflicted subjects with 100% accuracy, and normal subjects with 96% accuracy.
- the 3-gene model TLR2, CD4, and NFKB 1 correctly classifies both RA-afflicted subjects and normal subjects with 100% accuracy.
- the 3-gene model TLR2, CD4, and MYC correctly classifies RA subjects with 96% accuracy and normal subjects with 99% accuracy.
- Tables 7-10 were derived from a longitudinal study of RA patients after initiating NSAID, MTX or new TNF-inhibitor therapy, described in Example 6 below.
- Table 7 is a panel of genes derived from latent class modeling of the subjects from this study using a 1-gene model to distinguish between subjects suffering from RA and normal subjects.
- Tables 8-10 are panels of gene models derived from latent class modeling of the subjects from this study using a 2-gene, 3-gene, and 4-gene model repectively, to distinguish between subjects suffering from RA and normal subjects. Constituent models selected from Tables 8-10 are capable of correctly classifying RA-afflicted and/or normal subjects with at least 75% accuracy.
- the two gene model ICAM1 and HLADRA correctly classifies RA-afflicted subjects with 90% accuracy, and normal subjects with 91% accuracy.
- the 3-gene model ICAM1, HLADRA, and HSPA1A correctly classifies RA-afflicted subjects with 95% accuracy, and normal subjects with 97% accuracy.
- the 4-gene model SCAM1, HLADRA HSPA1A, and TGFB1 correctly classifies both RA-afflicted and normal subjects with 100% accuracy.
- panels may be constructed and experimentally verified by one of ordinary skill in the art in accordance with the principles articulated in the present application.
- a sample is run through a panel in triplicate; that is, a sample is divided into aliquots and for each aliquot the concentrations of each constituent in a Gene Expression Panel is measured. From over a total of 900 constituent assays, with each assay conducted in triplicate, an average coefficient of variation was found (standard deviation/average)* 100, of less than 2 percent among the normalized ⁇ Ct measurements for each assay (where normalized quantitation of the target mRNA is determined by the difference in threshold cycles between the internal control (e.g., an endogenous marker such as 18S rRNA, or an exogenous marker) and the gene of interest. This figure is a measure called "intra-assay variability".
- Assays have also been conducted on different occasions using the same sample material. With 72 assays, resulting from concentration measurements of constituents in a panel of 24 members, and such concentration measurements determined on three different occasions over time, an average coefficient of variation of less than 5 percent, typically less than 2%, was found. This is a measure of "inter-assay variability".
- the average coefficient of variation is less than 20%, more preferably less than 10%, more preferably less than 5%, more preferably less than 4%, more preferably less than 3%, more preferably less than 2%, and even more preferably less than 1%.
- RNA is extracted from a sample such as a tissue, body fluid, or culture medium in which a population of cells of a subject might be growing.
- a sample such as a tissue, body fluid, or culture medium in which a population of cells of a subject might be growing.
- cells may be lysed and RNA eluted in a suitable solution in which to conduct a DNAse reaction.
- First strand synthesis may be performed using a reverse transcriptase.
- Gene amplification more specifically quantitative PCR assays, can then be conducted and the gene of interest calibrated against an internal marker such as 18S rRNA ( Hirayama et al., Blood 92, 1998: 46-52 ). Any other endogenous marker can be used, such as 28S-25S rRNA and 5S rRNA. Samples are measured in multiple replicates, for example, 3 replicates.
- quantitative PCR is performed using amplification, reporting agents and instruments such as those supplied commercially by Applied Biosystems (Foster City, CA). Given a defined efficiency of amplification of target transcripts, the point (e.g.
- cycle number that signal from amplified target template is detectable may be directly related to the amount of specific message transcript in the measured sample.
- other quantifiable signals such as fluorescence, enzyme activity, disintegrations per minute, absorbance, etc., when correlated to a known concentration of target templates ( e.g. , a reference standard curve) or normalized to a standard with limited variability can be used to quantify the number of target templates in an unknown sample.
- quantitative gene expression techniques may utilize amplification of the target transcript Alternatively or in combination with amplification of the target transcript, quantitation of the reporter signal for an internal marker generated by the exponential increase of amplified product may also be used.
- Amplification of the target template may be accomplished by isothermic gene amplification strategies, or by gene amplification by thermal cycling such as PCR.
- Amplification efficiencies are regarded as being “substantially similar”, for the purposes of this description and the following claims, if they differ by no more than approximately 10%. preferably by less than approximately 5%, more preferably by less than approximately 3%, and mnore preferably by less than approximately 1%. Measurement conditions are regarded as being “substantially repeatable, for the purposes of this description and the following claims, if they differ by no more than approximately +/- 10% coefficient of variation (CV), preferably by less than approximately +/- 5% CV, more preferably +/- 2% CV.
- CV coefficient of variation
- primer-probe design can be enhanced using computer techniques known in the art, and notwithstanding common practice, it has been found that experimental validation is still useful. Moreover, in the course of experimental validation, the selected primer-probe combination is associated with a set of features:
- the primer probe set should amplify cDNA of less than 110 bases in length and should not amplify, or generate fluorescent signal from, genomic DNA or transcripts or cDNA from related but biologically irrelevant loci.
- a suitable target of the selected primer probe is first strand cDNA, which may be prepared, in one embodiment, is described as follows:
- Human blood is obtained by venipuncture and prepared for assay by separating samples for baseline, no exogenous stimulus, and pro-inflammatory stimulus with sufficient volume for at least three time points.
- Typical pro-inflammatory stimuli include lipopolysaccharide (LPS), phytohemagglutinin (PHA) heat-killed staphylococci (HKS), carrageean, IL-2 plus toxic shock syndrome toxin-1 (TSST1), or cytokine cocktails, and may be used individually or in combination.
- LPS lipopolysaccharide
- PHA phytohemagglutinin
- HLS phytohemagglutinin
- TSST1 toxic shock syndrome toxin-1
- cytokine cocktails may be used individually or in combination.
- the aliquots of heparinized, whole blood are mixed with additional test therapeutic compounds and held at 37°C in an atmosphere of 5% CO 2 for 30 minutes. Stimulus is added at varying concentrations, mixed and held loosely capped at 37°C for
- RNA and or DNA are purified from cells, tissues or fluids of the test population of cells or indicator cell lines.
- RNA is preferentially obtained from the nucleic acid mix using a variety of standard procedures (or RNA Isolation Strategies, pp. 55-104, in RNA Methodologies. A laboratory guide for isolation and characterization, 2nd edition, 1998, Robert E. Farrell, Jr., Ed., Academic Press ), in the present using a filter-based RNA isolation system from Ambion (RNAqueous TM, Phenol-free Total RNA Isolation Kit, Catalog #1912, version 9908; Austin, Texas).
- the whole blood assay for Gene Expression Profiles determination was carried out as follows: Human whole blood was drawn into 10 mL Vacutainer tubes with Sodium Heparin. Blood samples were mixed by gently inverting tubes 4-5 times. The blood was used within 10-1 minutes of draw. In the experiments, blood was diluted 2-fold, i.e. per sample per time point, 0.6 mL whole blood + 0.6 mL stimulus. The assay medium was prepared and the stimulus added as appropriate.
- a quantity (0.6 mL) of whole blood was then added into each 12 x 75 mm polypropylene tube.
- 0.6 mL of 2X LPS (from E. coli serotype 0127:B8, Sigma#L3880 or serotype 055, Sigma #L4005, 10ng/mL, subject to change in different lots) into LPS tubes was added.
- 0.6 mL assay medium was added to the "control" tubes. The caps were closed tightly. The tubes were inverted 2-3 times to mix samples. Caps were loosened to first stop and the tubes incubated at 37°C, 5% CO 2 for 6 hours.
- samples were gently mixed to resuspend blood cells, and 0.15 mL was removed from each tube (using a micropipettor with barrier tip), and transfered to0.15 mL of lysis buffer and mixed. Lysed samples were extracted using an ABI 6100 Nucleic Acid Prepstation following the manufacturer's recommended protocol.
- RNA samples were then centrifuged for 5 min at 500 x g, ambient temperature (IEC centrifuge or equivalent, in microfuge tube adapters in swinging bucket), and as much serum from each tube was removed as possible and discarded.
- Cell pellets were placed on ice; and RNA extracted as soon as possible using an Ambion RNAqueous kit.
- RNAs are amplified using message specific primers or random primers.
- the specific primers are synthesized from data obtained from public databases (e.g. , Unigene, National Center for Biotechnology Information, National Library of Medicine, Bethesda, MD), including information from genomic and cDNA libraries obtained from humans and other animals. Primers are chosen to preferentially amplify from specific RNAs obtained from the test or indicator samples (see, for example, RT PCR, Chapter 15 in RNA Methodologies, A laboratory guide for isolation and characterization 2nd edition, 1998, Robert E. Farrell, Jr., Ed., Academic Press ; or Chapter 22 pp.143-151, RNA isolation and characterization protocols. Methods in molecular biology; Volume 86, 1998, R.
- Amplifications are carried out in either isothermic conditions or using a thermal cycler (for example, a ABI 9600 or 9700 or 7900 obtained from Applied Biosystems, Foster City, CA; see Nucleic acid detection methods, pp. 1-24, in Molecular methods for virus detection, D.L.Wiedbrauk and D.H., Farkas, Eds.,1995, Academic Press ).
- a thermal cycler for example, a ABI 9600 or 9700 or 7900 obtained from Applied Biosystems, Foster City, CA; see Nucleic acid detection methods, pp. 1-24, in Molecular methods for virus detection, D.L.Wiedbrauk and D.H., Farkas, Eds.,1995, Academic Press ).
- Amplified nucleic acids are detected using fluorescent-tagged detection oligonucleotide probes (see, for example, TaqmanTM PCR Reagent Kit, Protocol, part number 402823 revision A, 1996, Applied Biosystems, Foster City CA) that are identified and synthesized from publicly known databases as described for the amplification primers.
- amplified cDNA is detected and quantified using the ABI Prism 7900 Sequence Detection System obtained from Applied Biosystems (Foster City, CA). Amounts of specific RNAs contained in the test sample or obtained from the indicator cell lines can be related to the relative quantity of fluorescence observed (see for example, Advances in quantitative PCR technology: 5' nuclease assays, Y.S.
- Methods herein may also be applied using proteins where sensitive quantitative techniques, such as an Enzyme Linked ImmunoSorbent Assay (ELISA) or mass spectroscopy, are available and well-known in the art for measuring the amount of a protein constituent. (see WO 98/24935 herein incorporated by reference).
- ELISA Enzyme Linked ImmunoSorbent Assay
- mass spectroscopy mass spectroscopy
- the analyses of samples from single individuals and from large groups of individuals provide a library of profile data sets relating to a particular panel or series of panels. These profile data sets may be stored as records in a library for use as baseline profile data sets. As the term "baseline" suggests, the stored baseline profile data sets serve as comparators for providing a calibrated profile data set that is informative about a biological condition or agent. Baseline profile data sets may be stored in libraries and classified in a number of cross-referential ways. One form of classification may rely on the characteristics of the panels from which the data sets are derived. Another form of classification may be by particular biological condition, e . g ., rheumatoid arthritis.
- the concept of biological condition encompasses any state in which a cell or population of cells may be found at any one time. This state may reflect geography of samples, sex of subjects or any other discriminator. Some of the discriminators may overlap.
- the libraries may also be accessed for records associated with a single subject or particular clinical trial.
- the classification of baseline profile data sets may further be annotated with medical information about a particular subject, a medical condition, and/or a particular agent.
- the choice of a baseline profile data set for creating a calibrated profile data set is related to the biological condition to be evaluated, monitored, or predicted, as well as, the intended use of the calibrated panel, e.g ., as to monitor drug development, quality control or other uses. It may be desirable to access baseline profile data sets from the same subject for whom a first profile data set is obtained or from different subject at varying times, exposures to stimuli, drugs or complex compounds; or may be derived from like or dissimilar populations or sets of subjects.
- the baseline profile data set may be normal, healthy baseline.
- the profile data set may arise from the same subject for which the first data set is obtained, where the sample is taken at a separate or similar time, a different or similar site or in a different or similar biological condition.
- a sample may be taken before stimulation or after stimulation with an exogenous compound or substance, such as before or after therapeutic treatment.
- the profile data set obtained from the unstimulated sample may serve as a baseline profile data set for the sample taken after stimulation.
- the baseline data set may also be derived from a library containing profile data sets of a population or set of subjects having some defining characteristic or biological condition.
- the baseline profile data set may also correspond to some ex vivo or in vitro properties associated with an in vitro cell culture.
- the resultant calibrated profile data sets may then be stored as a record in a database or library along with or separate from the baseline profile data base and optionally the first profile data set although the first profile data set would normally become incorporated into a baseline profile data set under suitable classification criteria.
- the remarkable consistency of Gene Expression Profiles associated with a given biological condition makes it valuable to store profile data, which can be used, among other things for normative reference purposes.
- the normative reference can serve to indicate the degree to which a subject conforms to a given biological condition (healthy or diseased) and, alternatively or in addition, to provide a target for clinical intervention.
- Selected baseline profile data sets may be also be used as a standard by which to judge manufacturing lots in terms of efficacy, toxicity, etc.
- the baseline data set may correspond to Gene Expression Profiles taken before administration of the agent.
- the baseline data set may correspond with a gold standard for that product.
- any suitable normalization techniques may be employed. For example, an average baseline profile data set is obtained from authentic material of a naturally grown herbal nutriceutical and compared over time and over different lots in order to demonstrate consistency, or lack of consistency, in lots of compounds prepared for release.
- calibrated profile data sets are highly reproducible in samples taken from the same individual under the same conditions.
- calibrated profile data sets are reproducible in samples that are repeatedly tested. Also found have been repeated instances wherein calibrated profile data sets obtained when samples from a subject are exposed ex vivo to a compound are comparable to calibrated profile data from a sample that has been exposed to a sample in vivo.
- an indicator cell line treated with an agent can in many cases provide calibrated profile data sets comparable to those obtained from in vivo or ex vivo populations of cells.
- administering a sample from a subject onto indicator cells can provide informative calibrated profile data sets with respect to the biological condition of the subject including the health, disease states, therapeutic interventions, aging or exposure to environmental stimuli or toxins of the subject.
- the calibrated profile data set may be expressed in a spreadsheet or represented graphically for example, in a bar chart or tabular form but may also be expressed in a three dimensional representation.
- the function relating the baseline and profile data may be a ratio expressed as a logarithm.
- the constituent may be itemized on the x-axis and the logarithmic scale may be on the y-axis.
- Members of a calibrated data set may be expressed as a positive value representing a relative enhancement of gene expression or as a negative value representing a relative reduction in gene expression with respect to the baseline.
- Each member of the calibrated profile data set should be reproducible within a range with respect to similar samples taken from the subject under similar conditions.
- the calibrated profile data sets may be reproducible within one order of magnitude with respect to similar samples taken from the subject under similar conditions. More particularly, the members may be reproducible within 20%, and typically within 10%.
- a pattern of increasing, decreasing and no change in relative gene expression from each of a plurality of gene loci examined in the Gene Expression Panel may be used to prepare a calibrated profile set that is informative with regards to a biological condition, biological efficacy of an agent treatment conditions or for comparison to populations or sets of subjects or samples, or for comparison to populations of cells.
- Patterns of this nature may be used to identify likely candidates for a drug trial, used alone or in combination with other clinical indicators to be diagnostic or prognostic with respect to a biological condition or may be used to guide the development of a pharmaceutical or nutriceutical through manufacture, testing and marketing.
- the numerical data obtained from quantitative gene expression and numerical data from calibrated gene expression relative to a baseline profile data set may be stored in databases or digital storage mediums and may retrieved for purposes including managing patient health care or for conducting clinical trials or for characterizing a drug.
- the data may be transferred in physical or wireless networks via the World Wide Web, email, or internet access site for example or by hard copy so as to be collected and pooled from distant geographic sites.
- the method also includes producing a calibrated profile data set for the panel, wherein each member of the calibrated profile data set is a function of a corresponding member of the first profile data set and a corresponding member of a baseline profile data set for the panel, and wherein the baseline profile data set is related to the rheumatoid arthritis or inflammatory conditions related to rheumatoid arthritis to be evaluated, with the calibrated profile data set being a comparison between the first profile data set and the baseline profile data set, thereby providing evaluation of the rheumatoid arthritis or inflammatory conditions related to rheumatoid arthritis of the subject.
- the function is a mathematical function and is other than a simple difference, including a second function of the ratio of the corresponding member of first profile data set to the corresponding member of the baseline profile data set, or a logarithmic function.
- the first sample is obtained and the first profile data set quantified at a first location, and the calibrated profile data set is produced using a network to access a database stored on a digital storage medium in a second location, wherein the database may be updated to reflect the first profile data set quantified from the sample. Additionally, using a network may include accessing a global computer network.
- a descriptive record is stored in a single database or multiple databases where the stored data includes the raw gene expression data (first profile data set) prior to transformation by use of a baseline profile data set, as well as a record of the baseline profile data set used to generate the calibrated profile data set including for example, annotations regarding whether the baseline profile data set is derived from a particular Signature Panel and any other annotation that facilitates interpretation and use of the data.
- the data is in a universal format, data handling may readily be done with a computer.
- the data is organized so as to provide an output optionally corresponding to a graphical representation of a calibrated data set.
- a distinct sample derived from a subject being at least one of RNA or protein may be denoted as PI.
- the first profile data set derived from sample PI is denoted Mj, where Mj is a quantitative measure of a distinct RNA or protein constituent of PI.
- the record Ri is a ratio of M and P and may be annotated with additional data on the subject relating to, for example, age, diet, ethnicity, gender, geographic location, medical disorder, mental disorder, medication, physical activity, body mass and environmental exposure.
- data handling may further include accessing data from a second condition database which may contain additional medical data not presently held with the calibrated profile data sets. In this context, data access may be via a computer network.
- the above described data storage on a computer may provide the information in a form that can be accessed by a user. Accordingly, the user may load the information onto a second access site including downloading the information. However, access may be restricted to users having a password or other security device so as to protect the medical records contained within.
- a feature of this embodiment of the invention is the ability of a user to add new or annotated records to the data set so the records become part of the biological information.
- the graphical representation of calibrated profile data sets pertaining to a product such as a drug provides an opportunity for standardizing a product by means of the calibrated profile, more particularly a signature profile.
- the profile may be used as a feature with which to demonstrate relative efficacy, differences in mechanisms of actions, etc. compared to other drugs approved for similar or different uses.
- the various embodiments of the invention may be also implemented as a computer program product for use with a computer system.
- the product may include program code for deriving a first profile data set and for producing calibrated profiles.
- Such implementation may include a series of computer instructions fixed either on a tangible medium, such as a computer readable medium (for example, a diskette, CD-ROM, ROM, or fixed disk), or transmittable to a computer system via a modem or other interface device, such as a communications adapter coupled to a network.
- the network coupling may be for example, over optical or wired communications lines or via wireless techniques (for example, microwave, infrared or other transmission techniques) or some combination of these.
- the series of computer instructions preferably embodies all or part of the functionality previously described herein with respect to the system.
- Such computer instructions can be written in a number of programming languages for use with many computer architectures or operating systems. Furthermore, such instructions may be stored in any memory device, such as semiconductor, magnetic, optical or other memory devices, and may be transmitted using any communications technology, such as optical, infrared, microwave, or other transmission technologies. It is expected that such a computer program product may be distributed as a removable medium with accompanying printed or electronic documentation (for example, shrink wrapped software), preloaded with a computer system (for example, on system ROM or fixed disk), or distributed from a server or electronic bulletin board over a network (for example, the Internet or World Wide Web).
- a computer system is further provided including derivative modules for deriving a first data set and a calibration profile data set.
- the calibration profile data sets in graphical or tabular form, the associated databases, and the calculated index or derived algorithm, together with information extracted from the panels, the databases, the data sets or the indices or algorithms are commodities that can be sold together or separately for a variety of purposes as described in WO 01/25473 .
- a clinical indicator may be used to assess the rheumatoid arthritis or inflammatory conditions related to rheumatoid arthritis of the relevant set of subjects by interpreting the calibrated profile data set in the context of at least one other clinical indicator, wherein the at least one other clinical indicator is selected from the group consisting of blood chemistry, urinalysis, X-ray or other radiological or metabolic imaging technique, other chemical assays, and physical findings.
- An index may be constructed using an index function that maps values in a Gene Expression Profile into a single value that is pertinent to the biological condition at hand.
- the values in a Gene Expression Profile are the amounts of each constituent of the Gene Expression Panel that corresponds to the Gene Expression Profile. These constituent amounts form a profile data set, and the index function generates a single value-the index- from the members of the profile data set.
- the index function may conveniently be constructed as a linear sum of terms, each term being what is referred to herein as a "contribution function" of a member of the profile data set.
- the contribution function may be a constant times a power of a member of the profile data set.
- I ⁇ ⁇ CiMiP ( i , where I is the index, Mi is the value of the member i of the profile data set, Ci is a constant, and P(i) is a power to which Mi is raised, the sum being formed for all integral values of i up to the number of members in the data set.
- the values Ci and P(i) may be determined in a number of ways, so that the index I is informative of the pertinent biological condition.
- One way is to apply statistical techniques, such as latent class modeling, to the profile data sets to correlate clinical data or experimentally derived data, or other data pertinent to the biological condition.
- statistical techniques such as latent class modeling
- latent class modeling may be employed the software from Statistical Innovations, Belmont, Massachusetts, called Latent Gold®.
- Other simpler modeling techniques may be employed in a manner known in the art.
- the index function for inflammation may be constructed, for example, in a manner that a greater degree of inflammation (as determined by the profile data set for the Inflammation Gene Expression Panel included in Tables 1 and 2) correlates with a large value of the index function.
- each P(i) may be +1 or -1, depending on whether the constituent increases or decreases with increasing inflammation.
- a meaningful inflammation index that is proportional to the expression referred to herein as IR-105, was constructed as follows: 1 / 4 IL ⁇ 1 ⁇ A + 1 / 4 IL ⁇ 1 ⁇ B + 1 / 4 TNF + 1 / 4 INFG - 1 / IL ⁇ 10 , where the braces around a constituent designate measurement of such constituent and the constituents are a subset of the Inflammation Gene Expression Panel included in Tables 1 and 2.
- an index that characterizes a Gene Expression Profile can also be provided with a normative value of the index function used to create the index.
- This normative value can be determined with respect to a relevant population or set of subjects or samples or to a relevant population of cells, so that the index may be interpreted in relation to the normative value.
- the relevant population or set of subjects or samples, or relevant population of cells may have in common a property that is at least one of age range, gender, ethnicity, geographic location, nutritional history, medical condition, clinical indicator, medication, physical activity, body mass, and environmental exposure.
- the index can be constructed, in relation to a normative Gene Expression Profile for a population or set of healthy subjects, in such a way that a reading of approximately 1 characterizes normative Gene Expression Profiles of healthy subjects.
- the biological condition that is the subject of the index is inflammation; a reading of 1 in this example thus corresponds to a Gene Expression Profile that matches the norm for healthy subjects. A substantially higher reading then may identify a subject experiencing an inflammatory condition.
- the use of 1 as identifying a normative value is only one possible choice; another logical choice is to use 0 as identifying the normative value.
- Still another embodiment is a method of providing an index that is indicative of rheumatoid arthritis or inflammatory conditions related to rheumatoid arthritis of a subject based on a first sample from the subject, the first sample providing a source of RNAs, the method comprising deriving from the first sample a profile data set, the profile data set including a plurality of members, each member being a quantitative measure of the amount of a distinct RNA constituent in a panel of constituents selected so that measurement of the constituents is indicative of the presumptive signs of rheumatoid arthritis, the panel including at least two of the constituents of any of the genes listed in the Inflammation Gene Expression Panel included in Tables 1 and 2.
- At least one measure from the profile data set is applied to an index function that provides a mapping from at least one measure of the profile data set into one measure of the presumptive signs of rheumatoid arthritis, so as to produce an index pertinent to the rheumatoid arthritis or inflammatory conditions related to the rheumatoid arthritis of the subject.
- M 1 and M 2 are values of the member i of the profile data set
- C i is a constant determined without reference to the profile data set
- a quadratic expression that is constructed as a meaningful identifier of Rheumatoid Arthritis is the following: C 0 + C 1 TLR ⁇ 2 + C 2 CD ⁇ 4 + C 3 NFKB ⁇ 1 + C 4 TLR ⁇ 2 CD ⁇ 4 + C 5 TLR ⁇ 2 NFKB ⁇ 1 + C 6 ⁇ NFKB ⁇ 1 2 + C 7 ⁇ TLR ⁇ 2 2 + C 8 ⁇ CD ⁇ 4 2 , where the constant C 0 serves to calibrate this expression to the biological population of interest (such as RA), that is characterized by inflammation.
- the odds are 50:50 off the subject being RA vs normal.
- the predicted odds of being RA is [exp(I i )], and therefore the predicted probability of being RNA is [exp(I i )]/[1+exp((I i )].
- the predicted probability that a subject is RNA is higher than .5, and when it falls below 0, the predicted probability is less than .5.
- the value of C 0 may be adjusted to reflect the prior probability of being in this population based on known exogenous risk factors for the subject.
- C 0 is adjusted as a function of the subject's risk factors, where the subject has prior probability p i of being RA based on such risk factors, the adjustment is made by increasing (decreasing) the unadjusted C 0 value by adding to C 0 the natural logarithm of the ratio of the prior odds of being RA taking into account the risk factors to the overall prior odds of being RA without taking into account the risk factors.
- the invention also includes an RA-detection reagent, i . e ., nucleic acids that specifically identify one or more rheumatoid arthritis or inflammatory condition related to rheumatoid arthritis nucleic acids (e.g ., any gene listed in Tables 1-2 and Tables 4-10; sometimes referred to herein as RA-associated genes) by having homologous nucleic acid sequences, such as oligonucleotide sequences, complementary to a portion of the RA-associated genes nucleic acids or antibodies to proteins encoded by theRA-associated genes nucleic acids packaged together in the form of a kit.
- the oligonucleotides can be fragments of the RA-associated genes.
- the oligonucleotides can be 200, 150, 100, 50, 25, 10 or less nucleotides in length.
- the kit may contain in separate containers a nucleic acid or antibody (either already bound to a solid matrix or packaged separately with reagents for binding them to the matrix), control formulations (positive and/or negative), and/or a detectable label. Instructions ( i . e ., written, tape, VCR, CD-ROM, etc.) for carrying out the assay may be included in the kit.
- the assay may for example be in the form of PCR, a Northern hybridization or a sandwich ELISA, as known in the art.
- RA-associated genes detection reagents can be immobilized on a solid matrix such as a porous strip to form at least one RA-associated genes detection site.
- the measurement or detection region of the porous strip may include a plurality of sites containing a nucleic acid.
- a test strip may also contain sites for negative and/or positive controls. Alternatively, control sites can be located on a separate strip from the test strip.
- the different detection sites may contain different amounts of immobilized nucleic acids, i. e., a higher amount in the first detection site and lesser amounts in subsequent sites.
- the number of sites displaying a detectable signal provides a quantitative indication of the amount of RA-associated genes present in the sample.
- the detection sites may be configured in any suitably detectable shape and are typically in the shape of a bar or dot spanning the width of a test strip.
- the kit contains a nucleic acid substrate array comprising one or more nucleic acid sequences.
- the nucleic acids on the array specifically identify one or more nucleic acid sequences represented by RA-associated genes (see Tables 1-2 and Tables 4-10).
- the expression of 2, 3, 4, 5, 6, 7, 8, 9, 10, 15, 20, 25, 40 or 50 or more of the sequences represented by RA-associated genes can be identified by virtue of binding to the array.
- the substrate array can be on, i . e ., a solid substrate, i . e ., a "chip" as described in U.S. Patent No. 5,744,305 .
- the substrate array can be a solution array, i . e ., Luminex, Cyvera, Vitra and Quantum Dots' Mosaic.
- nucleic acid probes i . e ., oligonucleotides, aptamers, siRNAs, antisense oligonucleotides, against any of the RA-associated genes listed in Tables 1-2 and Tables 4-10.
- subjects having "active RA” were selected on the basis of the following criteria: 6 or more swollen joints, 9 or more tender joints, CRP > 2 mg/dL, and may require introduction of more aggressive therapy.
- Subjects suffering from RA and described as being “stable” indicate that the subject was responsive to the therapeutic being administered.
- Subjects suffering from RA and described as being “unstable” that their disease was not responding to the therapeutic being administered, and whose therapeutic was scheduled to be changed.
- Example 1 Development and use of population normative values for Gene Expression Profiles.
- Figure 1A shows the arithmetic mean values for gene expression profiles (using 48 loci of the Inflammation Gene Expression Panel included in Tables 1 and 2) obtained from whole blood of two distinct patient populations (patient sets). These patient sets are both normal or undiagnosed.
- the first patient set which is identified as Bonfils (the plot points for which are represented by diamonds), was composed of 17 subjects accepted as blood donors at the Bonfils Blood Center in Denver, Colorado.
- the second patient set was composed of 16 donors, for which Gene Expression Profiles were obtained from assays conducted four times over a four-week period. Subjects in this second patient set (plot points for which are represented by squares) were recruited from employees of Source Precision Medicine, Inc., the assignee herein.
- Figure 2 shows arithmetic mean values for gene expression profiles (again using the 48 loci of the Inflammation Gene Expression Panel included in Tables 1 and 2) also obtained from whole blood of two distinct patient populations (patient sets).
- Figure 3 also shows the effect over time, on inflammatory gene expression in a single human subject suffering from rheumatoid arthritis, of the administration of a TNF-inhibiting compound, but here the expression is shown in comparison to the cognate locus average previously determined for the normal ( i . e ., undiagnosed, healthy) patient set
- the subject was followed over a twelve-week period. The subject was enrolled in the study because of a failure to respond to conservative drug therapy for rheumatoid arthritis and a plan to change therapy and begin immediate treatment with a TNF-inhibiting compound. Blood was drawn from the subject prior to initiation of new therapy (visit 1).
- Figure 4A further illustrates the consistency of inflammatory gene expression, illustrated here with respect to 7 loci of (of the Inflammation Gene Expression Panel included in Tables 1 and 2), in a set of 44 normal, undiagnosed blood donors. For each individual locus is shown the range of values lying within ⁇ 2 standard deviations of the mean expression value, which corresponds to 95% of a normally distributed population. Notwithstanding the great width of the confidence interval (95%), the measured gene expression value ( ⁇ Ct)-remarkably-still lies within 10% of the mean, regardless of the expression level involved. As.described in further detail below, for a given biological condition an index can be constructed to provide a measurement of the condition.
- an inflammation index value was determined for each member of a set of 42 normal undiagnosed blood donors, and the resulting distribution of index values, shown in the figure, can be seen to approximate closely a normal distribution, notwithstanding the relatively small subject set size.
- the values of the index are shown relative to a 0-based median, with deviations from the median calibrated in standard deviation units. Thus 90% of the subject set lies within +1 and -1 of a 0 value.
- Figure 4C illustrates the use of the same index as Figure 4B , where the inflammation median for a normal population of subjects has been set to zero and both normal and diseased subjects are plotted in standard deviation units relative to that median.
- An inflammation index value was determined for each member of a normal, undiagnosed population of 70 individuals (black bars). The resulting distribution of index values, shown in Figure 4C , can be seen to approximate closely a normal distribution.
- index values were calculated for individuals from two diseased population groups, (1) rheumatoid arthritis patients treated with methotrexate (MTX) who are about to change therapy to more efficacious drugs ( e .
- MTX methotrexate
- Figure 5 plots, in a fashion similar to that of Figure 4A , Gene Expression Profiles, for the same 7 loci as in Figure 4A , two different 6-subject populations of rheumatoid arthritis patients.
- One population (called “stable” in the figure) is of patients who have responded well to treatment and the other population (called “unstable” in the figure) is of patients who have not responded well to treatment and whose therapy is scheduled for change.
- the expression values for the stable patient population lie within the range of the 95% confidence interval, whereas the expression values for the unstable patient population for 5 of the 7 loci are outside and above this range.
- the right-hand portion of the figure shows an average inflammation index of 9.3 for the unstable population and an average inflammation index of 1.8 for the stable population, compared to 1 for a normal undiagnosed population of patients.
- the index thus provides a measure of the extent of the underlying inflammatory condition, in this case, rheumatoid arthritis.
- the index besides providing a measure of biological condition, can be used to measure the effectiveness of therapy as well as to provide a target for therapeutic intervention.
- Example 3 Experimental Design for Evaluating Rheumatoid Arthritis: Assessing Response to Therapeutic Treatment
- the inflammation index was used to assess response to therapeutic treatment by individuals suffering from rheumatoid arthritis, or inflammatory conditions induced or related to rheumatoid arthritis.
- the inflammation index was used to assess a single subject suffering from rheumatoid arthritis, who has not responded well to traditional therapy with methotrexate.
- the results are depicted in Figure 7 , where the inflammation index for this subject is shown on the far right of the graph at the start of a new therapy (a TNF inhibitor), and then, moving leftward, successively, 2 weeks, 6 weeks, and 12 weeks thereafter.
- a new therapy a TNF inhibitor
- the inflammation index was used to assess three subjects suffering from rheumatoid arthritis, who have not responded well to traditional therapy with methotrexate, at the beginning of new treatment (also with a TNF inhibitor), and 2 weeks and 6 weeks thereafter.
- the results are depicted in Figure 8 , where the index in each case can again be seen moving generally towards normal, consistent with physician observation of the patients as responding to the new treatment.
- the inflammation index was used to assess three groups of ten international subjects suffereing from RA, each of whom has been characterized as stable (that is, not anticipated to be subjected to a change in therapy) by the subject's treating physician, and each group having been treated with either methotrexate, Enbrel (a TNF inhibitor), or Remicade (another TNF inhibitor).
- the results are depicted in Figures 9-11 .
- Figure 9 shows the index for each of 10 patients in the group being treated with methotrexate, which known to alleviate symptoms without addressing the underlying disease.
- Figure 10 shows the index for each of 10 patients in the group being treated with Enbrel
- Figure 11 shows the index for each 10 patients being treated with Remicade.
- the inflammation index for each of the patients in Figure 9 is elevated compared to normal, whereas in Figure 10 , the patients being treated with Enbrel as a class have an inflammation index that comes much closer to normal (80% in the normal range).
- Figure 11 it can be seen that, while all but one of the patients being treated with Remicade have an inflammation index at or below normal, two of the patients have an abnormally low inflammation index, suggesting an immunosuppressive response to this drug. (Indeed, studies have shown that Remicade has been associated with serious infections in some subjects, and here the immunosuppressive effect is quantified.)
- one subject has an inflammation index that is significantly above the normal range. This subject in fact was also on a regimen of an anti-inflammation steroid (prednisone) that was being tapered; within approximately one week after the inflammation index was sampled, the subject experienced a significant flare of clinical symptoms.
- prednisone anti-inflammation steroid
- these examples show a measurement, derived from the assay of blood taken from a subject, pertinent to the subject's arthritic condition. Given that the measurement pertains to the extent of inflammation, it can be expected that other inflammation-based conditions, including, for example, cardiovascular disease, may be monitored in a similar fashion.
- Figure 13 shows a comparison of the change in relative gene expression of 24 patients unstable on Disease Modifying Anti-Rheumatoid Drug (DMARD) therapy, 19 patients stable on DMARD therapy, and 20 patients stable on TNF blockers relative to the mean ( ⁇ Ct) of normal gene expression for 11 genes of interest for RA patients.
- the relative change in expression (indicated by X-fold change relative to the mean for normal gene expression) ranges from 3.45-fold greater expression than the mean for MMP9, to 2.23-fold greater expression than the mean for IL10, for patients unstable on DMARD.
- Figure 14 shows gene expression values for 8 genes in17 patients with Active RA (i.e. , each patient had 6 or more swollen joints, 9 or more tender joints, and had CRP at greater than 2 mg/dL), expressed as standard deviation changes from normal.
- the light-shaded boxes indicate all gene expression values for the various patients that are greater than 2-fold standard deviation units above or below the normal values, and are statistically significant. As can be seen, nearly all of these patients had changes in standard deviation of greater than two for several of the genes investigated.
- using a standard algorithm referred to herein as the IR-105 algorithm note, statistically derived algorithms are discussed in further detail above 15 of the 17 patients were assessed with IR-105 values greater than 2, suggesting that these patients could benefit from more aggressive therapy.
- Figure 15 is a study of 22 patients with Active RA (same as for Figure 14 ) performed by different rheumatologists on different patients from those in Figure 14 , where similar results are observed. 20 of the 22 patients exhibit changes in standard deviation units that are more than 2-fold greater than the values for normal gene expression. In particular, the values for the genes TGFB1 and TIMP1 are particularly increased in most of the patients. As with the results in Figure 14 , these data suggest that the patients are not responding to the current therapy, as these results look similar to those for patients in Figure 14 who failed DMARD therapy. Again, these data suggest that more aggressive therapy, in addition to or in place of current treatment, may be in order for these patients.
- Figure 16 displays the gene expression values, expressed in change of standard deviation units relative to normal expression values, for 19 patients who were stable on TNF blockers for 3 months prior to the study. As can be seen, the gene expression values for these patients are almost all within "normal.” The exception for patient 01 a is explainable and does not dilute the value of this study. Patient 01 a was in fact not stable 3 months prior to the study but rather, flared 1 month prior to the study, was treated aggressively with prednisone, and the data for this patient comes from 1 week prior to the flare.
- patients 13 and 18 have gene expression values for PTGS2, ILB, and IL1RN that are underexpressed relative to the normal values, suggesting that these patients are trending towards immunosuppression. Again, these data show the predictive value of gene expression analysis for identifying patients at risk for immunosuppression.
- the relative expression for 11 of the 12 genes examined were overexpressed at the start of the study, still over-expressed at week 4 but less so, and by the end of the study, 7 genes were still over-expressed to some extent, while 4 genes had transitioned to the under-expressed category (IL1RN, CXCL1, and PTGS2 - light boxes).
- the values of CD19 were all under-expressed from the start of the study until the end.
- Figure 18 shows gene expression values for clinically, stable RA patients being treated with methotrexate for a panel of 10 genes known as the Inflammation Index (in standard deviation units).
- Figure 18 shows gene expression values for clinically stable RA patients being treated with enbrel (etanercept) for a panel of 10 genes known as the Inflammation Index (in standard deviation units).
- Figure 20 shows gene expression values for clinically stable RA patients being treated with Remicade (infliximab) for a panel of 10 genes known as the Inflammation Index (in standard deviation units).
- Figure 21 shows gene expression values for additional clinically stable RA patients being treated with Remicade (infliximab) for a panel of 10 genes known as the Inflammation Index (in standard deviation units).
- Figure 22 shows an assessment of the data presented in Figures 20 and 21 , wherein a TNF inhibitor study performed on the patients (remicade/methotrexate program) resulted in a flare-up for patient 01a (see Figure 21 ), requiring agressive treatment involving increased TNF inhihibor dosage.
- Figure 23 shows the response of 22 patients over time in respect to 5 different clinical assessments traditionally used by clinicians for a study treating RA patients with kineret or sTNF-R1 plus kineret: Disease Activity Score (DAS); Swollen Joint Count (SJC); Tender Joint Count (TJ); MD Assessment of Disease (MDAD); and Health Assessment Questionaire (HAQ) self score, based on patient's evaluation on quality of life factors.
- DAS Disease Activity Score
- SJC Swollen Joint Count
- TJ Tender Joint Count
- MDAD MD Assessment of Disease
- HAQ Health Assessment Questionaire
- Figure 24 shows Pearson Correlation Coefficients across all values for 5 clinical assessment methods traditionally used by physicians to monitor RA patients. As can be seen, the values for swollen joint count (SJC) and tender joint count (TJC) are not always statistically significant, but those for DAS tend to have statistical significance for most genes examined with this study. This study shows how it is possible to determine associations with clinical endpoints using simple correlations.
- SJC swelling joint count
- TJC tender joint count
- Figure 25 shows that DAS is becoming the gold standard for comparison of the usefulness of the methodologies described and claimed herein using a gene expression panel selected to enable diagnosis, evaluation, and treatment of RA in patients.
- a mixed model analysis i . e ., multiple genes
- the p-values for genes associated with determination of DAS values are statistically significant, indicating that the gene expression values determined for these genes in such a panel can be used in place of the traditional physician's DAS determination.
- the advantages are clear. A physician needs at least an hour, sometimes more, to determine a DAS value for a patient, and many of the indicators used to determine the DAS value are subjective.
- Figure 26 shows the relationship of gene expression to phyician's assessment of disease using either a simple a correlation method of analysis (as in Figure 23 ), or mixed model method of analysis for gene expression values (as in Figure 24 ) determined for a number of genes of interest in unstable RA patients undergoing treatment with methotrexate.
- TLR2 was found to be the most significant Table 3 shows that compared to the Normals, the washed-out RAs tend to be under-expressed with respect to TLR2.
- the top 6 genes (lowest p-value discriminating between RA and Normals, highlighted in Table 4) were subject to further analysis in a two-gene model. Each of the top 6 genes, one at a time, was used as the first gene in a 2-gene model, where all 46 remaining genes were evaluated as the second gene in this 2-gene model. All models that yielded significant incremental p-values, at the .05 level, for the second gene were then analyzed using Latent Gold to find R 2 values.
- FIG 27 shows the strong discrimination provided by TLR2 and CD4.
- NFKB1 3 rd
- the predicted probability of being an RA was 1 for each RA in the sample and 0 for each Normal case (to 8 decimal places).
- the predicted probability incorporates the prior probability of being an RA, which is reflected in the intercept of the logit model. Since this analysis consists of 22 RAs out of a total sample of 154, the prior probability was set at 22/154.
- a conditional model can be estimated, for example, by focusing on the prediction of tPn as a function of CD4.
- Figures 30 and 31 show the best least squares fitting line and lower 95% predicted confidence limit for the Normals data showing the expected value for tPn and tPn2 given a particular expression level for CD4. The RA population falls below the lower limit.
- Example 6 Clinical Data Analyzed with Latent Class Modeling (1-gene, 2-gene, 3- gene and 4-gene models):
- a STEP analysis was used to obtain predictions under 1-gene, 2-gene, 3-gene, and 4-gene models. As described infra, 4-gene models provided perfect discrimination between RA and Normal populations.
- the top 6 genes (lowest p-value discriminating between RA and Normals, (highlighted in Table 7) were subject to further analysis in a two-gene model. Each of the top 6 genes, one at a time, was used as the first gene in a 2-gene model, where all 23 remaining genes were evaluated as the second gene in this 2-gene model. All models that yielded significant incremental p-values, at the .05 level, for the second gene were then analyzed using Latent Gold to find R 2 values for each gene.
- the 2-gene models that discriminated well were subject to more STEP analyses as the first two genes for 3-gene models where all 22 remaining genes were evaluated as the third gene in the 3-gene model.
- Latent Gold was used to determine R 2 values as well as p-values for each gene. All models that yielded significant incremental p-values, at the .05 level, for the third gene were then analyzed using Latent Gold to find R 2 values. For all 3-gene models that yielded an R 2 value greater than .6, classification percentages were determined using Latent Gold or GoldMineR (shown in Table 9).
- Example 7 Clinical Data analyzed with Latent Class Modeling: Normal v. Unstable RA.
- Figure 34 shows that Unstable RAs have significant lower levels than Normals on both genes.
- Figure 35 shows the data for both studies together. The results here suggest that the model can probably be generalized to apply also to unstable RAs.
- Latent class (LC)/ finite mixture modeling was used to examine the number of latent classes in the data under the above assumptions, and determine how closely related these classes are to the Normals and RAs. The possibility of selection effects was minimized in the development of the model by not using the information about group membership in the model estimation, and see to the extent to which the model could predict group membership.
- Baseline gene expressions for RAs and for normals on tPn and CD4 were determined, without identifying group membership to develop a model that estimates the probability of being in the RA group (vs. normal) under the above distributional assumptions. This methodology is similar to that employed by Vermunt and Magidson (2004) where a LC model was developed that accurately classified individuals into the appropriate group (normal, overt diabetes, chemical diabetes) on the basis of 3 clinical measures (glucose, insulin, SSPG).
- the Bayesian Information Criteria (BIC) correctly identified 2 classes in the data (the 2-class model had the smallest BIC among models estimated containing between 1 and 4 classes).
- the first class consisted of all the Normals and the second consisted of all the RAs.
- MVN multivariate normal
- Example 9 Relationship between Gene expressions and Clinical Outcomes for Washed-Out RA Subjects.
- TLR2 enters into the linear regression second, following IL8.
- Swollen joint score increases with higher values on IL8 and lower values on TLR2.
- Table 15 for a summary of results from a stepwise ordinal logit model.
- Table 16 To relate the magnitude of "s” to the ability of the less precise measure to reproduce the more precise measure, for each of the 3 genes, Table 16 relates each value of "s” to the average %CD standard used in analysis, and Table 17 below relates "s” to the percentage of the variance of the more precise measure that is reproduced by the less precise measure.
- the "%CD standard” is the standard deviation s of the gene expression data divided by its mean. Table 16 calculates these average '%CD' values based on the mean for each of the 3 genes.
- Y(j) represent the measure developed according to the practices described herein for the expression of gene j.
- Y'(j) Y(j) + error, where 'error' is independently and identically distributed as Normal with mean 0 and standard deviation s. The higher the value of "s", the more error in the measurement. Since the mean error is zero, it was assumed that the less precise alternative measurement is unbiased.
- the square of the correlation between Y(j) and Y'(j) is a measure of the percentage of the variance of Y(j) that is captured by Y'(j). The formula for this is VAR(Y) / [VAR(Y) + s 2 ].
- the results of this simulation show that accurate measurement is critical to discrimination.
- the standard deviation of the measurements increases as larger amounts of error are added (see Table 19). For example, for TLR2, the standard deviation increases from .79 to .83, to .90, to 1.25 to 1.93.
- the R-square statistic which is a measure of the extent.to which the 3-genes discriminate between the RAs and Normals goes from 1 (perfect discrimination) to .87, to .55, to .33 to .23 as larger amounts of error are added to the data. Only for the situation where there is a 'small' amount of error, are 2-classes distinguished by a latent class analysis. That is, in the other situations the data does not contain sufficient differentiation to identify that it comes from 2 populations.
- Figures 38-41 show the plots corresponding to Figure 29 as applied to the simulated data.
- Gene Expression Profiles with sufficient precision and calibration as described herein (1) can determine subsets of individuals with a know biological condition, particularly individuals with rheumatoid arthritis or individuals with inflammatory conditions related to rheumatoid arthritis; (2) may be used to monitor the response of patients to therapy; (3) may be used to assess the efficacy and safety of therapy; and (4) may be used to guide the medical management of a patient by adjusting therapy to bring one or more relevant Gene Expression Profiles closer to a target set of values, which may be normative values or other desired or achievable values.
- Gene Expression Profiles are used for characterization and monitoring of treatment efficacy of individuals with rheumatoid arthritis, or individuals with inflammatory conditions related to rheumatoid arthritis. Use of the algorithmic and statistical approaches discussed above to achieve such identification and to discriminate in such fashion is within the scope of various embodiments herein.
- the panel comprises 10 or fewer constituents, or the panel comprises 5 or fewer constituents, or the panel comprises 2 constituents.
- the panel of constituents is selected so as to distinguish from a normal and a rheumatoid arthritis -diagnosed subject.
- the rheumatoid arthritis -diagnosed subject is washed out from therapy.
- the panel of constituents distinguishes from a normal and a rheumatoid arthritis -diagnosed subject with at least 75% accuracy.
- the panel of constituents is selected as to permit characterizing the severity of rheumatoid arthritis in relation to a normal subject over time so as to track movement toward normal as a result of successful therapy and away from normal in response to symptomatic flare.
- the panel includes TRL2.
- the panel further includes one or more constituent selected from the group consisting of CD4, PTGS2, IL18BP, HSPA1A, HMBG1, C1QA, MNDA, CD19, CD86, SERPING1, CD8A, PTPRC, and MYC.
- the panel further includes one or more constituent selected from the group consisting of NFKB1, TNFSF5, LTA, TGFB1, DPP4, EGR1, IL1R1, ICAM1, IL1RN, TIMP1, MNDA, MPO, GCLC, APAF1, MMP9, TNFSF6, PLA2G7, CYBB, CD 14, and SERPINE1.
- the panel further includes HLADRA.
- the panel further includes MEF2C or MMP9.
- the panel further includes one or more constituent selected from the group consisting of HSPA1A, CASP9 or IL1B.
- the panel includes MMP9.
- the panel further includes one or more constituent selected from the group consisting of SERPING1, PTGS2, IFI16, and HSPA1A.
- the panel further includes one or more constituent selected from the group consisting of CD4, C1QA, MNDA, IL18BP, IL1R1, MYC, APAF1, CD86, CD19, SERPINE1, HMGB1, MPO, NFKB1, TGFB1, EGR1, PLAUR, TNFSF5, SERPINA1, LTA, TIMP1, ICAM1, TNF, TLR2, IL1B, IL1RN, IL18, ADAM 17, PTPRC, CD 14, HMOX1, and CD8A.
- the panel includes IFI16.
- the panel further includes one or more constituent selected from the group consisting of HMGB1, SERPINE1, and CD19.
- the panel further includes one or more constituent selected from the group consisting of IL1R, NFKB1, MPO, MYC, TIMP1, IL18BP, SERPINE1, CD19, ELA2, TGFB1, IL10, C1QA, PTGS2, ADAM 17, IL18, CD4, HMOX1, CD86, HSPA1A, MNDA, TLR2, and MMP9.
- the panel includes TGFB 1.
- the panel further includes one or more constituent selected from the group consisting of CD4, IL18BP, PTGS2.
- the panel further includes one or more constituent selected from the group consisting of NFKB1, TLR2, IFI16, IL1R1, IL10, SERPINA1, SERPING1, and MMP9.
- the panel further includes HLADRA or HSPA1A.
- the panel further includes MMP9 or ICAM1.
- the panel includes NFKB1.
- the panel further includes one or more constituent selected from the group consisting of CD4 and IL18BP.
- the panel further includes one or more constituent selected from the group consisting of TLR2, MMP9, IL-10, IFI16, TIMP1, CD14, IL1R1, CYBB, SERPING1, PTGS2, MYC, SERPINA1, EGR1 and TNFSF5.
- the panel includes TIMP1.
- the panel further includes CD4.
- panel further includes one or more constituent selected from the group consisting of MYC, SERPING1, IFI16, SERPINA1, EGR1, and TNFSF5.
- the panel includes two or more constituents from Table 1 or Table 2.
- the panel includes ICAM1.
- the panel further includes one or more constituent selected from the group consisting of HLADRA, HSPA1A, CD14, and TGFBR2.
- the panel further includes one or more constituent selected from the group consisting of MMP9, TGFB1, CSPG2, and STAT3.
- the panel further includes one or more constituent selected from the group consisting of MEF2C, IL18, CD4 and NFB1B.
- the panel includes STAT3.
- the panel further includes one or more constituent selected from the group consisting of HLADRA, HSPA1A, CD 14, and TGFBR2.
- the panel further includes one or more constituent selected from the group consisting of MMP9, TGFB1, CSPG2, and ICAM1.
- the panel further includes EGR1.
- the panel includes CSPG2.
- the panel further includes one or more constituent selected from the group consisting of HLADRA, IL18 and CD14.
- the panel further includes one or more constituent selected from the group consisting of HSPA1A, IL1B, EGR1, TGFB1, and CASP9.
- the panel further includes one or more constituent selected from the group consisting of ITGAL, STAT3, EGR1, ICAM1, CD4, and MEF2C.
- the panel includes HLADRA.
- the panel further includes one or more constituent selected from the group consisting of CASP9, MEF2C, ITGAL, IL18, NFKB1B, CD4, NFKB 1, TGFBR2, SERPINE1 and CD 14.
- the panel further includes HSPA1A.
- panel further includes TLR2.
- sample is selected from the group consisting of blood, a blood fraction, body fluid, a population of cells and tissue from the subject.
Landscapes
- Chemical & Material Sciences (AREA)
- Life Sciences & Earth Sciences (AREA)
- Proteomics, Peptides & Aminoacids (AREA)
- Health & Medical Sciences (AREA)
- Organic Chemistry (AREA)
- Wood Science & Technology (AREA)
- Analytical Chemistry (AREA)
- Zoology (AREA)
- Genetics & Genomics (AREA)
- Engineering & Computer Science (AREA)
- Pathology (AREA)
- Immunology (AREA)
- Microbiology (AREA)
- Molecular Biology (AREA)
- Biotechnology (AREA)
- Biophysics (AREA)
- Physics & Mathematics (AREA)
- Biochemistry (AREA)
- Bioinformatics & Cheminformatics (AREA)
- General Engineering & Computer Science (AREA)
- General Health & Medical Sciences (AREA)
- Measuring Or Testing Involving Enzymes Or Micro-Organisms (AREA)
- Pharmaceuticals Containing Other Organic And Inorganic Compounds (AREA)
Applications Claiming Priority (2)
| Application Number | Priority Date | Filing Date | Title |
|---|---|---|---|
| US72105205P | 2005-09-27 | 2005-09-27 | |
| EP06836158A EP1945814A2 (fr) | 2005-09-27 | 2006-09-27 | Profilage d'expression génique aux fins de surveillance de l'identification et de traitement de la polyarthrite rhumatoïde |
Related Parent Applications (1)
| Application Number | Title | Priority Date | Filing Date |
|---|---|---|---|
| EP06836158.3 Division | 2006-09-27 |
Publications (1)
| Publication Number | Publication Date |
|---|---|
| EP2161348A1 true EP2161348A1 (fr) | 2010-03-10 |
Family
ID=37708412
Family Applications (2)
| Application Number | Title | Priority Date | Filing Date |
|---|---|---|---|
| EP06836158A Withdrawn EP1945814A2 (fr) | 2005-09-27 | 2006-09-27 | Profilage d'expression génique aux fins de surveillance de l'identification et de traitement de la polyarthrite rhumatoïde |
| EP09075548A Withdrawn EP2161348A1 (fr) | 2005-09-27 | 2006-09-27 | Profilage d'expression génétique pour la surveillance d'identification et le traitement de l'arthrite rhumatoïde |
Family Applications Before (1)
| Application Number | Title | Priority Date | Filing Date |
|---|---|---|---|
| EP06836158A Withdrawn EP1945814A2 (fr) | 2005-09-27 | 2006-09-27 | Profilage d'expression génique aux fins de surveillance de l'identification et de traitement de la polyarthrite rhumatoïde |
Country Status (5)
| Country | Link |
|---|---|
| US (1) | US7935482B2 (fr) |
| EP (2) | EP1945814A2 (fr) |
| AU (1) | AU2006294477A1 (fr) |
| CA (1) | CA2624359A1 (fr) |
| WO (1) | WO2007038754A2 (fr) |
Families Citing this family (41)
| Publication number | Priority date | Publication date | Assignee | Title |
|---|---|---|---|---|
| JP2008503206A (ja) * | 2004-05-25 | 2008-02-07 | 日立化成工業株式会社 | 癌感受性を測定する方法 |
| CN101044249B (zh) * | 2004-10-20 | 2012-09-05 | 日立化成工业株式会社 | 通过定量mRNA定制给药的方法 |
| CA2589746A1 (fr) * | 2004-12-08 | 2006-06-15 | Cedars-Sinai Medical Center | Methodes de diagnostic et de traitement de la maladie de crohn |
| WO2008109782A2 (fr) * | 2007-03-06 | 2008-09-12 | Cedars-Sinai Medical Center | Diagnostic d'une affection abdominale inflammatoire chez l'enfant |
| ATE512234T1 (de) * | 2005-04-28 | 2011-06-15 | Hitachi Chemical Res Ct Inc | Ex-vivo-genexpression in vollblut als modell für die beurteilung von individueller variation gegenüber nahrungszusätzen |
| JP4800384B2 (ja) | 2005-06-08 | 2011-10-26 | ヒタチ ケミカル リサーチ センター インコーポレイテッド | 腫瘍細胞及び刺激された白血球におけるmRNAの発現プロファイルに基づく腫瘍性疾患に対する免疫応答を予測する方法 |
| JP2009536021A (ja) * | 2006-04-07 | 2009-10-08 | 日立化成工業株式会社 | 関節リウマチの患者の末梢血白血球におけるFC受容体媒介性腫瘍壊死因子スーパーファミリ及びケモカインのmRNA発現の増大 |
| ATE518011T1 (de) * | 2006-04-07 | 2011-08-15 | Hitachi Chemical Co Ltd | Erhöhte expression von t- zellenrezeptorvermittelter tumornekrosefaktorsuperfamilie und chemokin-mrna in peripheren blut leukozyten bei patienten mit morbus& xa;crohn |
| US20100021917A1 (en) * | 2007-02-14 | 2010-01-28 | Cedars-Sinai Medical Center | Methods of using genes and genetic variants to predict or diagnose inflammatory bowel disease |
| US20100190162A1 (en) * | 2007-02-26 | 2010-07-29 | Cedars-Sinai Medical Center | Methods of using single nucleotide polymorphisms in the tl1a gene to predict or diagnose inflammatory bowel disease |
| WO2008137762A2 (fr) * | 2007-05-04 | 2008-11-13 | Cedars-Sinai Medical Center | Procédés de diagnostic et de traitement de la maladie de crohn |
| WO2008116150A2 (fr) | 2007-03-21 | 2008-09-25 | Cedars-Sinai Medical Center | Facteurs d'anastomose iléoanale avec réservoir (ippa) dans le traitement des maladies inflammatoires de l'intestin |
| WO2008134569A2 (fr) * | 2007-04-26 | 2008-11-06 | Cedars-Sinai Medical Center | Diagnostic et traitement de la rectocolite hémorragique chez la population portoricaine |
| JP2011502535A (ja) * | 2007-11-14 | 2011-01-27 | 日立化成工業株式会社 | 末梢血白血球における、Fc受容体を介した腫瘍壊死因子スーパーファミリーmRNA発現 |
| EP2075343A1 (fr) * | 2007-12-21 | 2009-07-01 | Gert Mayer | Procédé pour diagnostiquer une maladie progressive |
| US20090215064A1 (en) * | 2008-02-27 | 2009-08-27 | Hitachi Chemical Co., Ltd. | Quantitative assessment of individual cancer susceptibility by measuring dna damage-induced mrna in whole blood |
| WO2009155559A1 (fr) * | 2008-06-20 | 2009-12-23 | Medimmune Llc | Marqueurs pharmacodynamiques induits par interferon alpha |
| US20110177969A1 (en) * | 2008-10-01 | 2011-07-21 | Cedars-Sinai Medical Center | The role of il17rd and the il23-1l17 pathway in crohn's disease |
| US20110189685A1 (en) * | 2008-10-22 | 2011-08-04 | Cedars-Sinai Medical Center | Methods of using jak3 genetic variants to diagnose and predict crohn's disease |
| US20110229471A1 (en) | 2008-11-26 | 2011-09-22 | Cedars-Sinai Medical Center | Methods of determining responsiveness to anti-tnf alpha therapy in inflammatory bowel disease |
| WO2010075249A2 (fr) | 2008-12-22 | 2010-07-01 | Genentech, Inc. | Méthode de traitement de la polyarthrite rhumatoïde avec des antagonistes de cellules b |
| US9580752B2 (en) | 2008-12-24 | 2017-02-28 | Cedars-Sinai Medical Center | Methods of predicting medically refractive ulcerative colitis (MR-UC) requiring colectomy |
| EP2440935B1 (fr) * | 2009-06-09 | 2017-08-09 | Mayer, Gert | Procédé de diagnostic de troubles rénaux |
| JP5996429B2 (ja) * | 2009-09-03 | 2016-09-21 | ジェネンテック, インコーポレイテッド | 関節リウマチの治療、診断及びモニターするための方法 |
| EP3409289B1 (fr) | 2010-02-26 | 2020-09-30 | Novo Nordisk A/S | Compositions contenant un anticorps stable |
| EP2542696B1 (fr) | 2010-03-01 | 2016-09-28 | Caris Life Sciences Switzerland Holdings GmbH | Biomarqueurs pour théranostique |
| CN102918165A (zh) * | 2010-03-24 | 2013-02-06 | Tc园表达公司 | 患有炎症疾病的受试者对细胞因子靶向药物(CyTD)的早期反应或无反应预测的基因和基因组合 |
| JP2013526852A (ja) | 2010-04-06 | 2013-06-27 | カリス ライフ サイエンシズ ルクセンブルク ホールディングス | 疾患に対する循環バイオマーカー |
| RU2012153786A (ru) | 2010-05-28 | 2014-07-10 | Ново Нордиск А/С | Стабильные многодозовые композиции, содержащие антитело и консервант |
| KR20230109779A (ko) | 2013-03-27 | 2023-07-20 | 세다르스-신나이 메디칼 센터 | Tl1a 기능 및 관련된 신호전달 경로의 저해에 의한섬유증 및 염증의 완화 및 반전 |
| EP3022295A4 (fr) | 2013-07-19 | 2017-03-01 | Cedars-Sinai Medical Center | Signature de la voie de signalisation de tl1a (tnfsf15) |
| DE112016003948T5 (de) | 2015-08-31 | 2018-05-09 | City Of Sapporo | Molekulare verfahren zum beurteilen einer urothelialen erkrankung |
| KR20240095481A (ko) | 2016-03-17 | 2024-06-25 | 세다르스-신나이 메디칼 센터 | Rnaset2를 통한 염증성 장 질환의 진단 방법 |
| US11480568B2 (en) * | 2017-09-28 | 2022-10-25 | Yeda Research And Development Co. Ltd. | Diagnosis of autoimmune diseases |
| JP7496324B2 (ja) | 2018-03-16 | 2024-06-06 | サイファー メディシン コーポレイション | 抗tnf療法に対する応答性を予測するための方法及びシステム |
| GB2603294A (en) | 2019-06-27 | 2022-08-03 | Scipher Medicine Corp | Developing classifiers for stratifying patients |
| CA3180476A1 (fr) * | 2020-05-29 | 2021-12-02 | Robert B. Darnell | Marqueurs et antecedents cellulaires de crises d'arthrite rhumatoide |
| GB202009689D0 (en) * | 2020-06-25 | 2020-08-12 | Univ Ulster | A method of predicting response to treatment with a disease-modifying anti-rheumatic drug and/or classifying disease activity in a subject with rheumatoid art |
| WO2023097061A2 (fr) * | 2021-11-26 | 2023-06-01 | The Rockefeller University | Marqueurs et antécédents cellulaires de crises de polyarthrite rhumatoïde |
| CN117717544A (zh) * | 2023-11-22 | 2024-03-19 | 中国人民解放军联勤保障部队第九二〇医院 | 白杨素在制备用于治疗类风湿性关节炎的药物中的应用 |
| CN118186074A (zh) * | 2024-04-24 | 2024-06-14 | 华中科技大学同济医学院附属同济医院 | Dpp4作为类风湿关节炎标志物及靶点的应用 |
Citations (4)
| Publication number | Priority date | Publication date | Assignee | Title |
|---|---|---|---|---|
| WO2003060465A2 (fr) * | 2001-12-19 | 2003-07-24 | Millennium Pharmaceuticals, Inc. | Compositions, kits et procedes d'identification, d'evaluation, de prevention et de traitement de l'arthrite rhumatoide |
| WO2003072827A1 (fr) * | 2001-10-31 | 2003-09-04 | Children's Hospital Medical Center | Methode de diagnostic et de traitement de l'arthrite rhumatoide |
| WO2004057034A1 (fr) * | 2002-12-19 | 2004-07-08 | Source Precision Medicine, Inc. | Identification, suivi et traitement de maladie infectieuse et caracterisation de conditions inflammatoires associees a la maladie infectieuse utilisant des profils d'expression genetique |
| WO2004110244A2 (fr) | 2003-05-08 | 2004-12-23 | Vanderbilt University | Equation genetique utilisee pour diagnostiquer une polyarthrite rhumatoide |
Family Cites Families (3)
| Publication number | Priority date | Publication date | Assignee | Title |
|---|---|---|---|---|
| US5744101A (en) | 1989-06-07 | 1998-04-28 | Affymax Technologies N.V. | Photolabile nucleoside protecting groups |
| WO1998024935A1 (fr) | 1996-12-06 | 1998-06-11 | Urocor, Inc. | DIAGNOSTIC D'ETAT PATHOLOGIQUE A L'AIDE DE PROFILS d'ARN MESSAGER |
| CA2378008A1 (fr) | 1999-06-28 | 2001-04-12 | Source Precision Medicine, Inc. | Systemes et techniques permettant de caracteriser un etat ou un agent biologique par expression genique calibree |
-
2006
- 2006-09-27 EP EP06836158A patent/EP1945814A2/fr not_active Withdrawn
- 2006-09-27 CA CA002624359A patent/CA2624359A1/fr not_active Abandoned
- 2006-09-27 WO PCT/US2006/038170 patent/WO2007038754A2/fr not_active Ceased
- 2006-09-27 US US11/529,010 patent/US7935482B2/en not_active Expired - Fee Related
- 2006-09-27 EP EP09075548A patent/EP2161348A1/fr not_active Withdrawn
- 2006-09-27 AU AU2006294477A patent/AU2006294477A1/en not_active Abandoned
Patent Citations (4)
| Publication number | Priority date | Publication date | Assignee | Title |
|---|---|---|---|---|
| WO2003072827A1 (fr) * | 2001-10-31 | 2003-09-04 | Children's Hospital Medical Center | Methode de diagnostic et de traitement de l'arthrite rhumatoide |
| WO2003060465A2 (fr) * | 2001-12-19 | 2003-07-24 | Millennium Pharmaceuticals, Inc. | Compositions, kits et procedes d'identification, d'evaluation, de prevention et de traitement de l'arthrite rhumatoide |
| WO2004057034A1 (fr) * | 2002-12-19 | 2004-07-08 | Source Precision Medicine, Inc. | Identification, suivi et traitement de maladie infectieuse et caracterisation de conditions inflammatoires associees a la maladie infectieuse utilisant des profils d'expression genetique |
| WO2004110244A2 (fr) | 2003-05-08 | 2004-12-23 | Vanderbilt University | Equation genetique utilisee pour diagnostiquer une polyarthrite rhumatoide |
Non-Patent Citations (5)
| Title |
|---|
| BOVIN LF ET AL.: "Blood cell gene expression profiling in rheumatoid arthritis - Discriminative genes and effect of rheumatoid factor", IMMUNOLOGY LETTERS, vol. 93, no. 2-3, 15 May 2004 (2004-05-15), pages 217 - 226, XP002419834 * |
| RADSTAKE TIMOTHY R D J ET AL: "Expression of toll-like receptors 2 and 4 in rheumatoid synovial tissue and regulation by proinflammatory cytokines interleukin-12 and interleukin-18 via interferon-gamma", ARTHRITIS & RHEUMATISM, vol. 50, no. 12, December 2004 (2004-12-01), pages 3856 - 3865, XP002565781, ISSN: 0004-3591 * |
| RADSTAKE, T. R. D. J. ET AL., ARTHRITIS AND RHEUMATISM, vol. 50, no. 12, 2004, pages 3856 - 3865 |
| SEIB1, R. ET AL., AMERICAN JOURNAL OF PATHOLOGY, vol. 162, no. 4, 2003, pages 1221 - 1227 |
| SEIBL REINHART ET AL: "Expression and regulation of toll-like receptor 2 in rheumatoid arthritis synovium.", AMERICAN JOURNAL OF PATHOLOGY, vol. 162, no. 4, April 2003 (2003-04-01), pages 1221 - 1227, XP002565782, ISSN: 0002-9440 * |
Also Published As
| Publication number | Publication date |
|---|---|
| US20070196835A1 (en) | 2007-08-23 |
| CA2624359A1 (fr) | 2007-04-05 |
| WO2007038754A3 (fr) | 2007-07-26 |
| EP1945814A2 (fr) | 2008-07-23 |
| AU2006294477A1 (en) | 2007-04-05 |
| WO2007038754A2 (fr) | 2007-04-05 |
| US7935482B2 (en) | 2011-05-03 |
Similar Documents
| Publication | Publication Date | Title |
|---|---|---|
| US7935482B2 (en) | Gene expression profiling for identification monitoring and treatment of rheumatoid arthritis | |
| US20080233573A1 (en) | Gene expression profiling for identification, monitoring and treatment of transplant rejection | |
| WO2003040404A1 (fr) | Identification, surveillance et traitement d'une maladie et definition d'un etat biologique a l'aide de profils d'expression genetique | |
| EP2668287B1 (fr) | Gènes et combinaisons de gènes basés sur le gène mknk1 prédictifs de réponse précoce ou de non-réponse de sujets souffrant de polyarthrite rhumatoïde au anticorps monoclonal bloquant le tnf-alpha | |
| US20080183395A1 (en) | Gene expression profiling for identification, monitoring and treatment of multiple sclerosis | |
| US20110306512A1 (en) | Gene Expression Profiling for Identification, Monitoring, and Treatment of Osteoarthritis | |
| AU2007339334A1 (en) | Gene expression profiling for identification, monitoring, and treatment of ocular disease | |
| US20100285458A1 (en) | Gene Expression Profiling for Identification, Monitoring, and Treatment of Lupus Erythematosus | |
| EP2069533B1 (fr) | Profil d'expression génique pour identification, surveillance et traitement de la sclérose en plaques | |
| AU2003303238B2 (en) | Identification, monitoring and treatment of infectious disease and characterization of inflammatory conditions related to infectious disease using gene expression profiles | |
| US20110300542A1 (en) | Gene Expression Profiling For Identification, Monitoring And Treatment Of Multiple Sclerosis | |
| EP2024514B1 (fr) | Evaluation des effets d'un agent sur l'etat biologique de l'homme a l'aide de panneaux d'expression genique de rongeurs | |
| AU2006259306B2 (en) | Gene expression profiling for identification and monitoring of multiple sclerosis | |
| US20060115826A1 (en) | Gene expression profiling for identification monitoring and treatment of multiple sclerosis | |
| Ge et al. | Identification of differentially expressed genes and signaling pathways in rheumatoid arthritis by integrated bioinformatics analysis |
Legal Events
| Date | Code | Title | Description |
|---|---|---|---|
| PUAI | Public reference made under article 153(3) epc to a published international application that has entered the european phase |
Free format text: ORIGINAL CODE: 0009012 |
|
| AC | Divisional application: reference to earlier application |
Ref document number: 1945814 Country of ref document: EP Kind code of ref document: P |
|
| AK | Designated contracting states |
Kind code of ref document: A1 Designated state(s): AT BE BG CH CY CZ DE DK EE ES FI FR GB GR HU IE IS IT LI LT LU LV MC NL PL PT RO SE SI SK TR |
|
| RIN1 | Information on inventor provided before grant (corrected) |
Inventor name: STORM, KATHY Inventor name: BANKAITIS-DAVIS, DANUTE Inventor name: TROLLINGER, DAVID B. Inventor name: SICONOLFI, LISA Inventor name: WASSMANN, KARL |
|
| 17P | Request for examination filed |
Effective date: 20100831 |
|
| 17Q | First examination report despatched |
Effective date: 20101005 |
|
| GRAP | Despatch of communication of intention to grant a patent |
Free format text: ORIGINAL CODE: EPIDOSNIGR1 |
|
| STAA | Information on the status of an ep patent application or granted ep patent |
Free format text: STATUS: THE APPLICATION IS DEEMED TO BE WITHDRAWN |
|
| 18D | Application deemed to be withdrawn |
Effective date: 20130629 |