EP2184369A1 - Verfahren zur Normalisierung in der Elektrophorese - Google Patents
Verfahren zur Normalisierung in der Elektrophorese Download PDFInfo
- Publication number
- EP2184369A1 EP2184369A1 EP10000723A EP10000723A EP2184369A1 EP 2184369 A1 EP2184369 A1 EP 2184369A1 EP 10000723 A EP10000723 A EP 10000723A EP 10000723 A EP10000723 A EP 10000723A EP 2184369 A1 EP2184369 A1 EP 2184369A1
- Authority
- EP
- European Patent Office
- Prior art keywords
- signal
- peak
- sample
- dye
- sequencing
- Prior art date
- Legal status (The legal status is an assumption and is not a legal conclusion. Google has not performed a legal analysis and makes no representation as to the accuracy of the status listed.)
- Withdrawn
Links
- 238000000034 method Methods 0.000 title claims description 82
- 238000001962 electrophoresis Methods 0.000 title claims description 24
- 238000010606 normalization Methods 0.000 title claims description 7
- 108091033319 polynucleotide Proteins 0.000 claims abstract description 113
- 102000040430 polynucleotide Human genes 0.000 claims abstract description 113
- 239000002157 polynucleotide Substances 0.000 claims abstract description 113
- 239000012634 fragment Substances 0.000 claims abstract description 109
- 238000012163 sequencing technique Methods 0.000 claims abstract description 71
- 238000006243 chemical reaction Methods 0.000 claims abstract description 41
- 238000004458 analytical method Methods 0.000 claims abstract description 34
- 239000000203 mixture Substances 0.000 claims description 36
- 238000002474 experimental method Methods 0.000 claims description 32
- 239000012491 analyte Substances 0.000 claims description 19
- 238000001514 detection method Methods 0.000 abstract description 19
- 230000003287 optical effect Effects 0.000 abstract description 5
- 239000000975 dye Substances 0.000 description 90
- 239000002773 nucleotide Substances 0.000 description 31
- 125000003729 nucleotide group Chemical group 0.000 description 31
- 238000000926 separation method Methods 0.000 description 29
- 239000000499 gel Substances 0.000 description 26
- 230000008569 process Effects 0.000 description 19
- 238000004513 sizing Methods 0.000 description 18
- 108020004414 DNA Proteins 0.000 description 15
- 230000006870 function Effects 0.000 description 13
- 239000007850 fluorescent dye Substances 0.000 description 12
- 238000012300 Sequence Analysis Methods 0.000 description 10
- 238000002372 labelling Methods 0.000 description 9
- 239000000047 product Substances 0.000 description 8
- 239000002131 composite material Substances 0.000 description 7
- 238000013508 migration Methods 0.000 description 7
- 230000005012 migration Effects 0.000 description 7
- 238000003860 storage Methods 0.000 description 7
- 238000004422 calculation algorithm Methods 0.000 description 6
- 230000005284 excitation Effects 0.000 description 6
- 238000002347 injection Methods 0.000 description 6
- 239000007924 injection Substances 0.000 description 6
- 230000003321 amplification Effects 0.000 description 5
- 230000008901 benefit Effects 0.000 description 5
- 239000007795 chemical reaction product Substances 0.000 description 5
- 238000013507 mapping Methods 0.000 description 5
- 238000012986 modification Methods 0.000 description 5
- 230000004048 modification Effects 0.000 description 5
- 238000003199 nucleic acid amplification method Methods 0.000 description 5
- 238000001303 quality assessment method Methods 0.000 description 5
- 239000011324 bead Substances 0.000 description 4
- 230000006399 behavior Effects 0.000 description 4
- 239000011159 matrix material Substances 0.000 description 4
- 238000012545 processing Methods 0.000 description 4
- 230000003595 spectral effect Effects 0.000 description 4
- 238000013459 approach Methods 0.000 description 3
- 230000005540 biological transmission Effects 0.000 description 3
- 238000012937 correction Methods 0.000 description 3
- 238000010586 diagram Methods 0.000 description 3
- 238000001917 fluorescence detection Methods 0.000 description 3
- 230000003993 interaction Effects 0.000 description 3
- 230000005855 radiation Effects 0.000 description 3
- 238000011451 sequencing strategy Methods 0.000 description 3
- KDCGOANMDULRCW-UHFFFAOYSA-N 7H-purine Chemical compound N1=CNC2=NC=NC2=C1 KDCGOANMDULRCW-UHFFFAOYSA-N 0.000 description 2
- 238000001712 DNA sequencing Methods 0.000 description 2
- 239000003153 chemical reaction reagent Substances 0.000 description 2
- 238000010367 cloning Methods 0.000 description 2
- 238000004891 communication Methods 0.000 description 2
- 238000009499 grossing Methods 0.000 description 2
- 230000001939 inductive effect Effects 0.000 description 2
- 238000012423 maintenance Methods 0.000 description 2
- 238000004519 manufacturing process Methods 0.000 description 2
- 239000003550 marker Substances 0.000 description 2
- 238000012544 monitoring process Methods 0.000 description 2
- 150000007523 nucleic acids Chemical group 0.000 description 2
- 230000001105 regulatory effect Effects 0.000 description 2
- 238000012216 screening Methods 0.000 description 2
- 230000003068 static effect Effects 0.000 description 2
- 230000009466 transformation Effects 0.000 description 2
- 230000004304 visual acuity Effects 0.000 description 2
- 108700028369 Alleles Proteins 0.000 description 1
- RYGMFSIKBFXOCR-UHFFFAOYSA-N Copper Chemical compound [Cu] RYGMFSIKBFXOCR-UHFFFAOYSA-N 0.000 description 1
- 102000053602 DNA Human genes 0.000 description 1
- 102000004190 Enzymes Human genes 0.000 description 1
- 108090000790 Enzymes Proteins 0.000 description 1
- 101710163270 Nuclease Proteins 0.000 description 1
- 108091028043 Nucleic acid sequence Proteins 0.000 description 1
- CZPWVGJYEJSRLH-UHFFFAOYSA-N Pyrimidine Chemical compound C1=CN=CN=C1 CZPWVGJYEJSRLH-UHFFFAOYSA-N 0.000 description 1
- 101710205840 Ribonuclease P protein component 2 Proteins 0.000 description 1
- 102100028671 Ribonuclease P/MRP protein subunit POP5 Human genes 0.000 description 1
- 230000002547 anomalous effect Effects 0.000 description 1
- 238000004364 calculation method Methods 0.000 description 1
- 238000005251 capillar electrophoresis Methods 0.000 description 1
- 230000015556 catabolic process Effects 0.000 description 1
- 238000012512 characterization method Methods 0.000 description 1
- 239000003795 chemical substances by application Substances 0.000 description 1
- 230000001276 controlling effect Effects 0.000 description 1
- 238000007405 data analysis Methods 0.000 description 1
- 230000002950 deficient Effects 0.000 description 1
- 238000006731 degradation reaction Methods 0.000 description 1
- 230000003111 delayed effect Effects 0.000 description 1
- 238000009792 diffusion process Methods 0.000 description 1
- 230000000694 effects Effects 0.000 description 1
- 230000008030 elimination Effects 0.000 description 1
- 238000003379 elimination reaction Methods 0.000 description 1
- 230000002255 enzymatic effect Effects 0.000 description 1
- 238000013213 extrapolation Methods 0.000 description 1
- 239000000835 fiber Substances 0.000 description 1
- 229920001519 homopolymer Polymers 0.000 description 1
- 230000006872 improvement Effects 0.000 description 1
- 238000011065 in-situ storage Methods 0.000 description 1
- 238000010348 incorporation Methods 0.000 description 1
- 238000004989 laser desorption mass spectroscopy Methods 0.000 description 1
- 239000004973 liquid crystal related substance Substances 0.000 description 1
- 238000012067 mathematical method Methods 0.000 description 1
- 238000005259 measurement Methods 0.000 description 1
- 230000007246 mechanism Effects 0.000 description 1
- 238000005065 mining Methods 0.000 description 1
- 238000002156 mixing Methods 0.000 description 1
- 238000003908 quality control method Methods 0.000 description 1
- 238000011002 quantification Methods 0.000 description 1
- 239000011541 reaction mixture Substances 0.000 description 1
- 230000004044 response Effects 0.000 description 1
- 230000035945 sensitivity Effects 0.000 description 1
- 239000007787 solid Substances 0.000 description 1
- 239000000243 solution Substances 0.000 description 1
- 230000000392 somatic effect Effects 0.000 description 1
- 238000012360 testing method Methods 0.000 description 1
- 238000012546 transfer Methods 0.000 description 1
Images


Classifications
-
- G—PHYSICS
- G01—MEASURING; TESTING
- G01N—INVESTIGATING OR ANALYSING MATERIALS BY DETERMINING THEIR CHEMICAL OR PHYSICAL PROPERTIES
- G01N27/00—Investigating or analysing materials by the use of electric, electrochemical, or magnetic means
- G01N27/26—Investigating or analysing materials by the use of electric, electrochemical, or magnetic means by investigating electrochemical variables; by using electrolysis or electrophoresis
- G01N27/416—Systems
- G01N27/447—Systems using electrophoresis
- G01N27/44704—Details; Accessories
- G01N27/44717—Arrangements for investigating the separated zones, e.g. localising zones
- G01N27/44721—Arrangements for investigating the separated zones, e.g. localising zones by optical means
- G01N27/44726—Arrangements for investigating the separated zones, e.g. localising zones by optical means using specific dyes, markers or binding molecules
Definitions
- the present teachings relate to polynucleotide sequencing and fragment analyses, and to polynucleotide sequencers and analyzers that employ optical fluorescence detection techniques.
- the input data can be highly variable and predictive models of data behavior are lacking, yet computer analysis routines are expected to produce highly accurate output data.
- Base-calling is the data analysis part of automated DNA sequencing, which takes the time-varying signal of four fluorescence intensities and produces an estimate of the underlying DNA sequence which gave rise to that signal.
- base calling software works by applying a "model" of various phenomena, such as diffusion and smearing, differences in mobility of the various dyes and sequence-specific variations in migration, to observed spectral data in order to predict the true behavior of the fragments and how they are separating.
- model of various phenomena, such as diffusion and smearing, differences in mobility of the various dyes and sequence-specific variations in migration, to observed spectral data in order to predict the true behavior of the fragments and how they are separating.
- the more realistic the model the better an algorithm can deconvolve the raw signal data into a representation of true fragment separation order and, hence, the sequence (and/or fragment size).
- the widely-used algorithms provide only very simple and approximate models.
- a major source of base calling error is the incorrect estimate of spacing, i.e., knowing when fragments associated with a particular base will cross the detector. This is especially noticeable in homopolymer regions late in the run; e.g., a run of say, 5 As can be incorrectly called as 6 As.
- a number of separate calibration runs and extensive analysis produce hard-coded spacing curves.
- variations in the applied running conditions or simply uncontrolled experimental variation can produce fragment separation profiles that deviate substantially from the hard-coded curves.
- a dynamic method of determining peak spacing that is robust to different run conditions would substantially improve basecalling accuracy late in the run.
- deconvolution attempts to explain raw data as series of known peak shapes and has been shown to adequately separate overlapping peaks. However, deconvolution can produce spurious peaks if the true peak shape and size is not known in advance. A method of measuring the peak shape and width of known isolated peaks would improve deconvolution methods, which in turn would substantially improve basecalling accuracy, particularly late (further along) in the run.
- the present teachings provide for, among other things, one or more of: improved length or read, fewer basecalling errors, better assessment of data and experiment quality, and/or the ability to call data under a wide variety of experimental conditions.
- Various aspects of the present invention relate to methods for calibrating an apparatus for the analysis of polynucleotides.
- a method can comprise:
- such a method can further comprise making base calls for the analyte polynucleotide fragments of unknown nucleotide sequence.
- an internal standard comprises a set of labeled molecules, such as polynucleotide fragments of known size, that can be used to estimate the number of bases to be found within a given separation time interval as well as a more accurate peak shape model for that region (lane and migration time) of the gel.
- the present teachings provide for the inclusion in the sequencing lane (capillary, channel, gel track) of an internal standard that will permit a more accurate model of the underlying signal, allowing for a more precise deconvolution of base peaks.
- the standard can provide, for example, one or more of:
- a standard comprises a known set of molecules labeled with a fluor spectrally distinct from the four color set used for sequencing and/or fragment sizing.
- standards in accordance with the present teachings are capable of migrating in a fashion that can model that of sequencing-labeled DNA fragments and provide a similar peak shape upon detection.
- a standard in accordance with the teachings herein can, for example, be loaded with one or more lanes of labeled sequence reaction or sizing experiment and the extra or 5th dye color data returned for such lane(s) along with the conventional four color set.
- a model for peak shape, baseline, migration, relative mobility, and/or relative sample quantity can be built uniquely for each lane and run condition combination.
- Such models permit the realization of a number of advantages over prior methods including, not only absolute longer read length potential, but faster run times for comparable read lengths as they can compensate for the reduced gel resolution of faster gels.
- This hybrid approach can greatly increase the true throughput (of finished data) of sequencing, reducing the cost per finished base and making sequencing accessible to more users.
- the better signal model can allow for a more accurate binning function (a la TraceTuner TM - Paracel; Pasadena, CA.) for greater precision in quality value assessments and heterozygous discrimination. QA of the experimental process and machine status can be tracked knowing the specific standard and amount to be delivered to particular lanes.
- the present teachings can find use in any number of environments; for example, very high-throughput groups, groups interested in long reads for finishing jobs, those in regulated environments in need of high "accuracy” and “precision” (screening and diagnostics) and those interested in mixed sequencing strategies for discovery or diagnostics.
- lane tracking is generally not a need for capillary instruments, there is still a huge installed base of gel-based systems, such as the ABI Prism® 377 (Applied Biosystems; Foster City, CA).
- a 5th dye standard can provide for much better lane discrimination, hence, tracking (i.e., tracing and isolating the fragments of a single sample as they migrate past the detectors).
- tracking i.e., tracing and isolating the fragments of a single sample as they migrate past the detectors.
- This can facilitate denser sample loading, eliminate onerous manual re-tracking and enable various sequencing models (e.g., sequencing from both ends of the same clone) that are currently of little value on gel machines due to poor sample-to-lane referencing.
- One embodiment of the present invention employs different standard fragment sets in neighboring lanes (at least two alternating) or staggered loading. Using this approach, the number of lanes that can be resolved on a single gel can increase dramatically.
- lane tracking typically has little relevance to capillary systems
- differential standards do have implications for template/reaction set tracking.
- Basic template labeling can greatly facilitate large-scale directed or double-end sequencing strategies by eliminating results mislabeling. This, in turn, reduces the demand on down-stream assembly programs, further reducing the amount of sequences to be done before a project has value. It also provides for more assurance in screening, diagnostic and forensic applications where clone identification is critical.
- a set of 5th dye-labeled sizing fragments can provide for a complete 32 bit (or more) bar coding of all template samples.
- microtiter plates are manufactured with bar codes pre-added to the wells. Such bar codes can help assure unique sample identification, even between different labs..This could be particularly useful in the maintenance of clinical samples.
- sample tagging can find use in physical mapping samples, as well.
- addition of a tag at the earlier template level can facilitate coordination of clone fingerprinting with subsequent sequencing (mapped-low pass sequencing strategies).
- sample ID is probably even harder for the subclone mapping projects (they need a high throughput as well as a highly automatable method for tracing which subclones to pick to sequence).
- the integrated sizing standards described herein can provide the same enhancement for sizing as the current GeneScan® (Applied Biosystems; Foster City, CA) methods do, but provide greater throughput (samples/lane).
- the ability to better understand a signal can be just as useful for any sizing process, particularly the messier peak data of STR mapping and Type IIs enzymatic mapping of larger clones.
- Preferred software for use with the present invention, is adapted to use essentially any new internal standard included.
- the software is preferably configured to take as run-time parameters, the color to look for, the fragment pattern to look for, the sizes to associate with the pattern, peak-shape transformation functions and any composition-specific normalization factors (discussed below).
- the registration of the standard has another implication, as well. It can be used to better estimate the first base position of the sample. Not only does this allow for more accurate and longer early reads, it facilitates better identification of leading vector or tag sequence for elimination, classification, etc.
- the four dyes conventionally used for sequencing represent a compromise between the requirements for a convenient excitation frequency (usually a common frequency for all dyes unless multiple light sources or a non-laser source is used), enough separation in their emission frequencies, signal strength, similar size/mobility profiles, enzyme compatibility, sequence-specific dye interactions (affecting mobility differences) and manufacturability. While any new 5th dyes are not excused from all of these concerns, their requirements are not, in general, quite as restrictive.
- the emission frequency is preferably well removed from sequencing dyes. While this is preferable for the sequencing dyes as well, the 5th dye is not constrained to be mobility matched. Therefore, the choice can emphasize this separation. This can be particularly important, in fact, to maintain the best noise profile in the total signal. Relative mobility has to be only reasonably similar (can be off by multiple bases). It is only important that the shifts are consistent and predictable.
- Desirable characteristics of the molecule to be labeled with the 5th dye reagent depend at least in part on the intended use of the labeled set.
- two primary characteristics of the molecule to be labeled are to produce consistent results and to maintain typical peak behavior - shape is preferably about the same as a similarly sized sequence fragment - while allowing the fewest molecules to be loaded. While certain embodiments contemplate that it is easier, at least initially, to label a nested set of DNA fragments, there is no inherent limitation on the molecule(s) used. Lane and sample tracking, for example, have no real shape or size requirements, just a consistent banding.
- the present invention contemplates the use of a sixth (or more), as long as the spectral resolution is provided.
- Signal analysis and sample tracking do not have to be a combined function.
- the fragment can be labeled with multiple dyes if signal is improved without compromising mobility consistency.
- the peak shape does not have to be identical to a similar-sized sample fragment as long as it can be predictably mapped into what one of that size would look like. This ability to map between peak shapes can be useful for extrapolating confidence value metrics to new protocols without having to run a lot of calibrating sequences.
- DNA-based ladders contemplated by the present invention, may include one or more of the following properties:
- any of the above can provide a set of DNA fragments of known, representative sizes that can be readily labeled. It is not critical that the size differences between the rungs of the ladder be consistent (the same). In fact, some inconsistency can be useful for registering the fragment data with the sizing information provided to the base caller. However, the consistency of a ladder made up of increments of the same sequence can be attractive (the ligated ladder model). Since sequences of the same length and even the same labeling can migrate slightly differently due to sequence-specific mobility issues (a pyrimidine-rich sequence will tend to migrate faster than a purine-rich sequence), the sequence of the increments can be chosen to reflect an "average" sequence. A compensation factor can be included in the base caller when estimating the number of bases between two standard points depending on the estimated base composition in that region relative to the standard fragment. The standard sequence is preferably designed to avoid or minimize secondary structure problems that lead to anomalous and unpredictable local fragment mobility.
- Labeling techniques employable with the present invention can be, for example, some form of single base extension with dye-labeled terminators, the use of labeled primers in amplification schemes or the direct incorporation of labeled end fragments in any ligation method.
- the particular method chosen will reflect a balance between the ease of labeling, the ease of fragment generation and the implication the different labeling (terminator or primer) has for peak shape modeling.
- the labeled standard molecules are designed and/or selected to provide a directly analogous mobility curve to the fragments being sized.
- Various embodiments achieve the best signal model by utilizing labeling that is similar to the actual sequencing or sizing reaction labeling. For example, much of sequencing is done with labeled terminators.
- Standard fragments, according to the present invention can be labeled the same way. This can be complicated by the nature of sequence-specific interactions of the label with the sample; labeled primers all have the same local sequence next to the dye while terminator labels are usually next to different local sequences.
- the standard DNA fragments can be designed to have the same local end sequence to minimize this problem (e.g., a ligated ladder model, or clone made from a ligated ladder or a custom-designed, mostly random sequence with short, common elements adjacent to the base to be labeled to be used in dideoxy sequencing reactions).
- a ligated ladder model or clone made from a ligated ladder or a custom-designed, mostly random sequence with short, common elements adjacent to the base to be labeled to be used in dideoxy sequencing reactions.
- the standard is loaded as possible in order to decrease costs as well as not decrease resolution because of loading volume and overload distortions, but enough is loaded to provide representative peak characteristics.
- the actual peak sizes of the standard can be significantly less than the sequencing peaks, even more so as the spectral separation improves, because the base caller can know what to look for and basically where to look. Therefore, in many instances as little as one tenth the molar quantity of a regular sequence reaction load will suffice, and in some cases less. It is noted that, as users dilute reaction mixtures, absolute signal may become a problem, requiring more standard to be included.
- the ladder molecules do not have to precisely reflect the mobility offsets of the normal dye/sequence fragment sets (it is the relative difference between fragments not the absolute size of the fragments that is important), multi-labeled fragments can be used to increase the signal strength so that even less standard can be loaded.
- preferred ladders of the present invention provide fully separated (clear base line) peaks over their length range, while having no more than is required to provide sufficient separation of the 5th dye-labeled fragments for the generation of mobility (migration vs. gel run-time) profile per lane.
- Such ladders can be experimentally determined.
- a ladder on the order of 10-50 e.g., 16, 18 or 20
- the ladder does not have to be regular, i.e., the first few hundred bases or so may have a density of every 50 bases while the later sizes might be closer to 10. Also, even if the ladder is more or less regular, the differences between marker peaks positions do not have to be exactly the same, just known precisely.
- Some irregularity in fact, can prove useful when registering the data to some absolute size standard. Also, having more fragments does not mean each has to be used. For example, a moving average can be calculated by using overlapping sets of two interval markers. A selection can be made from the standard that best meets the current experimental needs.
- One embodiment provides that it is preferred to maximize the density of the ladder (given loading and manufacturability requirements) so that moving averages can be used. Both a longer and shorter interval can be applied when calculating the estimated number of bases to be looked for in a region. For example, this could involve using a ten base ladder to provide both a ten base distance and a 50 base difference to get a best "average" spacing curve for the unknown data. This would be useful, for example, when the interval sequences of the standard were different.
- the standard dye employed is selected to provide for the greatest discrimination between the emission signals of the sequencing dyes and itself. This can be useful, for example, to provide for the best ID of its signal, as well as to reduce the noise inherent in the multi-component analysis. It can also provide a tool for better characterization of what the true signal properties and base line are.
- the signal is preferably great enough to provide peak shapes representative of true sample signal.
- the standards run under different experimental conditions can also provide a calibration (learning) model for new, untested conditions. Calibration models derived from one or more independent experiments could be extracted and used to provide models for similar experiments even without the 5th dye being included with these new experiments.
- 5th dye peaks do not have to give precisely the same peak shapes as sequencing fragments. However, they are preferably consistent enough to make an appropriate extrapolation. Being able to do this transformation, also provides a method to predict the expected experimental peak shape using 5th dye peak data run under novel conditions that have not yet been trained for. This could be done dynamically (during the same "run") or a utility and process could be provided to extract data from a known sequence (a T reaction of a vector sequence, for example) run with a new protocol and map a shape-reference model to the internal standard for use in real experiments run under that protocol.
- the software can use gel-wide information (i.e., include data from other lanes/gel regions separate from that of the individual lane being interpreted) when determining the migration profile of a particular lane, only some number of lanes are required to include this ladder.
- An interpolation can provide "virtual" standard profiles for the intervening lanes.
- a single complete set of sizing markers is divided into three subsets (divided in a way that no two consecutive sizes are in the same set) and the full gel analysis described above is used.
- every three lanes in this embodiment, provide all the size ranges for the lanes in their neighborhood and still provide lane-specific patterns to support tracking.
- the tracking/calling software can recognize "missing" lanes (i.e., where the loading failed), maintaining correct lane-to-sample correspondence.
- the labeled molecule is not necessarily DNA. It can be any molecule that migrates within an appropriate size range on the gel and is relatively easily labeled. Depending on when it is added, it is also preferably friendly to and not harmed by the reaction conditions.
- a preferred model in one embodiment, is that of a typical bar code (in fact, standard bar code coding schemes can be employed). In one embodiment, at least 16 bits, and more preferably 24-32, are used to provide a large enough sample number.
- the scheme can be binary (present or not present), or complex (e.g., trinary - 0, 1X or 2X intensity).
- the first is simpler and requires no finesse while the second one requires fewer marker components (labeled elements) and less gel length for separation, but potentially a more complicated manufacturing process.
- a starting motif fragment banding pattern
- each tag set so that each can be registered in the correct phase. It is noted that this can increase the number of bands required.
- At least 2-3 base-equivalent separation between size elements (bands) is preferred for base-line separation.
- the total bar code is readable in no more than a 100 base separation range, preferably 50.
- the sample ID is added at the moment a plaque or colony is picked.
- the code accrues information as the processing of the sample proceeds (each step adding some number of bits that codes for that step).
- a complete record of the process is kept by an information management system (LIMS).
- LIMS information management system
- adding the code fragment set at the time of picking may not be optimal as it may be diluted out, not be isolateable with amplified template, and/or impact the amplification. Recognizing this, one embodiment provides the tag attached to a solid support (e.g., bead) that is added to the original plaque pick, which can then physically follow the template through the preparative and sequencing reactions with the appropriate protocol changes.
- the code set can then be clipped from the bead at gel loading time.
- a series of beads with different portions of the final code can be added during the process to track the sample history.
- a series of multiply-labeled beads are pre-made and added in a combinatorial fashion a la hexamer sequencing.
- tag set addition is effected right after amplification. While this may result in loss of some referential integrity to the original pick, the present invention contemplates the use of a tracking program (e.g., linking an automated picker to the amplification device - if one is used) to minimize what is already a relatively minor problem. From this point, any division of the sample for different processing will be covered. The limit here is that the tag should not interfere with the sequencing reaction.
- each sequence reaction set is labeled before loading. This provides unique lane identification as well as referential integrity between a tube or well in the sequencing process and the gel loading process - two of the most significant points of error.
- lane ID is provided by a barcode tag, as described above.
- Certain other, somewhat simpler, embodiments provide only for distinguishing lanes on a single gel (lane ID vs. sample ID).
- One method, as contemplated herein, is similar to the full sample ID embodiments, but requires fewer tagging components (namely, just enough bits to generate a number as large as the potential number of lanes (e.g., 7-8 bits)). Under circumstances where the sample ID is only added to completed sequencing reactions, and not to the template, this simpler method can be nearly as advantageous, except perhaps for those cases where the unused portion of the reaction set is saved for reloading.
- Another potentially simple method for lane ID integrates directly with the sizing/mobility tags.
- a sizing standard is required.
- it can be useful to provide multiple such sizing standards such that adjacent lanes have different (but functionally equivalent) ones. Knowing that these defined markers are different for the length of the lanes can be used directly to keep the tracking in line. At the same time this provides a minimum designation for the lane ID. In the extreme, this embodiment calls for a different standard for every lane.
- standards loaded alternately can provide at least a consistency check for lane designation (e.g., if lane 4 has standard #1 loaded, but the tracking came back thinking lane 5 was lane 4 because reaction 4 did not work, then it would have standard #2 in it and the error would be recognizable).
- This method obviates the need for a bar-code lane tag, but may not be as foolproof (and may not be as flexible in how tagged sequences are loaded on a gel). In one embodiment, it is preferred to combine both methods with only 2 size standards (assuming that template tagging is not employed).
- the software can use gel-wide information when predicting a mobility profile for a particular lane, only some number of lanes have to have this ladder.
- a simple, single-pattern 5th dye calibration standard can be included directly in sequencing chemistry kits. Employing such a kit, users will not be required to mix or add new reagents; the standard will be transparent to users.
- 5th dyes can aid in tracking the status and quality of individual experiments, comparing the results from different experiments, and the analysis of certain aspects of device (e.g., sequencer) performance. These can generally be discussed as quality control/assessment (QC/QA) functions and not only facilitate a more efficient overall experimental/industrial process, but generate the precise experimental descriptions needed for more regulated efforts.
- QC/QA quality control/assessment
- the signal from one lane can bleed into the signal from adjacent lanes.
- this can be the result of poor calibration of the light source and/or the alignment of the capillaries and source/detector elements (e.g., scattered fluorescence from one lane is detected by the detector of another lane).
- this can be exacerbated by actual cross over of fragments between two lanes (poor loading, distorted gel, etc.).
- this signal cross talk can severely reduce the value of a lane. Cross talk is difficult to quantify due to the amount of "normal" signal at the same scan point and color channel. Therefore, it is difficult to distinguish this result from simply a poor sequence reaction.
- the resolving power of a separation matrix under particular conditions will determine how well fragments can be identified as separate from adjacent fragments. Many factors impact this resolution. An ability to calculate the resolving power of a particular process, therefore, can be useful in diagnosing experimental problems as well as predicting how much useful data can be gleaned.
- Resolution of a peak is often determined as the ratio of its distance to an adjacent peak and its width (calculated at half its height). This is sometimes referred as a cross-over plot - when the distance is less than half the width cross-over is achieved and the peaks are not considered isolatable. This is difficult to determine with only four-color sequencing reaction data because the density of bands lead to significant overlapping of peaks further into a run.
- the results of the above analyses can be used to monitor over all system (device plus process) performance. For example, since the amount and nature of the standard being loaded is known for each experiment, experiment-to-experiment (run-to-run) comparisons of signal strength, resolution, cross-over, cross talk and peak shape consistency can be determined on an ongoing basis. This provides a description of changes that might reflect on the chemistry, the manipulative processes (e.g., loading), the matrix used (individual capillary, gel lot, etc.), calibration of the detection device, etc. Appropriate reporting procedures (software, etc.) can be constructed to illustrate these changes and associate them with predictive functions of process performance and/or maintenance intervention requirements.
- Figure 3 illustrates components of an embodiment of instrument system, including electrophoresis and fluorescence detecting instruments, to produce data signals to be analyzed in accordance with the teachings herein. It should be understood that suitable interfaces between the separate components, e.g., to adapt them for the transfer of information between the units, are included in the components, respectively.
- sample 103 and reference 105 polynucleotide solutions are added to the electrophoresis instrument 107 for separation into detectable components.
- the components are detected by fluorescence emitted when excited by an excitation beam; e.g., laser light.
- the fluorescence detection unit 109 produces signals 111, representing the intensity levels of fluorescence for the respective nucleotide bases of the sample and reference sequence, respectively.
- the intensity signals 111 are output to a base calling unit 113, and may also be sent to an output or storage device 117, such as a display device (monitor), a printer or disk drive.
- the base calling unit 113 interprets the intensity signals 111 and provides output corresponding to sequences of nucleotide bases 121. It should be appreciated that the base calling unit 113 may specifically label one or more positions in a sequence that are not determined with sufficiently high confidence.
- FIG. 4 is a block diagram that illustrates a computer system 500, according to certain embodiments, upon which embodiments of the present teachings may be implemented.
- Computer system 500 includes a bus 502 or other communication mechanism for communicating information, and a processor 504 coupled with bus 502 for processing information.
- Computer system 500 also includes a memory 506, which can be a random access memory (RAM) or other dynamic storage device, coupled to bus 502 for determining base calls, and instructions to be executed by processor 504.
- Memory 506 also may be used for storing temporary variables or other intermediate information during execution of instructions to be executed by processor 504.
- Computer system 500 further includes a read only memory (ROM) 508 or other static storage device coupled to bus 502 for storing static information and instructions for processor 504.
- ROM read only memory
- a storage device 510 such as a magnetic disk or optical disk, is provided and coupled to bus 502 for storing information and instructions.
- Computer system 500 may be coupled via bus 502 to a display 512, such as a cathode ray tube (CRT) or liquid crystal display (LCD), for displaying information to a computer user.
- a display 512 such as a cathode ray tube (CRT) or liquid crystal display (LCD)
- An input device 514 is coupled to bus 502 for communicating information and command selections to processor 504.
- cursor control 516 is Another type of user input device, such as a mouse, a trackball or cursor direction keys for communicating direction information and command selections to processor 504 and for controlling cursor movement on display 512.
- This input device typically has two degrees of freedom in two axes, a first axis (e.g., x) and a second axis (e.g., y), that allows the device to specify positions in a plane.
- a base call is provided by computer system 500 in response to processor 504 executing one or more sequences of one or more instructions contained in memory 506. Such instructions may be read into memory 506 from another computer-readable medium, such as storage device 510. Execution of the sequences of instructions contained in memory 506 causes processor 504 to perform the process states described herein. Alternatively hard-wired circuitry may be used in place of or in combination with software instructions to implement the present teachings. Thus implementations of the present teachings are not limited to any specific combination of hardware circuitry and software.
- Non-volatile media includes, for example, optical or magnetic disks, such as storage device 510 .
- Volatile media includes dynamic memory, such as memory 506.
- Transmission media includes coaxial cables, copper wire, and fiber optics, including the wires that comprise bus 502. Transmission media can also take the form of acoustic or light waves, such as those generated during radio-wave and infra-red data communications.
- Computer-readable media include, for example, a floppy disk, a flexible disk, hard disk, magnetic tape, or any other magnetic medium, a CD-ROM, any other optical medium, punch cards, papertape, any other physical medium with patterns of holes, a RAM, PROM, and EPROM, a FLASH-EPROM, any other memory chip or cartridge, a carrier wave as described hereinafter, or any other medium from which a computer can read.
- Various forms of computer readable media may be involved in carrying one or more sequences of one or more instructions to processor 504 for execution.
- the instructions may initially be carried on magnetic disk of a remote computer.
- the remote computer can load the instructions into its dynamic memory and send the instructions over a telephone line using a modem.
- a modem local to computer system 500 can receive the data on the telephone line and use an infra-red transmitter to convert the data to an infra-red signal.
- An infra-red detector coupled to bus 502 can receive the data carried in the infra-red signal and place the data on bus 502.
- Bus 502 carries the data to memory 506, from which processor 504 retrieves and executes the instructions.
- the instructions received by memory 506 may optionally be stored on storage device 510 either before or after execution by processor 504.
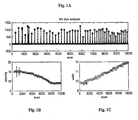
- Figure 1 is an electropherogram representing data from a simulated 5th-dye run.
- the x-axis is scan number, and the y-axis is fluorescent amplitude, in arbitrary units. Each scan is approximately 1 second in duration.
- Most of the peaks are equally spaced, i.e., they occur at each 18 bases.
- a mobility similar to 3700 POP5 data (Applied Biosystems; Foster City, CA) was used to simulate realistic scan spacing.
- a few of the peaks deviate from the regular 18-base spacing.
- Such patterned peaks are used to provide absolute calibration of the start position, i.e., base 1.
- regularly spaced peaks are identified by open (red) circles, whereas patterned peaks are identified with closed (green) circles.
- Figure 1B represents the spacing peak-to-peak as a function of scan number. The spacing is also reported in scan number.
- the curve of Figure 1C represents the width of each peak, in scan number, as a function of scan number. The width can be measured as the full width at half the peak's maximum height (FWHM).
- the width curve ( Figure 1 C) can be used to improve deconvolution techniques.
- Several techniques such as Wiener and Maximum Entropy, perform Fourier transforms on a window in which the peak width is relatively constant. By reinterpolating the scan axis to achieve a constant width, the Fourier window can be the entire data set. This will lead to significantly improved execution time and eliminate the need to stitch deconvolved windows together.
- Figure 2 provides a flowchart showing steps contemplated by an embodiment of the present invention.
- Peak detection can be achieved through a number of techniques known in the art. For example, peak detection can be achieved via identification of local maxima in the discretely sampled EP data.
- An embodiment of the present invention makes use of an algorithm that involves Savitsky-Golay smoothing. Any of a variety of techniques for estimation of peak characteristics can be employed in practicing the present invention. Characteristics of interest include: position (scan), and shape (e.g., height, width). Savitsky-Golay smoothing can also be used toward these ends.
- Peak discrimination can also be achieved in a variety of ways.
- the Euclidean distances in height-width space of peaks from some reference point are sorted and differenced to determine a boundary that separates peaks to be ignored from those to be considered for subsequent analysis.
- RatioMatcher a dynamic programming algorithm designed for such a task (see US Provisional Patent Application Serial No. 60/219,697 ; incorporated herein by reference).
- RatioMatcher may in some circumstances be more computationally intensive than desired.
- RatioMatcher can be used on a subset of the data and then that result can be used as a starting point for a simpler algorithm that exploits specific characteristics of the 5 th -dye data (e.g., well resolved, nearly equally-spaced peaks).
- results of the analysis of the 5 th -dye data aid the processing and analysis of the primary 4 dye signals and the classification of peaks (i.e., calling bases).
- Advantages include:
- Mobility shift calibrations depend on the location of a reference point, usually called "base 1". Estimation of this reference point will be improved by the size-scan map provided by the 5 th -dye signal analysis.
- a ladder is designed and constructed to contain a 5 th dye-labeled fragment every 10 to 20 bases from base ⁇ 20 to base ⁇ 1200-1500 (i.e., at least 60 fragments).
- An additional 2-3 peaks can be designed to occur near the beginning for base 1 estimation.
- the ladder sequence in this embodiment, exhibits generally "normal" migration (e.g., by having fairly equal representation of all 4 bases), and does not exhibit substantial mobility irregularities when run under standard conditions.
- the ladder can be comprised of, for example, of a repeating internal unit, so between peaks there will be a constant number of bases of the same sequence.
- the ladder can be generated, for example, from a single-base sequencing reaction.
- the template includes additional peaks, but contains isolated peaks (by at least ⁇ 5 bases) every ⁇ 20 or so bases. Ideally it comprises the repeating unit described above.
- product (a) a set of nucleic acid sequences that are synthesized (and ligated), and (b) a set of nucleic acid sequences that are synthesized and cloned.
- Product (a) is comprised of (5' end labeled) 5 th dye-labeled fragments of varying sizes, which will generate a 5 th dye ladder when run, for example, on a 3700 or 3100 DNA Analyzer (Applied Biosystems; Foster City, CA).
- Product (b) is a clone which may be used to generate a (3' end labeled) 5 th dye ladder when sequenced with a 5 th dye-labeled dideoxy terminator, using, for example, the -21M13 universal primer.
- the 5 th dye ladder can be run with sequencing samples, for example, on ABI DNA Analyzer instruments.
- the ladder can range in size, for example, from 18 or 19 to >7200 bases, with one 5 th dye labeled fragment every 10 to 50 bases (e.g., every 12 or 18 bases, or so).
- An internal calibration standard is generated comprising a sequence having three bases (e.g., any three of G, C, A, T) incorporated randomly along the length of the sequence and a fourth base (e.g., the fourth of G, C, A, T) is incorporated at (and only at) regularly spaced intervals along the length of the sequence, e.g., every 10th base position.
- the fourth base is labeled with a unique fluorescent label using standard sequencing reactions.
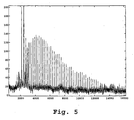
- This example relates to a 5th-dye ladder constructed in a fashion like that described above in connection with Product (b) of Example 4.
- FIG. 5 is a plot showing only the G trace from the sequencing data. The axes on the plot as shown have been clipped a bit to zoom in on the more pertinent and useful part.
- This example relates to sample injection/loading monitoring.
- a method for calibrating an apparatus for the analysis of polynucleotides comprising:
- said characteristic of peak shape includes one or more of (a) peak height, (b) peak width, and (c) peak area.
- nucleotide sequence of said analyte polynucleotide fragments is determined, further comprising the step of:
- steps (i) through (v) are carried out substantially simultaneously in each of a plurality of separation channels.
- a method for dynamic calibration in polynucleotide sequence analysis comprising:
- said plurality of signals includes at least five different signals.
- a program storage device readable by a machine, embodying a program of instructions executable by the machine to perform method steps for dynamic calibration in polynucleotide sequence analysis, said method steps comprising:
- steps (i) through (iv) are repeated for a further sample, whereby a further calibration value is generated for use in lieu of the previously employed calibration value.
- step (iii) includes locating peaks in said first component signal profile and determining one or more of (a) peak height, (b) peak width, (c) peak area, and (d) peak-to-peak spacing.
- a method for analysis of polynucleotides comprising:
- a program storage device readable by a machine, embodying a program of instructions executable by the machine to perform method steps for polynucleotide sequence analysis, said method steps comprising:
- a calibration method for polynucleotide analysis comprising:
- said method further comprises estimating a scan or time point at which a peak corresponding to a first base of said polynucleotide of unknown sequence is likely occur.
- said method further comprises determining at least one characteristic of said peaks determined in (iv).
- said at least one characteristic is selected from the group consisting of (a) peak height, (b) peak width, (c) peak area, (d) peak-to-peak spacing, and (e) any combination of (a)-(d).
- said method further comprises employing said at least one characteristic in determining one or more additional component signal intensity profiles corresponding to the polynucleotides of unknown sequence.
- said method further comprises making base calls based upon said one or more additional component signal intensity profiles.
- a program storage device readable by a machine, embodying a program of instructions executable by the machine to perform method steps for polynucleotide sequence analysis, said method steps comprising: (i) receiving a composite signal intensity profile comprised of a plurality of component signal intensity profiles, said component signal intensity profiles representing nucleotide bases in a mixture comprising fluorescently labeled polynucleotides of unknown nucleotide sequence and fluorescently labeled reference polynucleotides; each of said signal intensity profiles representing fluorescence emission intensity detected at sequential discrete scan or time points; (ii) receiving a size definition containing the sizes, in bases, for the reference polynucleotides; (iii) determining a first component signal intensity profile representing the reference polynucleotides; (iv) determining peaks in the first component signal intensity profile; (v) correlating said peaks determined in (iv) to respective sizes in said size definition; and (vi) correlating sizes in said size definition to respective scan or time points
- said method steps further comprise: estimating a scan or time point at which a peak corresponding to a first base of said polynucleotide of unknown sequence is likely occur.
- said method steps further comprise: determining at least one characteristic of said peaks determined in (iv).
- said method steps further comprise: employing said at least one characteristic in determining one or more additional component signal intensity profiles representing the polynucleotides of unknown sequence.
- said method steps further comprise: making base calls for the polynucleotides of unknown sequence.
- polynucleotide mixture for use as internal calibration standard with polynucleotide samples for sequence analysis, comprising:
- said first and second sets of polynucleotides comprise substantially all of the total polynucleotide content of said mixture.
- said first set of polynucleotides includes a fragment that is shorter than said short polynucleotide; and wherein said constant is an integer that is equal to the length, in bases, of said shorter fragment.
- a polynucleotide sample for sequence analysis comprising one or more fluorescently labeled polynucleotides of unknown sequence, mixed with the polynucleotide mixture disclosed above; wherein the fluorescent labels of said first and second sets of polynucleotides are spectrally distinct from the fluorescent labels of said polynucleotide sample for sequence analysis.
- polynucleotide mixture for use as internal calibration standard with polynucleotide samples for sequence analysis, comprising:
- polynucleotides of said first and second sets bear the same fluorescent label.
- a method for determining errors in a polynucleotide analysis comprising:
- step (vi) further comprises comparing at least one trace for each of said sample mixtures to at least one trace corresponding to at least one other of said sample mixtures.
- step (vi) is further based at least in part upon the comparison of step (vi), if an error is determined to have occurred, determining the step in which it occurred.
- said step of determining the step in which a determined error has occurred comprises utilization of a logic comprising at least one of the decisions:
- said selected thresholds are determined, at least in part, by comparing at least one trace for at least one of said sample mixtures to at least one trace corresponding to at least one other of said sample mixtures.
- said logic further comprises the decision: if one of (a) the first, second, third, or fourth labels and (b) the fifth label is detected at a level above at least one selected threshold, but the other of (a) and (b) is not detected or is detected at a level below at least one other selected threshold, then an error is deemed to have occurred in said combining step.
- said logic further comprises the decision: if both (a) the first, second, third, or fourth labels and (b) the fifth label are detected at levels above at least one selected threshold, but are temporally delayed as compared to such traces for at least one of the other sample mixtures, then an error is deemed to have occurred involving the lane or loading region of a respective lane or sample purity.
- a method for determining signal cross talk in a polynucleotide analysis using a multi-lane electrophoresis instrument comprising:
- the cross talk is determined as a ratio comprising x/y, wherein y is the fifth-label signal in a selected sample lane and x is the fifth-label signal in an adjacent lane.
- the cross talk value is determined independent of the first, second, third and fourth label signals.
- Disclosed is a method for determining resolution in a polynucleotide analysis using an electrophoresis apparatus, comprising:
- a method for normalization between polynucleotide-analysis experiments using one or more electrophoresis apparatus comprising: (A) conducting an experiment comprising:
- said method further comprises: (B) conducting a second experiment, comprising steps (A) (i)- (iii) using a second sequencing-reaction sample; whereby a second ratio of first label-set signal to fifth-dye signal is calculated; and using the ratios from (A) and (B), determining a relative quantity of sequencing- reaction sample between said experiments.
- said electrophoresis apparatus is a multi-lane electrophoresis instrument, and said experiments are carried out substantially simultaneously in different lanes of said instrument.
- experiment of (A) is carried out on one electrophoresis instrument and the experiment of (B) is carried out on a second electrophoresis instrument.
Landscapes
- Health & Medical Sciences (AREA)
- Life Sciences & Earth Sciences (AREA)
- Chemical & Material Sciences (AREA)
- Physics & Mathematics (AREA)
- Molecular Biology (AREA)
- Analytical Chemistry (AREA)
- Chemical Kinetics & Catalysis (AREA)
- Electrochemistry (AREA)
- Spectroscopy & Molecular Physics (AREA)
- Biochemistry (AREA)
- General Health & Medical Sciences (AREA)
- General Physics & Mathematics (AREA)
- Immunology (AREA)
- Pathology (AREA)
- Measuring Or Testing Involving Enzymes Or Micro-Organisms (AREA)
- Investigating Or Analysing Biological Materials (AREA)
- Investigating, Analyzing Materials By Fluorescence Or Luminescence (AREA)
- Apparatus Associated With Microorganisms And Enzymes (AREA)
Applications Claiming Priority (2)
| Application Number | Priority Date | Filing Date | Title |
|---|---|---|---|
| US30493401P | 2001-07-11 | 2001-07-11 | |
| EP02753373A EP1404878A4 (de) | 2001-07-11 | 2002-07-11 | Interne kalibrierungsstandards für elektrophoretische analysen |
Related Parent Applications (1)
| Application Number | Title | Priority Date | Filing Date |
|---|---|---|---|
| EP02753373.6 Division | 2002-07-11 |
Publications (1)
| Publication Number | Publication Date |
|---|---|
| EP2184369A1 true EP2184369A1 (de) | 2010-05-12 |
Family
ID=23178590
Family Applications (2)
| Application Number | Title | Priority Date | Filing Date |
|---|---|---|---|
| EP10000723A Withdrawn EP2184369A1 (de) | 2001-07-11 | 2002-07-11 | Verfahren zur Normalisierung in der Elektrophorese |
| EP02753373A Withdrawn EP1404878A4 (de) | 2001-07-11 | 2002-07-11 | Interne kalibrierungsstandards für elektrophoretische analysen |
Family Applications After (1)
| Application Number | Title | Priority Date | Filing Date |
|---|---|---|---|
| EP02753373A Withdrawn EP1404878A4 (de) | 2001-07-11 | 2002-07-11 | Interne kalibrierungsstandards für elektrophoretische analysen |
Country Status (5)
| Country | Link |
|---|---|
| US (2) | US7593819B2 (de) |
| EP (2) | EP2184369A1 (de) |
| JP (2) | JP4436672B2 (de) |
| CA (1) | CA2453360A1 (de) |
| WO (1) | WO2003006692A1 (de) |
Families Citing this family (28)
| Publication number | Priority date | Publication date | Assignee | Title |
|---|---|---|---|---|
| EP2184369A1 (de) * | 2001-07-11 | 2010-05-12 | Applied Biosystems, LLC | Verfahren zur Normalisierung in der Elektrophorese |
| GB0419482D0 (en) * | 2004-09-02 | 2004-10-06 | Sec Dep For The Home Departmen | Improvements in and relating to analysis |
| US7647188B2 (en) * | 2004-09-15 | 2010-01-12 | F. Hoffmann-La Roche Ag | Systems and methods for processing nucleic acid chromatograms |
| JP4742712B2 (ja) * | 2005-07-14 | 2011-08-10 | 株式会社島津製作所 | キャピラリー電気泳動方法 |
| WO2007119779A1 (ja) | 2006-04-14 | 2007-10-25 | Nec Corporation | 個体識別方法および装置 |
| US20100117666A1 (en) * | 2006-12-28 | 2010-05-13 | Wada Henry G | Method and System for Internal Standardization of Assays |
| US8871524B2 (en) * | 2009-08-12 | 2014-10-28 | Caliper Life Sciences, Inc. | Methods of performing a sizing analysis using a corrected sizing ladder |
| WO2013067489A1 (en) | 2011-11-05 | 2013-05-10 | President And Fellows Of Harvard College | Nucleic acid-based linkers for detecting and measuring interactions |
| US9005419B2 (en) | 2012-05-29 | 2015-04-14 | Health Diagnostic Laboratory, Inc. | Composition and method for gel electrophoresis with in-situ calibration |
| EP3180724B1 (de) | 2014-08-15 | 2024-05-15 | Life Technologies Corporation | Verfahren und systeme zur erkennung kleiner varianten in einer probe genetischen materials |
| GB201418144D0 (en) * | 2014-10-14 | 2014-11-26 | Univ Cardiff | High throughput sequencing |
| WO2016089588A1 (en) | 2014-12-06 | 2016-06-09 | Children's Medical Center Corporation | Nucleic acid-based linkers for detecting and measuring interactions |
| JP6543347B2 (ja) * | 2015-02-06 | 2019-07-10 | ライフ テクノロジーズ コーポレーション | 光学的関心領域を測定する方法およびシステム |
| SG11201706355YA (en) * | 2015-02-06 | 2017-09-28 | Life Technologies Corp | Methods and systems for pure dye instrument normalization |
| JP6496417B2 (ja) * | 2015-02-06 | 2019-04-03 | ライフ テクノロジーズ コーポレーション | 実験設計および分析のための方法およびシステム |
| WO2016196824A1 (en) | 2015-06-02 | 2016-12-08 | Children's Medical Center Corporation | Nucleic acid complexes for screening barcoded compounds |
| WO2017003950A2 (en) | 2015-06-27 | 2017-01-05 | Children's Medical Center Corporation | Compositions and methods for analyte detection using nanoswitches |
| GB201511508D0 (en) * | 2015-07-01 | 2015-08-12 | Ge Healthcare Bio Sciences Ab | Method for determining a size of biomolecules |
| WO2017079478A1 (en) * | 2015-11-03 | 2017-05-11 | Asuragen, Inc. | Methods for nucleic acid size detection of repeat sequences |
| WO2017139409A1 (en) | 2016-02-09 | 2017-08-17 | Children's Medical Center Corporation | Method for detection of analytes via polymer complexes |
| US12123869B2 (en) | 2016-03-23 | 2024-10-22 | Children's Medical Center Corporation | Rapid and sensitive detection and quantification of analytes in complex samples using polymer-based methods |
| WO2017165585A1 (en) | 2016-03-23 | 2017-09-28 | Children's Medical Center Corporation | Systems and apparatus for detecting compounds in human biological samples |
| AU2017348009B2 (en) * | 2016-10-24 | 2019-10-10 | Ontera Inc. | Fractional abundance of polynucleotide sequences in a sample |
| WO2019100080A1 (en) | 2017-11-20 | 2019-05-23 | Children's Medical Center Corporation | Force-controlled nanoswitch assays for single-molecule detection in complex biological fluids |
| WO2020026418A1 (ja) * | 2018-08-02 | 2020-02-06 | 株式会社日立ハイテクノロジーズ | 生体ポリマー分析方法、および生体ポリマー分析装置 |
| US12571802B2 (en) | 2020-02-29 | 2026-03-10 | President And Fellows Of Harvard College | Nanoswitch caliper trains for high-throughput, high-resolution structural analysis of biomolecules |
| JP2025007748A (ja) * | 2023-07-03 | 2025-01-17 | 株式会社日立製作所 | 遺伝子変異の定量分析方法、定量分析装置、及び定量分析キット |
| CN118737290B (zh) * | 2024-06-13 | 2025-05-02 | 德诺杰亿(北京)生物科技有限公司 | 基因分析仪检测光谱的内标匹配方法、系统及设备 |
Citations (5)
| Publication number | Priority date | Publication date | Assignee | Title |
|---|---|---|---|---|
| US5541067A (en) * | 1994-06-17 | 1996-07-30 | Perlin; Mark W. | Method and system for genotyping |
| US5843680A (en) * | 1992-01-31 | 1998-12-01 | Biometric Imaging, Inc. | Differential separation assay methods and test kits |
| US5871628A (en) * | 1996-08-22 | 1999-02-16 | The University Of Texas System | Automatic sequencer/genotyper having extended spectral response |
| WO2000016087A1 (en) * | 1998-09-16 | 2000-03-23 | The Perkin-Elmer Corporation | Spectral calibration of fluorescent polynucleotide separation apparatus |
| US6251591B1 (en) * | 1997-02-27 | 2001-06-26 | Lorne Park Research, Inc. | Quantitative method for detecting nucleotide concentration |
Family Cites Families (26)
| Publication number | Priority date | Publication date | Assignee | Title |
|---|---|---|---|---|
| US611683A (en) * | 1898-10-04 | Mail-box | ||
| US2280728A (en) * | 1939-11-24 | 1942-04-21 | Rca Corp | Telescoping high frequency electrical conductor |
| US4660151A (en) | 1983-09-19 | 1987-04-21 | Beckman Instruments, Inc. | Multicomponent quantitative analytical method and apparatus |
| US5633129A (en) * | 1989-07-13 | 1997-05-27 | Massachusetts Institute Of Technology | Electrophoretic detection and separation of mutant DNA using replaceable polymer matrices |
| US5119316A (en) | 1990-06-29 | 1992-06-02 | E. I. Du Pont De Nemours And Company | Method for determining dna sequences |
| US5116316A (en) * | 1991-02-25 | 1992-05-26 | Baxter International Inc. | Automatic in-line reconstitution system |
| JP2974495B2 (ja) | 1992-04-24 | 1999-11-10 | 株式会社日立製作所 | 電気泳動装置及び電気泳動方法 |
| US5365455A (en) | 1991-09-20 | 1994-11-15 | Vanderbilt University | Method and apparatus for automatic nucleic acid sequence determination |
| WO1993008297A1 (en) | 1991-10-23 | 1993-04-29 | Baylor College Of Medicine | Fingerprinting bacterial strains using repetitive dna sequence amplification |
| US5916747A (en) | 1995-06-30 | 1999-06-29 | Visible Genetics Inc. | Method and apparatus for alignment of signals for use in DNA based-calling |
| US5748491A (en) | 1995-12-20 | 1998-05-05 | The Perkin-Elmer Corporation | Deconvolution method for the analysis of data resulting from analytical separation processes |
| US5795722A (en) | 1997-03-18 | 1998-08-18 | Visible Genetics Inc. | Method and kit for quantitation and nucleic acid sequencing of nucleic acid analytes in a sample |
| US6208941B1 (en) | 1996-09-16 | 2001-03-27 | University Of Utah Research Foundation | Method and apparatus for analysis of chromatographic migration patterns |
| US6195449B1 (en) | 1997-05-18 | 2001-02-27 | Robert Bogden | Method and apparatus for analyzing data files derived from emission spectra from fluorophore tagged nucleotides |
| SE9702008D0 (sv) | 1997-05-28 | 1997-05-28 | Pharmacia Biotech Ab | A method and a system for nucleic acid seouence analysis |
| US6131072A (en) | 1998-02-03 | 2000-10-10 | Pe Applied Biosystems, A Division Of Perkin-Elmer | Lane tracking system and method |
| WO1999053423A1 (en) | 1998-04-16 | 1999-10-21 | Northeastern University | Expert system for analysis of dna sequencing electropherograms |
| CN1197975C (zh) | 1998-08-19 | 2005-04-20 | 生物风险公司 | 测定多核苷酸序列变异的方法 |
| US6554985B2 (en) | 1998-11-10 | 2003-04-29 | Curagen Corporation | Methods and formulations for the separation of biological macromolecules |
| US6110683A (en) | 1999-01-08 | 2000-08-29 | Commonwealth Biotechnologies, Inc. | Automated DNA Sequencer loading dye which contains a lane tracking aid |
| US7655443B1 (en) | 1999-05-07 | 2010-02-02 | Siemens Healthcare Diagnostics, Inc. | Nucleic acid sequencing with simultaneous quantitation |
| IL147915A0 (en) | 1999-08-05 | 2002-08-14 | Takeda Chemical Industries Ltd | Method of recording gene analysis data |
| DE59910473D1 (de) * | 1999-12-16 | 2004-10-14 | Siemens Ag | Verfahren und vorrichtung zum bestimmen des absolutdrehwinkels eines sich um eine etwa waagerechte drehachse drehenden gegenstandes |
| US6397150B1 (en) * | 2000-07-27 | 2002-05-28 | Visible Genetics Inc. | Method and apparatus for sequencing of DNA using an internal calibrant |
| US6681186B1 (en) * | 2000-09-08 | 2004-01-20 | Paracel, Inc. | System and method for improving the accuracy of DNA sequencing and error probability estimation through application of a mathematical model to the analysis of electropherograms |
| EP2184369A1 (de) | 2001-07-11 | 2010-05-12 | Applied Biosystems, LLC | Verfahren zur Normalisierung in der Elektrophorese |
-
2002
- 2002-07-11 EP EP10000723A patent/EP2184369A1/de not_active Withdrawn
- 2002-07-11 US US10/193,776 patent/US7593819B2/en not_active Expired - Lifetime
- 2002-07-11 WO PCT/US2002/022147 patent/WO2003006692A1/en not_active Ceased
- 2002-07-11 EP EP02753373A patent/EP1404878A4/de not_active Withdrawn
- 2002-07-11 CA CA002453360A patent/CA2453360A1/en not_active Abandoned
- 2002-07-11 JP JP2003512449A patent/JP4436672B2/ja not_active Expired - Fee Related
-
2007
- 2007-08-21 JP JP2007215327A patent/JP2008005850A/ja not_active Withdrawn
-
2009
- 2009-09-17 US US12/562,070 patent/US8268558B2/en not_active Expired - Fee Related
Patent Citations (5)
| Publication number | Priority date | Publication date | Assignee | Title |
|---|---|---|---|---|
| US5843680A (en) * | 1992-01-31 | 1998-12-01 | Biometric Imaging, Inc. | Differential separation assay methods and test kits |
| US5541067A (en) * | 1994-06-17 | 1996-07-30 | Perlin; Mark W. | Method and system for genotyping |
| US5871628A (en) * | 1996-08-22 | 1999-02-16 | The University Of Texas System | Automatic sequencer/genotyper having extended spectral response |
| US6251591B1 (en) * | 1997-02-27 | 2001-06-26 | Lorne Park Research, Inc. | Quantitative method for detecting nucleotide concentration |
| WO2000016087A1 (en) * | 1998-09-16 | 2000-03-23 | The Perkin-Elmer Corporation | Spectral calibration of fluorescent polynucleotide separation apparatus |
Non-Patent Citations (4)
| Title |
|---|
| HUNKAPILLER, T. ET AL., SCIENCE, vol. 254, no. 5028, 1991, pages 59 - 67 |
| N.S. WANG; P.J.B. RINAUDO; T.J. MCAVOY: "Computer-Enhanced Analysis of Multicomponent Fluorescence Spectra", FOURTH INTERNATIONAL CONGRESS ON COMPUTER APPLICATIONS IN FERMENTATION TECHNOLOGY: MODELLING AND CONTROL OF BIOTECHNICAL PROCESSES, 25 September 1988 (1988-09-25) |
| R.G. LYONS: "Understanding Digital Signal Processing", 1997, ADDISON-WESLEY |
| SEE-KIONG NG: "Automating Computational Molecular Genetics: Solving theMicrosatellite Genotyping Problem", SCHOOL OF COMPUTER SCIENCE, CARNEGIE MELLON UNIVERSITY, PITTSBURGH, PA, 23 January 1998 (1998-01-23) |
Also Published As
| Publication number | Publication date |
|---|---|
| JP2004535198A (ja) | 2004-11-25 |
| JP4436672B2 (ja) | 2010-03-24 |
| JP2008005850A (ja) | 2008-01-17 |
| US8268558B2 (en) | 2012-09-18 |
| US20030032042A1 (en) | 2003-02-13 |
| WO2003006692A1 (en) | 2003-01-23 |
| CA2453360A1 (en) | 2003-01-23 |
| EP1404878A1 (de) | 2004-04-07 |
| US20100206730A1 (en) | 2010-08-19 |
| EP1404878A4 (de) | 2006-12-06 |
| US7593819B2 (en) | 2009-09-22 |
Similar Documents
| Publication | Publication Date | Title |
|---|---|---|
| US8268558B2 (en) | Internal calibration standards for electrophoretic analyses | |
| US6074831A (en) | Partitioning of polymorphic DNAs | |
| US10991453B2 (en) | Alignment of nucleic acid sequences containing homopolymers based on signal values measured for nucleotide incorporations | |
| US6991712B2 (en) | Spectral calibration of fluorescent polynucleotide separation apparatus | |
| US8965711B2 (en) | Method and system for determining the accuracy of DNA base identifications | |
| US7406385B2 (en) | System and method for consensus-calling with per-base quality values for sample assemblies | |
| EP1070142B1 (de) | Methode zur verwendung einer qualitätsmasszahl zur feststellung der qualität von biochemischen auftrennungen | |
| US9150909B2 (en) | Determination of the integrity of RNA | |
| US20020090630A1 (en) | Method of sequence determination for nucleic acid | |
| JP2002505442A5 (de) | ||
| AU2002313667B2 (en) | Internal calibration standards for electrophoretic analyses | |
| AU2002313667A1 (en) | Internal calibration standards for electrophoretic analyses | |
| AU2007202396A1 (en) | Internal calibration standards for electrophoretic analyses | |
| AU2011253591A1 (en) | Internal calibration standards for electrophoretic analyses | |
| US20100070189A1 (en) | Method for assessing degree of reliability of nucleic acid base sequence | |
| AU763102B2 (en) | Spectral calibration of fluorescent polynucleotide separation apparatus | |
| JP2004177290A (ja) | 遺伝子解析データの処理方法 | |
| US6406854B1 (en) | Method and compositions for evaluating resolution of nucleic acid separation systems | |
| JPH0580054A (ja) | 塩基配列決定方法及びその装置 |
Legal Events
| Date | Code | Title | Description |
|---|---|---|---|
| PUAI | Public reference made under article 153(3) epc to a published international application that has entered the european phase |
Free format text: ORIGINAL CODE: 0009012 |
|
| AC | Divisional application: reference to earlier application |
Ref document number: 1404878 Country of ref document: EP Kind code of ref document: P |
|
| AK | Designated contracting states |
Kind code of ref document: A1 Designated state(s): AT BE BG CH CY CZ DE DK EE ES FI FR GB GR IE IT LI LU MC NL PT SE SK TR |
|
| 17P | Request for examination filed |
Effective date: 20101112 |
|
| 17Q | First examination report despatched |
Effective date: 20110325 |
|
| STAA | Information on the status of an ep patent application or granted ep patent |
Free format text: STATUS: THE APPLICATION IS DEEMED TO BE WITHDRAWN |
|
| 18D | Application deemed to be withdrawn |
Effective date: 20111005 |