EP2192414A1 - Détection de forme d'onde sinusoïdale du bruit - Google Patents
Détection de forme d'onde sinusoïdale du bruit Download PDFInfo
- Publication number
- EP2192414A1 EP2192414A1 EP08170389A EP08170389A EP2192414A1 EP 2192414 A1 EP2192414 A1 EP 2192414A1 EP 08170389 A EP08170389 A EP 08170389A EP 08170389 A EP08170389 A EP 08170389A EP 2192414 A1 EP2192414 A1 EP 2192414A1
- Authority
- EP
- European Patent Office
- Prior art keywords
- noise
- signal
- received signal
- processing
- value
- Prior art date
- Legal status (The legal status is an assumption and is not a legal conclusion. Google has not performed a legal analysis and makes no representation as to the accuracy of the status listed.)
- Withdrawn
Links
Images








Classifications
-
- G—PHYSICS
- G01—MEASURING; TESTING
- G01R—MEASURING ELECTRIC VARIABLES; MEASURING MAGNETIC VARIABLES
- G01R19/00—Arrangements for measuring currents or voltages or for indicating presence or sign thereof
- G01R19/25—Arrangements for measuring currents or voltages or for indicating presence or sign thereof using digital measurement techniques
- G01R19/2506—Arrangements for conditioning or analysing measured signals, e.g. for indicating peak values ; Details concerning sampling, digitizing or waveform capturing
-
- H—ELECTRICITY
- H03—ELECTRONIC CIRCUITRY
- H03H—IMPEDANCE NETWORKS, e.g. RESONANT CIRCUITS; RESONATORS
- H03H17/00—Networks using digital techniques
- H03H17/02—Frequency selective networks
- H03H17/0248—Filters characterised by a particular frequency response or filtering method
- H03H17/0254—Matched filters
Definitions
- This invention relates to signal processing for detecting a signal having the form of a sine wave or its segment in the presence of noise and other interference.
- the invention is especially, but not exclusively, applicable to systems intended to detect a weak sinusoidal waveform in non-Gaussian noise of impulsive nature.
- a physical system or phenomenon under examination may manifest its presence by producing a sinusoidal electromagnetic or ultrasonic signal.
- An observed signal may originate from the system itself, when the system acts as a signal source, such as a radio transmitter.
- an observed signal may be obtained in response to some form of excitation, e.g., when, in a non-destructive testing, a suitable probing signal is scattered by a sample under investigation.
- obstacle detection may be achieved by sending suitable electromagnetic or ultrasonic signals and determining the time-of-arrival of reflected echoes in the presence of noise and other interference.
- a segment of a received signal under examination comprises either a sinusoidal waveform corrupted by noise, or noise alone.
- the nominal centre frequency of the waveform may be the carrier frequency itself, or it may be some suitably chosen intermediate frequency obtained by a down-conversion process.
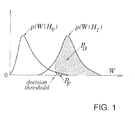
- Fig. 1 depicts two probability density functions of an observable W under the two hypotheses. As seen, a larger value of the decision threshold will result in reducing both the probability of false alarm P F and the probability of detection P D ,
- a good system for detecting a sine wave with known frequency f 0 but unknown initial phase ⁇ is a so-called quadrature receiver QRV shown in a block form in Fig. 2 .
- the receiver comprises the following blocks
- the receiver operates as follows.
- An input signal IS is applied in parallel to two mixers, MXI and MXQ.
- the other inputs of the mixers are driven by sinusoidal and co-sinusoidal waveforms supplied by a local oscillator.
- the outputs, PI and PQ, of the respective mixers are filtered in the low-pass filters LPI and LPQ to produce two output signals LI and LQ. Those two signals are first converted to suitable forms, MI and MQ, in two signal conditioning units, EDI and EDQ. Then, the 'Pythagoras circuit' PYT is employed to produce a signal ES being a representation of the quantity LI 2 + LQ 2 .
- the decision block DBK compares the value ES to a decision threshold DT. Then, when the threshold has been exceeded, a decision "sine wave present" is produced at output DD.
- the detection function of a quadrature receiver can also be implemented with the use of a band-pass filter followed by an envelope detector and a decision block.
- a band-pass filter BPF band-pass filter
- the centre frequency of the filter is equal to the frequency of a sine wave to be detected, whereas its bandwidth is inversely proportional to the duration of a signal segment to be processed.
- the output signal FH of the filter BPF is applied to an envelope detector EDR.
- the decision block DBK receives the envelope value ES and compares it to a decision threshold DT. Then, when the threshold has been exceeded a decision "sine wave present" is produced at output DD.
- background noise may comprise some combination of thermal noise and other interference, often of impulsive nature. Because it is very difficult to develop a complete statistical description of background noise, the detection of a weak sine wave in non-Gaussian noise remains one of the most challenging problems.
- the receiver BFR comprises a hard limiter HLR, a band-pass filter BPF and an envelope detector EDR.
- An input signal IS is processed by the receiver DFR, and the resulting envelope value ES is applied to a decision block DBK.
- the block DBK compares the received value ES to a decision threshold DT. Then, when the threshold has been exceeded a decision "sine wave present" is produced at output DD.
- a signal detection system that discards amplitude information is disclosed in a Patent Application: W. J. Szajnowski et al., Detection of Small Object in Bodies of Water. WO 2004/097452. 11 Nov. 2002 .
- a signal processing method comprising:
- the present invention also provides a signal processing apparatus, comprising:
- a signal to be processed comprises either noise alone or a sine wave corrupted by noise. It is assumed that the frequency f 0 of a sine wave to be detected is known, and the other two parameters, amplitude A and initial phase ⁇ , are unknown. It is also assumed that the mean value of noise is equal to zero.
- an observed segment of a received signal is characterized jointly by two parameters: a measure of the mean level of the observed segment (referred to herein as a "mean level measure”) and a measure of the concordance of a zero-crossing pattern of the observed segment with a uniform (regular) pattern exhibited by a sinusoidal waveform having a frequency equal to the centre frequency of the observed segment (referred to herein as a "zero-crossing concordance measure").
- phase concentration R this being a zero-crossing concordance measure
- envelope Z this being a mean level measure
- Two quadrature components, X(t) and Y(t), of a received signal are sampled simultaneously at the time instants determined by a clock whose frequency is equal, or otherwise suitably related, to the frequency of a sine wave to be detected.
- Each sample pair, (X k ,Y k ), obtained at a time instant t k , k 1,2, ...
- phase concentration R is independent of signal level and it may only assume values from the (0,1)-interval.
- the value of R increases as the sine wave becomes stronger in the received signal. It should be pointed out that phase concentration R is independent of initial phase.
- the envelope Z is equal to the amplitude A of a sine wave.
- the average value of envelope Z is still equal to the amplitude A, but the observed values of Z are dispersed around A.
- an observed segment of a signal which may contain a sine wave
- the point has a position (Z, R) in a Z-R plane. Then, depending on the location of this point, a decision will be made regarding the presence or absence of a sine wave in the signal segment under examination.
- Fig. 5 depicts schematically the procedure employed to represent a given signal segment by a single point in the Z-R plane.
- the plane, shown in Fig. 5 a) is defined by two orthogonal non-negative coordinates: envelope Z and phase concentration R.
- N-cluster A representation of such a cluster, containing point N, is depicted as an elliptical contour in the Z-R plane.
- the Z-coordinate of point S is equal to the amplitude A of the sine wave, whereas its R-coordinate is equal to one (maximal phase concentration).
- S+N-cluster a 'sine-wave-and-noise cluster' (S+N-cluster) of respective points.
- the average value of the Z-coordinate of points in the S+N-cluster will be equal (or close) to the amplitude A; however, the average value of R-coordinate will always be less than one.
- a representation of such an S+N-cluster, containing point P, is depicted as another elliptical contour in the Z-R plane.
- an S+N-cluster can be reached either from a 'pure' sine-wave point S, by adding noise, or from an N-cluster, by adding a sine wave with suitable amplitude.
- the presence of a sine wave will be declared, if an examined signal segment is represented in the Z-R plane by a point located in a 'decision' region that does not contain the N-cluster.
- a decision boundary is therefore constructed in order to partition the Z-R plane in a suitable manner. More particularly, based on the locations of the N-cluster and at least one S+N-cluster, a decision boundary to partition the clusters is set either manually or by computer calculation. Examples of determining a decision boundary and associated decision regions will be described in the following.
- the resulting quadrature components of noise will have a more 'spiky' (or impulsive) appearance than those of Gaussian noise.
- the resulting noise components are less 'spiky' than Gaussian components.
- noise more spiky than Gaussian noise is often referred to as being heavy-tailed.
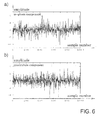
- samples of quadrature components of a sine wave with a fixed amplitude A and random initial phase ⁇ were suitably added to noise components.
- a single value of envelope Z and a corresponding single value of phase concentration R were determined from 100 pairs (X k , Y k ).
- the experiment was replicated 5000 times, and each time the initial phase of the sine wave was selected at random.
- the parameter "b” has the effect of scaling the "Z” components of the data points and has no effect on the "R” components. The value of "b” is therefore chosen to scale the "Z" components into an appropriate range. Samples of an in-phase component are shown in Fig. 6 a) , whereas samples of a quadrature component are depicted in Fig. 6 b) .
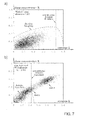
- Fig. 7 a depicts a noise scatter-plot (N-cluster) in the Z-R plane.
- a conventional envelope detector would compare a calculated value of Z with a decision threshold comprising a Z value.
- this decision threshold is schematically represented in the Z-R plane of Fig. 7 a) by a vertical line.
- conventional detectors do not plot points in a two-dimensional plane and instead merely compare calculated Z values with a decision threshold Z value.
- the Z-R representation used in embodiments of the present invention makes it possible to construct a decision boundary which is not limited to being a horizontal or vertical line in the Z-R plane and can instead define decision regions of any shape. Consequently, this leads to a much better discrimination between an N-cluster and a corresponding S+N-cluster.
- Fig. 7 b shows three scatter-plots representing an N-cluster (shown already separately in Fig. 7 a) ) and two S+N-clusters for different values (0.3 and 0.8) of the amplitude A of added sine wave.
- A 0.3
- the use of a decision boundary will result in a superior detection performance in comparison to that when a conventional decision threshold based on Z alone is utilized.
- Fig. 9 a depicts a noise scatter-plot (N-cluster) in the Z-R plane.
- a decision threshold utilized in a conventional envelope detector is represented in the Z-R plane by a vertical line, and a decision boundary is represented by a non-vertical line.
- Fig. 9 b shows three scatter-plots representing an N-cluster (shown already separately in Fig. 9 a) ) and two S+N-clusters for different values (0.3 and 0.8) of the amplitude A of added sine wave.
- the parameter "b” has the effect of scaling the "Z” components of the data points and has no effect on the "R” components. The value of "b” is therefore chosen to scale the "Z" components into an appropriate range.
- Samples of an in-phase component are shown in Fig. 10 a)
- samples of a quadrature component are depicted in Fig. 10 b) .
- the noise peaks assume smaller values than those observed in the previous two cases.
- Fig. 11 a depicts a noise scatter-plot (N-cluster) in the Z-R plane.
- a decision threshold utilized in a conventional envelope detector is represented in the Z-R plane by a vertical line.
- the Z-R representation of embodiments makes it possible to construct a two-dimensional decision boundary which will lead to a much better discrimination between an N-cluster and S+N-cluster.
- Fig. 11 b shows three scatter-plots representing an N-cluster (shown already separately in Fig. 11 a) ) and two S+N-clusters for different values (0.3 and 0.8) of the amplitude A of added sine wave.
- A 0.3
- the use of a decision boundary will result in a superior detection performance in comparison to that when a conventional decision threshold based on Z alone is utilized.
- scatter-plots used to represent N-clusters and S+N-clusters are themselves empirical representations of respective joint probability density functions of envelope Z and phase concentration R.
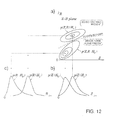
- Fig. 12 a depicts the Z-R plane and two conditional joint probability density functions of envelope Z and phase concentration R:
- a decision "sine wave present" is made, when observed values of Z and R, say, Z 0 and R 0 , produce the likelihood-ratio value L(Z 0 ,R 0 ) that will exceed a predetermined decision threshold.
- the value of the decision threshold is so chosen as to obtain an acceptable probability of false alarm P F .
- H 0 ) when noise alone is present
- H 1 ) when a noisy sine wave is present
- a probability density function of a received signal could be calculated when it is known that a signal has not been transmitted (i.e. there is no sine wave present). It would then be known that this was the probability density function of the noise alone. Similarly, when it is known that a signal has been transmitted and received, the calculated probability density function would be that of a noisy sine wave.
- Fig. 12 b illustrates the fact that the use of an envelope detector alone cannot lead to a reliable detection decision because the two probability density functions of envelope Z alone p ( Z
- Fig. 12 c shows that the use of a detector based on phase concentration R alone cannot lead either to a reliable detection decision because the two probability density functions of phase concentration R alone p ( R
- Fig. 13 is a block diagram of an analogue signal detection system SDS constructed in accordance with a first embodiment of the invention.
- the system comprises the following blocks:
- An input band-pass signal IS is applied in parallel to a hard limiter HLR and a voltage-controlled amplifier VGA.
- the gain of the amplifier is set by input NL in such a way as to suitably normalize the noise level.
- the control signal NL is proportional to the noise level and is provided by a noise-level meter (not shown).
- a suitable noise-level meter is known in the art.
- the "noise level" NL can be any measure of noise level (e.g. rms value).
- the noise-level meter also determines the noise type, namely the statistical model that is the most appropriate for modelling the noise (e.g. Weibull model, Gaussian model, K-distributed model, etc.) and outputs a signal NT defining the determined noise type.
- the noise-level meter determines the value(s) of the noise parameter(s) associated with the determined noise type (e.g. the value of the parameter "c" for Weibull model noise) and outputs a signal (not shown) defining the determined value(s) of the noise parameter(s).
- the output signal VS from the voltage-controlled amplifier VGA is filtered in a band-pass filter BFZ, whose output FZ drives an envelope detector EDZ.
- the centre frequency of both the band-pass filters, BFZ and BFR is equal to the frequency of a sine wave to be detected.
- the bandwidth of the filters should be inversely proportional to the duration of a signal segment to be processed.
- the output HS of the hard limiter HLR is filtered in a band-pass filter BFR, whose output FH drives an envelope detector EDR.
- the envelope detectors EDZ and EDR act to condition their input signals as required by the decision block DBK. For example, if the decision block DBK requires a digital input signal, then EDZ and EDR would perform an analogue-to-digital conversion. EDZ and EDR could also perform, for example, a sampling operation, accumulating operation and/or calculating operation, as required.
- the system SDS may be viewed as comprising one linear channel and one non-linear channel which incorporates the hard limiter HLR.
- the band-pass filter BFZ extracts from an input signal VS a sinusoidal component FZ whose amplitude is indicative of the amplitude of a sine wave (if present) corrupted by noise.
- An output value ZZ of the envelope detector EDZ is a measure of this amplitude.
- the determined value ZZ is independent of the phase of the extracted sinusoidal component FZ.
- an input signal IS is converted by the hard limiter HLR into a bipolar rectangular waveform HS of unit amplitude.
- the band-pass filter BFR extracts now from an input signal HS a single sinusoidal component FH. Its amplitude is indicative of the concordance of the zero-crossing pattern of the input signal IS with a uniform pattern exhibited by a sinusoidal waveform having a frequency equal to the centre frequency of the band-pass filter BFR.
- An output value RR of the envelope detector EDR is a measure of the concordance of the two patterns. The determined value RR is independent of the amplitude of the input signal IS. Moreover, the value RR does not depend on the phase of the extracted sinusoidal component FH.
- the outputs, ZZ and RR, of the respective envelope detectors represent the envelope Z and phase concentration R, respectively, and are applied to the decision block DBK together with the signal NT indicative of the type of noise (e.g., Weibull, Gaussian, K-distributed, etc.) and the signal (not shown) defining the value(s) of the required parameter(s) of the noise.
- the type of noise e.g., Weibull, Gaussian, K-distributed, etc.
- the decision block DBK contains a library of pre-calculated decision boundaries, each decision boundary corresponding to a different combination of noise type and noise parameter(s).
- decision boundaries as shown in Figures 7 b), 9 b) and 11 b) may be pre-calculated and pre-stored in decision block DBK.
- decision block DBK selects one of the pre-stored decision boundaries.
- the decision block DBK then processes jointly signals appearing at inputs ZZ, RR to produce a binary decision DD: "noise alone present” or "a noisy sine wave present" in dependence upon the selected decision boundary.
- the centre frequency of the band-pass filters BFZ and BFR in this embodiment are equal to the frequency of the sine wave to be detected. Accordingly, if sine waves of more than one frequency are to be detected, or if the frequency of the sine wave to be detected is unknown, then multiple receiving channels will need to be provided, each receiving channel comprising a respective signal detecting system SDS with band-pass filters having a different centre frequency to the centre frequency of the band-pass filters in other channels.
- Fig. 14 is a block diagram of another analogue signal detection system SDS constructed in accordance with a second embodiment of the invention.
- the system incorporates two identical quadrature receivers, QRZ and QRR; the receiver QRZ is driven by a signal VS supplied by a voltage-controlled amplifier VGA, whereas the receiver QRR is driven by a signal HS provided by a hard-limiter HLR. Both the voltage-controlled amplifier VGA and the hard limiter HLR are driven in parallel by an input signal IS.
- the gain of the voltage-controlled amplifier VGA is set by input NL in such a way as to normalize the noise level.
- the control signal NL is proportional to the noise level and is provided by a suitable noise-level meter (not shown), as described earlier.
- the noise level meter also supplies a signal NT defining the determined type of the noise and a signal (not shown) defining the value(s) of the parameter(s) associated with the determined type of noise, as described earlier.
- Each of the two identical quadrature receivers, QRZ and QRR comprises the following blocks:
- the functions and operations of the receiver QRZ are as follows.
- An input signal VS is applied in parallel to two mixers, MXI and MXQ.
- the other inputs of the mixers are driven in a usual way by sinusoidal and co-sinusoidal waveforms supplied by a conventional local oscillator.
- the outputs, PI and PQ, of the respective mixers are filtered in the low-pass filters LPI and LPQ to produce two output signals LI and LQ.
- Those two signals are first converted to suitable forms, MI and MQ, in two signal conditioning units, EDI and EDQ, which condition the signals in accordance with the requirements of the "Pythagoras circuit" PYT.
- the 'Pythagoras circuit' PYT is employed to produce a signal ZZ being a representation of the quantity LI 2 + LQ 2 and corresponding to the envelope Z.
- the output of the 'Pythagoras circuit' is a signal RR, corresponding to the phase concentration R.
- the outputs, ZZ and RR, of the respective 'Pythagoras circuits' are applied to the decision block DBK together with the signal NT indicative of the type of noise (e.g., Weibull, Gaussian, K-distributed, etc.) and also the signal (not shown) defining the value(s) of the required parameter(s) of the noise.
- the decision block DBK processes jointly signals appearing at inputs ZZ, RR and NT to produce a binary decision DD: "noise alone present" or "a noisy sine wave present".
- the decision block DBK contains a library of pre-calculated decision boundaries, each decision boundary corresponding to a different combination of noise type and noise parameter(s).
- decision boundaries as shown in Figures 7 b), 9 b) and 11 b) may be pre-calculated and pre-stored in decision block DBK.
- decision block DBK selects the most appropriate pre-stored decision boundary. The decision block DBK then compares the point defined by the input signals ZZ and RR to the selected decision boundary to produce the binary decision DD.
- the main advantage of the dual quadrature receiver of the second embodiment described above is its ability to modify the expected frequency of a sine wave to be detected by varying the frequency of a local oscillator. In this way, the multiple channels of the first embodiment are avoided.
- a sine wave to be detected has a form of a pulse with sinusoidal carrier.
- the pulse duration is usually known (at least approximately) but its time of arrival is in general unknown.
- a suitable detection system is, in this case, a matched filter. Such a filter is known to exhibit good detection characteristics so long as the corrupting noise is Gaussian.
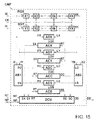
- Fig. 15 is a block diagram of a digital composite matched filter CMF constructed in accordance with a third embodiment of the invention.
- the system comprises the following blocks:
- the composite matched filter CMF operates as follows. Digital samples IX and IY that represent two quadrature components of a signal being processed are supplied by suitable analogue-to-digital converters at a rate equal to the frequency of clock pulses appearing at input CK.
- the inputs, IX and IY could have been generated, for example, by sampling one of the signal pairs (LI, LQ) shown in Figure 14 .
- Other appropriate methods of generating digital samples of two quadrature components of a signal are known in the art.
- a stream of digital samples IX is shifted continually into the register RGX. Accordingly, the K cells, X1, X2, ... , XK, of the register RGX will store, at any time instant, the K latest samples received at input IX.
- a stream of digital samples IY is shifted continually into the register RGY, and the K cells, Y1, Y2, ... , YK, of the register RGY will store, at any time instant, the K latest samples received at input IY. Therefore, the operation of the two shift registers, RGX and RGY, may be viewed as being equivalent to moving concurrently and in parallel two corresponding 'data windows' along two streams of digital samples.
- the number K of cells used in both the shift registers, RGX and RGY, is chosen in such a way that the product of K and the clock period is equal to the duration of an expected sinusoidal pulse.
- the operation of the composite matched filter CMF is initiated by setting to zero the states of all the four accumulators, ACX, ACY, ACC and ACS. This task is performed by a 'reset' pulse RT produced by the decision unit DCU and applied to inputs RT of the four accumulators. It is also convenient, although not necessary, to set to zero the initial states of the shift registers, RGX and RGY.
- the above summing operation is arranged in the following manner.
- the accumulator ACX At each time instant, the accumulator ACX 'adjusts' its state by subtracting the sample XK just leaving the register RGX and adding a sample IX just entering the register RGX. Accordingly, the adder ADX forms the difference DX between sample IX appearing at input FX and sample XK appearing at input LX; this difference DX is added to the current state of the accumulator ACX.
- the adder ADX will reproduce these values at its output DX, since only zero-valued samples are leaving the shift register RGX. Then, the adder ADX will start producing differences between samples entering and leaving the shift register RGX.
- the accumulator ACY is driven by a value DY provided the adder ADY.
- the value DY is the difference between sample IY appearing at input FY and sample YK appearing at input LY.
- this part of the composite matched filter CMF can be regarded as a conventional matched filter.
- the arithmetic block AB1 provides at its outputs FC and FS, respectively, the value of the cosine and the sine determined from samples IX and IY.
- the arithmetic block AB2 provides at its outputs LC and LS, respectively, the value of the cosine and the sine determined from samples XK and YK.
- the accumulator ACC provides at its output SC the sum of K cosines calculated from K sample pairs X ⁇ 1 , Y ⁇ 1 , X ⁇ 2 , Y ⁇ 2 , ... , XK ⁇ YK stored at any time instant in the shift registers RGX and RGY.
- state of ACC cos ⁇ ⁇ 1 + cos ⁇ ⁇ 2 + ... + cos ⁇ ⁇ K
- ⁇ k arctan(Yk/Xk)
- k 1, 2, ... , K
- arctan( ⁇ ) is a four-quadrant operation.
- the accumulator ACC is driven by a value DC provided by the adder ADC.
- the value DC is the difference between two values, FC and LC, supplied respectively by the arithmetic blocks AB1 and AB2.
- the accumulator ACS provides at its output SS the sum of K sines calculated from K sample pairs X ⁇ 1 , Y ⁇ 1 , X ⁇ 2 , Y ⁇ 2 , ... , XK ⁇ YK stored at any time instant in the shift registers RGX and RGY.
- state of ACS sin ⁇ ⁇ 1 + sin ⁇ ⁇ 2 + ... + sin ⁇ ⁇ K
- ⁇ k arctan(Yk/Xk)
- k 1, 2, ... , K
- arctan( ⁇ ) is a four-quadrant operation.
- the accumulator ACS is driven by a value DS provided by the adder ADS.
- the value DS is the difference between two values, FS and LS, supplied respectively by the arithmetic blocks AB1 and AB2.
- this part of the composite matched filter CMF may be referred to as a co-matched filter.
- the decision unit DCU utilizes values appearing continually at its inputs SX, SY, SC and SS to determine the envelope Z and the phase concentration R of a sequence of K sample pairs X ⁇ 1 , Y ⁇ 1 , X ⁇ 2 , Y ⁇ 2 , ... , XK ⁇ YK stored at any time instant in the shift registers RGX and RGY.
- the decision unit DCU contains a library of pre-calculated decision boundaries, each decision boundary corresponding to a different combination of noise type and noise parameter(s).
- decision boundaries as shown in Figures 7 b), 9 b) and 11 b) may be pre-calculated and pre-stored in decision unit DCU.
- decision unit DCU selects one of the pre-stored decision boundaries.
- the decision unit DCU then processes jointly all values appearing at inputs SX, SY, SS and SC to produce a binary decision DD based on the selected decision boundary: "noise alone present" or "a noisy sine wave present".
- a fourth embodiment of the present invention will now be described, in which the component are the same as those in the third embodiment, but the embodiment additionally stores one or more decision boundaries so as to perform signal detection in K-distributed noise.
- K-distributed noise representing another non-Gaussian noise model, is useful in characterizing electromagnetic signals scattered from complex surfaces.
- z is the noise envelope
- b is a scale parameter
- v is a shape parameter
- Kv-1( ⁇ ) is a modified Bessel function of the second kind.
- the shape parameter v assumes values ranging from 0.1 (for extremely 'spiky' impulsive noise) to 20, corresponding approximately to Gaussian noise.
- K-distributed noise is discussed in more detail in: E. B. Rockower: Quantum derivation of K-distributed noise for finite ⁇ N>. J. Opt. Soc. Am. A ., Vol. 5, May 1985, pp 730-734 .
- a single value of envelope Z and a corresponding single value of phase concentration R were determined from 100 pairs (Xk, Yk). Such experiment was repeated 15,000 times to produce a noise scatter-plot (N-cluster) shown in Fig. 17 a) . A decision boundary of a composite matched filter is also shown.
- Fig. 17 b shows a corresponding scatter-plot (S+N-cluster) along with the decision boundary.
- the position of this scatter-plot with respect to the decision boundary indicates that a conventional matched filter, utilizing only the envelope Z, will provide detection performance inferior to that offered by a composite matched filter.
- the mean level measure is calculated as the envelope Z in accordance with equation (4) above.
- other mean level measures may be used instead.
- the zero-crossing concordance measure is calculated as the phase concentration R in accordance with equation (3) above.
- This form of zero-crossing concordance measure has the advantage that its value increases as the strength of the sinusoidal waveform in the received signal increases. In this way, the values of both the mean level measure and the zero-crossing concordance measure move in the same direction.
- other zero-crossing concordance measures may be used instead.
- a circular range can be used as the zero-crossing concordance measure, where the circular range is the length of the smallest circular arc which contains all, or a substantial portion of, the phase observations.
- ⁇ (1) ⁇ ... ⁇ K be the linear order statistics of ⁇ 1 , ..., ⁇ K .
- a measure of circular variance, V, circular dispersion, ⁇ , or circular standard deviation, ⁇ , based on the calculated phase concentration R may be used as the zero-crossing concordance measure.
- the quantity R 2 in equation (19) is determined from equation (3) when cos ⁇ k and sin ⁇ k are replaced, respectively, with cos 2 ⁇ k and sin 2 ⁇ k .
- phase dispersion/concentration can be employed as the zero-crossing concordance measure.
- a conventional (linear) standard deviation can be employed as a measure of phase dispersion. Although not optimal for circular observations, it can still provide a useful measure of the zero-crossing discordance and is consequently a useful zero-crossing concordance measure.
- a hard limiter can be replaced with a device having an output-input characteristic of a sigmoid form (one kind of a 'soft' limiter).
- a class of sigmoid functions include: a hyperbolic tangent, an arctangent, generalized logistic function and many others.
- the decision blocks DBK and decision unit DCU each store a library of pre-calculated decision boundaries, and select a decision boundary to be used for a particular input signal in dependence upon the noise type in the input signal or both the noise type and the value(s) of the associated noise parameter(s) in the input signal.
- the decision blocks DBK and decision circuit DCU may calculate the decision boundary in real-time.
Landscapes
- Physics & Mathematics (AREA)
- Engineering & Computer Science (AREA)
- Computer Hardware Design (AREA)
- Mathematical Physics (AREA)
- General Physics & Mathematics (AREA)
- Noise Elimination (AREA)
Priority Applications (2)
| Application Number | Priority Date | Filing Date | Title |
|---|---|---|---|
| EP08170389A EP2192414A1 (fr) | 2008-12-01 | 2008-12-01 | Détection de forme d'onde sinusoïdale du bruit |
| PCT/EP2009/065899 WO2010063635A1 (fr) | 2008-12-01 | 2009-11-26 | Détection d’une forme d’onde sinusoïdale dans du bruit |
Applications Claiming Priority (1)
| Application Number | Priority Date | Filing Date | Title |
|---|---|---|---|
| EP08170389A EP2192414A1 (fr) | 2008-12-01 | 2008-12-01 | Détection de forme d'onde sinusoïdale du bruit |
Publications (1)
| Publication Number | Publication Date |
|---|---|
| EP2192414A1 true EP2192414A1 (fr) | 2010-06-02 |
Family
ID=40565298
Family Applications (1)
| Application Number | Title | Priority Date | Filing Date |
|---|---|---|---|
| EP08170389A Withdrawn EP2192414A1 (fr) | 2008-12-01 | 2008-12-01 | Détection de forme d'onde sinusoïdale du bruit |
Country Status (2)
| Country | Link |
|---|---|
| EP (1) | EP2192414A1 (fr) |
| WO (1) | WO2010063635A1 (fr) |
Cited By (1)
| Publication number | Priority date | Publication date | Assignee | Title |
|---|---|---|---|---|
| CN115508788A (zh) * | 2022-09-30 | 2022-12-23 | 中国航天科工集团八五一一研究所 | 基于稳健噪底估计的信道化检测方法 |
Citations (6)
| Publication number | Priority date | Publication date | Assignee | Title |
|---|---|---|---|---|
| US3238457A (en) * | 1963-05-08 | 1966-03-01 | Melpar Inc | Signal to noise ratio monitor |
| US3927260A (en) * | 1974-05-07 | 1975-12-16 | Atlantic Res Corp | Signal identification system |
| WO2004097452A1 (fr) | 2003-04-30 | 2004-11-11 | Qinetiq Limited | Detection de petits objets dans des masses d'eau |
| EP1669764A1 (fr) * | 2004-12-09 | 2006-06-14 | Tektronix, Inc. | Système de déclenchement de domaine de modulation |
| EP1903557A2 (fr) * | 2006-09-19 | 2008-03-26 | Avaya Technology Llc | Détecteur d'activité vocale efficace pour détecter des signaux électriques fixes |
| WO2008042506A2 (fr) * | 2006-09-28 | 2008-04-10 | Tektronix, Inc. | Système de déclenchement de spectre en temps réel sur un oscilloscope en temps réel |
-
2008
- 2008-12-01 EP EP08170389A patent/EP2192414A1/fr not_active Withdrawn
-
2009
- 2009-11-26 WO PCT/EP2009/065899 patent/WO2010063635A1/fr not_active Ceased
Patent Citations (6)
| Publication number | Priority date | Publication date | Assignee | Title |
|---|---|---|---|---|
| US3238457A (en) * | 1963-05-08 | 1966-03-01 | Melpar Inc | Signal to noise ratio monitor |
| US3927260A (en) * | 1974-05-07 | 1975-12-16 | Atlantic Res Corp | Signal identification system |
| WO2004097452A1 (fr) | 2003-04-30 | 2004-11-11 | Qinetiq Limited | Detection de petits objets dans des masses d'eau |
| EP1669764A1 (fr) * | 2004-12-09 | 2006-06-14 | Tektronix, Inc. | Système de déclenchement de domaine de modulation |
| EP1903557A2 (fr) * | 2006-09-19 | 2008-03-26 | Avaya Technology Llc | Détecteur d'activité vocale efficace pour détecter des signaux électriques fixes |
| WO2008042506A2 (fr) * | 2006-09-28 | 2008-04-10 | Tektronix, Inc. | Système de déclenchement de spectre en temps réel sur un oscilloscope en temps réel |
Non-Patent Citations (5)
| Title |
|---|
| E. B. ROCKOWER: "Quantum derivation of K-distributed noise for finite <N>", J. OPT. SOC. AM. A, vol. 5, May 1985 (1985-05-01), pages 730 - 734 |
| K. V. MARDIA; P.E. JUPP: "Directional Statistics", 2000, WILEY, pages: 17 - 20 |
| KEMAN LIU ET AL: "A statistical method for underwater target detection", INTELLIGENT CONTROL AND AUTOMATION, 2008. WCICA 2008. 7TH WORLD CONGRESS ON, IEEE, PISCATAWAY, NJ, USA, 25 June 2008 (2008-06-25), pages 5878 - 5882, XP031300796, ISBN: 978-1-4244-2113-8 * |
| TOMOMI MURAKAMI ET AL: "Detection of Asymmetric Sideband Signals in the Presence of Noise", IRE TRANSACTIONS ON BROADCAST AND TELEVISION RECEIVERS, IEEE, U.S.A, vol. BTR-1, no. 1, 1 January 1959 (1959-01-01), pages 46 - 75, XP011212373, ISSN: 0096-1655 * |
| YOUNG-IK KIM ET AL: "Estimation of Interaural Time Differences Based on Zero-Crossings in Noisy Multisource Environments", IEEE TRANSACTIONS ON AUDIO, SPEECH, AND LANGUAGE PROCESSING, IEEE SERVICE CENTER, NEW YORK, NY, US, vol. 15, no. 2, 1 February 2007 (2007-02-01), pages 734 - 743, XP011157509, ISSN: 1558-7916 * |
Cited By (1)
| Publication number | Priority date | Publication date | Assignee | Title |
|---|---|---|---|---|
| CN115508788A (zh) * | 2022-09-30 | 2022-12-23 | 中国航天科工集团八五一一研究所 | 基于稳健噪底估计的信道化检测方法 |
Also Published As
| Publication number | Publication date |
|---|---|
| WO2010063635A1 (fr) | 2010-06-10 |
Similar Documents
| Publication | Publication Date | Title |
|---|---|---|
| JP7499045B2 (ja) | 融合された閾値/位相変調検出を使用してパルスを検出するためのシステムおよび方法 | |
| Pascal et al. | Generalized robust shrinkage estimator and its application to STAP detection problem | |
| US9660772B2 (en) | Detecting and processing weak signals using an array of antennas | |
| Chen et al. | Weak signal frequency detection using chaos theory: A comprehensive analysis | |
| US10305701B2 (en) | Phase-modulated signal parameter estimation using streaming calculations | |
| Digne et al. | Classification of radar pulses in a naval warfare context using Bezier curve modeling of the instantaneous frequency law | |
| EP0373802A2 (fr) | Mesure de fréquence | |
| EP3293537A1 (fr) | Systèmes et procédés de filtrage spatial à l'aide de données | |
| AU2015295795B2 (en) | Method and apparatus for detecting a speed and a distance of at least one object with respect to a receiver of a reception signal | |
| Park et al. | Compressive time delay estimation off the grid | |
| JPS60169782A (ja) | 移動目標表示装置 | |
| Harms et al. | Identification of linear time-varying systems through waveform diversity | |
| Wang et al. | Automated weak signal frequency estimation method based on Duffing oscillator and particle swarm optimization | |
| Maskell et al. | The estimation of subsample time delay of arrival in the discrete-time measurement of phase delay | |
| Potapov | Fractal paradigm and fractal-scaling methods in fundamentally new dynamic fractal signal detectors | |
| WO2010063635A1 (fr) | Détection d’une forme d’onde sinusoïdale dans du bruit | |
| Chen et al. | Information-theoretic optimal radar waveform selection with multi-sensor cooperation for LPI purpose | |
| Berry et al. | Passive multi-target tracking using the adaptive birth intensity PHD filter | |
| Ananieva et al. | Design of a device for optimal reception of signals against the background of a two-component Markov interference | |
| RU2282872C1 (ru) | Фазовый пеленгатор | |
| EP2322948A1 (fr) | Détection de forme d'onde sinusoïdale du bruit | |
| Zhang et al. | Chaotic detector for BPSK signals in very low SNR conditions | |
| Prokopenko et al. | Estimations of the Signal Information Parameters in Radio Engineering Systems. | |
| Niranjan et al. | FPGA based implementation of pulse parameters measurement | |
| RU2528081C2 (ru) | Приемник импульсного сигнала |
Legal Events
| Date | Code | Title | Description |
|---|---|---|---|
| PUAI | Public reference made under article 153(3) epc to a published international application that has entered the european phase |
Free format text: ORIGINAL CODE: 0009012 |
|
| AK | Designated contracting states |
Kind code of ref document: A1 Designated state(s): AT BE BG CH CY CZ DE DK EE ES FI FR GB GR HR HU IE IS IT LI LT LU LV MC MT NL NO PL PT RO SE SI SK TR |
|
| AX | Request for extension of the european patent |
Extension state: AL BA MK RS |
|
| 17P | Request for examination filed |
Effective date: 20101117 |
|
| AKX | Designation fees paid |
Designated state(s): DE FR GB |
|
| RAP1 | Party data changed (applicant data changed or rights of an application transferred) |
Owner name: MITSUBISHI ELECTRIC CORPORATION Owner name: MITSUBISHI ELECTRIC R&D CENTRE EUROPE B.V. |
|
| STAA | Information on the status of an ep patent application or granted ep patent |
Free format text: STATUS: THE APPLICATION HAS BEEN WITHDRAWN |
|
| 18W | Application withdrawn |
Effective date: 20110526 |