EP2361966A1 - Mesoderm and definitive endoderm cell populations - Google Patents
Mesoderm and definitive endoderm cell populations Download PDFInfo
- Publication number
- EP2361966A1 EP2361966A1 EP10011700A EP10011700A EP2361966A1 EP 2361966 A1 EP2361966 A1 EP 2361966A1 EP 10011700 A EP10011700 A EP 10011700A EP 10011700 A EP10011700 A EP 10011700A EP 2361966 A1 EP2361966 A1 EP 2361966A1
- Authority
- EP
- European Patent Office
- Prior art keywords
- cells
- gfp
- differentiation
- activin
- flk
- Prior art date
- Legal status (The legal status is an assumption and is not a legal conclusion. Google has not performed a legal analysis and makes no representation as to the accuracy of the status listed.)
- Withdrawn
Links
- 210000003716 mesoderm Anatomy 0.000 title claims abstract description 70
- 210000004039 endoderm cell Anatomy 0.000 title claims description 18
- 210000001900 endoderm Anatomy 0.000 claims abstract description 47
- 210000004027 cell Anatomy 0.000 claims description 428
- 210000002242 embryoid body Anatomy 0.000 claims description 125
- 230000004069 differentiation Effects 0.000 claims description 93
- 239000000488 activin Substances 0.000 claims description 78
- 108010059616 Activins Proteins 0.000 claims description 77
- 210000002966 serum Anatomy 0.000 claims description 76
- 238000000034 method Methods 0.000 claims description 53
- 238000012258 culturing Methods 0.000 claims description 35
- 239000003795 chemical substances by application Substances 0.000 claims description 28
- 210000003494 hepatocyte Anatomy 0.000 claims description 22
- 210000001671 embryonic stem cell Anatomy 0.000 claims description 21
- 230000003511 endothelial effect Effects 0.000 claims description 20
- 210000001704 mesoblast Anatomy 0.000 claims description 20
- 210000004413 cardiac myocyte Anatomy 0.000 claims description 17
- 230000004083 survival effect Effects 0.000 claims description 16
- 230000035755 proliferation Effects 0.000 claims description 14
- 241001465754 Metazoa Species 0.000 claims description 13
- 210000003958 hematopoietic stem cell Anatomy 0.000 claims description 8
- 230000006378 damage Effects 0.000 claims description 6
- 210000002889 endothelial cell Anatomy 0.000 claims description 6
- 210000005229 liver cell Anatomy 0.000 claims description 6
- 230000002950 deficient Effects 0.000 claims description 5
- 230000004064 dysfunction Effects 0.000 claims description 5
- 230000003908 liver function Effects 0.000 claims description 5
- GACSIVHAIFQKTC-OWOJBTEDSA-N 4-fumarylacetoacetic acid Chemical compound OC(=O)CC(=O)CC(=O)\C=C\C(O)=O GACSIVHAIFQKTC-OWOJBTEDSA-N 0.000 claims description 3
- 210000005265 lung cell Anatomy 0.000 claims description 3
- 230000001747 exhibiting effect Effects 0.000 claims description 2
- 230000006872 improvement Effects 0.000 claims description 2
- 102000005606 Activins Human genes 0.000 claims 8
- 210000004509 vascular smooth muscle cell Anatomy 0.000 claims 1
- 238000009256 replacement therapy Methods 0.000 abstract description 6
- 230000014509 gene expression Effects 0.000 description 117
- 108010053099 Vascular Endothelial Growth Factor Receptor-2 Proteins 0.000 description 81
- 102000016549 Vascular Endothelial Growth Factor Receptor-2 Human genes 0.000 description 75
- 108090000623 proteins and genes Proteins 0.000 description 75
- 102100026818 Inhibin beta E chain Human genes 0.000 description 69
- 238000011161 development Methods 0.000 description 51
- 230000018109 developmental process Effects 0.000 description 49
- 230000003394 haemopoietic effect Effects 0.000 description 39
- 239000003550 marker Substances 0.000 description 25
- 238000010195 expression analysis Methods 0.000 description 18
- 239000002243 precursor Substances 0.000 description 16
- 210000002027 skeletal muscle Anatomy 0.000 description 16
- 210000001519 tissue Anatomy 0.000 description 15
- 230000000747 cardiac effect Effects 0.000 description 14
- 102100023635 Alpha-fetoprotein Human genes 0.000 description 13
- 241000699666 Mus <mouse, genus> Species 0.000 description 13
- 210000003566 hemangioblast Anatomy 0.000 description 13
- 210000004165 myocardium Anatomy 0.000 description 12
- 241000699670 Mus sp. Species 0.000 description 11
- 238000004458 analytical method Methods 0.000 description 11
- 238000010009 beating Methods 0.000 description 11
- 230000020619 endoderm development Effects 0.000 description 11
- 239000012634 fragment Substances 0.000 description 11
- 108010088751 Albumins Proteins 0.000 description 10
- 102000009027 Albumins Human genes 0.000 description 10
- 230000000925 erythroid effect Effects 0.000 description 10
- 230000008685 targeting Effects 0.000 description 10
- 102100024505 Bone morphogenetic protein 4 Human genes 0.000 description 9
- 108091003079 Bovine Serum Albumin Proteins 0.000 description 9
- 108010014608 Proto-Oncogene Proteins c-kit Proteins 0.000 description 9
- 102000016971 Proto-Oncogene Proteins c-kit Human genes 0.000 description 9
- 238000010240 RT-PCR analysis Methods 0.000 description 9
- 239000012894 fetal calf serum Substances 0.000 description 9
- 238000002955 isolation Methods 0.000 description 9
- 239000002609 medium Substances 0.000 description 9
- 239000013598 vector Substances 0.000 description 9
- 102100031690 Erythroid transcription factor Human genes 0.000 description 8
- 101000762379 Homo sapiens Bone morphogenetic protein 4 Proteins 0.000 description 8
- 230000024245 cell differentiation Effects 0.000 description 8
- 210000003981 ectoderm Anatomy 0.000 description 8
- 230000006698 induction Effects 0.000 description 8
- 210000004185 liver Anatomy 0.000 description 8
- 230000003847 mesoderm development Effects 0.000 description 8
- 239000013612 plasmid Substances 0.000 description 8
- 101710100588 Erythroid transcription factor Proteins 0.000 description 7
- 102100024785 Fibroblast growth factor 2 Human genes 0.000 description 7
- 108090000379 Fibroblast growth factor 2 Proteins 0.000 description 7
- 102000007354 PAX6 Transcription Factor Human genes 0.000 description 7
- 108010032788 PAX6 Transcription Factor Proteins 0.000 description 7
- 238000003556 assay Methods 0.000 description 7
- 238000000338 in vitro Methods 0.000 description 7
- UZOVYGYOLBIAJR-UHFFFAOYSA-N 4-isocyanato-4'-methyldiphenylmethane Chemical compound C1=CC(C)=CC=C1CC1=CC=C(N=C=O)C=C1 UZOVYGYOLBIAJR-UHFFFAOYSA-N 0.000 description 6
- 108700028369 Alleles Proteins 0.000 description 6
- 108091034117 Oligonucleotide Proteins 0.000 description 6
- 206010043276 Teratoma Diseases 0.000 description 6
- 102000016540 Tyrosine aminotransferases Human genes 0.000 description 6
- 108010042606 Tyrosine transaminase Proteins 0.000 description 6
- 208000037265 diseases, disorders, signs and symptoms Diseases 0.000 description 6
- 208000035475 disorder Diseases 0.000 description 6
- 230000000694 effects Effects 0.000 description 6
- 238000001943 fluorescence-activated cell sorting Methods 0.000 description 6
- 230000001965 increasing effect Effects 0.000 description 6
- 102000004169 proteins and genes Human genes 0.000 description 6
- 238000002054 transplantation Methods 0.000 description 6
- 108020004414 DNA Proteins 0.000 description 5
- 101150026303 HEX1 gene Proteins 0.000 description 5
- 101710150336 Protein Rex Proteins 0.000 description 5
- 238000012512 characterization method Methods 0.000 description 5
- 239000002299 complementary DNA Substances 0.000 description 5
- 239000003636 conditioned culture medium Substances 0.000 description 5
- 108010048367 enhanced green fluorescent protein Proteins 0.000 description 5
- 238000002474 experimental method Methods 0.000 description 5
- 210000004602 germ cell Anatomy 0.000 description 5
- 210000001161 mammalian embryo Anatomy 0.000 description 5
- 239000000523 sample Substances 0.000 description 5
- 230000009261 transgenic effect Effects 0.000 description 5
- 102000007469 Actins Human genes 0.000 description 4
- 108010085238 Actins Proteins 0.000 description 4
- CIWBSHSKHKDKBQ-JLAZNSOCSA-N Ascorbic acid Chemical compound OC[C@H](O)[C@H]1OC(=O)C(O)=C1O CIWBSHSKHKDKBQ-JLAZNSOCSA-N 0.000 description 4
- 108020004705 Codon Proteins 0.000 description 4
- 101100519293 Neurospora crassa (strain ATCC 24698 / 74-OR23-1A / CBS 708.71 / DSM 1257 / FGSC 987) pdx-1 gene Proteins 0.000 description 4
- 108091081024 Start codon Proteins 0.000 description 4
- 102000040945 Transcription factor Human genes 0.000 description 4
- 108091023040 Transcription factor Proteins 0.000 description 4
- 102000005789 Vascular Endothelial Growth Factors Human genes 0.000 description 4
- 108010019530 Vascular Endothelial Growth Factors Proteins 0.000 description 4
- 238000000137 annealing Methods 0.000 description 4
- 230000015572 biosynthetic process Effects 0.000 description 4
- 150000001875 compounds Chemical class 0.000 description 4
- 210000003989 endothelium vascular Anatomy 0.000 description 4
- 238000000684 flow cytometry Methods 0.000 description 4
- 210000003734 kidney Anatomy 0.000 description 4
- 230000035800 maturation Effects 0.000 description 4
- 239000000203 mixture Substances 0.000 description 4
- 210000002464 muscle smooth vascular Anatomy 0.000 description 4
- 210000001020 neural plate Anatomy 0.000 description 4
- 230000008569 process Effects 0.000 description 4
- 230000025366 tissue development Effects 0.000 description 4
- 108010010803 Gelatin Proteins 0.000 description 3
- 206010019663 Hepatic failure Diseases 0.000 description 3
- 108010002386 Interleukin-3 Proteins 0.000 description 3
- 108090001005 Interleukin-6 Proteins 0.000 description 3
- 101100310648 Mus musculus Sox17 gene Proteins 0.000 description 3
- 102100038380 Myogenic factor 5 Human genes 0.000 description 3
- 101710099061 Myogenic factor 5 Proteins 0.000 description 3
- 108020005067 RNA Splice Sites Proteins 0.000 description 3
- 108020004440 Thymidine kinase Proteins 0.000 description 3
- 108700019146 Transgenes Proteins 0.000 description 3
- JLCPHMBAVCMARE-UHFFFAOYSA-N [3-[[3-[[3-[[3-[[3-[[3-[[3-[[3-[[3-[[3-[[3-[[5-(2-amino-6-oxo-1H-purin-9-yl)-3-[[3-[[3-[[3-[[3-[[3-[[5-(2-amino-6-oxo-1H-purin-9-yl)-3-[[5-(2-amino-6-oxo-1H-purin-9-yl)-3-hydroxyoxolan-2-yl]methoxy-hydroxyphosphoryl]oxyoxolan-2-yl]methoxy-hydroxyphosphoryl]oxy-5-(5-methyl-2,4-dioxopyrimidin-1-yl)oxolan-2-yl]methoxy-hydroxyphosphoryl]oxy-5-(6-aminopurin-9-yl)oxolan-2-yl]methoxy-hydroxyphosphoryl]oxy-5-(6-aminopurin-9-yl)oxolan-2-yl]methoxy-hydroxyphosphoryl]oxy-5-(6-aminopurin-9-yl)oxolan-2-yl]methoxy-hydroxyphosphoryl]oxy-5-(6-aminopurin-9-yl)oxolan-2-yl]methoxy-hydroxyphosphoryl]oxyoxolan-2-yl]methoxy-hydroxyphosphoryl]oxy-5-(5-methyl-2,4-dioxopyrimidin-1-yl)oxolan-2-yl]methoxy-hydroxyphosphoryl]oxy-5-(4-amino-2-oxopyrimidin-1-yl)oxolan-2-yl]methoxy-hydroxyphosphoryl]oxy-5-(5-methyl-2,4-dioxopyrimidin-1-yl)oxolan-2-yl]methoxy-hydroxyphosphoryl]oxy-5-(5-methyl-2,4-dioxopyrimidin-1-yl)oxolan-2-yl]methoxy-hydroxyphosphoryl]oxy-5-(6-aminopurin-9-yl)oxolan-2-yl]methoxy-hydroxyphosphoryl]oxy-5-(6-aminopurin-9-yl)oxolan-2-yl]methoxy-hydroxyphosphoryl]oxy-5-(4-amino-2-oxopyrimidin-1-yl)oxolan-2-yl]methoxy-hydroxyphosphoryl]oxy-5-(4-amino-2-oxopyrimidin-1-yl)oxolan-2-yl]methoxy-hydroxyphosphoryl]oxy-5-(4-amino-2-oxopyrimidin-1-yl)oxolan-2-yl]methoxy-hydroxyphosphoryl]oxy-5-(6-aminopurin-9-yl)oxolan-2-yl]methoxy-hydroxyphosphoryl]oxy-5-(4-amino-2-oxopyrimidin-1-yl)oxolan-2-yl]methyl [5-(6-aminopurin-9-yl)-2-(hydroxymethyl)oxolan-3-yl] hydrogen phosphate Polymers Cc1cn(C2CC(OP(O)(=O)OCC3OC(CC3OP(O)(=O)OCC3OC(CC3O)n3cnc4c3nc(N)[nH]c4=O)n3cnc4c3nc(N)[nH]c4=O)C(COP(O)(=O)OC3CC(OC3COP(O)(=O)OC3CC(OC3COP(O)(=O)OC3CC(OC3COP(O)(=O)OC3CC(OC3COP(O)(=O)OC3CC(OC3COP(O)(=O)OC3CC(OC3COP(O)(=O)OC3CC(OC3COP(O)(=O)OC3CC(OC3COP(O)(=O)OC3CC(OC3COP(O)(=O)OC3CC(OC3COP(O)(=O)OC3CC(OC3COP(O)(=O)OC3CC(OC3COP(O)(=O)OC3CC(OC3COP(O)(=O)OC3CC(OC3COP(O)(=O)OC3CC(OC3COP(O)(=O)OC3CC(OC3COP(O)(=O)OC3CC(OC3CO)n3cnc4c(N)ncnc34)n3ccc(N)nc3=O)n3cnc4c(N)ncnc34)n3ccc(N)nc3=O)n3ccc(N)nc3=O)n3ccc(N)nc3=O)n3cnc4c(N)ncnc34)n3cnc4c(N)ncnc34)n3cc(C)c(=O)[nH]c3=O)n3cc(C)c(=O)[nH]c3=O)n3ccc(N)nc3=O)n3cc(C)c(=O)[nH]c3=O)n3cnc4c3nc(N)[nH]c4=O)n3cnc4c(N)ncnc34)n3cnc4c(N)ncnc34)n3cnc4c(N)ncnc34)n3cnc4c(N)ncnc34)O2)c(=O)[nH]c1=O JLCPHMBAVCMARE-UHFFFAOYSA-N 0.000 description 3
- 230000010261 cell growth Effects 0.000 description 3
- 238000006243 chemical reaction Methods 0.000 description 3
- 230000007423 decrease Effects 0.000 description 3
- 239000013604 expression vector Substances 0.000 description 3
- 239000008273 gelatin Substances 0.000 description 3
- 229920000159 gelatin Polymers 0.000 description 3
- 235000019322 gelatine Nutrition 0.000 description 3
- 235000011852 gelatine desserts Nutrition 0.000 description 3
- 239000003102 growth factor Substances 0.000 description 3
- 230000001939 inductive effect Effects 0.000 description 3
- 208000007903 liver failure Diseases 0.000 description 3
- 231100000835 liver failure Toxicity 0.000 description 3
- 210000004072 lung Anatomy 0.000 description 3
- 210000002540 macrophage Anatomy 0.000 description 3
- 210000004962 mammalian cell Anatomy 0.000 description 3
- 238000004519 manufacturing process Methods 0.000 description 3
- 229920000609 methyl cellulose Polymers 0.000 description 3
- 239000001923 methylcellulose Substances 0.000 description 3
- 238000007479 molecular analysis Methods 0.000 description 3
- 210000002241 neurite Anatomy 0.000 description 3
- 238000000059 patterning Methods 0.000 description 3
- 230000001105 regulatory effect Effects 0.000 description 3
- 230000002123 temporal effect Effects 0.000 description 3
- 238000012360 testing method Methods 0.000 description 3
- 238000011144 upstream manufacturing Methods 0.000 description 3
- 108091032973 (ribonucleotides)n+m Proteins 0.000 description 2
- 108020005029 5' Flanking Region Proteins 0.000 description 2
- BPYKTIZUTYGOLE-IFADSCNNSA-N Bilirubin Chemical compound N1C(=O)C(C)=C(C=C)\C1=C\C1=C(C)C(CCC(O)=O)=C(CC2=C(C(C)=C(\C=C/3C(=C(C=C)C(=O)N\3)C)N2)CCC(O)=O)N1 BPYKTIZUTYGOLE-IFADSCNNSA-N 0.000 description 2
- 102100024506 Bone morphogenetic protein 2 Human genes 0.000 description 2
- 102000037115 Carbamoyl-phosphate synthase (ammonia) Human genes 0.000 description 2
- 108090000447 Carbamoyl-phosphate synthase (ammonia) Proteins 0.000 description 2
- 102000002664 Core Binding Factor Alpha 2 Subunit Human genes 0.000 description 2
- 108010043471 Core Binding Factor Alpha 2 Subunit Proteins 0.000 description 2
- RTZKZFJDLAIYFH-UHFFFAOYSA-N Diethyl ether Chemical compound CCOCC RTZKZFJDLAIYFH-UHFFFAOYSA-N 0.000 description 2
- 239000006144 Dulbecco’s modified Eagle's medium Substances 0.000 description 2
- 238000012413 Fluorescence activated cell sorting analysis Methods 0.000 description 2
- 108010017213 Granulocyte-Macrophage Colony-Stimulating Factor Proteins 0.000 description 2
- 102100039620 Granulocyte-macrophage colony-stimulating factor Human genes 0.000 description 2
- 102100022054 Hepatocyte nuclear factor 4-alpha Human genes 0.000 description 2
- 101000762366 Homo sapiens Bone morphogenetic protein 2 Proteins 0.000 description 2
- 101001045740 Homo sapiens Hepatocyte nuclear factor 4-alpha Proteins 0.000 description 2
- 101000612671 Homo sapiens Pulmonary surfactant-associated protein C Proteins 0.000 description 2
- 102000003815 Interleukin-11 Human genes 0.000 description 2
- 108090000177 Interleukin-11 Proteins 0.000 description 2
- 102100020880 Kit ligand Human genes 0.000 description 2
- ZDXPYRJPNDTMRX-VKHMYHEASA-N L-glutamine Chemical compound OC(=O)[C@@H](N)CCC(N)=O ZDXPYRJPNDTMRX-VKHMYHEASA-N 0.000 description 2
- 229930182816 L-glutamine Natural products 0.000 description 2
- 108010046938 Macrophage Colony-Stimulating Factor Proteins 0.000 description 2
- 102000007651 Macrophage Colony-Stimulating Factor Human genes 0.000 description 2
- 102000008763 Neurofilament Proteins Human genes 0.000 description 2
- 108010088373 Neurofilament Proteins Proteins 0.000 description 2
- 238000010222 PCR analysis Methods 0.000 description 2
- 108010071690 Prealbumin Proteins 0.000 description 2
- 102100040971 Pulmonary surfactant-associated protein C Human genes 0.000 description 2
- 108010039445 Stem Cell Factor Proteins 0.000 description 2
- 102000006601 Thymidine Kinase Human genes 0.000 description 2
- 102000009190 Transthyretin Human genes 0.000 description 2
- 102000004987 Troponin T Human genes 0.000 description 2
- 108090001108 Troponin T Proteins 0.000 description 2
- 241000269370 Xenopus <genus> Species 0.000 description 2
- 210000001789 adipocyte Anatomy 0.000 description 2
- 108010026331 alpha-Fetoproteins Proteins 0.000 description 2
- 230000003321 amplification Effects 0.000 description 2
- 238000010171 animal model Methods 0.000 description 2
- 229960005070 ascorbic acid Drugs 0.000 description 2
- 235000010323 ascorbic acid Nutrition 0.000 description 2
- 239000011668 ascorbic acid Substances 0.000 description 2
- 210000003969 blast cell Anatomy 0.000 description 2
- 210000002459 blastocyst Anatomy 0.000 description 2
- 210000004369 blood Anatomy 0.000 description 2
- 239000008280 blood Substances 0.000 description 2
- 239000002775 capsule Substances 0.000 description 2
- 230000011712 cell development Effects 0.000 description 2
- 230000008859 change Effects 0.000 description 2
- 230000001332 colony forming effect Effects 0.000 description 2
- 230000001143 conditioned effect Effects 0.000 description 2
- 230000003247 decreasing effect Effects 0.000 description 2
- 230000007547 defect Effects 0.000 description 2
- 238000010586 diagram Methods 0.000 description 2
- 230000008913 ectoderm development Effects 0.000 description 2
- 230000013020 embryo development Effects 0.000 description 2
- 210000002308 embryonic cell Anatomy 0.000 description 2
- 210000000267 erythroid cell Anatomy 0.000 description 2
- 238000011156 evaluation Methods 0.000 description 2
- 230000006870 function Effects 0.000 description 2
- 230000007045 gastrulation Effects 0.000 description 2
- 210000001654 germ layer Anatomy 0.000 description 2
- 210000000777 hematopoietic system Anatomy 0.000 description 2
- 230000006801 homologous recombination Effects 0.000 description 2
- 238000002744 homologous recombination Methods 0.000 description 2
- 238000001727 in vivo Methods 0.000 description 2
- NOESYZHRGYRDHS-UHFFFAOYSA-N insulin Chemical compound N1C(=O)C(NC(=O)C(CCC(N)=O)NC(=O)C(CCC(O)=O)NC(=O)C(C(C)C)NC(=O)C(NC(=O)CN)C(C)CC)CSSCC(C(NC(CO)C(=O)NC(CC(C)C)C(=O)NC(CC=2C=CC(O)=CC=2)C(=O)NC(CCC(N)=O)C(=O)NC(CC(C)C)C(=O)NC(CCC(O)=O)C(=O)NC(CC(N)=O)C(=O)NC(CC=2C=CC(O)=CC=2)C(=O)NC(CSSCC(NC(=O)C(C(C)C)NC(=O)C(CC(C)C)NC(=O)C(CC=2C=CC(O)=CC=2)NC(=O)C(CC(C)C)NC(=O)C(C)NC(=O)C(CCC(O)=O)NC(=O)C(C(C)C)NC(=O)C(CC(C)C)NC(=O)C(CC=2NC=NC=2)NC(=O)C(CO)NC(=O)CNC2=O)C(=O)NCC(=O)NC(CCC(O)=O)C(=O)NC(CCCNC(N)=N)C(=O)NCC(=O)NC(CC=3C=CC=CC=3)C(=O)NC(CC=3C=CC=CC=3)C(=O)NC(CC=3C=CC(O)=CC=3)C(=O)NC(C(C)O)C(=O)N3C(CCC3)C(=O)NC(CCCCN)C(=O)NC(C)C(O)=O)C(=O)NC(CC(N)=O)C(O)=O)=O)NC(=O)C(C(C)CC)NC(=O)C(CO)NC(=O)C(C(C)O)NC(=O)C1CSSCC2NC(=O)C(CC(C)C)NC(=O)C(NC(=O)C(CCC(N)=O)NC(=O)C(CC(N)=O)NC(=O)C(NC(=O)C(N)CC=1C=CC=CC=1)C(C)C)CC1=CN=CN1 NOESYZHRGYRDHS-UHFFFAOYSA-N 0.000 description 2
- 230000010354 integration Effects 0.000 description 2
- 238000012933 kinetic analysis Methods 0.000 description 2
- 108010082117 matrigel Proteins 0.000 description 2
- 239000012528 membrane Substances 0.000 description 2
- MYWUZJCMWCOHBA-VIFPVBQESA-N methamphetamine Chemical compound CN[C@@H](C)CC1=CC=CC=C1 MYWUZJCMWCOHBA-VIFPVBQESA-N 0.000 description 2
- 230000001537 neural effect Effects 0.000 description 2
- 230000007472 neurodevelopment Effects 0.000 description 2
- 210000005044 neurofilament Anatomy 0.000 description 2
- OUBCNLGXQFSTLU-UHFFFAOYSA-N nitisinone Chemical compound [O-][N+](=O)C1=CC(C(F)(F)F)=CC=C1C(=O)C1C(=O)CCCC1=O OUBCNLGXQFSTLU-UHFFFAOYSA-N 0.000 description 2
- 229960001721 nitisinone Drugs 0.000 description 2
- 210000003458 notochord Anatomy 0.000 description 2
- 238000003199 nucleic acid amplification method Methods 0.000 description 2
- 230000008488 polyadenylation Effects 0.000 description 2
- 102000027426 receptor tyrosine kinases Human genes 0.000 description 2
- 108091008598 receptor tyrosine kinases Proteins 0.000 description 2
- 230000002829 reductive effect Effects 0.000 description 2
- 230000002441 reversible effect Effects 0.000 description 2
- 238000005204 segregation Methods 0.000 description 2
- 239000012679 serum free medium Substances 0.000 description 2
- 241000894007 species Species 0.000 description 2
- 238000010186 staining Methods 0.000 description 2
- 210000000130 stem cell Anatomy 0.000 description 2
- UCSJYZPVAKXKNQ-HZYVHMACSA-N streptomycin Chemical compound CN[C@H]1[C@H](O)[C@@H](O)[C@H](CO)O[C@H]1O[C@@H]1[C@](C=O)(O)[C@H](C)O[C@H]1O[C@@H]1[C@@H](NC(N)=N)[C@H](O)[C@@H](NC(N)=N)[C@H](O)[C@H]1O UCSJYZPVAKXKNQ-HZYVHMACSA-N 0.000 description 2
- 238000013518 transcription Methods 0.000 description 2
- 230000035897 transcription Effects 0.000 description 2
- 238000011830 transgenic mouse model Methods 0.000 description 2
- 230000003827 upregulation Effects 0.000 description 2
- 102000010825 Actinin Human genes 0.000 description 1
- 108010063503 Actinin Proteins 0.000 description 1
- 101000642536 Apis mellifera Venom serine protease 34 Proteins 0.000 description 1
- 108010003415 Aspartate Aminotransferases Proteins 0.000 description 1
- 102000004625 Aspartate Aminotransferases Human genes 0.000 description 1
- 108010049955 Bone Morphogenetic Protein 4 Proteins 0.000 description 1
- 108700031361 Brachyury Proteins 0.000 description 1
- 101000583086 Bunodosoma granuliferum Delta-actitoxin-Bgr2b Proteins 0.000 description 1
- 108010051219 Cre recombinase Proteins 0.000 description 1
- 102000004127 Cytokines Human genes 0.000 description 1
- 108090000695 Cytokines Proteins 0.000 description 1
- 241000252212 Danio rerio Species 0.000 description 1
- 102000016911 Deoxyribonucleases Human genes 0.000 description 1
- 108010053770 Deoxyribonucleases Proteins 0.000 description 1
- 206010013801 Duchenne Muscular Dystrophy Diseases 0.000 description 1
- 102000003951 Erythropoietin Human genes 0.000 description 1
- 108090000394 Erythropoietin Proteins 0.000 description 1
- 108700024394 Exon Proteins 0.000 description 1
- 102100037680 Fibroblast growth factor 8 Human genes 0.000 description 1
- 108010017080 Granulocyte Colony-Stimulating Factor Proteins 0.000 description 1
- 102000004269 Granulocyte Colony-Stimulating Factor Human genes 0.000 description 1
- 206010019280 Heart failures Diseases 0.000 description 1
- 102100035961 Hematopoietically-expressed homeobox protein HHEX Human genes 0.000 description 1
- 102000009094 Hepatocyte Nuclear Factor 3-beta Human genes 0.000 description 1
- 108010087745 Hepatocyte Nuclear Factor 3-beta Proteins 0.000 description 1
- 101001066268 Homo sapiens Erythroid transcription factor Proteins 0.000 description 1
- 101001027382 Homo sapiens Fibroblast growth factor 8 Proteins 0.000 description 1
- 101001021503 Homo sapiens Hematopoietically-expressed homeobox protein HHEX Proteins 0.000 description 1
- 101000851007 Homo sapiens Vascular endothelial growth factor receptor 2 Proteins 0.000 description 1
- 102000004877 Insulin Human genes 0.000 description 1
- 108090001061 Insulin Proteins 0.000 description 1
- 102000004889 Interleukin-6 Human genes 0.000 description 1
- OUYCCCASQSFEME-QMMMGPOBSA-N L-tyrosine Chemical compound OC(=O)[C@@H](N)CC1=CC=C(O)C=C1 OUYCCCASQSFEME-QMMMGPOBSA-N 0.000 description 1
- 108010058398 Macrophage Colony-Stimulating Factor Receptor Proteins 0.000 description 1
- 241000124008 Mammalia Species 0.000 description 1
- 102100027754 Mast/stem cell growth factor receptor Kit Human genes 0.000 description 1
- 102000003505 Myosin Human genes 0.000 description 1
- 108060008487 Myosin Proteins 0.000 description 1
- 101150079937 NEUROD1 gene Proteins 0.000 description 1
- 241001045988 Neogene Species 0.000 description 1
- 229930193140 Neomycin Natural products 0.000 description 1
- 206010028980 Neoplasm Diseases 0.000 description 1
- 108091028043 Nucleic acid sequence Proteins 0.000 description 1
- 206010031243 Osteogenesis imperfecta Diseases 0.000 description 1
- 229930182555 Penicillin Natural products 0.000 description 1
- JGSARLDLIJGVTE-MBNYWOFBSA-N Penicillin G Chemical compound N([C@H]1[C@H]2SC([C@@H](N2C1=O)C(O)=O)(C)C)C(=O)CC1=CC=CC=C1 JGSARLDLIJGVTE-MBNYWOFBSA-N 0.000 description 1
- 206010035226 Plasma cell myeloma Diseases 0.000 description 1
- 108010029485 Protein Isoforms Proteins 0.000 description 1
- 102000001708 Protein Isoforms Human genes 0.000 description 1
- 108010076504 Protein Sorting Signals Proteins 0.000 description 1
- 108091034057 RNA (poly(A)) Proteins 0.000 description 1
- 238000011530 RNeasy Mini Kit Methods 0.000 description 1
- 102000004278 Receptor Protein-Tyrosine Kinases Human genes 0.000 description 1
- 108090000873 Receptor Protein-Tyrosine Kinases Proteins 0.000 description 1
- 102000006382 Ribonucleases Human genes 0.000 description 1
- 108010083644 Ribonucleases Proteins 0.000 description 1
- 238000002105 Southern blotting Methods 0.000 description 1
- 108010006785 Taq Polymerase Proteins 0.000 description 1
- 102000036693 Thrombopoietin Human genes 0.000 description 1
- 102100034195 Thrombopoietin Human genes 0.000 description 1
- 108010041111 Thrombopoietin Proteins 0.000 description 1
- 102000004338 Transferrin Human genes 0.000 description 1
- 108090000901 Transferrin Proteins 0.000 description 1
- 108010073929 Vascular Endothelial Growth Factor A Proteins 0.000 description 1
- 239000000654 additive Substances 0.000 description 1
- 230000001919 adrenal effect Effects 0.000 description 1
- 239000011543 agarose gel Substances 0.000 description 1
- 208000007502 anemia Diseases 0.000 description 1
- 230000008901 benefit Effects 0.000 description 1
- 210000002960 bfu-e Anatomy 0.000 description 1
- 210000000601 blood cell Anatomy 0.000 description 1
- 210000000988 bone and bone Anatomy 0.000 description 1
- 210000001185 bone marrow Anatomy 0.000 description 1
- 239000002771 cell marker Substances 0.000 description 1
- 210000004978 chinese hamster ovary cell Anatomy 0.000 description 1
- 238000012790 confirmation Methods 0.000 description 1
- 238000010276 construction Methods 0.000 description 1
- 230000001351 cycling effect Effects 0.000 description 1
- 230000003111 delayed effect Effects 0.000 description 1
- 238000004925 denaturation Methods 0.000 description 1
- 230000036425 denaturation Effects 0.000 description 1
- 230000001419 dependent effect Effects 0.000 description 1
- 230000001627 detrimental effect Effects 0.000 description 1
- 206010012601 diabetes mellitus Diseases 0.000 description 1
- 238000009510 drug design Methods 0.000 description 1
- 230000002526 effect on cardiovascular system Effects 0.000 description 1
- 230000000487 effect on differentiation Effects 0.000 description 1
- 230000000431 effect on proliferation Effects 0.000 description 1
- 210000002257 embryonic structure Anatomy 0.000 description 1
- 210000003038 endothelium Anatomy 0.000 description 1
- 210000000981 epithelium Anatomy 0.000 description 1
- 229940105423 erythropoietin Drugs 0.000 description 1
- 230000001605 fetal effect Effects 0.000 description 1
- 238000005194 fractionation Methods 0.000 description 1
- 238000002825 functional assay Methods 0.000 description 1
- IRSCQMHQWWYFCW-UHFFFAOYSA-N ganciclovir Chemical compound O=C1NC(N)=NC2=C1N=CN2COC(CO)CO IRSCQMHQWWYFCW-UHFFFAOYSA-N 0.000 description 1
- 229960002963 ganciclovir Drugs 0.000 description 1
- 239000011521 glass Substances 0.000 description 1
- 108060003196 globin Proteins 0.000 description 1
- 150000004676 glycans Chemical class 0.000 description 1
- 230000012010 growth Effects 0.000 description 1
- 230000036541 health Effects 0.000 description 1
- 210000005003 heart tissue Anatomy 0.000 description 1
- 102000055590 human KDR Human genes 0.000 description 1
- 210000005260 human cell Anatomy 0.000 description 1
- 238000009396 hybridization Methods 0.000 description 1
- 210000004408 hybridoma Anatomy 0.000 description 1
- 230000002163 immunogen Effects 0.000 description 1
- 230000016784 immunoglobulin production Effects 0.000 description 1
- 238000012744 immunostaining Methods 0.000 description 1
- 238000010874 in vitro model Methods 0.000 description 1
- 230000002779 inactivation Effects 0.000 description 1
- 238000011534 incubation Methods 0.000 description 1
- 230000002401 inhibitory effect Effects 0.000 description 1
- 230000000977 initiatory effect Effects 0.000 description 1
- 229940125396 insulin Drugs 0.000 description 1
- 210000004153 islets of langerhan Anatomy 0.000 description 1
- 238000002372 labelling Methods 0.000 description 1
- 208000032839 leukemia Diseases 0.000 description 1
- 239000003446 ligand Substances 0.000 description 1
- 230000031142 liver development Effects 0.000 description 1
- 239000000463 material Substances 0.000 description 1
- 238000010208 microarray analysis Methods 0.000 description 1
- 230000001617 migratory effect Effects 0.000 description 1
- 230000009456 molecular mechanism Effects 0.000 description 1
- 238000012544 monitoring process Methods 0.000 description 1
- PJUIMOJAAPLTRJ-UHFFFAOYSA-N monothioglycerol Chemical compound OCC(O)CS PJUIMOJAAPLTRJ-UHFFFAOYSA-N 0.000 description 1
- 230000000921 morphogenic effect Effects 0.000 description 1
- 230000035772 mutation Effects 0.000 description 1
- 201000000050 myeloid neoplasm Diseases 0.000 description 1
- 101150091879 neo gene Proteins 0.000 description 1
- 229960004927 neomycin Drugs 0.000 description 1
- 210000000653 nervous system Anatomy 0.000 description 1
- 230000014511 neuron projection development Effects 0.000 description 1
- 230000004031 neuronal differentiation Effects 0.000 description 1
- 210000004789 organ system Anatomy 0.000 description 1
- 210000000496 pancreas Anatomy 0.000 description 1
- 230000015031 pancreas development Effects 0.000 description 1
- 230000037361 pathway Effects 0.000 description 1
- 229940049954 penicillin Drugs 0.000 description 1
- 238000007747 plating Methods 0.000 description 1
- 229920000642 polymer Polymers 0.000 description 1
- 229920001184 polypeptide Polymers 0.000 description 1
- 229920001282 polysaccharide Polymers 0.000 description 1
- 239000005017 polysaccharide Substances 0.000 description 1
- OXCMYAYHXIHQOA-UHFFFAOYSA-N potassium;[2-butyl-5-chloro-3-[[4-[2-(1,2,4-triaza-3-azanidacyclopenta-1,4-dien-5-yl)phenyl]phenyl]methyl]imidazol-4-yl]methanol Chemical compound [K+].CCCCC1=NC(Cl)=C(CO)N1CC1=CC=C(C=2C(=CC=CC=2)C2=N[N-]N=N2)C=C1 OXCMYAYHXIHQOA-UHFFFAOYSA-N 0.000 description 1
- 210000001811 primitive streak Anatomy 0.000 description 1
- 102000004196 processed proteins & peptides Human genes 0.000 description 1
- 108090000765 processed proteins & peptides Proteins 0.000 description 1
- 230000002250 progressing effect Effects 0.000 description 1
- 230000000750 progressive effect Effects 0.000 description 1
- 102000005962 receptors Human genes 0.000 description 1
- 108020003175 receptors Proteins 0.000 description 1
- 238000011160 research Methods 0.000 description 1
- 230000004044 response Effects 0.000 description 1
- 238000010839 reverse transcription Methods 0.000 description 1
- 238000012216 screening Methods 0.000 description 1
- 238000000926 separation method Methods 0.000 description 1
- 239000004017 serum-free culture medium Substances 0.000 description 1
- 150000003384 small molecules Chemical class 0.000 description 1
- 239000007787 solid Substances 0.000 description 1
- 238000010561 standard procedure Methods 0.000 description 1
- 229960005322 streptomycin Drugs 0.000 description 1
- 239000000758 substrate Substances 0.000 description 1
- 239000000725 suspension Substances 0.000 description 1
- 239000012581 transferrin Substances 0.000 description 1
- 230000001052 transient effect Effects 0.000 description 1
- 238000013519 translation Methods 0.000 description 1
- 239000002753 trypsin inhibitor Substances 0.000 description 1
- OUYCCCASQSFEME-UHFFFAOYSA-N tyrosine Natural products OC(=O)C(N)CC1=CC=C(O)C=C1 OUYCCCASQSFEME-UHFFFAOYSA-N 0.000 description 1
- 230000002792 vascular Effects 0.000 description 1
- 230000006459 vascular development Effects 0.000 description 1
- 208000019553 vascular disease Diseases 0.000 description 1
Images











Classifications
-
- C—CHEMISTRY; METALLURGY
- C12—BIOCHEMISTRY; BEER; SPIRITS; WINE; VINEGAR; MICROBIOLOGY; ENZYMOLOGY; MUTATION OR GENETIC ENGINEERING
- C12N—MICROORGANISMS OR ENZYMES; COMPOSITIONS THEREOF; PROPAGATING, PRESERVING, OR MAINTAINING MICROORGANISMS; MUTATION OR GENETIC ENGINEERING; CULTURE MEDIA
- C12N5/00—Undifferentiated human, animal or plant cells, e.g. cell lines; Tissues; Cultivation or maintenance thereof; Culture media therefor
- C12N5/06—Animal cells or tissues; Human cells or tissues
- C12N5/0602—Vertebrate cells
- C12N5/0603—Embryonic cells ; Embryoid bodies
- C12N5/0606—Pluripotent embryonic cells, e.g. embryonic stem cells [ES]
-
- A—HUMAN NECESSITIES
- A61—MEDICAL OR VETERINARY SCIENCE; HYGIENE
- A61P—SPECIFIC THERAPEUTIC ACTIVITY OF CHEMICAL COMPOUNDS OR MEDICINAL PREPARATIONS
- A61P1/00—Drugs for disorders of the alimentary tract or the digestive system
- A61P1/16—Drugs for disorders of the alimentary tract or the digestive system for liver or gallbladder disorders, e.g. hepatoprotective agents, cholagogues, litholytics
-
- A—HUMAN NECESSITIES
- A61—MEDICAL OR VETERINARY SCIENCE; HYGIENE
- A61P—SPECIFIC THERAPEUTIC ACTIVITY OF CHEMICAL COMPOUNDS OR MEDICINAL PREPARATIONS
- A61P17/00—Drugs for dermatological disorders
-
- A—HUMAN NECESSITIES
- A61—MEDICAL OR VETERINARY SCIENCE; HYGIENE
- A61P—SPECIFIC THERAPEUTIC ACTIVITY OF CHEMICAL COMPOUNDS OR MEDICINAL PREPARATIONS
- A61P19/00—Drugs for skeletal disorders
-
- A—HUMAN NECESSITIES
- A61—MEDICAL OR VETERINARY SCIENCE; HYGIENE
- A61P—SPECIFIC THERAPEUTIC ACTIVITY OF CHEMICAL COMPOUNDS OR MEDICINAL PREPARATIONS
- A61P21/00—Drugs for disorders of the muscular or neuromuscular system
- A61P21/04—Drugs for disorders of the muscular or neuromuscular system for myasthenia gravis
-
- A—HUMAN NECESSITIES
- A61—MEDICAL OR VETERINARY SCIENCE; HYGIENE
- A61P—SPECIFIC THERAPEUTIC ACTIVITY OF CHEMICAL COMPOUNDS OR MEDICINAL PREPARATIONS
- A61P3/00—Drugs for disorders of the metabolism
- A61P3/08—Drugs for disorders of the metabolism for glucose homeostasis
- A61P3/10—Drugs for disorders of the metabolism for glucose homeostasis for hyperglycaemia, e.g. antidiabetics
-
- A—HUMAN NECESSITIES
- A61—MEDICAL OR VETERINARY SCIENCE; HYGIENE
- A61P—SPECIFIC THERAPEUTIC ACTIVITY OF CHEMICAL COMPOUNDS OR MEDICINAL PREPARATIONS
- A61P35/00—Antineoplastic agents
- A61P35/02—Antineoplastic agents specific for leukemia
-
- A—HUMAN NECESSITIES
- A61—MEDICAL OR VETERINARY SCIENCE; HYGIENE
- A61P—SPECIFIC THERAPEUTIC ACTIVITY OF CHEMICAL COMPOUNDS OR MEDICINAL PREPARATIONS
- A61P43/00—Drugs for specific purposes, not provided for in groups A61P1/00-A61P41/00
-
- A—HUMAN NECESSITIES
- A61—MEDICAL OR VETERINARY SCIENCE; HYGIENE
- A61P—SPECIFIC THERAPEUTIC ACTIVITY OF CHEMICAL COMPOUNDS OR MEDICINAL PREPARATIONS
- A61P7/00—Drugs for disorders of the blood or the extracellular fluid
- A61P7/06—Antianaemics
-
- A—HUMAN NECESSITIES
- A61—MEDICAL OR VETERINARY SCIENCE; HYGIENE
- A61P—SPECIFIC THERAPEUTIC ACTIVITY OF CHEMICAL COMPOUNDS OR MEDICINAL PREPARATIONS
- A61P9/00—Drugs for disorders of the cardiovascular system
-
- A—HUMAN NECESSITIES
- A61—MEDICAL OR VETERINARY SCIENCE; HYGIENE
- A61P—SPECIFIC THERAPEUTIC ACTIVITY OF CHEMICAL COMPOUNDS OR MEDICINAL PREPARATIONS
- A61P9/00—Drugs for disorders of the cardiovascular system
- A61P9/04—Inotropic agents, i.e. stimulants of cardiac contraction; Drugs for heart failure
-
- C—CHEMISTRY; METALLURGY
- C12—BIOCHEMISTRY; BEER; SPIRITS; WINE; VINEGAR; MICROBIOLOGY; ENZYMOLOGY; MUTATION OR GENETIC ENGINEERING
- C12N—MICROORGANISMS OR ENZYMES; COMPOSITIONS THEREOF; PROPAGATING, PRESERVING, OR MAINTAINING MICROORGANISMS; MUTATION OR GENETIC ENGINEERING; CULTURE MEDIA
- C12N5/00—Undifferentiated human, animal or plant cells, e.g. cell lines; Tissues; Cultivation or maintenance thereof; Culture media therefor
- C12N5/06—Animal cells or tissues; Human cells or tissues
- C12N5/0602—Vertebrate cells
- C12N5/0603—Embryonic cells ; Embryoid bodies
-
- G—PHYSICS
- G01—MEASURING; TESTING
- G01N—INVESTIGATING OR ANALYSING MATERIALS BY DETERMINING THEIR CHEMICAL OR PHYSICAL PROPERTIES
- G01N33/00—Investigating or analysing materials by specific methods not covered by groups G01N1/00 - G01N31/00
- G01N33/48—Biological material, e.g. blood, urine; Haemocytometers
- G01N33/50—Chemical analysis of biological material, e.g. blood, urine; Testing involving biospecific ligand binding methods; Immunological testing
- G01N33/5005—Chemical analysis of biological material, e.g. blood, urine; Testing involving biospecific ligand binding methods; Immunological testing involving human or animal cells
- G01N33/5008—Chemical analysis of biological material, e.g. blood, urine; Testing involving biospecific ligand binding methods; Immunological testing involving human or animal cells for testing or evaluating the effect of chemical or biological compounds, e.g. drugs, cosmetics
- G01N33/5044—Chemical analysis of biological material, e.g. blood, urine; Testing involving biospecific ligand binding methods; Immunological testing involving human or animal cells for testing or evaluating the effect of chemical or biological compounds, e.g. drugs, cosmetics involving specific cell types
- G01N33/5073—Stem cells
-
- C—CHEMISTRY; METALLURGY
- C12—BIOCHEMISTRY; BEER; SPIRITS; WINE; VINEGAR; MICROBIOLOGY; ENZYMOLOGY; MUTATION OR GENETIC ENGINEERING
- C12N—MICROORGANISMS OR ENZYMES; COMPOSITIONS THEREOF; PROPAGATING, PRESERVING, OR MAINTAINING MICROORGANISMS; MUTATION OR GENETIC ENGINEERING; CULTURE MEDIA
- C12N2500/00—Specific components of cell culture medium
- C12N2500/90—Serum-free medium, which may still contain naturally-sourced components
-
- C—CHEMISTRY; METALLURGY
- C12—BIOCHEMISTRY; BEER; SPIRITS; WINE; VINEGAR; MICROBIOLOGY; ENZYMOLOGY; MUTATION OR GENETIC ENGINEERING
- C12N—MICROORGANISMS OR ENZYMES; COMPOSITIONS THEREOF; PROPAGATING, PRESERVING, OR MAINTAINING MICROORGANISMS; MUTATION OR GENETIC ENGINEERING; CULTURE MEDIA
- C12N2501/00—Active agents used in cell culture processes, e.g. differentation
- C12N2501/10—Growth factors
- C12N2501/16—Activin; Inhibin; Mullerian inhibiting substance
-
- C—CHEMISTRY; METALLURGY
- C12—BIOCHEMISTRY; BEER; SPIRITS; WINE; VINEGAR; MICROBIOLOGY; ENZYMOLOGY; MUTATION OR GENETIC ENGINEERING
- C12N—MICROORGANISMS OR ENZYMES; COMPOSITIONS THEREOF; PROPAGATING, PRESERVING, OR MAINTAINING MICROORGANISMS; MUTATION OR GENETIC ENGINEERING; CULTURE MEDIA
- C12N2501/00—Active agents used in cell culture processes, e.g. differentation
- C12N2501/40—Regulators of development
- C12N2501/415—Wnt; Frizzeled
-
- C—CHEMISTRY; METALLURGY
- C12—BIOCHEMISTRY; BEER; SPIRITS; WINE; VINEGAR; MICROBIOLOGY; ENZYMOLOGY; MUTATION OR GENETIC ENGINEERING
- C12N—MICROORGANISMS OR ENZYMES; COMPOSITIONS THEREOF; PROPAGATING, PRESERVING, OR MAINTAINING MICROORGANISMS; MUTATION OR GENETIC ENGINEERING; CULTURE MEDIA
- C12N2506/00—Differentiation of animal cells from one lineage to another; Differentiation of pluripotent cells
- C12N2506/02—Differentiation of animal cells from one lineage to another; Differentiation of pluripotent cells from embryonic cells
Definitions
- the tissues of the body are formed from three major cell populations: ectoderm, mesoderm and definitive endoderm. These cell populations, also known as primary germ cell layers, are formed through a process known as gastrulation. Following gastrulation, each primary germ cell layer generates a specific set of cell populations and tissues.
- Mesoderm gives rise to blood cells, endothelial cells, cardiac and skeletal muscle, and adipocytes. Definitive endoderm generates liver, pancreas and lung.
- Ectoderm gives rise to the nervous system, skin and adrenal tissues.
- the process of tissue development from these germ cell layers involves multiple differentiation steps, reflecting complex molecular changes.
- mesoderm and its derivatives three distinct stages have been defined.
- the first is the induction of mesoderm from cells within a structure known as the epiblast.
- the newly formed mesoderm also known as nascent mesoderm, migrates to different positions that will be sites of future tissue development in the early embryo.
- This process entails some molecular changes that are likely reflective of the initial stages of differentiation towards specific tissues.
- the final stage known as specification, involves the generation of distinct tissues from the patterned mesodermal subpopulations. Recent studies have provided evidence which suggests that mesoderm is induced in successive waves which represent subpopulations with distinct developmental potential.
- the mesoderm that is formed first migrates to the extraembryonic region and gives rise to hematopoietic and endothelial cells, whereas the next population migrates anteriorly in the developing embryo and contributes to the heart and cranial mesenchyme.
- These lineage relationships were defined initially through histological analysis and have been largely confirmed by cell tracing studies. While this segregation of developmental fates is well accepted in the field of developmental biology, to date, there are no available methods of isolating mesoderm and endoderm, prior to commitment to these lineages.
- the present invention provides a method for isolating mesoderm and definitive endoderm cell populations. These cell populations are useful to identify agents that affect cell growth and differentiation, to identify genes involved in tissue development, and to generate differentiated cells and tissues for cell replacement therapies.
- the present invention provides cell populations that are enriched for mesendoderm and mesoderm cells.
- Mesendoderm cells are defined herein as cells that express brachyury (brach + ) and which, in the presence of differentiation-inducing conditions, are capable of generating mesoderm and mesoderm derivatives including cardiac and skeletal muscle, vascular smooth muscle, endothelium and hematopoietic cells, and also are capable of generating endoderm and endoderm derivatives including liver cells and pancreatic cells.
- Mesoderm cells are defined herein as cells that are brach + and which, in the presence of differentiation inducing conditions, are capable of generating cardiac and skeletal muscle, vascular smooth muscle, endothelium and hematopoietic cells, and are not capable of generating endoderm and endoderm derivatives.
- the present invention further provides cell populations that are enriched for endoderm cells.
- Endoderm cells are defined herein as cells that do not express brachyury (brach - ) and which, in the presence of differentiation-inducing conditions, are capable of generating lung cells, liver cells and pancreatic cells.
- the present invention also provides methods of isolating cell populations enriched for mesendoderm and mesoderm cells, and cell populations enriched for endoderm cells.
- the present invention provides methods of identifying agents that affect the proliferation, differentiation or survival of the cell populations of the invention.
- a method of identifying genes involved in cell differentiation and development of specific lineages and tissues is also provided.
- Antibodies that specifically recognize brach + cells are also provided.
- the antibodies are useful, for example, for isolating mesendoderm and mesoderm cell populations.
- the present invention provides a method for generating cells in vitro. Such cells are useful, for example, for cell replacement therapy.
- the present invention also provides a transgenic non-human mammal having a genome in which DNA encoding a selectable marker is present in the brachyury locus such that one brachyury allele is inactivated and the selectable marker is expressed in cells in which the brachyury locus is transcribed.
- mesoderm During embryogenesis, the formation of mesoderm is a critical step in the establishment of a body plan and in the development of multiple organ systems such as blood, endothelium, heart and skeletal muscle.
- the molecular mechanisms that control mesoderm formation are poorly defined.
- a model system based upon the differentiation of embryonic stem (ES) cells in culture has been used to study mesodermal-derived populations including hematopoietic, endothelial, cardiac and skeletal muscle and adipocyte lineages.
- the in vitro model supports the induction and specification of mesoderm, but these differentiation events take place in complex colonies known as embryoid bodies (EBs) generated from ES cells.
- EBs embryoid bodies
- mesoderm cell populations from EBs as they are formed, in order to better understand mesoderm formation and tissue development.
- Brachyury also known as T is the founding member of a family of transcription factors known as T-box genes and was first identified as a naturally occurring mutation in mice. Papaioannou et al. (1998) Bioessays 20:9-19 . Heterozygous mice are viable but have a shorter tail than wild type animals. Homozygous mutants, which die at approximately day 10 p.c., lack a notochord and display defects in the development of posterior mesodermal tissues. Through the analysis of chimeric animals, brachyury has been shown to affect the migratory properties of the mesodermal cells. Wilson et al. (1995) Development 121:877-86 . Expression analysis revealed a unique and interesting pattern for brachyury.
- a selectable marker gene has been recombinantly targeted to the brachyury locus. It has been discovered that, following the initiation of ES cell differentiation, the selectable marker is expressed in a pattern that reflects brachyury expression.
- the selectable marker has allowed the sorting of brachyury positive (Brach + ) cells from EBs, and thereby the isolation and characterization of cell populations that are enriched for mesendoderm and mesoderm cells.
- the selectable marker exemplified in accordance with the present invention is the enhanced green fluorescence protein (EGFP or GFP).
- EGFP enhanced green fluorescence protein
- Other selectable markers that will facilitate cell sorting are known to those of ordinary skill in the art and may be used in the present invention.
- the cDNA encoding GFP is known in the art (and is commercially available, for example as plasmid pEGFP.C1 from Clontech, Palo Alto, CA), and may be targeted to the brachyury locus by constructing targeting vectors (GFP-Bry) by methods known in the art.
- the vectors are preferably designed to replace approximately two-thirds of the first exon of the brachyury gene with a GFP expression cassette.
- the GFP expression cassette preferably contains GFP cDNA and one or more translational stop codons to prevent translation of downstream brachyury exons.
- the cassette may further contain an exon encoding the SV40 polyadenylation signal sequence to prevent transcription of downstream regions of the brachyury gene.
- ES cells are introduced into ES cells by methods known in the art to integrate the GFP-Bry construct by homologous recombination.
- ES cells may be isolated from blastocysts by methods known in the art and disclosed for example by Evans et al. (1981) Nature 292:154-156 , Thomson et al. (1995) Proc. Nat'1. Acad. Sci. USA 92; 7844 ; U.S. Pat. No. 5,843,780 ; and Reubinoff et al. (2000) Nature Biotech. 18:399 .
- the ES cells are mouse or human ES cells.
- GFP-Bry ES cells are defined herein as ES cells in which one brachyury allele is inactivated and GFP is expressed under the control of the brachyury regulatory elements.
- GFP-Bry ES cells in which one brachyury allele is inactivated, are viable and develop and differentiate normally. Further, it has been discovered that GFP expression mirrors endogenous brachyury expression. Accordingly, brach + cells may be isolated by selecting for cells that express GFP. Cells that express GFP may conveniently be isolated by flow cytometry, for example by fluorescence-activated cell sorting (FACS).Methods for sorting cells based on fluorescent properties are well-known to those of ordinary skill in the art.
- FACS fluorescence-activated cell sorting
- Cell populations that are enriched for mesendoderm and mesoderm cells may be obtained by culturing GFP-Bry ES cells in the presence of serum for a time sufficient to obtain GFP + cells, for example for from about one to about four days for mouse cells, and sorting and isolating GFP + cells, for example by flow cytometry.
- the cell population that is isolated contains at least about 50%, and preferably at least about 75%, and more preferably at least about 90%, and most preferably at least about 95% or at least about 99% mesendoderm and mesoderm cells.
- the relative amounts of mesendoderm and mesoderm may be varied by adjusting the length of the culture in serum, with shorter culture times favoring the presence of mesendoderm and mesoderm patterned to the hematopoietic and endothelial lineages, and longer culture times favoring the presence of mesoderm patterned to the cardiac and skeletal muscle lineages.
- a cell population enriched for mesoderm may be obtained by culturing in serum for about 2.5 to 4.5 days, followed by sorting and isolating GFP + cells. Culturing in the presence of serum is defined herein as culturing in media supplemented with animal serum, for example fetal calf serum (FCS). In a preferred embodiment, the media is supplemented with from about 5% to about 25% serum.
- FCS fetal calf serum
- the optimal concentration may be serum batch dependent and can be determined by one of ordinary skill in the art.
- GFP-Bry ES cells generated from human ES cells may be obtained from GFP-Bry ES cells generated from human ES cells by a similar method in which the length of time of culture in serum is lengthened to account for difference in times of differentiation in vitro for human and mouse cells. Accordingly, GFP-Bry ES cells generated from human ES cells are cultured in serum for a time sufficient to obtain GFP + cells, for example about 2 to about 18 days, before sorting and isolating GFP + cells.
- KDR and Flk-1 are not expressed in mesendoderm and nascent mesoderm, but as these cells differentiate to a hemangioblast/pre-erythroid population, KDR or Flk-1 expression is detectable.
- KDR + and flk-1 + cells may be identified by flow cytometry using antibodies to KDR or Flk-1. Such antibodies are known in the art, and may also be generated using standard methods of antibody production.
- the cell populations enriched for mesendoderm and mesoderm may be further enriched by removing KDR + or Flk-1 + cells by cell sorting.
- mesendoderm is a previously unidentified cell population that gives rise to both endoderm and mesoderm and their corresponding lineages. It has been further discovered that presence or absence of serum in the in vitro culture may be used to dictate which lineage is generated from mesendoderm.
- a cell population that is enriched for endoderm cells may be obtained by culturing GFP-Bry ES cells generated from mouse ES cells in the presence of serum for about two to four days, sorting and isolating GFP + cells, for example by flow cytometry, followed by culturing the GFP in the absence of serum for from about one to about ten days.
- the cell population that is isolated contains at least 50%, and preferably at least about 75%, and more preferably at least about 90%, and most preferably at least about 95% or at least about 99% endoderm cells, as defined hereinabove.
- Cell populations that are enriched for endoderm cells may be obtained from GFP-Bry ES cells generated from human ES cells by culturing the GFP-Bry ES cells in the presence of serum for about 2 to 10 days, and then sorting and isolating GFP + cells followed by culturing the GFP + cells in the absence of serum for from about 1 to about 15 days.
- the populations enriched for endoderm cells may be further enriched by identifying and sorting out KDR + or Flk-1 + cells as described above.
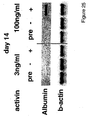
- cell populations enriched for endoderm may be obtained by culturing GFP-Bry embryonic stem cells in the absence of serum and in the presence of the growth factor activin, for about two to about ten days, and isolating cells that express brachyury.
- the amount of activin is sufficient to induce differentiation of embryonic stem cells to endoderm.
- Such differentiation may be measured by assaying for the expression of genes associated with endoderm development, including for example HNF3 ⁇ , Mixl-1, Sox17, Hex-1 or pdx-1.
- the concentration of activin is at least about 30 ng/ml. In another preferred embodiment the concentration of activin is about 100 ng/ml.
- Cell populations enriched for mesoderm may be obtained by culturing GFP-Bry embryonic stem cells in the absence of serum and the presence of activin for about two to about ten days, and isolating cells that express brachyury.
- the amount of activin is sufficient to induce differentiation of embryonic stem cells to mesoderm, but insufficient to induce differentiation to endoderm.
- Differentiation to mesoderm may be measured by assaying for the expression of genes associated with mesoderm development, including for example GATA-1, and the absence of expression of genes associated with endoderm development.
- the concentration of activin is less than 30 ng/ml. In another preferred embodiment the concentration of activin is about 3 ng/ml.
- the present invention further provides a method of identifying agents that affect the proliferation, differentiation or survival of the cell populations described above.
- the method comprises culturing cells from one of the cell populations described hereinabove in the absence and presence of an agent to be tested, and determining whether the agent has an effect on proliferation, differentiation or survival of the cell population.
- the agent to be tested may be natural or synthetic, one compound or a mixture, a small molecule or polymer including polypeptides, polysaccharides, polynucleutides and the like, an antibody or fragment thereof, a compound from a library of natural or synthetic compounds, a compound obtained from rational drug design, or any agent the effect of which on the cell population may be assessed using assays known in the art, for example standard proliferation and differentiation assays as described in U.S. Patent No. 6,110,739 . Such agents are useful for the control of cell growth and differentiation in vivo and in vitro.
- the present invention further provides a method of identifying genes involved in cell differentiation and development of specific lineages and tissues.
- the method comprises isolating populations of GFP + cells of the invention after different amounts of time in culture, comparing gene expression profiles in the different populations, and identifying genes that are uniquely expressed in a population.
- microarray analysis and subtractive hybridization are used to compare gene expression profiles.
- the present invention provides methods of making antibodies that recognize brachyury positive (brach + ) cells but not brachyury negative (brach - ) cells.
- Polyclonal antibodies may be made by injecting an animal with the cells of the invention in an immunogenic form.
- antibodies may be made by identifying cells surface markers present in GFP + but not GFP - cells, and making antibodies against the markers or fragments thereof.
- the antibodies may be monoclonal or polyclonal, and may be fragments, genetically engineered antibodies, single chain antibodies, and so on.
- Antibodies may be made by methods well-known in the art. Such antibodies are useful for identifying and isolating brach + cells such as mesendoderm and mesoderm.
- the present invention also provides a method for generating mammalian cells in vitro.
- the method comprises culturing cells from a cell population enriched in mesendoderm and mesoderm cells under conditions effective for the differentiation of mesoderm into cardiac muscle, vascular smooth muscle, endothelium or hematopoietic cells. Conditions effective for differentiation into the various cell types in vitro are known in the art.
- the method comprises culturing cells from a cell population enriched in endoderm cells under conditions effective for the differentiation of endoderm into liver cells or pancreatic cells. Effective conditions for such differentiation are known in the art. The production of insulin-producing pancreatic islet cells is specifically contemplated.
- brach + cells isolated from different aged EBs have different developmental potentials.
- Brach + /Flk - cells from about day 3 mouse EBs efficiently generate hemotopoietic and endothelial lineages, while the cells from about day 3 to 10 EBs generate cells of cardiomyocyte lineages. Accordingly, by adjusting the time of culture of the ES cells used for obtaining the cell population enriched for mesendoderm and mesoderm, one of ordinary skill in the art can select for efficient production of hemotopoetic and endothelial lineages or cardiomyocyte lineages.
- Such cells are useful, for example, for cell replacement therapy for the treatment of disorders that result from destruction or dysfunction of a limited number of cell types.
- disorders include diabetes mellitus, liver failure, heart failure, cardiovascular and other vascular disease, Duchenne's muscular dystrophy, osteogenesis imperfecta, and disorders treatable by bone marrow transplant, for example leukemias and anemias. See, Odorico et al., (2001) Stem Cells 19:193-204 .
- the cell populations of the present invention are useful for generating differentiated cells and tissues for cell replacement therapies.
- the suitability of the cell populations of the present invention for cell replacement therapy may be assessed by transplanting the cells into animal models of disorders that are associated with the destruction or dysfunction of a limited number of cell types.
- the fumarylacetoacetate (FAH) deficient mouse disclosed for example by Grompe et al. (1993) Genes & Dev. 7:2298 , incorporated herein by reference, provides a model for liver failure.
- FAH deficient mice suffer from progressive liver failure and renal tubular damage unless treated with NTBC (2-(2-nitro-4-trifluoromethyl benzoyl) -1,3-cyclohexedione) or transplanted with normal hepatocytes.
- mice thus provide an ideal model for testing the potential of cells with characteristics of immature hepatocytes generated from EBs.
- Methods for transplantation of hepatocytes into FAH deficient mice removed from NTBC are known in the art and disclosed for example by Oversturf et al. (1996) Nature Genet. 12:266-273 .
- Normal liver function is indicated by survival of the mice, and may also be assessed by measuring serum aspartate transaminase levels, plasma bilirubin levels, and by determining normal structure of the regenerated liver.
- the present invention also provides a transgenic non-human mammal in which DNA encoding a selectable marker is present in the brachyury locus such that one brachyury allele is inactivated and the selectable marker is expressed in cells in which the brachyury locus is transcribed.
- the mammal is a mouse and the selectable marker is GFP.
- the transgenic mouse has a genome comprising a transgene in which a DNA sequence encoding GFP is operably linked to brachyury regulatory elements, and the transgene is expressed in cells that normally express brachyury.
- the transgenic mouse may be obtained by injecting the GFP-Bry ES cells described hereinabove into blastocysts, which are then implanted into pseudopregnant females.
- Transgenic pups are identified by the short-tail phenotype associated with brach +/-, and by molecular analysis.
- Such transgenic animals are useful for obtaining early embryos from which to isolate mesoderm to be used in accordance with the methods of the invention, and for the identification, isolation and characterization of any adult cell populations that express the brachyury gene.
- Such cells may represent novel stem cell populations.
- ES cell growth and differentiation ES cells were maintained on irradiated embryonic feeder cells in Dulbecco's Modified Eagle Medium (DMEM) supplemented with 15% fetal calf serum (FCS), penicillin, streptomycin, LIF (1% conditioned medium) and 1.5 x 10 -4 M monothioglycerol (MTG; Sigma). Two days prior to the onset of differentiation, cells were transferred on gelatinized plates in the same media. For the generation of EBs, ES cells were trypsinized and plated at various densities in differentiation cultures.
- DMEM Dulbecco's Modified Eagle Medium
- FCS fetal calf serum
- MIF fetal calf serum
- MMG 1% conditioned medium
- MMG monothioglycerol
- EBs Differentiation of EBs was carried out in 60 mm petri grade dishes in IMDM supplemented with 15% FCS, 2mM L-glutamine (Gibco/BRL), transferrin (200 ug/ml), 0.5mM ascorbic acid (Sigma), and 4.5 x 10 -4 M MTG. Cultures were maintained in a humidified chamber in a 5% CO 2 /air mixture at 37°C.
- Serum Free Medium Two different serum-free media were used in different aspects of the following examples: IIMD supplemented with Knockout SR (Gibco BRL) and StemPro 34 (Gibco BRL).
- Blast colonies For the generation of blast cell colonies (BL-CFC assay), EB-derived cells were plated at 0.5 x - 1.5 x 10 5 cells/ml in 1% methylcellulose supplemented with 10% FCS (Hyclone), vascular endothelial growth factor (VEGF; 5 ng/ml), c-kit ligand (KL; 1% conditioned medium), IL-6 (5ng/ml) and 25% D4T endothelial cell conditioned medium ( Kennedy et al. (1997) Nature 386:488-93 ). Transitional colonies were generated in the absence of VEGF. Colonies were scored following four days of culture.
- FCS Hyclone
- VEGF vascular endothelial growth factor
- KL 1% conditioned medium
- IL-6 5ng/ml
- Transitional colonies were generated in the absence of VEGF. Colonies were scored following four days of culture.
- hematopoietic colonies For the growth of primitive and definitive hematopoietic colonies, cells were plated in 1% methylcellulose containing 10% plasma-derived serum (PDS; Antech), 5% protein-free hybridoma medium (PFHM-II; Gibco-BRL) plus the following cytokines: c-kit ligand (KL; 1% conditioned medium), erythropoietin (2 U/ml), IL-11 (25 ng/ml), IL-3 (1% conditioned medium), GM-CSF (3 ng/ml), G-CSF (30 ng/ml), M-CSF (5 ng/ml), IL-6 (5 ng/ml) and thrombopoietin (TPO; 5ng/ml).
- PDS plasma-derived serum
- PFHM-II protein-free hybridoma medium
- TPO thrombopoietin
- C-kit ligand was derived from media conditioned by CHO cells transfected with KL expression vector (kindly provided by Genetics Institute).
- IL-3 was obtained from medium conditioned by X63 AG8-653 myeloma cells transfected with a vector expressing IL-3.
- VEGF, GM-CSF, M-CSF, IL-6 ,IL-11, activin BMP2, BMP4, bFGF, FGF8, and lhh were purchased from R&D systems.
- GFP + cells were reaggregated in IMDM supplemented with 15% serum replacement. Twenty hours later the aggregates were cultured in wells of either a 24- or 96-well plate in IMDM with 10% serum replacement (serum-free). The wells were pre-treated with gelatin. Cultured were monitored daily for the development of the appearance of beating cells. Beating cells were usually detected between days 2 and 6 of culture.
- ⁇ -H1-specific probe was prepared by annealing two oligonucleotides, (5'-TGGAGTCAAAGAGGGCATCATAGACACATGGG-3', 5'-CAGTACACTGGCAATCCCATGTG-3') which share an 8 base homology at their 3' termini. This ⁇ -H1 specific otigonucleotide was labeled with 32 P using a Klenow fill-in reaction.
- Cycling conditions were as follows; 94 °C for 5 min followed by 35 cycles of amplification (94 °C denaturation for 1 min, 60 °C annealing for 1 min, 72 °C elongation for 1 min) with a final incubation at 72 °C for 7 min.
- embryonic stem (ES) cells will differentiate and form three dimensional colonies known as embryoid bodies (EBs) that contain developing cell populations from a broad spectrum of lineages. Smith (2001) Annu. Rev. Cell Dev. Biol. 17:435-62 . Among these EB-derived populations, one can detect mesodermal derivatives including those of the hematopoietic, endothelial, cardiac muscle and skeletal muscle lineages.
- the targeting construct contained the GFP cDNA, and artificial intron, SV40 poly(A) sequences and a loxP flanked neo cassette in the first exon and is depicted in Fig. 1 .
- the thymidine kinase (TK) gene was included at the 3' end of the targeting construct to select against random integration.
- the targeting vector was constructed as follows.
- a BAC clone carrying the entire mouse Brachyury (Bry) gene was isolated by PCR screening of a 129/Ola strain genomic library (Genome Systems) with primers 5'-AAGGAGCTAACT AACGAGATGAT-3' and 5' -TACCTTCAGCACCGGGAACAT-3'. These primers anneal within the first and second Bry exon, respectively, and amplify a diagnostic band of ⁇ 600 bp.
- Oligos 5'-GCTAGCTAATGGATCCA-3' / 5'- GATCTGGATCCA TTAGCTAGCTGCA-3'and 5'-GATCTTAATGAACGGCAGGTGGGTGCGCGTCCGGA G-3' / 5'TCGACTCCGGACGCGCACCCACCTGCCGTTCATTAA-3' were inserted into the PstI/SaII sites of plasmid pBSK to create a new, more suitable polylinker with two successive translational stop codons and an artificial 3' splice site (construct pBry-AA).
- Plasmid pEGFP.C1 (Clontech) was double-digested with NheI/Bglll and the resulting ⁇ 760bp DNA fragment encoding EGFP without stop codon was cloned into the Nhei/BgIII sites of pBRY-AA, resulting in construct pBry-AB.
- An XhollSalI fragment of plasmid pL2-Neo2 carrying a loxP-flanked neomycin resistance gene was inserted into the SaII. site of pBry-AB to give rise to plasmid pBry-AC (transcription of EGFP and Neo in same direction).
- This fragment was inserted into plasmid pBry-AC in the following way: the XmaI end was ligated into the BspEI site following the last EGFP codon, whereas the Mlu end was inserted along with oligos 5'-CGCGTTACTAGTAAGACGTCT-3' / 5'-CCGGAGA CGTCTTACTAGTAA-3' as linkers into the BspEI site located just upstream of the loxP-neo-loxP cassette. Resulting construct: pBry-AE.
- Embryonic stem cells (E14. 1,129/Ola Hooper et al. (1987) Nature 326:292 ) were electroporated with NotI-linearized targeting vector pBry-AM. Four dishes with transfected cells were subjected to G418 single-and another four dishes to G418 + Gancyclovir (Ganc) double-selection.
- Clones that had undergone a homologous recombination event were identified by PCR with one primer (5'-CAGGTAGAACCCACAA CTCCGAC-3') annealing to genomic sequences in the 5' region of the Bry gene, just upstream of the "short arm of homology", the other (5'-CCGGACACGCTGAACTTGTGGC-3') to the 5' portion of EGFP (diagnostic band: approximately 1.3 kb). Correctly targeted clones were confirmed by Southern blot analysis: genomic DNA of candidate clones was digested with HincII and hybridized to a probe located outside of the targeting construct.
- the probe was derived from the Bry 5'flanking region (-2018 to -1249 with respect to the Bry ATG start codon) by PCR using the oiigonucleotide pair 5'-ACAGGATCCCTAAGCCTCAAAAGAGTCGCT-3'/5'-TCTTGGATCCTCCTAT CCTATCCCGAAGCTCCT-3'.
- 384 G418 single- and 80 G418 + Ganc double-selected clones were screened, of which 4 respectively 3 proved to be positive, corresponding to a targeting efficiency of 1.04% and 3.75%.
- Two positive clones were transiently transfected with a modified Cre recombinase expression vector to remove the neo gene. These targeted clones are referred to hereinafter as GFP-Bry ES cells.
- Brachyury is expressed transiently in developing EBs with the onset preceding the expression of genes that define the establishment of the hematopoietic and endothelial lineages. To determine whether GFP expression in GFP-Bry ES cells accurately reflects expression of the brachyury gene during EB development, GFP expression was assessed.
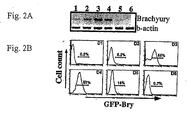
- FIG. 2A A typical expression pattern during a 6-day EB differentiation period is shown in Figure 2A .
- low levels of message were detected within 24 hours of differentiation. Expression was upregulated over the next 48 hours, persisted through day 4 and then declined sharply to undetectable levels by day 6 of differentiation.
- GFP expression as defined by FACS analysis, followed a similar temporal pattern. Low levels of GFP + cells ( ⁇ 5%) were detected as early as day 2 of differentiation. More than half (65%) of the EB-derived cells expressed GFP at day 3 and almost all the cells were positive at day 4 of differentiation. As observed by PCR, expression dropped sharply after this point and by day 6 few, if any, GFP + cells were present. This rapid decline in GFP expression indicated that it did not persist within the cells for extended periods of time. The high proportion of GFP + cells at days 3 and 4 of differentiation suggests that development of mesoderm within the EBs under these conditions is extensive. Taken together, these findings indicate that GFP expression accurately reflects expression of the brachyury gene during
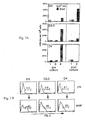
- FIG. 4A shows the gates used for the isolation of the GFP positive (2) and negative(1) populations.
- RT-PCR analysis revealed brachyury expression was restricted to the GFP + fraction indicating that cell sorting based on GFP expression can be used to isolate brachyury + cells.
- Flk-1 one of the earliest makers of hematopoietic and endothelial development, was present at higher levels in GFP + that in the GFP - fraction indicating that it was expressed in at least a subpopulation of brachyury + cells.
- GFP + cells can be isolated from day 3.5 EBs by cell sorting.
- Gene expression analysis of the GFP + and GFP - fractions shows that brachyury expression segregates predominantly to the positive fraction, a finding which clearly demonstrates that fractionation based on GFP provides a method for isolating brachyury positive cells.
- the receptor tyrosine Flk-1 involved in early hematopoietic and endothelial development is also expressed at higher levels in the positive than in the negative fraction.
- Rex-1 and Pax-6 markers of early ectoderm and neuroectoderm, are expressed in the GFP - fraction.
- Flk-1 has been shown to be essential for the establishment of the hematopoietic and endothelial lineages in the early embryo and is expressed on the earliest precursors of these lineages, including the BL-CFC [ Faloon et al. (2000) Development 127:1931-41 ]. Given this pivotal role in blood and vascular development, its expression within the GFP + population was hypothesized to define a subpopulation of mesoderm undergoing specification to these lineages. To investigate this possibility further, EBs were analyzed at several stages of development for the presence of GFP and Flk-1 positive cells. In the experiment illustrated in Figure 5A , 4.8% of the day 3.0 EB population expressed GFP but not Flk-1, whereas 1.2% of the cells expressed both markers.
- GFP + /Flk-1- and GFP + /Flk-1 + cells representing 52% and 26% of the total EB population, respectively.
- GFP - Flk-1 - (fraction 2), GFP + /Flk-1 - (fraction 3) and GFP + /Flk-1 + (fraction 4) cells were isolated at both time points and analyzed for BL-CFC and 2° EB content and for gene expression patterns. The potential of the fractions was compared to that of the pre-sorted population (fraction 1).
- Rex-1 the ES cell marker
- Rex-1 the ES cell marker
- Brachyury was expressed in the GFP + fractions at both time points. The levels appear to be higher in the GFP + /Flk-1 - than the GFP + /Fik-1 + fraction isolated from day 3.5 EBs, suggesting that its expression could be downregulated as these cells mature towards the hematopoietic and endothelial lineages.
- Flk-1 was expressed predominantly in the GFP + /Flk-1 + cells at both time points.
- the levels of expression in the GFP + /Flk-1 + fraction appear to be significantly lower than in the other fractions.
- Wnt3a and Wnt8a showed a remarkably restricted pattern of expression and were found only in the GFP + /Fik-1 - fraction at both time points, consistent with an early mesoderm function prior to the expression of lineage restricted markers.
- BMP2 was expressed in both GFP + fractions whereas BMP4 was found predominantly in the GFP + /Flk-1 + cells, indicating that these molecules play a role at distinct stages of development in this system.
- the BL-CFC potential and gene expression pattern of the GFP + /Flk-1 + cells indicates that they are representative of the extraembryonic mesoderm found in the mouse embryo.
- brachyury + /Flk-1 - (GFP + /Flk-1 - ) and brachyury + /Flk-1 + (GFP + /Flk-1 + )
- Figure 5A Functional studies demonstrated that precursors (BL-CFC) able to generate both hematopoietic and endothelial cell segregated to the (GFP + /Flk-1 + ) fraction, suggesting that upregulation of Flk-1 is indicative of commitment to these lineages ( Figure 5B ).
- Gene expression studies demonstrated distinct differences between the GFP + /Flk-1 - and GFP + /Flk-1 + populations ( Figure 5C ).
- the cells rapidly reaggregate and form EB-like structures that appear to follow a normal developmental program with little expansion or loss in cell number.
- the GFP - /Flk-1 - cells gave rise to a significant population of GFP + /Flk-1 - cells as well as to a small number of GFP + /Flk-1 + .
- GFP + /Flk-1 - cells generated a substantial population of GFP + /Flk-1 + cells during the same culture period.
- the GFP + /Flk-1 + population appeared to lose some GFP and Flk-1 expression following the reaggregation culture. Results are shown in Figure 6 .
- the changes in precursor potential were consistent with the changes in surface markers.
- the GFP - /Flk-1 - fraction contained an undetectable number of BL-CFC and Ery p -CFC before or after culture.
- the GFP + /Flk-1 - fraction also contained few BL-CFC and Ery p -CFC prior to culture.
- the BL-CFC potential increased dramatically, from 74 to 1564 per 10 5 cells, consistent with the increase in Flk-1 expression.
- the frequency of Ery p -CFC did not change during the culture period.
- the GFP + /Flk-1 + fraction contained BL-CFC but few Ery p -CFC prior to culture.
- This example indicates that when isolated and recultured for 20-24 hours, each of the three populations isolated from day 3 EBs continued to differentiate and in a pattern that indicates that these populations represent a developmental continuum. For instance, GFP - /Flk-1 - gave rise to GFP + /Flk-1 - cells which in turn gave rise to GFP + /Flk-1 + . These changes in cell surface characteristics were associated with the expected changes in developmental potential.
- the GFP + /Flk-1 - fraction contained few hematopoietic/endothelial precursors (BL-CFC) prior to culture. Following culture, these precursors were detected, clearly demonstrating that the GFP + /Flk-1 - fraction from day 3 EBs does contain the potential to give rise to Flk-1 + cells with hematopoietic and endothelial potential.
- the BL-CFC content of the freshly isolated GFP + /Flk-1 + fraction from these same EBs increased over this period of time, indicating that differentiation was progressing in a normal fashion.
- the Flk-1 expression patterns in the reaggregated cultures from the different staged EB cells were consistent with BL-CFC data.
- the cultures from the reaggregated day 3.0 GFP + /Flk-1 - cells contained a distinct Flk-1 fraction that represented more than 40% of the total population ( Figure 7B ).
- Flk-1 expression in the day 3.5 and 4.0 cultures was significantly lower and consisted of a shoulder of the total population rather than a distinct peak.
- the cardiomyocyte potential of the isolated populations was determined. For this analysis, aggregates from the cultures of the different populations were transferred to microtiter or 24-well plates in serum-free medium and monitored for the development of beating cell masses, indicative of cardiomyocytes. These conditions are known to support the efficient development of cardiomyocytes from the reaggregated cells. As an independent confirmation of the cardiomyocyte nature of the cells within these masses, a representative group was transferred to microscope slides, fixed and stained for the presence of the cardiac-specific isoform of Troponin T.
- the BL-CFC potential of the different fractions was similar to that observed in previous experiments.
- the GFP + /Flk-1 + cells isolated from the three different EB populations generated BL-CFC, with the highest number found at day 3.5 and 4.0.
- the pre-BL-CFC potential in the GFP + /Flk-1 - cells was greatest at day 2.75 and decreased significantly at 3.5 and 4.0.
- the cardiomyocyte potential of the fractions showed a reverse pattern.
- GFP + /Flk-1 - cells generated beating cardiomyocytes. No beating cells were observed in the aggregates generated from the earliest (day 2.75) GFP + /Flk-1 - cells.
- GFP + /Flk-1 + cells isolated from EBs were not detected in aggregates generated from the GFP + /Flk-1 + cells isolated from EBs at any of the three stages of development.
- the findings from this analysis are consistent with the notion that GFP + /Flk-1 - cells isolated at different stages have different potentials. Those that develop early appear to have a hemangioblast fate, whereas those that develop later generate the cardiac lineage and possibly other populations. The GFP + /Flk-1 + populations appear to have lost the cardiomyocyte potential and may be restricted to the hemangioblast lineages.
- the early developing (day 2.75-3.0) GFP + /Flk-1 - cells are referred to as pre-hemangioblast mesoderm whereas the population that develops between day 3.5 and 4.0 are referred to as pre-cardiac mesoderm.
- the day 3.0-3.5 GFP + /Flk-1 + populations generate BL-CFC, whereas those isolated from later stage EBs (day 4.0) contain primitive erythroid progenitors, indicating the onset of hematopoietic commitment.
- the GFP + /Flk-1 + population is referred to as hemangioblast mesoderm.
- Examples 5 and 6 demonstrate that GFP+ cells isolated from different aged EBs have different developmental potential.
- GFP + /Flk-1 - cells from day 3 EBs efficiently generate both hematopoietic and endothelial lineages. These cells did not give rise to cardiotiyocytes (heart tissue) as demonstrated by the lack of beating cell masses.
- GFP + cells from day 4 EBs gave rise to few Flk-1 + cells and BL-CFC following culture. This population did, however, generate cells of the cardiomyocte lineage.
- BMP4 (20ng/ml) was added to the developing EBs in the serum free cultures. At this concentration, BMP4 did induce a significant population of brachyury + cells within 3 days of differentiation. However, in contrast to the serum, BMP4 did not support the development of the GFP + /Flk-1 + population in this period of time. To determine if BMP4 could induce GFP + /Flk-1 + from GFP + /Flk-1 - cells that were induced in the presence of serum, GFP + /Flk-1 - cells were isolated from EBs differentiated for three days in the presence of serum.
- GFP + /Flk-1 - cells were reaggregated in medium alone, in medium with serum or in medium with BMP4.
- GFP + /Flk-1 - cells did not differentiate substantially when reaggregated in the absence of serum.
- the same population generated a large GFP + /Flk-1 + population when serum was added to the cultures.
- BMP4 was unable to induce the development of significant numbers of GFP + /Flk-1 + cells from the cultured GFP + /Flk-1 - cells.
- Step #1 represents mesoderm induction and patterning to a pre-hematopoietic and endothelial (pre-hemangioblast) fate.
- Step #2 represents specification to the hematopoietic and endothelial lineages.
- Steps #3 and #4 represent patterning to the pre-cardiac fate.
- mesoderm and endoderm develop from a common precursor population known as mesendoderm.
- mesendoderm stage of development To determine whether or not a mesendoderm stage of development does exist in EBs, conditions for the development of the endoderm lineage were established. As a first step in establishing culture conditions for the development of this lineage, the amount of serum in the differentiation cultures was varied. EBs were generated in the presence and absence of serum (SP34 and then IMDM plus SR) and assayed at different stages for expression of genes associated with ectoderm, endoderm and mesoderm development.
- ectoderm lineage development of the neuronal lineage was assessed analyzing expression of PAX6, Wntl, neruoD and neurofilament (NFL). These genes are known to be expressed at different stages of neruonal development. The early stages of endoderm development were monitored by expression of HNF3 ⁇ . To evaluate later stages of endoderm development and specification, genes involved in liver development were analyzed. These included Hex, ⁇ -fetoprotein (AFP), HNF4, Albumin (Alb), ⁇ -1-antittrypsin (AAT) and tyrosine aminotransferase (TAT). Mesoderm development was monitored by expression of brachyury and GATA-1.
- AFP Hex, ⁇ -fetoprotein
- HNF4 Albumin
- AAT ⁇ -1-antittrypsin
- TAT tyrosine aminotransferase
- FIG. 10 shows the impact of serum on the developmental potential of EBs over a 10-day differentiation period. In the presence of serum (serum) there is little neuro-ecotderm differentiation as demonstrated by the lack of expression of the genes associated with development of this lineage. HNF3 ⁇ is expressed at early stages of differentiation (day 2-3) and then downregulated. As expected, GATA-1 is expressed in the EBs generated under these conditions.
- the dishes were coated with either gelatin or matrigel to determine if substrate had any impact on further endoderm differentiation.
- the experimental outline and data are shown in Figure 15 .
- AFP was not expressed at the day 6 EB stage. Its levels of expression were upregulated when cultured in the presence of bFGF on either gelatin of matrigel. Low levels of ALB were also detected at this stage. ALB expression increased following the additional culture period in all conditions tested.
- AAT and TAT were also expressed following the last culture step. The highest levels of TAT were found when EB-derived cells were cultured in the presence of bFGF and Dex.
- GFP (Bry) + and GFP (Bry) - cells were isolated from day 2.5 EBs by cell sorting. These populations were allowed to reaggregate and cultured as clusters until day 6. On day 6, they were moved to the tissue culture grade dishes in medium with bFGF for 4 days (total of 10 days). Gene expression analysis indicated that cells, which express HNF3 ⁇ , segregated to the GFP + fraction (d2.5) ( Figure 16 ). With time in culture, this gene was expressed in cells generated from the GFP - fraction. This likely reflects the fact that at later stages of expression HNF3 ⁇ is expressed in non-endodermal population.
- AFP, HEX, ALB and HNF4 were all expressed in derivatives of the GFP + fraction, but not in cell populations generated from the GFP - cells.
- PAX6 and neuroD markers of neuroectoderm, were found predominantly in cells generated from the GFP - fraction.
- ⁇ -fetoprotein AFP
- albumin ALB
- TTR transthyretin
- genes indicative of maturation of the lineage including alphal-antitrypsin (AAT), tyrosine aminotransferase (TAT) and carbamoyl phosphate synthetase I (CPase).
- AAT alphal-antitrypsin
- TAT tyrosine aminotransferase
- CPase carbamoyl phosphate synthetase I
- ⁇ -actin expression was used as a control.
- Cells were analyzed prior to sorting and subsequent to sorting into bry + and bry - populations.
- Fetal liver and adult liver controls were also analyzed. Expression of all of these genes was restricted to the cells derived from the bry + population, indicating that cells with hepatocyte characteristics develop from brachyury expressing cells.
- Example 6 The preliminary kinetic analysis described in Example 6 demonstrated that subpopulations of mesoderm with distinct developmental fates were generated in a defined temporal fashion.
- a more detailed kinetic analysis showed the dynamic development of the GFP + Flk1 - (hereafter referred to as the GFP + population) population between days 2.5 and 4.0 of differentiation ( Figure 18 ).
- the day 2.5 and 3.0 GFP + fractions generated blast cell colonies (indicated as hemangioblast potential in Figure 19 ) that represent the earliest stages of hematopoietic and endothelial commitment ( Figure 19 ).
- This population of GFP + cells displayed little cardiomyocyte (cardiac) potential.
- a second pattern of interest is that of the gene Mixl-1.
- This gene which plays a role in the development of mesoderm and endoderm, was expressed in the day 2.5 and 3.0 GFP populations but not in the day 3.5 and 4.0 fractions.
- the findings of this example clearly demonstrate that mesoderm populations with different developmental potential are generated in a defined temporal pattern within the EBs.
- expression analysis of the mesoderm/endoderm gene Mixl-1 indicates that cells with endoderm potential are also generated at a specific time, namely between day 2.5 and 3.0 of differentiation.
- GFP + cells from day 3.0 and 4.0 EBs were isolated and cultured under conditions that promote the differentiation into hepatocyte-like cells.
- GFP + cells (+/-) isolated from day 3.0 but not those from day 4.0 displayed endoderm potential as defined by expression of HNF3 ⁇ .
- GFP + and GFP - day 2.5 EB cells were cultured for 14 day days under conditions known to promote hepatocyte differentiation and then transplanted under the kidney capsule of recipient SCID-beige mice.
- Several mice were sacrificed immediately following the transplant, the kidney with the graft was sectioned and the sections were stained with antibodies against Hep1 and AFP.
- Hep1 is a specific marker of hepatocytes whereas AFP is expressed in definitive endoderm and immature cells of the hepatocyte lineage.
- No Hepl + or AFP + cells were found in the graft of the GFP - negative cells.
- transplantation experiments demonstrate the presence of hepatocyte-like cells in the grafts immediately following transplantation, it was difficult to monitor the maturation of these populations over time, as the transplanted tissues generated tumor-like masses known as teratomas.
- the teratomas likely develop from contaminating undifferentiated ES cells or from GFP + primordial germ cells that are known to be of mesoderm origin and to express brachyury.
- activin will induce both mesoderm and endoderm from ectoderm in culture.
- activin behaved as a morphogen in this model in that it induced different cell types at different concentrations used.
- ES cells were differentiated for 2 days in Stem Pro 34 medium without serum. At this stage, the developing EBs were harvested and recultured in IMDM supplemented with serum replacement (serum free) and activin at a concentration of 100 ng/ml.
- EBs were harvested at different days and assayed for GFP + expression and expression of genes indicative of ectoderm, mesoderm and endoderm development. As shown in Figure 22A,B this amount of activin-induced brachyury as measured by GFP. While the kinetics of GFP induction was delayed compared to EBs differentiated in serum, this concentration of activin did induce substantial numbers of brachyury positive cells (60%) by day 6 of differentiation. Molecular analysis indicated that the activin-induced cells expressed a broad spectrum of genes associated with endoderm development including HNF3 ⁇ , Mixl-1, Sox17, Hex-1, and pdx-1 ( Figure 23C ).
- GATA-1 Genes associated with hematopoietic development, such as GATA-1 and those indicative of neuroectoderm differentiation such as PAX6 were not induced by activin.
- HNF3 ⁇ , Sox17, Hex-1 were all induced in cultures stimulated with 10, 30, or 100 ng/ml of activin.
- Pdx-1 expression required the highest amount of activin and was induced best in EBs stimulated with 100ng/ml.
- GATA1 nor c-fms was expressed at any concentration of activin.
- the pattern of PAX6 expression was the reverse to that of the endoderm genes and was downregulated with increasing concentrations of activin.
- Activin-induced EBs did not express genes associated with hematopoietic commitment indicating that this developmental program was not induced. To further evaluate the hematopoietic potential of these EBs, they were analyzed for progenitor potential. As expected from the molecular analysis, these EBs contained no appreciable numbers of primitive (Ep) or definitive (mac/mix) hematopoietic progenitors ( Figure 24A ). When these activin induced EBs were further stimulated with serum for 2.5 days, however, they did generate some hematopoietic progenitors, indicating that they do contain mesodermal potential ( Figure 24B ).
- GFP + cells were isolated from EBs stimulated with 3ng or 100ng and cultured further (14 day total) in hepatocyte conductions. As shown in Figure 25 , only cells from the 100ng cultures differentiated into cells that expressed albumin consistent with liver differentiation. Taken together, the findings from these studies indicate that activin functions as a morphogen in the ES/EB system and that high concentration are required for endoderm induction.
- GFP + and GFP - cells were isolated from EBs induced with 100 ng/ml of activin and cultured for 14 days to promote the differentiation of hepatocyte-like cells. Following this culture period, the cells were harvested and transplanted to the kidney capsule of recipient animals. Three weeks following transplantation, the mice were sacrificed and the kidneys analyzed. Results are shown in Figs. 26A-C .
- mice engrafted with GFP - cells developed large, multilineage teratomas, consisting of cells from all three germ layers. In contrast, no teratomas were detected in the animals transplanted with GFP + cells. These cells give rise to differentiated cell masses consisting of endodermal and mesodermal derived tissues including gut epithelium, bone and skeletal muscle. In some instances, skin was also observed in the graft from the GFP + cells, suggesting that this lineage might also develop from a bry + cell. These findings indicate that it is possible to generate GFP + populations from a bry + cell. These findings indicate that it is possible to generate GFP + populations that give rise to differentiated tissue without forming teratomas following transplantation.
- HNF3 ⁇ , AFP and ALB expressing cells were all derived from bry + /c-kit + population.
- sorted cells were plated onto glass coverslips and stained with an antibody to HNF3 ⁇ . Greater than 80% of the bry + /c-kit + cells expressed HNF3 ⁇ protein, whereas less than 10% bry + /c-kit- were positive.
- PCR analysis presented in Figure 23 indicates that different concentrations of activin induce different developmental programs and that cells with endodermal potential are induced with the highest levels of this factor.
- cells stimulated with different concentrations of activin were adhered to coverslips and stained with the anti-HNF3 ⁇ antibody. More than 50% of the entire EB population stimulated with 100ng/ml of activin expressed HNF3 ⁇ whereas only 10% of the cells stimulated with 3ng/ml were positive. Only background levels of staining were observed in the non-stimulated population.
- day 6 EBs differentiated in the presence of different concentrations of this factor were transferred to serum replacement media for 4 days and then replated in hepatocyte conditions for an additional 4 days.
- day 14 of culture the cells from each group were harvested and subjected to PCR expression analysis. Expression of Myf5 and skeletal actin were monitored to evaluate skeletal muscle development representing an additional mesoderm-derived lineage.
- Surfactant protein C SP-C
- a lung-specific gene was included as a marker of endoderm differentiation in addition to AFP and ALB.
- Myf5 and skeletal actin were expressed in cultures stimulated with as little as 1ng/ml of activin and this expression was detected over a broad range of factor concentrations. Expression of both genes was, however, downregulated at the highest concentration of activin (100ng/ml). Cultures stimulated with low amounts of activin contained groups of cells with the morphology of skeletal muscle. Immunostaining demonstrated that these cells expressed both skeletal myosin and ⁇ -actinin, indicating that they are of the skeletal muscle lineage. Evaluation of the proportion of replated EBs that generated skeletal muscle outgrowths was consistent with the gene expression analysis, as those stimulated with 3 and 10 ng/ml displayed the most robust skeletal muscle development as depicted in Fig. 28 .
- Brachyury positive and negative populations isolated from EBs stimulated with low and high concentrations of factor were also analyzed for expression of the skeletal muscle and endoderm genes. As shown in Figure 29 , both myf5 and skeletal actin expression were restricted to the population generated from the bry + population isolated from EBs stimulated with 3ng/ml of activin. Similarly, the endoderm genes were expressed in the brachyury + -derived cells isolated from EBs generated in the presence of 100ng/ml of factor.
Landscapes
- Health & Medical Sciences (AREA)
- Life Sciences & Earth Sciences (AREA)
- Engineering & Computer Science (AREA)
- Chemical & Material Sciences (AREA)
- Bioinformatics & Cheminformatics (AREA)
- Organic Chemistry (AREA)
- General Health & Medical Sciences (AREA)
- Biomedical Technology (AREA)
- Medicinal Chemistry (AREA)
- Animal Behavior & Ethology (AREA)
- Public Health (AREA)
- Chemical Kinetics & Catalysis (AREA)
- Nuclear Medicine, Radiotherapy & Molecular Imaging (AREA)
- General Chemical & Material Sciences (AREA)
- Pharmacology & Pharmacy (AREA)
- Veterinary Medicine (AREA)
- Biotechnology (AREA)
- Genetics & Genomics (AREA)
- Wood Science & Technology (AREA)
- Zoology (AREA)
- Developmental Biology & Embryology (AREA)
- Cell Biology (AREA)
- Reproductive Health (AREA)
- Gynecology & Obstetrics (AREA)
- Hematology (AREA)
- Biochemistry (AREA)
- Microbiology (AREA)
- Diabetes (AREA)
- General Engineering & Computer Science (AREA)
- Immunology (AREA)
- Cardiology (AREA)
- Urology & Nephrology (AREA)
- Molecular Biology (AREA)
- Heart & Thoracic Surgery (AREA)
- Physical Education & Sports Medicine (AREA)
- Analytical Chemistry (AREA)
- General Physics & Mathematics (AREA)
- Toxicology (AREA)
- Tropical Medicine & Parasitology (AREA)
- Food Science & Technology (AREA)
Abstract
Description
- This application claims the benefit of
U.S. Application Serial Nos. 60/381,617 filed May 17, 2002 60/444,851 filed February 4, 2003 - This invention was made with government support under Grant Nos. 2RO1 HL 48834-09 and 2RO1 HL 65169-02 awarded by the National Institutes of Health. The government may have certain rights in the invention.
- During embryonic development, the tissues of the body are formed from three major cell populations: ectoderm, mesoderm and definitive endoderm. These cell populations, also known as primary germ cell layers, are formed through a process known as gastrulation. Following gastrulation, each primary germ cell layer generates a specific set of cell populations and tissues. Mesoderm gives rise to blood cells, endothelial cells, cardiac and skeletal muscle, and adipocytes. Definitive endoderm generates liver, pancreas and lung. Ectoderm gives rise to the nervous system, skin and adrenal tissues.
- The process of tissue development from these germ cell layers involves multiple differentiation steps, reflecting complex molecular changes. With respect to mesoderm and its derivatives, three distinct stages have been defined. The first is the induction of mesoderm from cells within a structure known as the epiblast. The newly formed mesoderm, also known as nascent mesoderm, migrates to different positions that will be sites of future tissue development in the early embryo. This process, known as patterning, entails some molecular changes that are likely reflective of the initial stages of differentiation towards specific tissues. The final stage, known as specification, involves the generation of distinct tissues from the patterned mesodermal subpopulations. Recent studies have provided evidence which suggests that mesoderm is induced in successive waves which represent subpopulations with distinct developmental potential. The mesoderm that is formed first migrates to the extraembryonic region and gives rise to hematopoietic and endothelial cells, whereas the next population migrates anteriorly in the developing embryo and contributes to the heart and cranial mesenchyme. These lineage relationships were defined initially through histological analysis and have been largely confirmed by cell tracing studies. While this segregation of developmental fates is well accepted in the field of developmental biology, to date, there are no available methods of isolating mesoderm and endoderm, prior to commitment to these lineages.
- The present invention provides a method for isolating mesoderm and definitive endoderm cell populations. These cell populations are useful to identify agents that affect cell growth and differentiation, to identify genes involved in tissue development, and to generate differentiated cells and tissues for cell replacement therapies.
- The present invention provides cell populations that are enriched for mesendoderm and mesoderm cells. Mesendoderm cells are defined herein as cells that express brachyury (brach+) and which, in the presence of differentiation-inducing conditions, are capable of generating mesoderm and mesoderm derivatives including cardiac and skeletal muscle, vascular smooth muscle, endothelium and hematopoietic cells, and also are capable of generating endoderm and endoderm derivatives including liver cells and pancreatic cells. Mesoderm cells are defined herein as cells that are brach+ and which, in the presence of differentiation inducing conditions, are capable of generating cardiac and skeletal muscle, vascular smooth muscle, endothelium and hematopoietic cells, and are not capable of generating endoderm and endoderm derivatives.
- The present invention further provides cell populations that are enriched for endoderm cells. Endoderm cells are defined herein as cells that do not express brachyury (brach-) and which, in the presence of differentiation-inducing conditions, are capable of generating lung cells, liver cells and pancreatic cells.
- The present invention also provides methods of isolating cell populations enriched for mesendoderm and mesoderm cells, and cell populations enriched for endoderm cells. In another embodiment, the present invention provides methods of identifying agents that affect the proliferation, differentiation or survival of the cell populations of the invention. A method of identifying genes involved in cell differentiation and development of specific lineages and tissues is also provided.
- Antibodies that specifically recognize brach+ cells are also provided. The antibodies are useful, for example, for isolating mesendoderm and mesoderm cell populations.
- In another embodiment, the present invention provides a method for generating cells in vitro. Such cells are useful, for example, for cell replacement therapy.
- The present invention also provides a transgenic non-human mammal having a genome in which DNA encoding a selectable marker is present in the brachyury locus such that one brachyury allele is inactivated and the selectable marker is expressed in cells in which the brachyury locus is transcribed.
-
-
Fig. 1 depicts the scheme of the vector and the strategy used for targeting the green fluorescence protein (GFP) to the brachyury locus. -
Figs. 2A and 2B depict the expression of GFP and brachyury in developing embryoid bodies (EBs).Fig. 2A depicts the kinetics of brachyury expression determined by reverse transcriptase-polymerase chain reaction (RT-PCR).Fig. 2B depicts the kinetics of GFP expression determined by fluorescence activated cell sorting (FACS) analysis. Numbers above the figure inFig. 2A and the histograms inFig. 2B represent day ofEB differentiation. -
Figs. 3A-C depict the developmental potential of wild type and GFP-Bry ES cells.Fig. 3A is a histogram showing developmental potential ofday 6 EBs. (Mac/Ery: colonies of macrophages and definitive erythroid cells; Mac: pure macrophage colonies; Eryd: colonies of definitive erythroid cells; Mix: multilineage colonies; EryP: primitive erythroid colonies.Fig. 3B is a histogram depicting blast colony-forming cell (BL-CFC) potential of EBs.Fig. 3C shows gene expression patterns during EB development for wild-type and GFP-Bry cells. Numbers at the top of the lanes represent day of EB differentiation. -
Figs. 4A and 4B depict the gene expression profile of EB fractions isolated on the basis of GFP.Fig. 4A shows the profile of GFP expression in day 3.5 EBs. 1 and 2 represent the gates used to isolate the GFP- and GFP+ fractions.Fig. 4B depicts RT-PCR expression analysis of isolated fractions. -
Figs. 5A-C demonstrate the isolation and characterization of GFP and Flk-1 populations.Fig. 5A depicts the profiles and gates used to isolate the GFP-/Flk-1-, GFP+/Flk-1- and GFP+/Flk-1+ fractions from day 3.0 and 3.5 EBs Numbers next to the gates represent the three different populations.Fig. 5B shows the Blast colony (Blast) and secondary EB (2°) potential of the different fractions.Fig. 5C shows the expression analysis of the isolated fractions, Expression shown in the top panel was evaluated using a polyA+ global amplification PCR method described by Brady et al. (1990) Meth. In Mol. And Cell Bio. 2:17-25. The data in the lower panels was obtained by RT-PCR analysis using gene specific oligonucleotides. Numbers on the top of each row indicate the cell population as designated inFig. 5A . -
Fig. 6 depicts the expression of GFP and Flk-1 inisolated day 3 EB-derived fractions. The top row shows the expression profiles of the three fractions prior to culture (pre). The bottom row indicates the profile of the same cell populations following 20 hours of culture (post). The numbers below each profile indicate the BL-CFC and primitive erythroid (EryP-CFC) potential (precursors per 1x10⁵ cells plated) of each population. -
Figs. 7A and 7B depict the BL-CFC potential and Flk-1 expression of the isolated cell populations prior to and following culture. InFig. 7A , the numbers on the bottom refer to the cell population: 1 is the presort, 3 is the GFP+/Flk-1- fraction and 4 is the GFP+/Flk-1+ fraction. Cells were cultured for 20 hours, and the aggregates were then dissociated and analyzed for BL-CFC. Data are shown for cells isolated fromday 3, 3.5 and 4.0 EBs. InFig. 7B , the top row represents GFP+/Flk-1- cells isolated from day 3.0, 3.5 and 4.0 EBs prior to culture (pre). The bottom row shows the Flk-1 expression pattern of the same fraction, following culture (post). Numbers above the bars represent the percentage of Flk-1+ cells. -
Figs. 8A and 8B demonstrate the effects of BMP-4 and fetal calf serum (FCS) on the development of brachyury and Flk-1+ in/on day 3.0 EB derived cells under the conditions indicated at the top of each histogram.Fig. 8B depicts expression of brachyury and Flk-1 on cell populations generated from GFP+//Flk-1- cells cultured for 20 hours under the indicated conditions. -
Fig. 9 is a schematic model of mesoderm formation and specification in EBs. -
Fig. 10 shows the expression of genes in EBs in the presence and absence of serum. -
Fig. 11 is a graph depicting brachyury expression in EBs generated under different conditions. -
Fig. 13 is a schematic diagram showing neuronal differentiation is the presence and absence of serum. -
Fig. 14 shows the expression of genes in EBs initiated for two days in serum and then switched to serum free conditions. -
Fig. 15 shows gene expression in EBs cultured in the presence of bFGF. -
Fig. 16 shows gene expression patterns in Bry+ and Bry- cells cultured in the presence of bFGF. -
Fig. 17 is a diagram of the mesoderm and endoderm populations of the present invention and the differentiation of these population to derivative cell types. -
Fig. 18 depicts the kinetics of expression of GFP (brachyury) and Flk-1 in EBs differentiated for 2.5, 3.0, 3.5 and 4.0 days. Arrows indicate the GFP+ population isolated used for the analyses in subsequent studies. -
Fig. 19 depicts the hemangioblast and cardiac potential of the GFP+ populations isolated from the four stages of EB differentiation. Cells from each stage were isolated by cell sorting, reaggregated for 24 hours and analyzed for hematopoietic and cardiac potential. Data are indicated as blast colonies (hemangioblast) per 1x10⁵ cells recovered from the reaggregation culture or as the % of aggregates that gave rise to beating cell masses indicative of cardiac muscle differentiation. -
Fig. 20 provides the RT-PCR expression analysis of the indicated genes in the four GFP+ EB-derived cells populations. Numbers indicate day of EB differentiation.Fig. 21 shows HNF3 β expression in GFP+ populations isolated from day 3.0 and 4.0 EBs. Pre represents cells prior to sorting, -/- are cells that express no GFP or Flk-1 and +/- represents the GFP+ Flk-1-population. -
Figs. 22A-C demonstrate the effects of activin on development of EBs in serum-free cultures. A) FACS profile showing GFP expression inday 6 EBs differentiated in the presence of 100 ng/ml of activin. B) Kinetics of GFP induction in cultures containing 100 ng/ml of activin. Open circles are EB differentiated in the presence of activin, closed squares are EBs differentiated in absence of activin. C) RT-PCR expression analysis of indicated genes inday 6 EBs grown in the presence (+ activin) or absence (-activin) of activin. Numbers indicate day of EB differentiation. -
Figs. 23A and B show the effects of different concentrations of activin on the developmental potential of EBs. A) GFP expression inday 7 EBs induced with different concentrations of activin. B) RT-PCR expression analysis ofday 7 EBs induced with different concentrations of activin. -
Figs. 24A and B show the hematopoietic progenitor content of EBs differentiated in the presence of different concentrations of activin. A) Progenitor potential ofday 7 EBs, Ep are primitive erythroid progenitors, mac/mix represent definitive hematopoietic progenitors. B) Progenitor potential ofday 7 activin-induced EBs following 2.5 days of exposure to serum. -
Fig. 25 shows the development of albumin expressing cells from GFP+ cells induced withether 3 or 100ng/ml of activin. GFP+ and GFP- cells were isolated atday 6 of differentiation and cultured for a further 8 days in the conditions previously described to support hepatocyte differentiation. -
Figs. 26A and B depict three-week old renal grafts of bry+ (Fig. 26A ) and bry- (Fig. 26B ) cell populations.Fig. 26C depicts sections of grafts of the bry+ and bry- populations. -
Fig. 27A is a FACS profile indicating the bry+/c-kit+ (+/+) and bry+/c-kif (+/-) fractions isolated from day three serum-stimulated EBs. Numbers represent the proportion of cells in each of the fractions.Fig. 27B shows expression analysis of each of the fractions.Day 3 represents cells analyzed immediately following sorting.Day 15 represents cell populations cultured for 15 days in hepatocyte conditions. -
Fig. 28 depicts expression analysis of cell populations derived from EBs induced with different concentrations of activin. Numbers at the top of the figure indicate activin concentration. Numbers at the bottom of the figure represent an estimate of the proportion of EBs with skeletal muscle outgrowths. -
Fig. 29 depicts expression analysis of brachyury fractions isolated from activin-induced populations. Numbers at the top of the figure indicate activin concentration. - During embryogenesis, the formation of mesoderm is a critical step in the establishment of a body plan and in the development of multiple organ systems such as blood, endothelium, heart and skeletal muscle. The molecular mechanisms that control mesoderm formation, however, are poorly defined. A model system based upon the differentiation of embryonic stem (ES) cells in culture has been used to study mesodermal-derived populations including hematopoietic, endothelial, cardiac and skeletal muscle and adipocyte lineages. The in vitro model supports the induction and specification of mesoderm, but these differentiation events take place in complex colonies known as embryoid bodies (EBs) generated from ES cells. It would be advantageous to isolate mesoderm cell populations from EBs as they are formed, in order to better understand mesoderm formation and tissue development. However, it has not been possible to isolate these populations by cell sorting using antibodies, because antibodies specific for nascent mesoderm cell populations are not well-defined.
- Brachyury (also known as T) is the founding member of a family of transcription factors known as T-box genes and was first identified as a naturally occurring mutation in mice. Papaioannou et al. (1998) Bioessays 20:9-19. Heterozygous mice are viable but have a shorter tail than wild type animals. Homozygous mutants, which die at approximately
day 10 p.c., lack a notochord and display defects in the development of posterior mesodermal tissues. Through the analysis of chimeric animals, brachyury has been shown to affect the migratory properties of the mesodermal cells. Wilson et al. (1995) Development 121:877-86. Expression analysis revealed a unique and interesting pattern for brachyury. It is expressed transiently in all cells ingressing through the primitive streak as well as in the nascent and early migrating mesoderm. Wilkinson et al. (1990) Nature 343:657-9; Herrmann et al. (1991) Development 113:913-7. Expression is rapidly downregulated in paraxial, lateral and extraembryonic mesoderm and following regression of the steak, is confined to the tailbud and notochord. Given this pattern, brachyury is considered to be one of the best markers of early mesoderm and is used to track the development of this lineage. Brachyury has been identified in all species analyzed, suggesting that its role in mesoderm development is preserved throughout phylogeny. Papaioannou et al. (1998). - In accordance with the present invention, a selectable marker gene has been recombinantly targeted to the brachyury locus. It has been discovered that, following the initiation of ES cell differentiation, the selectable marker is expressed in a pattern that reflects brachyury expression. The selectable marker has allowed the sorting of brachyury positive (Brach+) cells from EBs, and thereby the isolation and characterization of cell populations that are enriched for mesendoderm and mesoderm cells.
- The selectable marker exemplified in accordance with the present invention is the enhanced green fluorescence protein (EGFP or GFP). Other selectable markers that will facilitate cell sorting are known to those of ordinary skill in the art and may be used in the present invention. The cDNA encoding GFP is known in the art (and is commercially available, for example as plasmid pEGFP.C1 from Clontech, Palo Alto, CA), and may be targeted to the brachyury locus by constructing targeting vectors (GFP-Bry) by methods known in the art. The vectors are preferably designed to replace approximately two-thirds of the first exon of the brachyury gene with a GFP expression cassette.
- Brachyury genes from numerous species, including human and mouse, are known in the art and reviewed, for example, by Smith (1997) Current Opinion in Genetics & Development 7:474-480. The GFP expression cassette preferably contains GFP cDNA and one or more translational stop codons to prevent translation of downstream brachyury exons. The cassette may further contain an exon encoding the SV40 polyadenylation signal sequence to prevent transcription of downstream regions of the brachyury gene.
- The vectors are introduced into ES cells by methods known in the art to integrate the GFP-Bry construct by homologous recombination. ES cells may be isolated from blastocysts by methods known in the art and disclosed for example by Evans et al. (1981) Nature 292:154-156, Thomson et al. (1995) Proc. Nat'1. Acad. Sci. USA 92; 7844;
U.S. Pat. No. 5,843,780 ; and Reubinoff et al. (2000) Nature Biotech. 18:399. In a preferred embodiment the ES cells are mouse or human ES cells. Following successful targeting the brachyury start codon becomes the start codon of GFP, resulting in the disruption of the targeted brachyury allele. The resulting cells are designated GFP-Bry ES cells. GFP-Bry ES cells are defined herein as ES cells in which one brachyury allele is inactivated and GFP is expressed under the control of the brachyury regulatory elements. - It has been discovered in accordance with the present invention that GFP-Bry ES cells, in which one brachyury allele is inactivated, are viable and develop and differentiate normally. Further, it has been discovered that GFP expression mirrors endogenous brachyury expression. Accordingly, brach+ cells may be isolated by selecting for cells that express GFP. Cells that express GFP may conveniently be isolated by flow cytometry, for example by fluorescence-activated cell sorting (FACS).Methods for sorting cells based on fluorescent properties are well-known to those of ordinary skill in the art.
- Cell populations that are enriched for mesendoderm and mesoderm cells, as defined hereinabove, may be obtained by culturing GFP-Bry ES cells in the presence of serum for a time sufficient to obtain GFP+ cells, for example for from about one to about four days for mouse cells, and sorting and isolating GFP+ cells, for example by flow cytometry. The cell population that is isolated contains at least about 50%, and preferably at least about 75%, and more preferably at least about 90%, and most preferably at least about 95% or at least about 99% mesendoderm and mesoderm cells. The relative amounts of mesendoderm and mesoderm may be varied by adjusting the length of the culture in serum, with shorter culture times favoring the presence of mesendoderm and mesoderm patterned to the hematopoietic and endothelial lineages, and longer culture times favoring the presence of mesoderm patterned to the cardiac and skeletal muscle lineages. For example, a cell population enriched for mesoderm may be obtained by culturing in serum for about 2.5 to 4.5 days, followed by sorting and isolating GFP+ cells. Culturing in the presence of serum is defined herein as culturing in media supplemented with animal serum, for example fetal calf serum (FCS). In a preferred embodiment, the media is supplemented with from about 5% to about 25% serum. The optimal concentration may be serum batch dependent and can be determined by one of ordinary skill in the art.
- Cell populations that are enriched for mesendoderm and mesoderm cells may be obtained from GFP-Bry ES cells generated from human ES cells by a similar method in which the length of time of culture in serum is lengthened to account for difference in times of differentiation in vitro for human and mouse cells. Accordingly, GFP-Bry ES cells generated from human ES cells are cultured in serum for a time sufficient to obtain GFP+ cells, for example about 2 to about 18 days, before sorting and isolating GFP+ cells.
- For both mouse and human cell populations, it can be easily determined whether the isolated cells have differentiated beyond mesoderm, for example to hemangioblasts, by assaying for the presence of the tyrosine kinase receptor, human KDR or mouse Flk-1. KDR and Flk-1 are not expressed in mesendoderm and nascent mesoderm, but as these cells differentiate to a hemangioblast/pre-erythroid population, KDR or Flk-1 expression is detectable. KDR+ and flk-1+ cells may be identified by flow cytometry using antibodies to KDR or Flk-1. Such antibodies are known in the art, and may also be generated using standard methods of antibody production. The cell populations enriched for mesendoderm and mesoderm may be further enriched by removing KDR+ or Flk-1+ cells by cell sorting.
- As depicted in
Fig. 17 , it has been discovered in accordance with the present invention that mesendoderm is a previously unidentified cell population that gives rise to both endoderm and mesoderm and their corresponding lineages. It has been further discovered that presence or absence of serum in the in vitro culture may be used to dictate which lineage is generated from mesendoderm. In particular, a cell population that is enriched for endoderm cells may be obtained by culturing GFP-Bry ES cells generated from mouse ES cells in the presence of serum for about two to four days, sorting and isolating GFP+ cells, for example by flow cytometry, followed by culturing the GFP in the absence of serum for from about one to about ten days. The cell population that is isolated contains at least 50%, and preferably at least about 75%, and more preferably at least about 90%, and most preferably at least about 95% or at least about 99% endoderm cells, as defined hereinabove. - Cell populations that are enriched for endoderm cells may be obtained from GFP-Bry ES cells generated from human ES cells by culturing the GFP-Bry ES cells in the presence of serum for about 2 to 10 days, and then sorting and isolating GFP+ cells followed by culturing the GFP+ cells in the absence of serum for from about 1 to about 15 days.
- The populations enriched for endoderm cells may be further enriched by identifying and sorting out KDR+ or Flk-1+ cells as described above.
- It has further been discovered in accordance with the present invention that cell populations enriched for endoderm may be obtained by culturing GFP-Bry embryonic stem cells in the absence of serum and in the presence of the growth factor activin, for about two to about ten days, and isolating cells that express brachyury. The amount of activin is sufficient to induce differentiation of embryonic stem cells to endoderm. Such differentiation may be measured by assaying for the expression of genes associated with endoderm development, including for example HNF3β, Mixl-1, Sox17, Hex-1 or pdx-1. In a preferred embodiment, the concentration of activin is at least about 30 ng/ml. In another preferred embodiment the concentration of activin is about 100 ng/ml.
- Cell populations enriched for mesoderm may be obtained by culturing GFP-Bry embryonic stem cells in the absence of serum and the presence of activin for about two to about ten days, and isolating cells that express brachyury. The amount of activin is sufficient to induce differentiation of embryonic stem cells to mesoderm, but insufficient to induce differentiation to endoderm. Differentiation to mesoderm may be measured by assaying for the expression of genes associated with mesoderm development, including for example GATA-1, and the absence of expression of genes associated with endoderm development. In a preferred embodiment, the concentration of activin is less than 30 ng/ml. In another preferred embodiment the concentration of activin is about 3 ng/ml.
- The present invention further provides a method of identifying agents that affect the proliferation, differentiation or survival of the cell populations described above. The method comprises culturing cells from one of the cell populations described hereinabove in the absence and presence of an agent to be tested, and determining whether the agent has an effect on proliferation, differentiation or survival of the cell population. The agent to be tested may be natural or synthetic, one compound or a mixture, a small molecule or polymer including polypeptides, polysaccharides, polynucleutides and the like, an antibody or fragment thereof, a compound from a library of natural or synthetic compounds, a compound obtained from rational drug design, or any agent the effect of which on the cell population may be assessed using assays known in the art, for example standard proliferation and differentiation assays as described in
U.S. Patent No. 6,110,739 . Such agents are useful for the control of cell growth and differentiation in vivo and in vitro. - The present invention further provides a method of identifying genes involved in cell differentiation and development of specific lineages and tissues. The method comprises isolating populations of GFP+ cells of the invention after different amounts of time in culture, comparing gene expression profiles in the different populations, and identifying genes that are uniquely expressed in a population. In a preferred embodiment, microarray analysis and subtractive hybridization are used to compare gene expression profiles.
- In another embodiment, the present invention provides methods of making antibodies that recognize brachyury positive (brach+) cells but not brachyury negative (brach-) cells. Polyclonal antibodies may be made by injecting an animal with the cells of the invention in an immunogenic form. Also, antibodies may be made by identifying cells surface markers present in GFP+ but not GFP- cells, and making antibodies against the markers or fragments thereof. The antibodies may be monoclonal or polyclonal, and may be fragments, genetically engineered antibodies, single chain antibodies, and so on. Antibodies may be made by methods well-known in the art. Such antibodies are useful for identifying and isolating brach+ cells such as mesendoderm and mesoderm.
- The present invention also provides a method for generating mammalian cells in vitro. In one embodiment, the method comprises culturing cells from a cell population enriched in mesendoderm and mesoderm cells under conditions effective for the differentiation of mesoderm into cardiac muscle, vascular smooth muscle, endothelium or hematopoietic cells. Conditions effective for differentiation into the various cell types in vitro are known in the art. In another embodiment, the method comprises culturing cells from a cell population enriched in endoderm cells under conditions effective for the differentiation of endoderm into liver cells or pancreatic cells. Effective conditions for such differentiation are known in the art. The production of insulin-producing pancreatic islet cells is specifically contemplated.
- As demonstrated in accordance with the present invention, brach+ cells isolated from different aged EBs have different developmental potentials. Brach+/Flk- cells from about
day 3 mouse EBs efficiently generate hemotopoietic and endothelial lineages, while the cells from aboutday 3 to 10 EBs generate cells of cardiomyocyte lineages. Accordingly, by adjusting the time of culture of the ES cells used for obtaining the cell population enriched for mesendoderm and mesoderm, one of ordinary skill in the art can select for efficient production of hemotopoetic and endothelial lineages or cardiomyocyte lineages. - Such cells are useful, for example, for cell replacement therapy for the treatment of disorders that result from destruction or dysfunction of a limited number of cell types. Such disorders include diabetes mellitus, liver failure, heart failure, cardiovascular and other vascular disease, Duchenne's muscular dystrophy, osteogenesis imperfecta, and disorders treatable by bone marrow transplant, for example leukemias and anemias. See, Odorico et al., (2001) Stem Cells 19:193-204.
- The cell populations of the present invention are useful for generating differentiated cells and tissues for cell replacement therapies. The suitability of the cell populations of the present invention for cell replacement therapy may be assessed by transplanting the cells into animal models of disorders that are associated with the destruction or dysfunction of a limited number of cell types. For example, the fumarylacetoacetate (FAH) deficient mouse disclosed for example by Grompe et al. (1993) Genes & Dev. 7:2298, incorporated herein by reference, provides a model for liver failure. FAH deficient mice suffer from progressive liver failure and renal tubular damage unless treated with NTBC (2-(2-nitro-4-trifluoromethyl benzoyl) -1,3-cyclohexedione) or transplanted with normal hepatocytes. These mice thus provide an ideal model for testing the potential of cells with characteristics of immature hepatocytes generated from EBs. Methods for transplantation of hepatocytes into FAH deficient mice removed from NTBC are known in the art and disclosed for example by Oversturf et al. (1996) Nature Genet. 12:266-273. Normal liver function is indicated by survival of the mice, and may also be assessed by measuring serum aspartate transaminase levels, plasma bilirubin levels, and by determining normal structure of the regenerated liver.
- Animal models for other disorders that result from the destruction or dysfunction of particular cells types are known in the art. Such models may similarly be used to assess other cell populations of the present invention.
- The present invention also provides a transgenic non-human mammal in which DNA encoding a selectable marker is present in the brachyury locus such that one brachyury allele is inactivated and the selectable marker is expressed in cells in which the brachyury locus is transcribed. In a preferred embodiment the mammal is a mouse and the selectable marker is GFP. In particular, the transgenic mouse has a genome comprising a transgene in which a DNA sequence encoding GFP is operably linked to brachyury regulatory elements, and the transgene is expressed in cells that normally express brachyury. The transgenic mouse may be obtained by injecting the GFP-Bry ES cells described hereinabove into blastocysts, which are then implanted into pseudopregnant females. Transgenic pups are identified by the short-tail phenotype associated with brach +/-, and by molecular analysis. Such transgenic animals are useful for obtaining early embryos from which to isolate mesoderm to be used in accordance with the methods of the invention, and for the identification, isolation and characterization of any adult cell populations that express the brachyury gene. Such cells may represent novel stem cell populations.
- All references cited herein are incorporated herein in their entirety.
- The following examples serve to further illustrate the present invention.
- ES cell growth and differentiation. ES cells were maintained on irradiated embryonic feeder cells in Dulbecco's Modified Eagle Medium (DMEM) supplemented with 15% fetal calf serum (FCS), penicillin, streptomycin, LIF (1% conditioned medium) and 1.5 x 10⁻⁴ M monothioglycerol (MTG; Sigma). Two days prior to the onset of differentiation, cells were transferred on gelatinized plates in the same media. For the generation of EBs, ES cells were trypsinized and plated at various densities in differentiation cultures. Differentiation of EBs was carried out in 60 mm petri grade dishes in IMDM supplemented with 15% FCS, 2mM L-glutamine (Gibco/BRL), transferrin (200 ug/ml), 0.5mM ascorbic acid (Sigma), and 4.5 x 10⁻⁴ M MTG. Cultures were maintained in a humidified chamber in a 5% CO2/air mixture at 37°C.
- Serum Free Medium. Two different serum-free media were used in different aspects of the following examples: IIMD supplemented with Knockout SR (Gibco BRL) and StemPro 34 (Gibco BRL).
- Methylcellulose Colony Assay. A) Blast colonies: For the generation of blast cell colonies (BL-CFC assay), EB-derived cells were plated at 0.5 x - 1.5
x 105 cells/ml in 1% methylcellulose supplemented with 10% FCS (Hyclone), vascular endothelial growth factor (VEGF; 5 ng/ml), c-kit ligand (KL; 1% conditioned medium), IL-6 (5ng/ml) and 25% D4T endothelial cell conditioned medium (Kennedy et al. (1997) Nature 386:488-93). Transitional colonies were generated in the absence of VEGF. Colonies were scored following four days of culture. B) Hematopoietic colonies: For the growth of primitive and definitive hematopoietic colonies, cells were plated in 1% methylcellulose containing 10% plasma-derived serum (PDS; Antech), 5% protein-free hybridoma medium (PFHM-II; Gibco-BRL) plus the following cytokines: c-kit ligand (KL; 1% conditioned medium), erythropoietin (2 U/ml), IL-11 (25 ng/ml), IL-3 (1% conditioned medium), GM-CSF (3 ng/ml), G-CSF (30 ng/ml), M-CSF (5 ng/ml), IL-6 (5 ng/ml) and thrombopoietin (TPO; 5ng/ml). Cultures were maintained at 37°C, 5% CO2. Primitive erythroid colonies were scored at day 5-6 of culture, whereas definitive erythroid (BFU-E), macrophage, and multilineage colonies were counted at 7-10 days of culture. C-kit ligand was derived from media conditioned by CHO cells transfected with KL expression vector (kindly provided by Genetics Institute). IL-3 was obtained from medium conditioned by X63 AG8-653 myeloma cells transfected with a vector expressing IL-3. VEGF, GM-CSF, M-CSF, IL-6 ,IL-11, activin BMP2, BMP4, bFGF, FGF8, and lhh were purchased from R&D systems. - Reaggregation Cultures. Cells were cultured at 2x10⁵ per ml IMDM supplemented with 15% FCS (or Knockout SR), 2mM L-glutamine (GibcoBRL), 0.5mM ascorbic acid (Sigma), and 4.5 x 10⁻⁴ M MTG in 24-well petri-grade plates. These were used to prevent adhesion of the cells to the bottom of the well.
- Cardiac muscle assays. GFP+ cells were reaggregated in IMDM supplemented with 15% serum replacement. Twenty hours later the aggregates were cultured in wells of either a 24- or 96-well plate in IMDM with 10% serum replacement (serum-free). The wells were pre-treated with gelatin. Cultured were monitored daily for the development of the appearance of beating cells. Beating cells were usually detected between
days - Cell surface markers staining and FACS analysis. Standard conditions were used to stain the cells.. Stained suspensions were analyzed on a FACScan (Becton Dickinson, CA).
- Gene Expression Analysis For the poly A+ RT-PCR analysis the method of Brady et al. ((1990) Meth. in Mol. and Cell Bio. 2:17-25) was used. Reverse transcription, poly-A tailing and PCR procedures were performed as described, with the exception that the X-dT oligonucleotide was shortened to 5'-GTTAACTCGAGAATTC(T)24-3'. The amplified products from the PCR reaction were separated on agarose gels and transferred to a Zeta-probe GT membrane (Biorad) or transferred to the membrane with a slot blot apparatus (Schleicher & Schuell). The resulting blots were hybridized with 32P randomly primed cDNA fragments (Ready-to-Go Labelling, Pharmacia) corresponding to the 3' region of the genes (for all except β-H1). A β-H1-specific probe was prepared by annealing two oligonucleotides, (5'-TGGAGTCAAAGAGGGCATCATAGACACATGGG-3', 5'-CAGTACACTGGCAATCCCATGTG-3') which share an 8 base homology at their 3' termini. This β-H1 specific otigonucleotide was labeled with 32P using a Klenow fill-in reaction. For gene specific PCR, total RNA was extracted from each sample with RNeasy mini kit and treated with RNase free DNase (Qiagen). Two microgram of total RNA was reverse-transcribed into cDNA with random hexamer using a Omniscript RT kit (Qiagen). PCR was carried out using appropriate oligonucleotides. The PCR reactions were performed with 2.5 U of Taq polymerase (Promega), PCR buffer, 2.5 mM MgCI2, 0.2uM of each primer and 0.2mM dNTP. Cycling conditions were as follows; 94 °C for 5 min followed by 35 cycles of amplification (94 °C denaturation for 1 min, 60 °C annealing for 1 min, 72 °C elongation for 1 min) with a final incubation at 72 °C for 7 min.
- Under appropriate conditions in culture, embryonic stem (ES) cells will differentiate and form three dimensional colonies known as embryoid bodies (EBs) that contain developing cell populations from a broad spectrum of lineages. Smith (2001) Annu. Rev. Cell Dev. Biol. 17:435-62. Among these EB-derived populations, one can detect mesodermal derivatives including those of the hematopoietic, endothelial, cardiac muscle and skeletal muscle lineages.
- In order to track the onset of mesoderm in EBs and to isolate cells representing this population, the green fluorescence protein (GFP) was targeted to the brachyury locus. The targeting construct contained the GFP cDNA, and artificial intron, SV40 poly(A) sequences and a loxP flanked neo cassette in the first exon and is depicted in
Fig. 1 . The thymidine kinase (TK) gene was included at the 3' end of the targeting construct to select against random integration. The targeting vector was constructed as follows. - A BAC clone carrying the entire mouse Brachyury (Bry) gene was isolated by PCR screening of a 129/Ola strain genomic library (Genome Systems) with primers 5'-AAGGAGCTAACT AACGAGATGAT-3' and 5' -TACCTTCAGCACCGGGAACAT-3'. These primers anneal within the first and second Bry exon, respectively, and amplify a diagnostic band of ∼ 600 bp. An approximately 3 kb long PstI restriction fragment carrying the 1 exon of the Bry gene along with more than 2 kb of 5' flanking region was identified and subcloned from the BAC into plasmid pBSK (Strategene), resulting in construct pBSK.Bry-5'. Approximately 2 kb of the region immediately upstream of the start codon were sequenced to identify appropriate primer annealing sites for the construction of vectors.
- Oligos 5'-GCTAGCTAATGGATCCA-3' / 5'- GATCTGGATCCA TTAGCTAGCTGCA-3'and 5'-GATCTTAATGAACGGCAGGTGGGTGCGCGTCCGGA G-3' / 5'TCGACTCCGGACGCGCACCCACCTGCCGTTCATTAA-3' were inserted into the PstI/SaII sites of plasmid pBSK to create a new, more suitable polylinker with two successive translational stop codons and an artificial 3' splice site (construct pBry-AA). Plasmid pEGFP.C1 (Clontech) was double-digested with NheI/Bglll and the resulting ∼ 760bp DNA fragment encoding EGFP without stop codon was cloned into the Nhei/BgIII sites of pBRY-AA, resulting in construct pBry-AB. An XhollSalI fragment of plasmid pL2-Neo2 carrying a loxP-flanked neomycin resistance gene was inserted into the SaII. site of pBry-AB to give rise to plasmid pBry-AC (transcription of EGFP and Neo in same direction).
- A 556 bp XmaI/MIuI fragment carrying a consensus splice donor site, an artificial intron, a splice acceptor site and a short exon including the SV40 polyadenylation sequence, was excised from the commercial expression vector pBK-CMV (Stratagene). This fragment was inserted into plasmid pBry-AC in the following way: the XmaI end was ligated into the BspEI site following the last EGFP codon, whereas the Mlu end was inserted along with oligos 5'-CGCGTTACTAGTAAGACGTCT-3' / 5'-CCGGAGA CGTCTTACTAGTAA-3' as linkers into the BspEI site located just upstream of the loxP-neo-loxP cassette. Resulting construct: pBry-AE. An ∼1.9 kb XhoI/SaII fragment encoding the HSV thymidine kinase gene was inserted into the XhoI site of pBry-AE to allow selection against random integration (construct pBry-AH). A NotI/Eco47III fragment encoding the "short arm" of homology was excised from pBry-AF and cloned into the NotI/Eco47III sites of pBry-AH to give rise to plasmid pBry-AI. The "long arm" of homology was excised from pBry-AK with SaII and inserted in the correct orientation into the Sail site of pBry-AI to yield final targeting vector B.
- Embryonic stem cells (E14. 1,129/Ola Hooper et al. (1987) Nature 326:292) were electroporated with NotI-linearized targeting vector pBry-AM. Four dishes with transfected cells were subjected to G418 single-and another four dishes to G418 + Gancyclovir (Ganc) double-selection. Clones that had undergone a homologous recombination event were identified by PCR with one primer (5'-CAGGTAGAACCCACAA CTCCGAC-3') annealing to genomic sequences in the 5' region of the Bry gene, just upstream of the "short arm of homology", the other (5'-CCGGACACGCTGAACTTGTGGC-3') to the 5' portion of EGFP (diagnostic band: approximately 1.3 kb). Correctly targeted clones were confirmed by Southern blot analysis: genomic DNA of candidate clones was digested with HincII and hybridized to a probe located outside of the targeting construct. The probe was derived from the Bry 5'flanking region (-2018 to -1249 with respect to the Bry ATG start codon) by PCR using the oiigonucleotide pair 5'-ACAGGATCCCTAAGCCTCAAAAGAGTCGCT-3'/5'-TCTTGGATCCTCCTAT CCTATCCCGAAGCTCCT-3'. 384 G418 single- and 80 G418 + Ganc double-selected clones were screened, of which 4 respectively 3 proved to be positive, corresponding to a targeting efficiency of 1.04% and 3.75%. Two positive clones were transiently transfected with a modified Cre recombinase expression vector to remove the neo gene. These targeted clones are referred to hereinafter as GFP-Bry ES cells.
- Brachyury is expressed transiently in developing EBs with the onset preceding the expression of genes that define the establishment of the hematopoietic and endothelial lineages. To determine whether GFP expression in GFP-Bry ES cells accurately reflects expression of the brachyury gene during EB development, GFP expression was assessed.
- A typical expression pattern during a 6-day EB differentiation period is shown in
Figure 2A . In this experiment, low levels of message were detected within 24 hours of differentiation. Expression was upregulated over the next 48 hours, persisted throughday 4 and then declined sharply to undetectable levels byday 6 of differentiation. GFP expression, as defined by FACS analysis, followed a similar temporal pattern. Low levels of GFP+ cells (∼5%) were detected as early asday 2 of differentiation. More than half (65%) of the EB-derived cells expressed GFP atday 3 and almost all the cells were positive atday 4 of differentiation. As observed by PCR, expression dropped sharply after this point and byday 6 few, if any, GFP+ cells were present. This rapid decline in GFP expression indicated that it did not persist within the cells for extended periods of time. The high proportion of GFP+ cells atdays - The possibility that inactivation of a single brachyury allele could have detrimental effects on the in vitro developmental potential of the ES cells was assessed. As indicated, heterozygous mice demonstrate a mild phenotype. To determine if the GFP-Bry ES cells display any detectable defects in hematopoietic development, EBs generated from them were analyzed for hematopoietic precursor and blast colony-forming cell (BL-CFC) content and for gene expression patterns. The data in
Figures 3A and 3B indicate that GFP-Bry ES cells generate comparable numbers of primitive (EryP) and definitive (Eryd, Mac, Mac/Ery, and Mix) hematopoietic precursors and BL-CFC compared to the wild type cells. Gene expression patterns (Figure 3C ) confirmed the precursor analysis and show little difference between the EBs generated from the GFP-Bry and wild type ES cells. Both sets of EBs showed a decline in Rex-1 expression over the first 3 days of differentiation. Rex-1 is a transcription factor that is expressed in ES cells and downregulated as they undergo differentiation. Rogers et al. (1991) Development 113:815-24. The decline in Rex-1 is followed by the typical transient wave of brachyury expression which immediately precedes the onset of genes involved in the development of the hematopoietic and endothelial lineages. FIk-1, a receptor tyrosine kinase essential for the establishment of these lineages (Shalaby et al. (1995) Nature 376:62-6) is expressed betweenday day 4 of differentiation. Expression of all 3 genes was upregulated over the next 24 hours, reflecting the expansion and maturation of the primitive erythroid lineage at this developmental stage. Palis et al. (1999) Development 126:5073-84. The precursor numbers and the gene expression patterns observed in this example are consistent with those found in previous studies and indicate that the molecular programs leading to the establishment of the hematopoietic system are intact in the targeted GFP-Bry ES cells. - To determine if brachyury+ cells could be isolated based on GFP expression, the GFP+ population from day 3.5 EBs was sorted and analyzed for expression of appropriate genes.
Figure 4A shows the gates used for the isolation of the GFP positive (2) and negative(1) populations. RT-PCR analysis revealed brachyury expression was restricted to the GFP+ fraction indicating that cell sorting based on GFP expression can be used to isolate brachyury+ cells. Flk-1, one of the earliest makers of hematopoietic and endothelial development, was present at higher levels in GFP+ that in the GFP- fraction indicating that it was expressed in at least a subpopulation of brachyury+ cells. In contrast to brachyury and Flk-1, Pax-6, a gene involved in early neuronal development [79,80], was expressed at higher levels in the GFP- fraction consistent with precursors of this lineage being brachyury negative. These cell-sorting studies indicate that expression of GFP under the control of the brachyury locus provides a novel marker for the isolation, characterization and manipulation of brachyury+ cells from EBs. - This example demonstrates that GFP+ cells can be isolated from day 3.5 EBs by cell sorting. Gene expression analysis of the GFP+ and GFP- fractions shows that brachyury expression segregates predominantly to the positive fraction, a finding which clearly demonstrates that fractionation based on GFP provides a method for isolating brachyury positive cells. In addition to brachyury, the receptor tyrosine Flk-1 involved in early hematopoietic and endothelial development is also expressed at higher levels in the positive than in the negative fraction. In contrast, Rex-1 and Pax-6, markers of early ectoderm and neuroectoderm, are expressed in the GFP- fraction. These findings demonstrate that expression of GFP in the context of brachyury can be used to separate mesoderm from ectoderm.
- Flk-1 has been shown to be essential for the establishment of the hematopoietic and endothelial lineages in the early embryo and is expressed on the earliest precursors of these lineages, including the BL-CFC [Faloon et al. (2000) Development 127:1931-41]. Given this pivotal role in blood and vascular development, its expression within the GFP+ population was hypothesized to define a subpopulation of mesoderm undergoing specification to these lineages. To investigate this possibility further, EBs were analyzed at several stages of development for the presence of GFP and Flk-1 positive cells. In the experiment illustrated in
Figure 5A , 4.8% of the day 3.0 EB population expressed GFP but not Flk-1, whereas 1.2% of the cells expressed both markers. The size of both fractions increased dramatically over the next 12 hours with the GFP+/Flk-1- and GFP+/Flk-1+ cells representing 52% and 26% of the total EB population, respectively. To assess the developmental potential of the three populations defined by GFP and Flk-1 expression, GFP-Flk-1- (fraction 2), GFP+/Flk-1- (fraction 3) and GFP+/Flk-1+ (fraction 4) cells were isolated at both time points and analyzed for BL-CFC and 2° EB content and for gene expression patterns. The potential of the fractions was compared to that of the pre-sorted population (fraction 1). The majority of the BL-CFC were found in the GFP+/Flk-1+ fraction at both day 3.0 and 3.5 of differentiation (Figure 5B ). This is not surprising given that previous studies have shown that all BL-CFC express Flk-1. The 2° EB were restricted to the GFP-/Flk-1- fraction, a finding consistent with the fact that they derive from residual undifferentiated ES cells in the primary EBs. The GFP+/Flk-1-fraction generated few colonies under the conditions used in these cultures. The gene expression analysis revealed some interesting differences between the populations isolated at the 2 time points (Figure 5C ). Rex-1, the ES cell marker, was expressed at lower levels in the GFP+ than in the GFP- fraction, indicating that these populations are undergoing differentiation. Brachyury was expressed in the GFP+ fractions at both time points. The levels appear to be higher in the GFP+/Flk-1- than the GFP+/Fik-1+ fraction isolated from day 3.5 EBs, suggesting that its expression could be downregulated as these cells mature towards the hematopoietic and endothelial lineages. As expected, Flk-1 was expressed predominantly in the GFP+/Flk-1+ cells at both time points. Scl, a helix-loop-helix transcription factor that is essential for both primitive and definitive hematopoietic development (Shivdasani et al. (1995) Nature 373:432-4), appears to be restricted to the GFP+/Flk-1+ fraction. Similarly, the transcription factor Runx1, required for establishment of the definitive hematopoietic system (Wang et al. (1996) Proc. Natl. Acad. Sci. 93:3444-9), was most readily detected in GFP+/Flk-1+ fraction. There was some Runx1 expression in the GFP+/Flk-1- fraction isolated from day 3.0 EBs. Nodal is expressed in all 3 fractions atday 3 of differentiation. At day 3.5, the levels of expression in the GFP+/Flk-1+ fraction appear to be significantly lower than in the other fractions. Wnt3a and Wnt8a showed a remarkably restricted pattern of expression and were found only in the GFP+/Fik-1- fraction at both time points, consistent with an early mesoderm function prior to the expression of lineage restricted markers. BMP2 was expressed in both GFP+ fractions whereas BMP4 was found predominantly in the GFP+/Flk-1+ cells, indicating that these molecules play a role at distinct stages of development in this system. The BL-CFC potential and gene expression pattern of the GFP+/Flk-1+ cells indicates that they are representative of the extraembryonic mesoderm found in the mouse embryo. - This example demonstrates that the brachyury fraction of
day 3 and day 3.5 EBs can be separated into two fractions based on Flk-1 expression: brachyury+ /Flk-1-(GFP+/Flk-1-) and brachyury+/Flk-1+ (GFP+/Flk-1+) (Figure 5A ). Functional studies demonstrated that precursors (BL-CFC) able to generate both hematopoietic and endothelial cell segregated to the (GFP+/Flk-1+) fraction, suggesting that upregulation of Flk-1 is indicative of commitment to these lineages (Figure 5B ). Gene expression studies demonstrated distinct differences between the GFP+/Flk-1- and GFP+/Flk-1+ populations (Figure 5C ). - The expression patterns observed in
Figure 5 are consistent with the interpretation that the three fractions represent a developmental continuum with the GFP-/Flk-1- cells giving rise to the GFP+/Flk-1- cells which in turn give rise to the GFP+/Flk-1+ cells. To determine if these fractions do represent specific stages within a common developmental pathway, each was isolated fromday 3 EBs, cultured for 20 hours and then re-analyzed for GFP and Flk-1 expression. BL-CFC and Eryp-CFC potential was determined for each of the populations prior to and following culture. The isolated cells were cultured at densities of 1x10⁵ cells or greater in petri-grade 24-well plates in the same medium used for EB differentiation. Under these conditions, the cells rapidly reaggregate and form EB-like structures that appear to follow a normal developmental program with little expansion or loss in cell number. Following the 20-hour reaggregation culture, the GFP-/Flk-1- cells gave rise to a significant population of GFP+/Flk-1- cells as well as to a small number of GFP+/Flk-1+. GFP+/Flk-1- cells generated a substantial population of GFP+/Flk-1+ cells during the same culture period. The GFP+/Flk-1+ population appeared to lose some GFP and Flk-1 expression following the reaggregation culture. Results are shown inFigure 6 . The changes in precursor potential were consistent with the changes in surface markers. The GFP-/Flk-1- fraction, the most immature of the three, contained an undetectable number of BL-CFC and Eryp-CFC before or after culture. The GFP+/Flk-1-fraction also contained few BL-CFC and Eryp-CFC prior to culture. However, following culture, the BL-CFC potential increased dramatically, from 74 to 1564 per 105 cells, consistent with the increase in Flk-1 expression. The frequency of Eryp-CFC did not change during the culture period. The GFP+/Flk-1+ fraction contained BL-CFC but few Eryp-CFC prior to culture. No BL-CFC were detected following culture, however, the population now contained Eryp-CFC. Together with the surface marker analysis, these precursor data support a developmental progression from a pre-mesoderm (GFP-/Flk-1-) to a mesoderm/pre-hemangioblast (BL-CFC) population (GFP+/Flk-1-) to a hemangioblast/pre-erythroid population (GFP+/Flk-1+) to a post hemangioblast/erythroid population (possibly GFPlo/Flk-1lo). Not all the cells in a given population appear to differentiate following the 20-hour culture period as cells with the starting phenotype persisted in the GFP-/Flk-1- and GFP+/Flk-1- cultures. - This example indicates that when isolated and recultured for 20-24 hours, each of the three populations isolated from
day 3 EBs continued to differentiate and in a pattern that indicates that these populations represent a developmental continuum. For instance, GFP-/Flk-1- gave rise to GFP+/Flk-1- cells which in turn gave rise to GFP+/Flk-1+. These changes in cell surface characteristics were associated with the expected changes in developmental potential. The GFP+/Flk-1- fraction contained few hematopoietic/endothelial precursors (BL-CFC) prior to culture. Following culture, these precursors were detected, clearly demonstrating that the GFP+/Flk-1- fraction fromday 3 EBs does contain the potential to give rise to Flk-1+ cells with hematopoietic and endothelial potential. - The foregoing examples demonstrated that GFP+/Flk-1- cells isolated from day 3.0 EBs efficiently generated GFP+/Flk-1+ cells and BL-CFC following overnight culture. To determine if this pre-BL-CFC potential was specific to the GFP+/Flk-1- fraction isolated at this stage of development, GFP+/Flk-1- cells from different aged EBs were assayed for their ability to give rise to BL-CFC. As shown in
Figure 7A , the capacity to generate BL-CFC was most robust in theday 3 GFP+/Flk-1- cells. This developmental potential decreased dramatically by day 3.5 of differentiation and was almost non-existent at day 4.0. The BL-CFC content of the freshly isolated GFP+/Flk-1+ fraction from these same EBs increased over this period of time, indicating that differentiation was progressing in a normal fashion. The Flk-1 expression patterns in the reaggregated cultures from the different staged EB cells were consistent with BL-CFC data. The cultures from the reaggregated day 3.0 GFP+/Flk-1- cells contained a distinct Flk-1 fraction that represented more than 40% of the total population (Figure 7B ). Flk-1 expression in the day 3.5 and 4.0 cultures was significantly lower and consisted of a shoulder of the total population rather than a distinct peak. - Given the sequence of events in the mouse embryo in which the development of hematopoietic and endothelial mesoderm is followed by the development of cardiac and cranial mesoderm, the cardiomyocyte potential of the isolated populations was determined. For this analysis, aggregates from the cultures of the different populations were transferred to microtiter or 24-well plates in serum-free medium and monitored for the development of beating cell masses, indicative of cardiomyocytes. These conditions are known to support the efficient development of cardiomyocytes from the reaggregated cells. As an independent confirmation of the cardiomyocyte nature of the cells within these masses, a representative group was transferred to microscope slides, fixed and stained for the presence of the cardiac-specific isoform of Troponin T. All beating cell masses analyzed were found to contain Troponin T positive cells indicating that they were cardiomyocytes. Using this assay, the cardiomyocyte potential of the reaggregated GFP+/Flk-1- and GFP+/Flk-1+ fractions from different staged EBs was determined. For comparison, the BL-CFC potential of the freshly isolated GFP+/Flk-1+ cells and of the cultured GFP+/Flk-1- cells was analyzed.
Table I: BL-CFC, pre-BL-CFC and cardiomyocyte potential of the GFP+/Flk-1- and GFP+/Flk-1+ fractions isolated from different staged EBs. EB Age GFP+ Flk- GFP+Flk+ BL-CFC following culture beating following culture BL-CFC direct plating beating following culture 2.75 +++ - + - 3.5 + ++ +++ - 4.0 +/- ++ +++ - - As shown in Table 1, the BL-CFC potential of the different fractions was similar to that observed in previous experiments. The GFP+/Flk-1+ cells isolated from the three different EB populations generated BL-CFC, with the highest number found at day 3.5 and 4.0. The pre-BL-CFC potential in the GFP+/Flk-1- cells was greatest at day 2.75 and decreased significantly at 3.5 and 4.0. The cardiomyocyte potential of the fractions showed a reverse pattern. A significant proportion (>80%) of the transferred aggregates from day 3.5 and 4.0 GFP+/Flk-1- cells generated beating cardiomyocytes. No beating cells were observed in the aggregates generated from the earliest (day 2.75) GFP+/Flk-1-cells. Beating cells were not detected in aggregates generated from the GFP+/Flk-1+ cells isolated from EBs at any of the three stages of development. The findings from this analysis are consistent with the notion that GFP+/Flk-1- cells isolated at different stages have different potentials. Those that develop early appear to have a hemangioblast fate, whereas those that develop later generate the cardiac lineage and possibly other populations. The GFP+/Flk-1+ populations appear to have lost the cardiomyocyte potential and may be restricted to the hemangioblast lineages. Given these findings, the early developing (day 2.75-3.0) GFP+/Flk-1- cells are referred to as pre-hemangioblast mesoderm whereas the population that develops between day 3.5 and 4.0 are referred to as pre-cardiac mesoderm. The day 3.0-3.5 GFP+/Flk-1+ populations generate BL-CFC, whereas those isolated from later stage EBs (day 4.0) contain primitive erythroid progenitors, indicating the onset of hematopoietic commitment. Given this developmental potential, the GFP+/Flk-1+ population is referred to as hemangioblast mesoderm.
- Examples 5 and 6 demonstrate that GFP+ cells isolated from different aged EBs have different developmental potential. As indicated in the previous examples, GFP+/Flk-1- cells from
day 3 EBs efficiently generate both hematopoietic and endothelial lineages. These cells did not give rise to cardiotiyocytes (heart tissue) as demonstrated by the lack of beating cell masses. In contrast, GFP+ cells fromday 4 EBs gave rise to few Flk-1+ cells and BL-CFC following culture. This population did, however, generate cells of the cardiomyocte lineage. These findings demonstrate that the GFP+ (brachyury+) fraction isolated from different aged EBs have become patterned to distinct populations with different developmental fates. In addition to the conditions used and potentials observed in the foregoing examples, other potentials may be observed by altering conditions and additives. - To assess the role of serum in the development of brachyury+ cells, EBs were differentiated the absence of serum. EBs did develop under these conditions, although they were somewhat smaller than those found in normal conditions. In the absence of serum, no GFP+ cells were detected within these EBs, indicating that mesoderm was not induced under these conditions (
Figure 8 ). Significant numbers of GFP+/Flk-1- and GFP+/Flk-1+ cells did develop when serum was added to the cultures. These findings clearly demonstrate that components found within serum are able to induce the development and differentiation of brachyury+ cells. As a first step in identifying factors that might play a role in this process, BMP4 (20ng/ml) was added to the developing EBs in the serum free cultures. At this concentration, BMP4 did induce a significant population of brachyury+ cells within 3 days of differentiation. However, in contrast to the serum, BMP4 did not support the development of the GFP+/Flk-1+ population in this period of time. To determine if BMP4 could induce GFP+/Flk-1+ from GFP+/Flk-1- cells that were induced in the presence of serum, GFP+/Flk-1- cells were isolated from EBs differentiated for three days in the presence of serum. These cells were reaggregated in medium alone, in medium with serum or in medium with BMP4. As shown in the lower row ofFigure 8 , GFP+/Flk-1- cells did not differentiate substantially when reaggregated in the absence of serum. As expected, the same population generated a large GFP+/Flk-1+ population when serum was added to the cultures. Consistent with the findings in the primary differentiation cultures, BMP4 was unable to induce the development of significant numbers of GFP+/Flk-1+ cells from the cultured GFP+/Flk-1- cells. -
Fig.9 summarizes the stages in mesoderm development based upon the foregoing examples.Step # 1 represents mesoderm induction and patterning to a pre-hematopoietic and endothelial (pre-hemangioblast) fate.Step # 2 represents specification to the hematopoietic and endothelial lineages.Steps # 3 and #4 represent patterning to the pre-cardiac fate. - Studies using model systems such as Xenopus and Zebrafish have suggested that mesoderm and endoderm develop from a common precursor population known as mesendoderm. To determine whether or not a mesendoderm stage of development does exist in EBs, conditions for the development of the endoderm lineage were established. As a first step in establishing culture conditions for the development of this lineage, the amount of serum in the differentiation cultures was varied. EBs were generated in the presence and absence of serum (SP34 and then IMDM plus SR) and assayed at different stages for expression of genes associated with ectoderm, endoderm and mesoderm development. For the ectoderm lineage, development of the neuronal lineage was assessed analyzing expression of PAX6, Wntl, neruoD and neurofilament (NFL). These genes are known to be expressed at different stages of neruonal development. The early stages of endoderm development were monitored by expression of HNF3β. To evaluate later stages of endoderm development and specification, genes involved in liver development were analyzed. These included Hex, α-fetoprotein (AFP), HNF4, Albumin (Alb), α-1-antittrypsin (AAT) and tyrosine aminotransferase (TAT). Mesoderm development was monitored by expression of brachyury and GATA-1. In addition to gene expression patterns, neuronal development was assayed by monitoring neurite outgrowth from EBs. The neuronal nature of these neurites was demonstrated by βIII-Tubulin expression. Mesoderm development was also assessed by enumeration of hematopoietic progenitors in the EBs.
Figure 10 shows the impact of serum on the developmental potential of EBs over a 10-day differentiation period. In the presence of serum (serum) there is little neuro-ecotderm differentiation as demonstrated by the lack of expression of the genes associated with development of this lineage. HNF3β is expressed at early stages of differentiation (day 2-3) and then downregulated. As expected, GATA-1 is expressed in the EBs generated under these conditions. The pattern of expression of these genes was basically reversed in EBs grown in the absence of serum (serum-). These EBs expressed all the genes associated with neuroectoderm, but did not express the mesoderm/hematopoietic marker GATA-1. HNF3β was expressed in late stage EBs (day 10) grown under these conditions. The patterns of brachyury expression as monitored by GFP expression were consistent with these findings. EBs generated in the presence of serum generated a substantial brachyury+ population that was present betweendays Figure 11 ,-B-line). Brachyury was not detected in EBs grown in the absence of serum (Figure 11 , H- line). Hematopoietic precursor assays confirmed these fmdings. EBs generated in serum contained precursors (Figure 12 , speckled bar), whereas those grown without serum did not (Figure 12 , solid bar, not visible). Finally, evaluation of neurite potential of the EBs was consistent with these various analyses. None of the EBs grown in serum generated neurites. In contrast, 85% of those generated in the absence of serum displayed this activity (Figure 13 ). Taken together, these findings demonstrate the importance of culture conditions (serum) for the generation of specific lineages. They also demonstrate that neither serum complete- nor serum-free- conditions were optimal for endoderm development. - The strong upregulation of HNF3β in the early stage EBs generated in serum suggested that serum might be important for the establishment, but not the maturation of the endoderm lineage. To test this possibility, EBs were initiated for 2 days in the presence of serum and then switched to serum-free conditions (SR). As shown in
Figure 14 , EBs generated under these conditions (serum+/-) expressed HNF3β betweendays day 5 of differentiation. GATA-1 expression levels were reduced compared to those found in serum-stimulated EBs. Next,day 6 EBs generated under the serum+/- conditions were plated in tissue culture grade dishes (to allow them to adhere) in the presence of the growth factor bFGF. The dishes were coated with either gelatin or matrigel to determine if substrate had any impact on further endoderm differentiation. Five days later, the medium was changed and additional factors were added to these cultures to promote the development of the liver lineage. The experimental outline and data are shown inFigure 15 . In this experiment AFP was not expressed at theday 6 EB stage. Its levels of expression were upregulated when cultured in the presence of bFGF on either gelatin of matrigel. Low levels of ALB were also detected at this stage. ALB expression increased following the additional culture period in all conditions tested. AAT and TAT were also expressed following the last culture step. The highest levels of TAT were found when EB-derived cells were cultured in the presence of bFGF and Dex. These findings clearly indicate that it is possible to generate cells of the endoderm lineage and that under appropriate conditions, they will give rise to cells that express genes associated with the developing liver. - It was further determined if these endodermal cells developed from brachyury+ or brachyury- cells. To address this question, GFP (Bry)+ and GFP (Bry)- cells were isolated from day 2.5 EBs by cell sorting. These populations were allowed to reaggregate and cultured as clusters until
day 6. Onday 6, they were moved to the tissue culture grade dishes in medium with bFGF for 4 days (total of 10 days). Gene expression analysis indicated that cells, which express HNF3β, segregated to the GFP+ fraction (d2.5) (Figure 16 ). With time in culture, this gene was expressed in cells generated from the GFP-fraction. This likely reflects the fact that at later stages of expression HNF3β is expressed in non-endodermal population. AFP, HEX, ALB and HNF4 were all expressed in derivatives of the GFP+ fraction, but not in cell populations generated from the GFP-cells. In contrast, PAX6 and neuroD, markers of neuroectoderm, were found predominantly in cells generated from the GFP- fraction. These findings indicate that the endoderm lineage is established from a brachyury+ population, which also gives rise to the mesodermal lineage, and that these lineages derive from a common precursor, the mesendoderm. - To further evaluate the liver potential of the brachyury expressing cells, cell populations derived from both the bry+ and bry- fractions were analyzed for expression of genes representing early hepatocyte development such as α-fetoprotein (AFP), albumin (ALB) and transthyretin (TTR) and genes indicative of maturation of the lineage including alphal-antitrypsin (AAT), tyrosine aminotransferase (TAT) and carbamoyl phosphate synthetase I (CPase). β-actin expression was used as a control. Cells were analyzed prior to sorting and subsequent to sorting into bry+ and bry- populations. Fetal liver and adult liver controls were also analyzed. Expression of all of these genes was restricted to the cells derived from the bry+ population, indicating that cells with hepatocyte characteristics develop from brachyury expressing cells.
- The preliminary kinetic analysis described in Example 6 demonstrated that subpopulations of mesoderm with distinct developmental fates were generated in a defined temporal fashion. A more detailed kinetic analysis showed the dynamic development of the GFP+Flk1- (hereafter referred to as the GFP+ population) population between days 2.5 and 4.0 of differentiation (
Figure 18 ). When isolated and reaggregated, the day 2.5 and 3.0 GFP+ fractions generated blast cell colonies (indicated as hemangioblast potential inFigure 19 ) that represent the earliest stages of hematopoietic and endothelial commitment (Figure 19 ). This population of GFP+ cells displayed little cardiomyocyte (cardiac) potential. In contrast to the early GFP+ cells, those isolated from day 3.5 EBs showed significantly reduced BL-CFC potential, but were efficient at differentiating into cardiomyocytes. GFP+ cells isolated fromday 4 EBs did not give rise to cardiomyoctes and had little capacity to generate BL-CFC, suggesting they may be fated to some other mesodermal lineage. Gene expression analysis supported these functional assays and demonstrated molecular differences between the four GFP+ fractions (Figure 20 ). While some genes were expressed in all populations, others showed intriguing differential patterns. Wnt3a, a gene thought to be important for hematopoietic development and inhibitory for cardiac differentiation, was expressed in the day 2.5 and 3.0 populations and down regulated in the day 3.5 and 4.0 cells. This pattern is consistent with the change in developmental potential of these populations from hematopoietic/vascular to cardiac muscle. A second pattern of interest is that of the gene Mixl-1. This gene, which plays a role in the development of mesoderm and endoderm, was expressed in the day 2.5 and 3.0 GFP populations but not in the day 3.5 and 4.0 fractions. Taken together, the findings of this example clearly demonstrate that mesoderm populations with different developmental potential are generated in a defined temporal pattern within the EBs. In addition, expression analysis of the mesoderm/endoderm gene Mixl-1 indicates that cells with endoderm potential are also generated at a specific time, namely between day 2.5 and 3.0 of differentiation. - To further investigate the kinetics of endoderm development, GFP+ cells from day 3.0 and 4.0 EBs were isolated and cultured under conditions that promote the differentiation into hepatocyte-like cells. As shown in
Figure 21 , GFP+ cells (+/-) isolated from day 3.0 but not those from day 4.0 displayed endoderm potential as defined by expression of HNF3β. These findings indicate that endoderm is generated within the GFP+ population at a specific period of time, prior today 4 of differentiation. - To further evaluate the endoderm potential of the GFP+ population, GFP+ and GFP- day 2.5 EB cells were cultured for 14 day days under conditions known to promote hepatocyte differentiation and then transplanted under the kidney capsule of recipient SCID-beige mice. Several mice were sacrificed immediately following the transplant, the kidney with the graft was sectioned and the sections were stained with antibodies against Hep1 and AFP. Hep1 is a specific marker of hepatocytes whereas AFP is expressed in definitive endoderm and immature cells of the hepatocyte lineage. Some of the cells within the section stained positive for Hep1, whereas other cells, in the vicinity of the Hepl+ cells were found to express AFP. No Hepl+ or AFP+ cells were found in the graft of the GFP- negative cells. These findings support PCR data and demonstrate that there culture conditions support the development of cells with characteristics of immature hepatocytes, as defined by express of Hep1.
- While these transplantation experiments demonstrate the presence of hepatocyte-like cells in the grafts immediately following transplantation, it was difficult to monitor the maturation of these populations over time, as the transplanted tissues generated tumor-like masses known as teratomas. The teratomas likely develop from contaminating undifferentiated ES cells or from GFP+ primordial germ cells that are known to be of mesoderm origin and to express brachyury.
- To further enrich for cells with endodermal potential, the effects of growth factors known to induce this cell population in other model systems were tested. Studies in Xenopus have shown that activin will induce both mesoderm and endoderm from ectoderm in culture. Of particular interest was the observation that activin behaved as a morphogen in this model in that it induced different cell types at different concentrations used. To determine if activin displayed similar potential in the ES/EB system, it was added to the EB cultures using the following protocol. ES cells were differentiated for 2 days in Stem Pro 34 medium without serum. At this stage, the developing EBs were harvested and recultured in IMDM supplemented with serum replacement (serum free) and activin at a concentration of 100 ng/ml. EBs were harvested at different days and assayed for GFP+ expression and expression of genes indicative of ectoderm, mesoderm and endoderm development. As shown in
Figure 22A,B this amount of activin-induced brachyury as measured by GFP. While the kinetics of GFP induction was delayed compared to EBs differentiated in serum, this concentration of activin did induce substantial numbers of brachyury positive cells (60%) byday 6 of differentiation. Molecular analysis indicated that the activin-induced cells expressed a broad spectrum of genes associated with endoderm development including HNF3β, Mixl-1, Sox17, Hex-1, and pdx-1 (Figure 23C ). Induction of pdx-1 is of interest, as this gene is essential for pancreas development. Genes associated with hematopoietic development, such as GATA-1 and those indicative of neuroectoderm differentiation such as PAX6 were not induced by activin. - To determine if activin displayed morphogenic properties in the ES differentiation model, different concentrations of the factor were added to the EB cultures. As little as 1 ng/ml of activin induced GFP+ expression (10% of the total population) by 7 days of culture (
Figure 23A ). The frequency of GFP+ cells increased to 40% in cultures stimulated with 3ng/ml and reached plateau levels of greater than 50% at 30ng/ml. Gene expression analysis of these populations indicated that different concentrations of activin did induce different developmental programs. EB differentiated in the presence of 1 or 3 ng/ml of activin showed weak, if any, expression of the genes indicative of endoderm development (Figure 23A ). HNF3β, Sox17, Hex-1 were all induced in cultures stimulated with 10, 30, or 100 ng/ml of activin. Pdx-1 expression required the highest amount of activin and was induced best in EBs stimulated with 100ng/ml. Neither GATA1 nor c-fms was expressed at any concentration of activin. The pattern of PAX6 expression was the reverse to that of the endoderm genes and was downregulated with increasing concentrations of activin. - Activin-induced EBs did not express genes associated with hematopoietic commitment indicating that this developmental program was not induced. To further evaluate the hematopoietic potential of these EBs, they were analyzed for progenitor potential. As expected from the molecular analysis, these EBs contained no appreciable numbers of primitive (Ep) or definitive (mac/mix) hematopoietic progenitors (
Figure 24A ). When these activin induced EBs were further stimulated with serum for 2.5 days, however, they did generate some hematopoietic progenitors, indicating that they do contain mesodermal potential (Figure 24B ). - PCR analysis demonstrated that activin induced expression HNF3β as well as other genes known to be involved in endoderm differentiation. To better estimate the proportion of endodermal progenitors in the activin-induced EBs, cells from cultures stimulated with 100ng/ml activin were stained with antibodies against HNF3β and Hex1. EBs from un-induced cultures were used as controls (Activin-). A significant portion of the activin induced population (estimated at 50-60% of total) expressed both HNF3β and Hex1. None of the cells in the un-induced EBs expressed these proteins. These findings clearly demonstrate that a substantial number of cells within these EBs are of the endoderm lineage.
- To further investigate the potential of these activin-induced populations, GFP+ cells were isolated from EBs stimulated with 3ng or 100ng and cultured further (14 day total) in hepatocyte conductions. As shown in
Figure 25 , only cells from the 100ng cultures differentiated into cells that expressed albumin consistent with liver differentiation. Taken together, the findings from these studies indicate that activin functions as a morphogen in the ES/EB system and that high concentration are required for endoderm induction. - If the teratomas generated by the serum-induced brachyury+ cells resulted from the presence of primordial germ cells, it is possible that the activin induced cells may represent a better source of progenitors for transplantation, as the germ-cell program may not be induced under these conditions. To test this hypothesis, GFP+ and GFP- cells were isolated from EBs induced with 100 ng/ml of activin and cultured for 14 days to promote the differentiation of hepatocyte-like cells. Following this culture period, the cells were harvested and transplanted to the kidney capsule of recipient animals. Three weeks following transplantation, the mice were sacrificed and the kidneys analyzed. Results are shown in
Figs. 26A-C . All mice engrafted with GFP- cells developed large, multilineage teratomas, consisting of cells from all three germ layers. In contrast, no teratomas were detected in the animals transplanted with GFP+ cells. These cells give rise to differentiated cell masses consisting of endodermal and mesodermal derived tissues including gut epithelium, bone and skeletal muscle. In some instances, skin was also observed in the graft from the GFP+ cells, suggesting that this lineage might also develop from a bry+ cell. These findings indicate that it is possible to generate GFP+ populations from a bry+ cell. These findings indicate that it is possible to generate GFP+ populations that give rise to differentiated tissue without forming teratomas following transplantation. - The foregoing exmples clearly indicate that the hepatocyte lineage develops from a bry+ cell population that has both mesoderm and endoderm potential. Analysis of the bry+ fraction revealed that a subpopulation of these cells expressed the receptor tyrosine kinase c-kit (
Figure 27A ) and that this population was distinct from those cells that expressed Flk-1. To determine if c-kit expression could be a useful marker for the segregation of cell with endodermal potential, bry+/c-kit- (+/-) and bry+/c-kit+ (+/+) cells fromday 3 serum-stimulated EBs were assayed for hepatocyte potential. As shown inFigure 27B , HNF3β, AFP and ALB expressing cells were all derived from bry+/c-kit+ population. To estimate the endodermal potential of this fraction, sorted cells were plated onto glass coverslips and stained with an antibody to HNF3β. Greater than 80% of the bry+/c-kit+ cells expressed HNF3β protein, whereas less than 10% bry+/c-kit- were positive. These findings indicate that endodermal progenitors express both brachyury and c-kit and that this population is highly enriched for cells with endoderm potential. Isolation of cells based on brachyury and c-kit expression provides a novel strategy for the isolation of endodermal progenitors. - The PCR analysis presented in
Figure 23 indicates that different concentrations of activin induce different developmental programs and that cells with endodermal potential are induced with the highest levels of this factor. To quantify the differential response of activin, cells stimulated with different concentrations of activin were adhered to coverslips and stained with the anti-HNF3β antibody. More than 50% of the entire EB population stimulated with 100ng/ml of activin expressed HNF3β whereas only 10% of the cells stimulated with 3ng/ml were positive. Only background levels of staining were observed in the non-stimulated population. These findings demonstrate that high concentrations of activin can stimulate a robust endodermal program, representing a significant portion of entire EB population. - As a further assessment of the potential of activin treated cells,
day 6 EBs differentiated in the presence of different concentrations of this factor were transferred to serum replacement media for 4 days and then replated in hepatocyte conditions for an additional 4 days. Atday 14 of culture, the cells from each group were harvested and subjected to PCR expression analysis. Expression of Myf5 and skeletal actin were monitored to evaluate skeletal muscle development representing an additional mesoderm-derived lineage. Surfactant protein C (SP-C), a lung-specific gene, was included as a marker of endoderm differentiation in addition to AFP and ALB. As shown inFig. 28 , Myf5 and skeletal actin were expressed in cultures stimulated with as little as 1ng/ml of activin and this expression was detected over a broad range of factor concentrations. Expression of both genes was, however, downregulated at the highest concentration of activin (100ng/ml). Cultures stimulated with low amounts of activin contained groups of cells with the morphology of skeletal muscle. Immunostaining demonstrated that these cells expressed both skeletal myosin and α-actinin, indicating that they are of the skeletal muscle lineage. Evaluation of the proportion of replated EBs that generated skeletal muscle outgrowths was consistent with the gene expression analysis, as those stimulated with 3 and 10 ng/ml displayed the most robust skeletal muscle development as depicted inFig. 28 . The expression patterns of the three endodermal genes differed from that observed for the skeletal muscle genes. None were expressed at low activin concentrations and all were readily detected in cultures stimulated with the highest concentrations of the factor. Expression of PAX6 was restricted to untreated cultures and those stimulated with low concentrations of factor. The findings from this analysis confirm and extend those from Example 12 hereinabove in demonstrating that different concentrations of activin induce different developmental programs, with low concentration favoring a mesodermal fate and high concentrations an endoderm fate. In addition, these results indicate that the endodermal cells induced by activin are able to differentiate and give rise to cells with hepatocyte and lung characteristics. - Brachyury positive and negative populations isolated from EBs stimulated with low and high concentrations of factor were also analyzed for expression of the skeletal muscle and endoderm genes. As shown in
Figure 29 , both myf5 and skeletal actin expression were restricted to the population generated from the bry+ population isolated from EBs stimulated with 3ng/ml of activin. Similarly, the endoderm genes were expressed in the brachyury+-derived cells isolated from EBs generated in the presence of 100ng/ml of factor. These findings further demonstrate that both mesoderm and endoderm develop from brachyury+ cells. - Embodiments of the invention are also described in the claims of the International application as filed:
- 1. A cell population enriched for mesendoderm and mesoderm cells.
- 2. The cell population of
Claim 1 comprising at least about 50% mesendoderm and mesoderm cells. - 3. The cell population of
Claim 1 comprising at least about 75% mesendoderm and mesoderm cells. - 4. The cell population of
Claim 1 comprising at least about 90% mesendoderm and mesoderm cells. - 5. The cell population of
Claim 1 obtained by culturing embryonic stem cells in the presence of serum for a time sufficient to obtain cells that express brachyury, and isolating said cells that express brachyury. - 6. The cell population of
Claim 5 wherein said embryonic stem cells are human embryonic stem cells. - 7. The cell population of
Claim 6 wherein said time is about two to about eighteen days. - 8. A method of isolating the cell population of
Claim 1 comprising culturing embryonic stem cells in the presence of serum for a time sufficient to obtain cells that express brachyury, and isolating said cells that express brachyury. - 9. The method of
Claim 8 wherein a selectable marker gene is inserted into the brachury locus of said embryonic stem cells, and cells that express brachury are isolated by selecting for cells that express the selectable marker. - 10. The method of
Claim 8 wherein the selectable marker is enhanced green fluorescence protein. - 11. A cell population enriched for endoderm cells.
- 12. The cell population of
Claim 11 comprising at least about 50% endoderm cells. - 13. The cell population of
Claim 11 comprising at least about 75% endoderm cells. - 14. The cell population of
Claim 11 comprising at least about 90% endoderm cells. - 15. The cell population of
Claim 11 obtained by culturing human embryonic stem cells in the presence of serum for about two to about ten days, isolating cells that express brachyury, and culturing said cells that express brachyury in the absence of serum for about one to about fifteen days. - 16. A method of isolating the cell population of
Claim 11 comprising culturing human embryonic stem cells in the presence of serum for about two to about ten days, isolating cells that express brachyury, and culturing said cells that express brachyury in the absence of serum for about one to about fifteen days. - 17. The method of Claim 16 wherein a selectable marker gene is inserted into the brachyury locus of said embryonic stem cells, and cells that express brachyury are isolated by selecting for cells that express the selectable marker.
- 18. The method of Claim 17 wherein the selectable marker is enhanced green fluorescence protein.
- 19. A method of isolating the cell population of
Claim 11 comprising culturing embryonic stem cells in the absence of serum and in the presence of a sufficient amount of activin to induce differentiation of embryonic stem cells to endoderm, and isolating cells that express brachyury. - 20. A method of isolating a cell population enriched for mesoderm cells comprising culturing embryonic stem cells in the absence of serum and in the presence of activin in an amount sufficient to induce differentiation of embryonic stem cells to mesoderm but insufficient to induce differentiation of embryonic stems cells to endoderm, and isolating cells that express brachyury.
- 21. A method of identifying endodermal cells capable of functioning as mature hepatocytes comprising isolating the cell population of
Claim 11, transplanting a subpopulation of said population into an animal exhibiting a disorder associated with hepatocyte destruction or dysfunction, and assaying for liver function, wherein an improvement in liver function in said animal is indicative of the identification of endodermal cells capable of functioning as mature hepatocytes. - 22. The method of Claim 21 wherein said animal is a fumarylacetoacetate deficient mouse.
- 23. A method of identifying an agent that affects the proliferation, differentiation or survival of mesendoderm and mesoderm cells comprising culturing the cell population of
Claim 1 in the presence of an agent to be tested and comparing the proliferaton, differentiation or survival of said cells in the presence and absence of said agent, wherein a difference in the presence of said agent is indicative of the identification of an agent that affects the proliferation, differentiation or survival of said cells. - 24. A method of identifying an agent that affects the proliferation, differentiation or survival of enoderm cells comprising culturing the cell population of
Claim 11 in the presence of an agent to be tested and comparing the proliferation, differentiation or survival of said cells in the presence and absence of said agent, wherein a difference in the presence of said agent is indicative of the identification of an agent that affects the proliferation, differentiation or survival of said cells. - 25. A method of identifying genes involved in cell differentiation comprising incubating embryonic stem cells under conditions to obtain cells that express brachyury, isolating two populations of cells that express brachyury after two different amounts of time in culture, comparing gene expression profiles in said two populations, and identifying genes that are uniquely expressed in a population, wherein identification of a gene that is uniquely expressed in a population is indicative of identification of a gene involved in cell differentiation.
- 26. A method of making antibodies that recognize cells that express brachyury but not cells that do not express brachyury comprising inserting a selectable marker into the brachyury locus of embryonic stem cells, culturing said cells, isolating cells that express brachyury by selecting for cells that express the selectable marker to provide an isolated population of cells that express brachyury, and raising antibodies against said isolated population.
- 27. The method of
Claim 26 wherein the antibodies are monoclonal or polyclonal. - 28. A method for generating mammalian cells comprising culturing the cell population of
Claim 1 under conditions effective for the differentiation of mesoderm into cardiac muscle, vascular smooth muscle, endothelium or hematopoietic cells. - 29. A method for generating mammalian cells comprising culturing the cell population of
Claim 11 under conditions effective for the differentiation of endoderm into liver cells or pancreatic cells. - 30. A transgenic non-human mammal having a genome comprising a transgene in which DNA encoding a selectable marker is present in the brachyury locus and the selectable marker is expressed in cells that express brachyury.
Claims (6)
- A method of identifying an agent that affects the proliferation, differentiation or survival of mesoderm cells comprising: culturing mammalian embryonic stem cells in differentiation culture that does not contain activin until developing embryoid bodies are formed; reculturing the developing embryoid bodies in the absence of serum and in the presence of activin at a concentration of 30 ng/ml or less and isolating cells that express brachyury to generate a cell population enriched for mesoderm cells; culturing the cell population in the presence of an agent to be tested; and comparing the proliferation, differentiation or survival of said cells in the presence and absence of said agent, wherein a difference in the presence of said agent is indicative of the identification of an agent that affects the proliferation, differentiation or survival of said cells.
- A method of identifying an agent that affects the proliferation, differentiation or survival of endoderm cells comprising: culturing mammalian embryoid bodies in the presence of activin at a concentration of at least 30 ng/ml to generate a cell population enriched for endoderm cells; culturing the cell population in the presence of an agent to be tested; and comparing the proliferation, differentiation or survival of said cells in the presence and absence of said agent, wherein a difference in the presence of said agent is indicative of the identification of an agent that affects the proliferation, differentiation or survival of said cells.
- A method for generating cardiac muscle, endothelial or hematopoietic cells comprising culturing mammalian embryonic stem cells in differentiation culture that does not contain activin until developing embryoid bodies are formed; reculturing the developing embryoid bodies in the absence of serum and in the presence of activin at a concentration of 30 ng/ml or less and isolating cells that express brachyury to generate a cell population enriched for mesoderm cells; and culturing the cell population under conditions effective for differentiation of mesoderm to cardiac muscle, vascular smooth muscle, endothelial or hematopoietic cells.
- A method for generating liver cells, lung cells, or pancreatic cells comprising culturing mammalian embryoid bodies in the presence of activin at a concentration of activin of at least 30 ng/ml to generate a cell population enriched for endoderm cells, and culturing the population of endoderm under conditions effective for differentiation of endoderm to liver cells, lung cells, or pancreatic cells.
- A method of identifying endodermal cells capable of functioning as mature hepatocytes comprising culturing mammalian embryoid bodies in the presence of activin at a concentration of at least 30 ng/ml to generate a cell population enriched for endoderm cells; transplanting a subpopulation of said population into an animal exhibiting a disorder associated with hepatocyte destruction or dysfunction, and assaying for liver function, wherein an improvement in liver function in said animal is indicative of the identification of endodermal cells capable of functioning as mature hepatocytes.
- The method of Claim 5 wherein said animal is a fumarylacetoacetate deficient mouse.
Applications Claiming Priority (3)
| Application Number | Priority Date | Filing Date | Title |
|---|---|---|---|
| US38161702P | 2002-05-17 | 2002-05-17 | |
| US44485103P | 2003-02-04 | 2003-02-04 | |
| EP03816210A EP1543110A4 (en) | 2002-05-17 | 2003-05-19 | Mesoderm and definitive endoderm cell populations |
Related Parent Applications (1)
| Application Number | Title | Priority Date | Filing Date |
|---|---|---|---|
| EP03816210.3 Division | 2003-05-19 |
Publications (1)
| Publication Number | Publication Date |
|---|---|
| EP2361966A1 true EP2361966A1 (en) | 2011-08-31 |
Family
ID=33436666
Family Applications (2)
| Application Number | Title | Priority Date | Filing Date |
|---|---|---|---|
| EP03816210A Ceased EP1543110A4 (en) | 2002-05-17 | 2003-05-19 | Mesoderm and definitive endoderm cell populations |
| EP10011700A Withdrawn EP2361966A1 (en) | 2002-05-17 | 2003-05-19 | Mesoderm and definitive endoderm cell populations |
Family Applications Before (1)
| Application Number | Title | Priority Date | Filing Date |
|---|---|---|---|
| EP03816210A Ceased EP1543110A4 (en) | 2002-05-17 | 2003-05-19 | Mesoderm and definitive endoderm cell populations |
Country Status (7)
| Country | Link |
|---|---|
| US (8) | US7763466B2 (en) |
| EP (2) | EP1543110A4 (en) |
| JP (2) | JP2006513727A (en) |
| AU (2) | AU2003304106C1 (en) |
| CA (2) | CA2684022C (en) |
| SG (1) | SG141296A1 (en) |
| WO (1) | WO2004098490A2 (en) |
Families Citing this family (58)
| Publication number | Priority date | Publication date | Assignee | Title |
|---|---|---|---|---|
| CA2470539C (en) * | 2001-12-07 | 2011-10-04 | Geron Corporation | Islet cells from human embryonic stem cells |
| US20060003446A1 (en) | 2002-05-17 | 2006-01-05 | Gordon Keller | Mesoderm and definitive endoderm cell populations |
| WO2004098490A2 (en) * | 2002-05-17 | 2004-11-18 | Mount Sinai School Of Medicine Of New York University | Mesoderm and definitive endoderm cell populations |
| CN103898047B (en) * | 2003-12-23 | 2020-03-03 | 维亚希特公司 | Definitive endoderm |
| US7625753B2 (en) | 2003-12-23 | 2009-12-01 | Cythera, Inc. | Expansion of definitive endoderm cells |
| AU2013200203B2 (en) * | 2003-12-23 | 2014-11-20 | Viacyte, Inc. | Definitive endoderm |
| US8647873B2 (en) | 2004-04-27 | 2014-02-11 | Viacyte, Inc. | PDX1 expressing endoderm |
| US7541185B2 (en) * | 2003-12-23 | 2009-06-02 | Cythera, Inc. | Methods for identifying factors for differentiating definitive endoderm |
| US7985585B2 (en) | 2004-07-09 | 2011-07-26 | Viacyte, Inc. | Preprimitive streak and mesendoderm cells |
| WO2007059007A2 (en) | 2005-11-14 | 2007-05-24 | Cythera, Inc. | Markers of definitive endoderm |
| US20050266554A1 (en) * | 2004-04-27 | 2005-12-01 | D Amour Kevin A | PDX1 expressing endoderm |
| AU2016235001B2 (en) * | 2004-07-09 | 2018-12-13 | Viacyte, Inc. | Methods for identifying factors for differentiating definitive endoderm |
| NZ582597A (en) * | 2004-07-09 | 2011-08-26 | Viacyte Inc | Preprimitive streak and mesendoderm cells |
| AU2015203517B2 (en) * | 2004-07-09 | 2018-01-04 | Viacyte, Inc. | Preprimitive streak and mesendoderm cells |
| CA2573283C (en) * | 2004-07-09 | 2023-03-14 | Cythera, Inc. | Methods for identifying factors for differentiating definitive endoderm |
| EP1791952A4 (en) | 2004-08-13 | 2008-06-11 | Univ Georgia Res Found | COMPOSITIONS AND METHODS FOR SELF-RENEWAL AND DIFFERENTIATION IN HUMAN EMBRYONIC STEM CELLS |
| EP1797171A1 (en) * | 2004-09-29 | 2007-06-20 | Cellartis AB | Methods for the generation of hepatocyte-like cells from human blastocyst-derived stem (hbs) |
| EP1838843B1 (en) * | 2004-12-23 | 2019-07-10 | Viacyte, Inc. | Expansion of definitive endoderm cells |
| JP4824036B2 (en) * | 2004-12-23 | 2011-11-24 | ヴィアサイト,インコーポレイテッド | Definitive endoderm cell proliferation |
| AU2006305879B2 (en) | 2005-10-27 | 2012-05-10 | Viacyte, Inc. | PDX1-expressing dorsal and ventral foregut endoderm |
| US11254916B2 (en) | 2006-03-02 | 2022-02-22 | Viacyte, Inc. | Methods of making and using PDX1-positive pancreatic endoderm cells |
| EP1999253B1 (en) | 2006-03-02 | 2019-05-22 | Viacyte, Inc. | Endocrine precursor cells, pancreatic hormone-expressing cells and methods of production |
| US7695965B2 (en) | 2006-03-02 | 2010-04-13 | Cythera, Inc. | Methods of producing pancreatic hormones |
| US8415153B2 (en) | 2006-06-19 | 2013-04-09 | Geron Corporation | Differentiation and enrichment of islet-like cells from human pluripotent stem cells |
| US8874380B2 (en) | 2010-12-09 | 2014-10-28 | Rutgers, The State University Of New Jersey | Method of overcoming therapeutic limitations of nonuniform distribution of radiopharmaceuticals and chemotherapy drugs |
| WO2008048647A1 (en) * | 2006-10-17 | 2008-04-24 | Cythera, Inc. | Modulation of the phosphatidylinositol-3-kinase pathway in the differentiation of human embryonic stem cells |
| CN103627671A (en) * | 2007-01-30 | 2014-03-12 | 佐治亚大学研究基金会 | Method for generating endoderm and mesoderm lineages and multipotent migratory cells (MMC), and cell population and use |
| CA2690610C (en) * | 2007-07-31 | 2023-03-28 | Asubio Pharma Co., Ltd. | Method of constructing masses of myocardial cells and use of the myocardial cell mass |
| US7695963B2 (en) | 2007-09-24 | 2010-04-13 | Cythera, Inc. | Methods for increasing definitive endoderm production |
| US8338170B2 (en) * | 2008-04-21 | 2012-12-25 | Viacyte, Inc. | Methods for purifying endoderm and pancreatic endoderm cells derived from human embryonic stem cells |
| WO2009137844A2 (en) * | 2008-05-09 | 2009-11-12 | Vistagen Therapeutics, Inc. | Pancreatic endocrine progenitor cells derived from pluripotent stem cells |
| JP2010075631A (en) * | 2008-09-29 | 2010-04-08 | Japan Science & Technology Agency | Method for differentiating and inducing liver from undifferentiated cell |
| AU2009313870B2 (en) | 2008-11-14 | 2013-07-11 | Viacyte, Inc. | Encapsulation of pancreatic cells derived from human pluripotent stem cells |
| DK2438160T3 (en) | 2009-06-05 | 2016-01-11 | Cellular Dynamics Int Inc | Reprogramming of T cells and hematopoietic cells |
| US9506114B2 (en) | 2009-08-28 | 2016-11-29 | Cellular Dynamics International, Inc. | Identifying genetic variation in affected tissues |
| EP2490701B9 (en) | 2009-10-19 | 2017-11-15 | Cellular Dynamics International, Inc. | Cardiomyocyte production |
| US9273286B2 (en) | 2010-06-13 | 2016-03-01 | Institute Of Biophysics, Chinese Academy Of Sciences | Methods and compositions for preparing cardiomyocytes from stem cells and uses thereof |
| JP5984217B2 (en) | 2010-06-15 | 2016-09-06 | セルラー ダイナミクス インターナショナル, インコーポレイテッド | Preparation of induced pluripotent stem cells from a small amount of peripheral blood |
| CA2802525C (en) | 2010-06-18 | 2021-06-22 | Cellular Dynamics International, Inc. | Cardiomyocyte medium with dialyzed serum |
| WO2012018933A2 (en) | 2010-08-04 | 2012-02-09 | Cellular Dynamics International, Inc. | Reprogramming immortalized b cells |
| US9181529B2 (en) | 2010-10-19 | 2015-11-10 | Cellular Dynamics International, Inc. | Titration of differentiation medium components |
| JP6185907B2 (en) | 2011-03-30 | 2017-08-23 | セルラー ダイナミクス インターナショナル, インコーポレイテッド | Prestimulation of pluripotent stem cells for neural differentiation |
| CN104508121B (en) | 2012-07-23 | 2018-01-19 | 中国科学院生物物理研究所 | Method for inducing pluripotent stem cells to differentiate into ventricular myocytes in vitro |
| KR102366081B1 (en) | 2012-07-31 | 2022-02-23 | 에이지엑스 쎄라퓨틱스, 인크. | Hla g-modified cells and methods |
| WO2014053709A1 (en) | 2012-10-05 | 2014-04-10 | Glykos Finland Oy | A method for culturing stem cells |
| USD1009775S1 (en) | 2014-10-15 | 2024-01-02 | Maxeon Solar Pte. Ltd. | Solar panel |
| USD933584S1 (en) | 2012-11-08 | 2021-10-19 | Sunpower Corporation | Solar panel |
| WO2014200339A1 (en) * | 2013-06-11 | 2014-12-18 | Pluriomics B.V. | Culture medium compositions for maturating cardiomyocytes derived from pluripotent mammalian stem cells |
| US9404086B2 (en) * | 2014-03-26 | 2016-08-02 | Ge Healthcare Uk Limited | Method for cell differentiation |
| EP3134515B1 (en) | 2014-04-24 | 2019-03-27 | Board of Regents, The University of Texas System | Application of induced pluripotent stem cells to generate adoptive cell therapy products |
| FR3024462A1 (en) * | 2014-07-29 | 2016-02-05 | Univ Pierre Et Marie Curie Paris 6 | METHOD FOR IN VITRO PRODUCTION OF ADIPOCYTE PROGENITORS AND ADIPOCYTES |
| USD999723S1 (en) | 2014-10-15 | 2023-09-26 | Sunpower Corporation | Solar panel |
| USD913210S1 (en) | 2014-10-15 | 2021-03-16 | Sunpower Corporation | Solar panel |
| USD896747S1 (en) | 2014-10-15 | 2020-09-22 | Sunpower Corporation | Solar panel |
| USD933585S1 (en) | 2014-10-15 | 2021-10-19 | Sunpower Corporation | Solar panel |
| WO2016104541A1 (en) | 2014-12-24 | 2016-06-30 | 国立大学法人京都大学 | Endodermal cell production method, liver cell production method, pancreatic cell production method, endodermal cell induction promoter, liver cell induction promoting kit, pancreatic cell induction promoting kit, and micro fluid device |
| MX2018005274A (en) | 2015-10-30 | 2019-09-19 | The Regents Of The Universtiy Of California | Methods of generating t-cells from stem cells and immunotherapeutic methods using the t-cells. |
| US10767164B2 (en) | 2017-03-30 | 2020-09-08 | The Research Foundation For The State University Of New York | Microenvironments for self-assembly of islet organoids from stem cells differentiation |
Citations (3)
| Publication number | Priority date | Publication date | Assignee | Title |
|---|---|---|---|---|
| US5843780A (en) | 1995-01-20 | 1998-12-01 | Wisconsin Alumni Research Foundation | Primate embryonic stem cells |
| US6110739A (en) | 1994-11-21 | 2000-08-29 | National Jewish Medical And Research Center | Method to produce novel embryonic cell populations |
| WO2002029012A1 (en) * | 2000-10-03 | 2002-04-11 | University Of North Carolina | Processes for clonal growth of hepatic progenitor cells |
Family Cites Families (28)
| Publication number | Priority date | Publication date | Assignee | Title |
|---|---|---|---|---|
| US4997815A (en) * | 1988-11-01 | 1991-03-05 | Children's Hospital Medical Center Of Northern California | Method for augmenting fetal hemoglobin by treatment with activin and/or inhibin |
| US5563059A (en) * | 1993-02-23 | 1996-10-08 | Genentech, Inc. | Use of human inhibin and human activin to increase the number of mature primate oocytes |
| US5629194A (en) * | 1994-10-21 | 1997-05-13 | Diacrin, Inc. | Isolated porcine pancreatic cells for use in treatment of diseases characterized by insufficient insulin activity |
| AU4353696A (en) * | 1996-01-09 | 1997-08-01 | Regents Of The University Of California, The | Ungulate embryonic stem-like cells, making and using the cells to produce transgenic ungulate |
| US5851984A (en) * | 1996-08-16 | 1998-12-22 | Genentech, Inc. | Method of enhancing proliferation or differentiation of hematopoietic stem cells using Wnt polypeptides |
| DE19837438A1 (en) * | 1998-08-18 | 2000-02-24 | Biotechnolog Forschung Gmbh | Recombinant human cell for forming bone and cartilage cells from undifferentiated mesenchyme is capable of expressing a member of the T-box family of transcription factors |
| US6667176B1 (en) | 2000-01-11 | 2003-12-23 | Geron Corporation | cDNA libraries reflecting gene expression during growth and differentiation of human pluripotent stem cells |
| US6432673B1 (en) | 1998-12-07 | 2002-08-13 | Zymogenetics, Inc. | Growth factor homolog ZVEGF3 |
| GB9828383D0 (en) | 1998-12-22 | 1999-02-17 | Medical Res Council | Cell lineage markers |
| JP2002538779A (en) * | 1999-02-10 | 2002-11-19 | キュリス インコーポレイテッド | Pancreatic cell progenitor cells, methods and uses related thereto |
| JP2002543854A (en) | 1999-05-14 | 2002-12-24 | カイロン コーポレイション | Expression of ETS domain protein in cancer |
| EP1248834A4 (en) | 2000-01-21 | 2004-03-17 | Univ Johns Hopkins | Human embryoid body-derived cells |
| US7282366B2 (en) | 2000-04-27 | 2007-10-16 | Geron Corporation | Hepatocytes for therapy and drug screening made from embryonic stem cells |
| JP4426064B2 (en) | 2000-05-31 | 2010-03-03 | 独立行政法人科学技術振興機構 | Method for in vitro formation of vertebrate pancreas |
| US6632620B1 (en) * | 2000-06-22 | 2003-10-14 | Andrew N. Makarovskiy | Compositions for identification and isolation of stem cells |
| CA2417356A1 (en) | 2000-08-01 | 2002-02-07 | Yissum Research Development Company | Directed differentiation of embryonic cells |
| US6586251B2 (en) | 2000-10-31 | 2003-07-01 | Regeneron Pharmaceuticals, Inc. | Methods of modifying eukaryotic cells |
| US20030027331A1 (en) | 2000-11-30 | 2003-02-06 | Yan Wen Liang | Isolated homozygous stem cells, differentiated cells derived therefrom, and materials and methods for making and using same |
| US20050054102A1 (en) * | 2001-04-19 | 2005-03-10 | Anna Wobus | Method for differentiating stem cells into insulin-producing cells |
| CA2470539C (en) | 2001-12-07 | 2011-10-04 | Geron Corporation | Islet cells from human embryonic stem cells |
| GB0207299D0 (en) * | 2002-03-28 | 2002-05-08 | Franks Christopher R | Stem cell therapy |
| WO2004098490A2 (en) * | 2002-05-17 | 2004-11-18 | Mount Sinai School Of Medicine Of New York University | Mesoderm and definitive endoderm cell populations |
| US20060003446A1 (en) * | 2002-05-17 | 2006-01-05 | Gordon Keller | Mesoderm and definitive endoderm cell populations |
| US20040121464A1 (en) * | 2002-09-30 | 2004-06-24 | Rathjen Peter David | Method for the preparation of cells of mesodermal lineage |
| CN103898047B (en) | 2003-12-23 | 2020-03-03 | 维亚希特公司 | Definitive endoderm |
| WO2005097980A2 (en) | 2004-03-26 | 2005-10-20 | Geron Corporation | New protocols for making hepatocytes from embryonic stem cells |
| EP1584680A1 (en) | 2004-04-08 | 2005-10-12 | Boehringer Ingelheim Austria GmbH | Fed-batch fermentation process for the production of plasmid DNA |
| JP2010534065A (en) * | 2007-07-20 | 2010-11-04 | セルアーティス アーベー | A population of novel hepatocytes derived from human blastocyst stem cells via definitive endoderm (DE-hep) |
-
2003
- 2003-05-19 WO PCT/US2003/015658 patent/WO2004098490A2/en not_active Ceased
- 2003-05-19 EP EP03816210A patent/EP1543110A4/en not_active Ceased
- 2003-05-19 AU AU2003304106A patent/AU2003304106C1/en not_active Expired
- 2003-05-19 US US10/514,759 patent/US7763466B2/en not_active Expired - Lifetime
- 2003-05-19 JP JP2005510829A patent/JP2006513727A/en active Pending
- 2003-05-19 SG SG200701719-7A patent/SG141296A1/en unknown
- 2003-05-19 CA CA2684022A patent/CA2684022C/en not_active Expired - Lifetime
- 2003-05-19 CA CA2487058A patent/CA2487058C/en not_active Expired - Lifetime
- 2003-05-19 EP EP10011700A patent/EP2361966A1/en not_active Withdrawn
-
2008
- 2008-03-24 US US12/077,976 patent/US7955849B2/en not_active Expired - Lifetime
-
2009
- 2009-03-24 JP JP2009071364A patent/JP2009171981A/en active Pending
- 2009-06-02 AU AU2009202175A patent/AU2009202175B2/en not_active Expired
-
2010
- 2010-07-14 US US12/836,277 patent/US20110070203A1/en not_active Abandoned
- 2010-07-14 US US12/836,275 patent/US8748171B2/en not_active Expired - Lifetime
-
2013
- 2013-12-17 US US14/109,675 patent/US20140287494A1/en not_active Abandoned
-
2015
- 2015-02-26 US US14/632,600 patent/US20150218512A1/en not_active Abandoned
- 2015-06-26 US US14/751,295 patent/US20150291931A1/en not_active Abandoned
-
2016
- 2016-08-15 US US15/237,079 patent/US10392600B2/en not_active Expired - Lifetime
Patent Citations (3)
| Publication number | Priority date | Publication date | Assignee | Title |
|---|---|---|---|---|
| US6110739A (en) | 1994-11-21 | 2000-08-29 | National Jewish Medical And Research Center | Method to produce novel embryonic cell populations |
| US5843780A (en) | 1995-01-20 | 1998-12-01 | Wisconsin Alumni Research Foundation | Primate embryonic stem cells |
| WO2002029012A1 (en) * | 2000-10-03 | 2002-04-11 | University Of North Carolina | Processes for clonal growth of hepatic progenitor cells |
Non-Patent Citations (26)
| Title |
|---|
| BRADY ET AL., METH. IN MOL. AND CELL BIO., vol. 2, 1990, pages 17 - 25 |
| EVANS ET AL., NATURE, vol. 292, 1981, pages 154 - 156 |
| FALOON ET AL., DEVELOPMENT, vol. 127, 2000, pages 1931 - 41 |
| GROMPE ET AL., GENES & DEV., vol. 7, 1993, pages 2298 |
| HERRMANN ET AL., DEVELOPMENT, vol. 113, 1991, pages 913 - 7 |
| HOOPER ET AL., NATURE, vol. 326, 1987, pages 292 |
| KELLER GORDON ET AL: "Hematopoietic commitment during embryonic stem cell differentiation in culture", MOLECULAR AND CELLULAR BIOLOGY, AMERICAN SOCIETY FOR MICROBIOLOGY, WASHINGTON, US, vol. 13, no. 1, January 1993 (1993-01-01), pages 473 - 486, XP001104957, ISSN: 0270-7306 * |
| KENNEDY ET AL., NATURE, vol. 386, 1997, pages 488 - 93 |
| KISPERT A ET AL: "THE BRACHYURY GENE ENCODES A NOVEL DNA BINDING PROTEIN", EMBO JOURNAL, OXFORD UNIVERSITY PRESS, SURREY, GB, vol. 12, no. 8, 1993, pages 3211 - 3220, XP002922182, ISSN: 0261-4189 * |
| ODORICO ET AL., STEM CELLS, vol. 19, 2001, pages 193 - 204 |
| OVERSTURF ET AL., NATURE GENET., vol. 12, 1996, pages 266 - 273 |
| PALIS ET AL., DEVELOPMENT, vol. 126, 1999, pages 5073 - 84 |
| PAPAIOANNOU ET AL., BIOESSAYS, vol. 20, 1998, pages 9 - 19 |
| REUBINOFF ET AL., NATURE BIOTECH., vol. 18, 2000, pages 399 |
| REYES M ET AL: "PURIFICATION AND EX VIVO EXPANSION OF POSTNATAL HUMAN MARROW MESODERMAL PROGENITOR CELLS", BLOOD, W.B.SAUNDERS COMPANY, ORLANDO, FL, US, vol. 98, no. 9, 1 November 2001 (2001-11-01), pages 2615 - 2629, XP001153222, ISSN: 0006-4971 * |
| ROGERS ET AL., DEVELOPMENT, vol. 113, 1991, pages 815 - 24 |
| SHALABY ET AL., NATURE, vol. 376, 1995, pages 62 - 6 |
| SHIVDASANI ET AL., NATURE, vol. 373, 1995, pages 432 - 4 |
| SMITH, ANNU. REV. CELL DEV. BIOL., vol. 17, 2001, pages 435 - 62 |
| SMITH, CURRENT OPINION IN GENETICS & DEVELOPMENT, vol. 7, 1997, pages 474 - 480 |
| TADA S ET AL: "CHARACTERIZATION OF MESENDODERM: A DIVERGING POINT OF THE DEFINITIVE ENDODERM AND MESODERM IN EMBRYONIC STEM CELL DIFFERENTIATION CULTURE", DEVELOPMENT, COMPANY OF BIOLOGISTS, CAMBRIDGE,, GB, vol. 132, no. 19, October 2005 (2005-10-01), pages 4363 - 4374, XP008054294, ISSN: 0950-1991 * |
| THOMSON ET AL., PROC. NAT'1. ACAD. SCI. USA, vol. 92, 1995, pages 7844 |
| WANG ET AL., PROC. NATL. ACAD. SCI., vol. 93, 1996, pages 3444 - 9 |
| WILES MICHAEL V ET AL: "Embryonic stem cell development in a chemically defined medium", EXPERIMENTAL CELL RESEARCH, SAN DIEGO, CA, US, vol. 247, no. 1, 25 February 1999 (1999-02-25), pages 241 - 248, XP002209791, ISSN: 0014-4827 * |
| WILKINSON ET AL., NATURE, vol. 343, 1990, pages 657 - 9 |
| WILSON ET AL., DEVELOPMENT, vol. 121, 1995, pages 877 - 86 |
Also Published As
| Publication number | Publication date |
|---|---|
| AU2003304106C1 (en) | 2010-10-28 |
| WO2004098490A3 (en) | 2005-04-21 |
| US8748171B2 (en) | 2014-06-10 |
| US20060276420A1 (en) | 2006-12-07 |
| SG141296A1 (en) | 2008-04-28 |
| CA2487058C (en) | 2015-04-14 |
| AU2009202175A1 (en) | 2009-06-18 |
| EP1543110A2 (en) | 2005-06-22 |
| US20140287494A1 (en) | 2014-09-25 |
| WO2004098490A2 (en) | 2004-11-18 |
| US7763466B2 (en) | 2010-07-27 |
| US20110070203A1 (en) | 2011-03-24 |
| JP2009171981A (en) | 2009-08-06 |
| CA2487058A1 (en) | 2004-11-18 |
| AU2003304106B2 (en) | 2009-06-25 |
| AU2003304106A1 (en) | 2004-11-26 |
| US7955849B2 (en) | 2011-06-07 |
| JP2006513727A (en) | 2006-04-27 |
| US20150218512A1 (en) | 2015-08-06 |
| AU2009202175B2 (en) | 2013-08-01 |
| US10392600B2 (en) | 2019-08-27 |
| US20120114613A1 (en) | 2012-05-10 |
| EP1543110A4 (en) | 2006-09-06 |
| CA2684022C (en) | 2014-09-23 |
| CA2684022A1 (en) | 2004-11-18 |
| US20160348069A1 (en) | 2016-12-01 |
| US20080226558A1 (en) | 2008-09-18 |
| US20150291931A1 (en) | 2015-10-15 |
Similar Documents
| Publication | Publication Date | Title |
|---|---|---|
| US10392600B2 (en) | Method of generating human pancreatic cells | |
| US10428308B2 (en) | Mesoderm and definitive endoderm cell populations | |
| US20120100115A1 (en) | Regionalised endoderm cells and uses thereof | |
| AU2012203441B2 (en) | Mesoderm and definitive endoderm cell populations |
Legal Events
| Date | Code | Title | Description |
|---|---|---|---|
| PUAI | Public reference made under article 153(3) epc to a published international application that has entered the european phase |
Free format text: ORIGINAL CODE: 0009012 |
|
| AC | Divisional application: reference to earlier application |
Ref document number: 1543110 Country of ref document: EP Kind code of ref document: P |
|
| AK | Designated contracting states |
Kind code of ref document: A1 Designated state(s): AT BE BG CH CY CZ DE DK EE ES FI FR GB GR HU IE IT LI LU MC NL PT RO SE SI SK TR |
|
| 17P | Request for examination filed |
Effective date: 20120229 |
|
| 17Q | First examination report despatched |
Effective date: 20121010 |
|
| STAA | Information on the status of an ep patent application or granted ep patent |
Free format text: STATUS: THE APPLICATION IS DEEMED TO BE WITHDRAWN |
|
| 18D | Application deemed to be withdrawn |
Effective date: 20150311 |