EP2365338A1 - Procédé d'analyse d'une région à faible oxygène et appareil par la mesure du temps passé de l'autofluorescence induite par la lumière à partir d'un échantillon biologique - Google Patents
Procédé d'analyse d'une région à faible oxygène et appareil par la mesure du temps passé de l'autofluorescence induite par la lumière à partir d'un échantillon biologique Download PDFInfo
- Publication number
- EP2365338A1 EP2365338A1 EP11157639A EP11157639A EP2365338A1 EP 2365338 A1 EP2365338 A1 EP 2365338A1 EP 11157639 A EP11157639 A EP 11157639A EP 11157639 A EP11157639 A EP 11157639A EP 2365338 A1 EP2365338 A1 EP 2365338A1
- Authority
- EP
- European Patent Office
- Prior art keywords
- fluorescence
- excitation light
- light
- living matter
- illumination
- Prior art date
- Legal status (The legal status is an assumption and is not a legal conclusion. Google has not performed a legal analysis and makes no representation as to the accuracy of the status listed.)
- Withdrawn
Links
Images




Classifications
-
- G—PHYSICS
- G01—MEASURING; TESTING
- G01N—INVESTIGATING OR ANALYSING MATERIALS BY DETERMINING THEIR CHEMICAL OR PHYSICAL PROPERTIES
- G01N33/00—Investigating or analysing materials by specific methods not covered by groups G01N1/00 - G01N31/00
- G01N33/48—Biological material, e.g. blood, urine; Haemocytometers
- G01N33/50—Chemical analysis of biological material, e.g. blood, urine; Testing involving biospecific ligand binding methods; Immunological testing
- G01N33/84—Chemical analysis of biological material, e.g. blood, urine; Testing involving biospecific ligand binding methods; Immunological testing involving inorganic compounds or pH
-
- A—HUMAN NECESSITIES
- A61—MEDICAL OR VETERINARY SCIENCE; HYGIENE
- A61B—DIAGNOSIS; SURGERY; IDENTIFICATION
- A61B5/00—Measuring for diagnostic purposes; Identification of persons
- A61B5/0059—Measuring for diagnostic purposes; Identification of persons using light, e.g. diagnosis by transillumination, diascopy, fluorescence
- A61B5/0062—Arrangements for scanning
- A61B5/0068—Confocal scanning
-
- A—HUMAN NECESSITIES
- A61—MEDICAL OR VETERINARY SCIENCE; HYGIENE
- A61B—DIAGNOSIS; SURGERY; IDENTIFICATION
- A61B5/00—Measuring for diagnostic purposes; Identification of persons
- A61B5/0059—Measuring for diagnostic purposes; Identification of persons using light, e.g. diagnosis by transillumination, diascopy, fluorescence
- A61B5/0071—Measuring for diagnostic purposes; Identification of persons using light, e.g. diagnosis by transillumination, diascopy, fluorescence by measuring fluorescence emission
-
- G—PHYSICS
- G01—MEASURING; TESTING
- G01N—INVESTIGATING OR ANALYSING MATERIALS BY DETERMINING THEIR CHEMICAL OR PHYSICAL PROPERTIES
- G01N21/00—Investigating or analysing materials by the use of optical means, i.e. using sub-millimetre waves, infrared, visible or ultraviolet light
- G01N21/62—Systems in which the material investigated is excited whereby it emits light or causes a change in wavelength of the incident light
- G01N21/63—Systems in which the material investigated is excited whereby it emits light or causes a change in wavelength of the incident light optically excited
- G01N21/64—Fluorescence; Phosphorescence
- G01N21/6408—Fluorescence; Phosphorescence with measurement of decay time, time resolved fluorescence
-
- G—PHYSICS
- G01—MEASURING; TESTING
- G01N—INVESTIGATING OR ANALYSING MATERIALS BY DETERMINING THEIR CHEMICAL OR PHYSICAL PROPERTIES
- G01N21/00—Investigating or analysing materials by the use of optical means, i.e. using sub-millimetre waves, infrared, visible or ultraviolet light
- G01N21/62—Systems in which the material investigated is excited whereby it emits light or causes a change in wavelength of the incident light
- G01N21/63—Systems in which the material investigated is excited whereby it emits light or causes a change in wavelength of the incident light optically excited
- G01N21/64—Fluorescence; Phosphorescence
- G01N21/6486—Measuring fluorescence of biological material, e.g. DNA, RNA, cells
Definitions
- the present invention relates to a method for measuring the concentration of oxygen of living matter, a method for detecting a low oxygen concentration region based on the concentration of oxygen, a method for analyzing the living matter based on the result of measurement and the result of detection, and apparatuses for carrying out these methods.
- the oxygen concentration of the living matter is measured based on a difference in the physical properties of a substance that is used as a label, and the normal tissue and the abnormal tissue are identified based on the difference in oxygen concentration.
- Patent Document 1 discloses a laser-induced fluorescence attenuation spectroscopy method (LIFAS).
- LIFAS laser-induced fluorescence attenuation spectroscopy method
- the oxygen concentration of living matter in a sample is measured by detecting a difference in the intensity of autofluorescence emitted from the living matter sample and the radiation characteristic of light, such as a decay spectrum. Further, a change in the pathological condition, such as malignant tumor condition, is detected.
- Patent Document 2 Japanese Unexamined Patent Publication No. 2006-282653 or the like discloses a method using, as a label, a probe for image diagnosis (diagnosis using images) that exhibits a different activation level depending on the oxygen concentration of living matter during administration. In the method, a difference in the activation level is detected and measured to detect a change in the physiological condition or the pathological condition of the living matter. In this method, since the probe that is a drug is directly administered, high sensitivity detection is possible.
- a measurement method according to the present invention is a measurement method comprising the steps of:
- a measurement apparatus is a measurement apparatus comprising:
- a fluorescent material contained in living matter refers to a fluorescent material the lifetime of which is longer than or equal to 4.8 nanoseconds in living matter of normal condition.
- the fluorescent material may be in any state, such as a protein bond state and a free state, or an average value of a region in a tissue or a cell.
- the expression “in living matter” means “in an environment with a temperature of 37°C " . Therefore, the value is valuable by some difference in temperature or the like.
- living matter refers to a cell or a tissue of a human or an animal, a biological tissue, such as body fluid, and the like.
- the living matter may be any kind of matter including matter extracted from an organism, cultured matter, a cell or tissue in vivo, and the like.
- the fluorescent material is at least one kind of fluorescent material selected from the group consisting of porphyrins, flavin enzymes, collagen, and elastin. Especially, it is desirable that the fluorescence lifetime of the fluorescent material is longer than or equal to 13.3 nanoseconds.
- the measurement apparatus of the present invention includes a light receiving means for obtaining such a spectrum.
- the predetermined position may be a plurality of positions.
- the measurement apparatus that is structured as described above includes a low oxygen region detection means for detecting a low oxygen region in the living matter, it is possible to detect the low oxygen region in the living matter.
- the low oxygen region in the living matter may be detected by generating and displaying an image of the low oxygen region.
- the living matter may be analyzed by identifying the pathological condition of the living matter, such as presence of malignant tumor condition, based on the oxygen concentration measured by using the measurement method of the present invention and the low oxygen region detected by using the detection method of the present invention.
- a measurement apparatus may be a microscope further including:
- a measurement apparatus of the present invention may be a measurement apparatus further including:
- a measurement apparatus of the present invention may be a measurement apparatus further including:
- a measurement apparatus of the present invention may be a measurement apparatus, wherein the excitation light illumination means includes at least one optical fiber for illumination that illuminates the living matter with the pulsed excitation light, and wherein the light receiving means includes at least one optical fiber for receiving light that receives the light including the fluorescence emitted from the fluorescent material excited by illumination with the excitation light and that guides the fluorescence to the time-resolving means.
- the measurement apparatus of the present invention is structured in such a manner, it is desirable that the at least one optical fiber for illumination and the at least one optical fiber for receiving light form a bundle fiber.
- the bundle fiber is formed by bundling an optical fiber for illumination and a plurality of optical fibers for receiving light together in such a manner that the outer surface of the optical fiber for illumination arranged substantially at the center of the bundle fiber is surrounded by the plurality of optical fibers for receiving light.
- the fluorescence lifetime which is a unique value to each fluorescent material, may be used to highly accurately measure the oxygen concentration without being influenced by the intensity of excitation light, the concentration of the fluorescent material, fading of the fluorescent material, and fluorescence from unwanted substance other than desirable fluorescence. It is known that the oxygen concentration of an abnormal cell, such as a cancer cell, is lower than the oxygen concentration of a normal cell.
- Non-Patent Document tries to detect a difference in the oxygen concentration of living matter based on the fluorescence lifetime of NADH (nicotinamide adenine dinucleotide), which is an autofluorescent material in living matter, and to distinguish a cancer cell and a normal cell from each other.
- NADH nicotinamide adenine dinucleotide
- the amount of change in oxygen concentration by abnormality is, for example, in the range of from 15 to 40 mmHg in a normal tissue, and in the range of from 0 to 10 mmHg in a cancerous tissue. Therefore, the difference is extremely small, and it is difficult to accurately detect the difference in oxygen concentration, as a difference in fluorescence lifetime. Hence, it is most likely that the result, as described in the non-patent document, in which the fluorescence lifetime of the normal cell is longer than that of the abnormal cell, is obtained in some cases. With such accuracy level of detection, it is impossible to detect oxygen concentration based on a correlation between the amount of change in oxygen concentration and fluorescence lifetime.
- the inventors of the present invention intensively studied the reasons for the low accuracy of measurement. They noted that the amount of change in the fluorescence lifetime of an autofluorescent material, which is a target of measurement, with respect to oxygen concentration varies depending on the value of fluorescence lifetime, and discovered a fluorescence lifetime value that can make highly accurate measurement possible. Specifically, the fluorescence lifetime of hematoporphyrinwas measured many times by using a time-correlated single photon counting method (TCSPC) and by using a time gate method, and a marginal value that can separate two fluorescence lifetimes in the current fluorescence lifetime measurement technique was discovered. Further, the inventors of the present invention discovered a fluorescence lifetime value for accurately measuring oxygen concentration. The details about the discovered fluorescence lifetime value will be described later. It was not easy to find the fluorescence lifetime value for accurately measuring oxygen concentration, even if the disclosure in the non-patent document and the common technical knowledge at the time of study were taken into consideration.
- the oxygen concentration measurement method of the present invention is based on the findings by the inventors of the present invention that when the oxygen concentration of living matter is measured based on the fluorescence lifetime of an autofluorescent material contained in the living matter, if a fluorescent material the fluorescence lifetime of which is longer than or equal to 4.8 nanosecond is adopted as the autofluorescent material, highly accurate detection is realized. Since the fluorescence lifetime is a value unique to each fluorescent material, it is possible to highly accurately measure the oxygen concentration of living matter by using the method of the present invention without being influenced by the intensity of excitation light, the concentration of the fluorescent material, and fluorescence from unwanted substance.
- the fluorescence lifetime of an autofluorescent material is a target of measurement. Therefore, administration of drug or the like to the living matter is not necessary. Hence, it is possible to measure the oxygen concentration without greatly damaging the living matter.
- Figure 1 is a schematic diagram illustrating the configuration of an oxygen concentration measurement apparatus 1 according to an embodiment of the present invention.
- each unit is illustrated at an appropriate scale so as to be easily recognized.
- the oxygen concentration measurement apparatus 1 outputs pulsed excitation light L1 (hereinafter, referred to as excitation light L1) to substance D to be measured, which is living matter, by an excitation light illumination means 20. Further, the oxygen concentration measurement apparatus 1 obtains fluorescence by receiving light L3 by a light receiving means 30. The light L3 includes fluorescence Lf emitted, by illumination with the excitation light L1, from fluorescent material P contained in the substance D to be measured. Further, a time-resolving means 40 time-resolves the fluorescence into predetermined fluorescence Lf and a detection means 50 detects the time-resolved fluorescence Lf.
- a measurement means 60 obtains a fluorescence decay curve based on the intensity of the detected fluorescence Lf, and calculates lifetime Tf of the fluorescence Lf. Further, the oxygen concentration of the substance D to be measured is measured based on the lifetime Tf.
- the excitation light L1 includes a wavelength that can excite fluorescent material P contained in the substance D to be measured, the lifetime of the fluorescent material P being longer than or equal to 4.8 nanoseconds.
- the method for measuring the fluorescence lifetime is basically divided into a time domain measurement method and a frequency domain measurement method.
- the time domain measurement method is adopted.
- Examples of the time domain measurement method are a streak camera method, a time correlated single photon counting method, a time gate method, and the like.
- a case of measuring fluorescence lifetime by using the time gate method will be described.
- emitted fluorescence is divided to a certain time domain synchronously with illumination with pulsed excitation light. Further, the integral value of fluorescence intensity in the range of the time domain is detected by a solid-state detector, such as a CCD, and measurement is performed for a different time domain. Accordingly, a fluorescence decay curve is approximated.
- a synchronization control apparatus 43 sends synchronization signal S1 to a gate controller 42.
- the gate controller 42 When the gate controller 42 receives the synchronization signal S1, the gate controller 42 originates gate signal S2 in a predetermined time domain that has been set in advance, and an image intensifier 41 with a gate function is driven. Fluorescent image Lf that has been input to the image intensifier 41 with a gate function is intensified in a time domain corresponding to the gate signal S2. Further, the detection means 50 detects the integral value (fluorescent signal) Lt of the fluorescence intensity of the predetermined fluorescence Lf. This process is repeated based on the gate signal S2. Further, the measurement means 60 calculates fluorescence lifetime Tf by performing analysis by a single exponential function or the like.
- the inventors of the present invention measured the fluorescence lifetime of hematoporphyrin many times by using a time-correlated single photon counting method (TCSPC) and by using a time gate method, and discovered that a marginal value that can separate two fluorescence lifetimes in the current fluorescence lifetime measurement technique is 0.03 nsec. Further, they discovered the fluorescence lifetime value of a material that can exhibit such a difference in fluorescence lifetime.
- TCSPC time-correlated single photon counting method
- a hematoporphyrin aqueous solution was used to obtain the value of quenching constant kq to be applied to living matter.
- the oxygen concentration of the solution was changed, by oxygen bubbling, in a low concentration range appropriate for living matter. While the oxygen concentration of the solution was changed, the fluorescence lifetime was measured by using a single photon counting method (measurement apparatus: a measurement system including Time-to-Amplitude Converter (TAC; ORTEC457) and the like) .
- the oxygen concentration was measured by using an optical oxygen concentration meter (*Precision Sensing Co.: 1-channel-type high-sensitivity micro oxygen meter, Microx TX3-trace) .
- the wavelength of excitation light was 420 nm, and fluorescence with the wavelength of 615 nm was detected.
- the correlation coefficient was 0.9975.
- the obtained quenching constant kq was applied to living matter, and a difference in fluorescence lifetime between normal tissue and abnormal tissue was obtained.
- the fluorescence lifetime in normal cell is ⁇ 1
- the fluorescence lifetime in abnormal cell is ⁇ 2
- Oxygen Concentration Partial Pressure of Oxygen mmHg / 760 mmHg ⁇ Solubility Coefficient / 22.4 L / mol .
- the solubility coefficient is 0.024.
- the oxygen concentration is in the range of from 2.1 ⁇ 10 -5 to 5.6 ⁇ 10 -5 mol/L.
- the partial pressure of oxgen of abnormal tissue is in the range of from 0 to 10 mmHg
- the oxygen concentration is in the range of from 0 to 1.4 ⁇ 10 -5 mol/L.
- ⁇ 2 when ⁇ 2 is longer than or equal to 13.3 nsec, it is possible to highly accurately distinguish normal tissue and abnormal tissue from each other.
- the lowest value of partial pressure of oxygen in abnormal tissue maybe substantially zero in some cases. Therefore, the value of 0 mmHg was used as the lowest partial pressure for the abnormal tissue.
- fluorescent material P autofluorescent material contained in substance D to be measured
- a fluorescent material the fluorescence lifetime of which is longer than or equal to 4.8 nanoseconds a fluorescent material the fluorescence lifetime of which is longer than or equal to 13.3 nanoseconds may be used.
- Table 1 shows major autofluorescent materials and fluorescence lifetime values of the autofluorescent materials measured by the inventors of the present invention by using a time-correlated single photon counting method (TCSPC) .
- Table 1 shows values when each of the autofluorescent materials are in a free state.
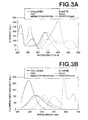
- Figures 3A and 3B are diagrams illustrating excitation light absorption characteristics and fluorescence spectrum of major autoflucrescent materials.
- the oxygen concentration measurement apparatus 1 is a microscope, substance D to be measured is placed on a sample stage 90, which is movable in the directions of x, y and z by a position adjustment means 91. The position of the sample stage 90 is adjusted by the position adjustment means 91 to illuminate a predetermined position in the substance D to be measured with excitation light L1.
- the oxygen concentration measurement apparatus 1 may include a window (not illustrated) including a magnification lens or the like. The window is provided to check, from the upper side of the substance D to be measured, the illumination position of the excitation light L1 on the substance D to be measured, thereby a predetermined position is accurately illuminated with the excitation light L1.
- an excitation light generation means 10 includes a pulse laser 11 and a pulse picker 12.
- the pulse laser 11 can oscillate pulses including a wavelength that can excite fluorescent material P contained in the substance D to be measured, the fluorescent material P having a fluorescence lifetime longer than or equal to 4.8 nanosecond.
- the pulse picker 12 picks (thins) pulses oscillated by the pulse laser 11 so that pulses are output with predetermined intervals.
- the pulse laser 11 is not particularly limited, but desirably a laser that can oscillate ultra-short pulsed light. It is more desirable that the pulse laser 11 can oscillate pulses in the range of from some tens of femtoseconds to some tens of picoseconds.
- the pulse laser 11 that has the wavelength of 420 nm, a pulse width of 3 ps, a repetition frequency of 80 MHz, a peak power of 8 kW, an average power of 2 W, and the like may be used.
- the wavelength of 420 nm is a second harmonics (SHG: second harmonic generation) of a titanium sapphire laser having an oscillation wavelength of 840 nm.
- the excitation light generation means 10 may include a third harmonic (THG: third harmonic generation) or a wavelength conversion element, such as an optical parametric oscillator (OPO).
- the fluorescence Lf may be excited in the substance D to be measured by multi-photon excitation.
- a titanium sapphire laser having an oscillation wavelength of 840 nm, a pulse width of 100 fs, a repetition frequency of 80 MHz, a peak power of 100 kW, an average power of 0.8 W and the like are used as excitation light L1 having a wavelength and a pulse width that can induce multi-photon excitation.
- multi-photon excitation it is possible to excite only a desirable position. Therefore, it is possible to reduce fluorescence in the vicinity of the position, and to further reduce noise. Further, since it is possible to reduce absorption decay before the observation position, it is possible to efficiently illuminate the observation position with the excitation light L1. Further, it is possible to analyze at high spatial resolution.
- the excitation light L1 output from the excitation light generation means 10 enters the excitation light illumination means 20. Further, the excitation light illumination means 20 illuminates a predetermined position in the substance D to be measured with the excitation light L1.
- the structure of the excitation light illumination means 20 is not particularly limited. However, in the excitation light illumination means 20 of the present embodiment, the same objective lens (optical system) 21 (31) is used to output the excitation light L1 and to receive light L3 including fluorescence Lf emitted from the substance D to be measured by excitation of the fluorescent material P. Therefore, the excitation light illumination means 20 includes the objective lens 21 and a dichroic mirror 22 (32).
- the objective lens 21 is arranged so that a predetermined position in the substance D to be measured is illuminated with the excitation light L1 and that the light L3 is receivable.
- the dichroic mirror 22 (32) makes the excitation light L1 enter the objective lens 21, and guides the light L3 to the time-resolving means 40. It is desirable that the material of the objective lens 21 has high transmittance (transmission) with respect to the excitation light L1 and fluorescence. Further, it is desirable that the amount of fluorescence emitted from the lens material is small.
- the excitation light illumination means 20 includes a beam splitter 25 and an excitation filter 23.
- the beam splitter 25 separates, from the excitation light L1, signal light L2 that originates synchronization signal S1.
- the excitation filter 23 filters the excitation light L1 so that light having an wavelength that can excite the fluorescent material P remains.
- the excitation light illumination means 20 may include a mirror (24, 26), a lens (not illustrated), and the like for guiding the excitation light L1 if necessary.
- the light receiving means 30 is not particularly limited as long as it can receive the light L3 emitted from the substance D to be measured by illumination with the excitation light L1, and output intended fluorescence Lf to the time-resolving means 40.
- the light receiving means 30 includes an objective lens 31 (21), a dichroic mirror 32 (22), and a filter 33.
- the objective lens 31 (21) receives light L3 emitted from the substance D to be measured.
- the dichroic mirror 32 (22) guides the light L3 to the time-resolving means 40, and the filter 33 removes noise light, such as scattered light, from the light L3.
- a filter 34 such as a band-pass filter or a short-pass filter, may be appropriately used based on the wavelength of fluorescence Lf to be detected.
- plural band-pass filters that pass light of different wavelength bands may be used.
- a filter that has a variable passing wavelength band may be used.
- the fluorescence Lf received by the light receiving means 30 is input to the time-resolving means 40.
- the time-resolving means 40 extracts fluorescent signal Lt in a predetermined time domain from the fluorescence Lf, and outputs the extracted fluorescent signal Lt to the detection means 50.
- Time-resolving of fluorescence starts from time t0 when the first synchronization signal S1 for output of the excitation light L1 is received.
- the synchronization signal S1 is generated at an optical detector 44 by converting, to an electrical signal, the signal light L2 separated from the excitation light L1 by the beam splitter 25. Further, the synchronization signal S1 is sent from a synchronization control apparatus 43 to a gate controller 42.
- the fluorescence Lf received by the light receiving means 30 is input to the time-resolving means 40.
- the time-resolving means 40 extracts a fluorescent image in a predetermined time domain from predetermined fluorescence Lf, and outputs the extracted fluorescent image to the detection means 50.
- Time-resolving of fluorescence starts from time t0 when the first synchronization signal S1 for output of the excitation light L1 is received.
- the synchronization signal S1 is generated at an optical detector 44 by converting, to an electrical signal, the signal light L2 separated from the excitation light L1 by the beam splitter 25. Further, the synchronization signal S1 is sent from a synchronization control apparatus 43 to a gate controller 42.
- the light detector 44 is not particularly limited. However, it is desirable to use a photodiode or the like, which is generally used.
- the synchronization control apparatus 43 is not particularly limited as long as it can receive a signal output from the light detector 44 and output synchronization signal S1 to the gate controller 42.
- a personal computer (PC) or the like may be used as the synchronization control apparatus 43.
- the gate controller 42 receives the synchronization signal S1 and originates gate signal S2 in a predetermined time domain that has been set in advance. Accordingly, the gate controller 42 instructs opening/closing of a gate in an image intensifier 41 with a gate function.
- a detection means 50 such as a CCD camera, is connected to the image intensifier 41 with a gate function, and the gate is opened or closed based on the gate signal S2.
- Fluorescence signal Lt that has been received while the gate is open is amplified, and fluorescent spectrum image Ls, the contrast of which has been improved, is received by the detection means 50, such as a CCD. Further, the fluorescent spectrum image Ls is stored as an electrical signal, and detected.
- the gate controller 42 when time when the gate controller 42 has received the synchronization signal S1 for the first time is base time t0, if gate signal S2 for instructing the image intensifier 41 with a gate function to open the gate only for time ⁇ t is output, the image intensifier 41 with the gate function amplifies the fluorescent signal Lt in a period from time t0 to ⁇ t, and outputs the amplified signal to the detection means 50, Further, the detection means 50 detects fluorescence Lf in the time range, and outputs the integral value S3 of the intensity of fluorescence to a measurement means 60. This process of detecting the fluorescence intensity S3 is repeated based on the gate signal, and time-resolved fluorescence intensity is output to the measurement means 60.
- the measurement means 60 is not particularly limited. However, it is easy and desirable to use a computer system, such as a PC, as the detection means 60. The same apparatus may be used as the measurement means 60 and the synchronization control apparatus 43.
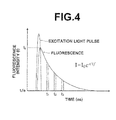
- the measurement means 60 obtains fluorescence intensity time distribution by obtaining a fluorescence decay curve based on the time-resolved fluorescence intensity S3. In the fluorescence decay curve, a difference between time tmax and time t0 is calculated as fluorescence lifetime Tf.
- the time tmax is time when the fluorescence intensity becomes 1/e, which is substantially zero
- the time t0 is time when emission of fluorescence starts.
- Figure 4 is a diagram illustrating fluorescence intensity time distribution obtained based on time-resolved fluorescence intensity and fluorescence lifetime Tf obtained from the fluorescence decay curve.
- S3 is the fluorescence intensity I at time t.
- the measurement means 60 measures oxygen concentration at a predetermined position in the substance D to be measured based on the obtained fluorescence lifetime Tf. It is known that the fluorescence lifetime of autofluorescent material changes depending on oxygen concentration in the vicinity of the autofluorescent material. When the autofluorescent material emits fluorescence, quenching occurs by collision with oxygen atoms present around the autofluorescent material. Therefore, when the oxygen concentration around the autofluorescent material becomes lower, the fluorescence lifetime becomes longer.
- the fluorescence lifetime of substance D to be measured in normal condition is obtained in advance, it is possible to measure a change in oxygen concentration at a predetermined position in the substance D to be measured based on the fluorescence lifetime of auto fluorescent material at the predetermined position. Further, if a rate of change in fluorescence lifetime with respect to oxygen concentration is obtained in advance, it is possible to measure a specific oxygen concentration values.
- the stage 90 is movable in the directions of x, y and z (in-plane direction and depth direction of an excitation light illumination plane). Therefore, two-dimensional or three-dimensional measurement of oxygen concentration is possible at predetermined plural positions of the substance D to be measured.
- an oxygen concentration measurement apparatus 4 may use a wide field type microscope method, in which a stage 90 is movable in x, y and z directions, and a telescope 28 is provided in the excitation light illumination means 20.
- detection can be performed at once for a wide illumination range.
- the stage 90 is scanned in x and y directions, plural xy plane regions are detected.
- the detected xy plane regions are combined, it is possible to generate an image of a wider region.
- the stage 90 ' may be movable only in z direction.
- a confocal optical system in which a scan optical system 27, such as a scan head, scans in x and y directions, may be adopted.
- the scan optical system 27 may scan in x, y and z directions.
- Examples of the scan optical system 27 are a galvanomirror, a polygon mirror, a resonant mirror, and the like.
- the spectral means 35 obtains a spectrum of fluorescence Lf received by the light receiving means 30, and outputs fluorescent spectrum Ls of the fluorescence Lf to the time-resolving means 40. Since the fluorescent spectrum of the fluorescence Lf is obtained, and the fluorescent spectrum Ls is time-resolved, it is possible to more accurately divide the plural kinds of fluorescence from each other, and to accurately measure the lifetime of fluorescence of a predetermined wavelength.
- the spectral means 35 is not particularly limited as long as a spectrum of the fluorescence Lf is obtainable, and for examples, a diffraction grating, a prism or the like may be used.
- the structure including the scan optical system, as illustrated in Figure 6 is especially desirable when multi-photon excitation that provides localized excitation is performed.
- the oxygen concentration measurement apparatuses according to the embodiments of the present invention are structured as described above.
- substance D to be measured is placed on the stage 90, specifically in contact with a surface of the stage 90, and the position of the stage 90 is adjusted by the position adjustment means 91 so that a predetermined position is illuminated with excitation light L1.
- the excitation light generation means 10 outputs excitation light L1 including a wavelength that can excite fluorescent material P.
- the excitation light L1 enters the excitation light illumination means 20.
- Signal light L2 for synchronization is separated, by the beam splitter 25, from the excitation light L1 that has entered the excitation light illumination means 20, and the excitation light L1 is condensed by the objective lens (optical system) 21.
- a predetermined position in the substance D to be measured is illuminated with the excitation light L1.
- fluorescent material P is excited, and fluorescence Lf is emitted from the fluorescent material P.
- the objective lens 31 of the light receiving means 30 receives light L3 output from the substance D to be measured.
- the light L3 includes noise light other than the fluorescence Lf. However, light other than the fluorescence Lf is substantially removed by passing the light L3 through the filter 34.
- the light L3 that includes substantially only fluorescence enters the time-resolving means 40, and predetermined fluorescence Lf is extracted,and time-resolved. Further, the detection means 50 detects fluorescence intensity S3 at each time, and the detected fluorescence intensity S3 is output to the measurement means 60 as an electrical signal.
- the measurement means 60 obtains a fluorescence intensity - time curve based on the time-resolved fluorescence intensity. Further, a difference between time tmax and time t0 is calculated as fluorescence lifetime Tf in the fluorescence intensity - time curve.
- the time tmax is time when the fluorescence intensity substantially becomes 1/e. Further, the oxygen concentration of the substance D to be measured is measured based on the fluorescence lifetime Tf.
- the oxygen concentration measurement method and the oxygen concentration measurement apparatus 1 when oxygen concentration of living matter is measured based on fluorescence lifetime Tf of autofluorescent material P, highly accurate measurement is possible by adopting, as the autofluorescent material P, a fluorescent material the fluorescence lifetime of which is longer than or equal to 4.8 nanoseconds. Since the fluorescence lifetime is unique to a material, the oxygen concentration measurement method and the oxygen concentration measurement apparatus 1 according to the present embodiment can highly accurately measure the oxygen concentration of living matter without being influenced by the intensity of excitation light, the concentration of fluorescent material P, and fluorescence from unwanted material.
- the fluorescence lifetime of autofluorescent material is a target of measurement. Therefore, it is not necessary to administer a drug or the like to living matter. Hence, measurement of oxygen concentration is possible without greatly damaging the living matter.
- the oxygen concentration measurement apparatus 1 in the first embodiment is a microscope.
- an oxygen concentration measurement apparatus 10 in the second embodiment is a fiber probe.
- the same signs will be assigned to elements that have substantially the same functions as those of the first embodiment, and explanations will be omitted.
- the structure of the oxygen concentration measurement apparatus 10 is similar to the structure of Embodiment 1, except that the objective lens 21 (31) in the first embodiment is replaced by a bundle fiber 21 ' (31 ' ) in the second embodiment.
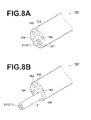
- an optical fiber 200 for illumination is arranged substantially at the center.
- the optical fiber 200 for illumination guides the pulsed excitation L1 toward a central part, and illuminates a predetermined position in the substance D to be measured with the excitation light L1.
- plural optical fibers 300 for receiving light are arranged so as to surround the outer surface of the optical fiber 200 for illumination.
- the optical fibers 300 for receiving light receive light L3 including fluorescence Lf emitted by illumination with the excitation light L1, from autofluorescent material P contained in the substance D to be measured, the fluorescence lifetime of the autofluorescent material P being longer than or equal to 1 nanosecond. Further, the optical fibers 300 for receiving light guide the light L3 to the time-resolving means 40.
- optical fibers 300 for receiving light are illustrated. However, it is not necessary that the number of the optical fibers 300 for receiving light is seven. At least one optical fiber for illumination and at least one optical fiber for receiving light should be provided, and the number of fibers and the fiber diameters may be appropriately selected based on receivable fluorescence intensity or the like. An objective lens is attached to the leading end of the optical fiber for illumination.
- the bundle fiber 21 ' (31 ' ) is produced by fixing the optical fiber 200 for illumination and the optical fiber or fibers 300 for receiving light together by using an adhesive or the like so that they are arranged at predetermined positions. It is desirable to use an additive having a heat resistance temperature appropriate for the excitation L1 used in measurement. When a heat resistance temperature exceeding 300°C is required, an inorganic heat-resistant additive is used. Further, the fixed bundle fiber may be used as a fiber probe (not illustrated) by providing the bundle fiber in a long and substantially cylindrical sheath to be inserted into body cavity.
- the optical fiber 200 for illumination and the optical fibers 300 for receiving light are not particularly limited. However, it is desirable that the material of the optical fiber 200 for illumination and the optical fibers 300 for receiving light has excellent transmittance of the excitation light L1, and is not damaged by the excitation light L1. Especially, when the excitation light L1 is ultraviolet light or short wavelength light close to the ultraviolet light, the light energy of the excitation light L1 is high. Therefore, in that case, it is desirable to use quartz-based optical fibers.
- a predetermined position in the substance D to be measured may be determined by an examiner (a user or doctor who performs measurement) by directly moving the probe during examination.
- the bundle fiber 21 ' (31 ' ) may be provided in a forceps channel 101 in an endoscope 100.
- the fiber probe F may be inserted into the forceps channel 101 in the endoscope 100.
- the endoscope 100 includes an illumination unit 102, an imaging unit 103, and an air/water supply nozzle 104.
- the illumination unit 102 illuminates a predetermined position in the body cavity with illumination light.
- the imaging unit 103 images reflection light L4 reflected at a predetermined position.
- the illumination unit 102 is connected to a light source that can illuminate a predetermined position.
- the imaging unit 103 is connected to a monitor (not illustrated) or the like that can make the examiner recognize or check the predetermined position.
- the oxygen concentration measurement apparatus it is possible to directly measure the oxygen concentration of tissue of an animal and a human.
- the oxygen concentration measurement apparatus according to the second embodiment is appropriate for examination of human digestive organs, tracheas and the like.
- low oxygen region detection apparatuses detection apparatuses 2, 5 and 8 of the present embodiment will be described.
- the stage 90 (90 ' ) is movable in xy direction (in-plane direction of the excitation light illumination plane) and z direction (the direction of the optical axis). Therefore, it is possible to measure oxygen concentration at predetermined plural positions in the substance D to be measured. Therefore, for example, when the predetermined plural positions are evenly set in the xy plane of the substance D to be measured, it is possible to obtain in-plane oxygen concentration distribution of the substance D to be measured. Further, when multi-photon excitation, such as two photon fluorescence, is used, it is possible to detect fluorescence at a deep part of the substance to be measured. In that case, it is possible to obtain three-dimensional oxygen concentration distribution by setting measurement positions also in the z direction of the substance D to be measured.
- the oxygen concentration measurement apparatus is a microscope type, as illustrated in Figures 1 , 5 and 6
- a wide field method that obtains information about xy plane at once as illustrated in Figures 1 and 5
- a confocal method as illustrated in Figure 6 may be adopted.
- a low oxygen region detection means 80 that can detect oxygen concentration distribution of the substance D to be measured is provided for the oxygen concentration measurement apparatuses 1, 4 and 7, it is possible to use them, for example, as low oxygen region detection apparatuses 2 (5, 8) for detecting a low oxygen region.
- an array detector such as a CCD and a cooling CCD, may be used.
- the low oxygen region detection apparatus 2 (2 ' ) further includes a display means 81 that generates and displays an image of a detection result obtained by the low oxygen region detection means 80, it is possible to clearly recognize in-plane oxygen concentration distribution and a low oxygen region.
- a conventional method may be used. For example, a method of displaying in-plane oxygen distribution by using different colors, a method of three-dimensionally displaying in-plane concentration distribution, and the like may be used. When plural images are obtained, they may be combined and displayed.
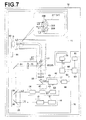
- the oxygen concentration measurement apparatus 10 of fiber probe type as illustrated in Figure 7
- an examiner can directly move the probe to measure oxygen concentration, at an arbitrary region. Therefore, when a low oxygen region detection means 80 that can detect oxygen concentration distribution of the substance D to be measured is provided in a manner similar to the oxygen concentration measurement apparatus 1, the oxygen concentration measurement apparatus 10 can function as a low oxygen region detection apparatus 11.
- an MEMS (micro-electro mechanical system) scanner which is attached to the leading end of a fiber probe during use, or the like may be used as the low oxygen region detection means 80. Further, it is possible to perform image detection in a desirable manner by providing an operation unit 91 for the stage 90 on which the substance to be measured is placed.
- the low oxygen region detection apparatus 2 (2') of the present embodiment includes the oxygen concentration measurement apparatus of the above embodiment. Therefore, the low oxygen region detection apparatus 2 (2') can achieve an advantageous effect similar to the oxygen concentration measurement apparatus 1 (1 ' ).
- the living matter analysis apparatus 3 (6, 9 and 12) of the present embodiment will be described.
- the living matter analysis apparatus 3 (6, 9 and 12) is structured by providing an analysis means 70 for the low oxygen region detection apparatus 2 (5, 8 and 11).
- the analysis means 70 identifies, based on measured oxygen concentration, a pathological condition of the substance D to be measured.
- the in-plane oxygen concentration distribution of the substance D to be measured it is possible to identify an abnormal range of the pathological condition with respect to the in-plane direction of the substance D to be measured. Further, it is possible to identify the degree of the abnormal condition in the range.
- cancer malignant tumor
- radiation therapy an affected part is extracted by excision.
- the affected part is not removed, and cancer cells are killed by irradiating the affected part with radiation. Since the living matter analysis apparatus of the present embodiment can identify a cancerized range, it is possible to accurately remove only a region that needs to be removed in the surgical therapy.
- surgery for extracting a cancerous tumor it is not desirable that cancer cells remain in a patient's body after surgery, because the risk of recurrence increases.
- tissue is excessively removed because of the fear of recurrence, a burden on the patient increases, and that is not desirable, either.
- a region that is judged to be necessary to be removed is extracted. After extracting the region, a very small amount of tissue in a region that was in contact with the extracted tumor is removed, and examination is performed on the tissue by using the oxygen concentration measurement apparatus of the present invention to find whether a cancer cell is present in the tissue. If a cancer cell is detected, it is judged that further excision is necessary. If no cancer cell is detected, it is judged that a sufficient region has been removed.
- the living matter analysis apparatus of the present embodiment includes the oxygen concentration measurement apparatus that can highly accurately measure oxygen concentration. Therefore, it is possible to obtain highly accurate oxygen concentration information about an affected part, such as a cancerous region, together with the position information about the affected part. Therefore, according to the living matter analysis apparatus of the present embodiment, it is possible to select the type of radiation, the intensity or dose of radiation in an appropriate manner based on the condition of the affected part in radiation therapy. Hence, an excellent treatment result is achievable. Further, in endoscopic submucosal dissection (ESD), it is possible to identify the range and the condition of an affected part. Therefore, it is possible to remove an appropriate region, and to minimize a damage to the patient.
- ESD endoscopic submucosal dissection
- the oxygen concentration measurement apparatus of the present embodiment can measure oxygen concentration immediately and quickly, as described above, the throughput of the oxygen concentration measurement apparatus is high, and the oxygen concentration measurement apparatus is desirable as an analysis apparatus for determining a treatment policy of cancer.
- a structure in which a detection means that detects a low oxygen region is provided in the oxygen concentration measurement apparatus has been described. However, it is not necessary that the detection means detects the low oxygen region.
- a detection means that detects a high oxygen region may be provided.
- Oxygen concentration of a cultured HeLa cell was measured by using a microscope-type oxygen concentration measurement apparatus illustrated in Figure 1 .
- FAD Fluorine Adenine Dinucleotide
- SHG light of a titanium sapphire laser with a pulse width of 1 picosecond was used as excitation, light.
- the wavelength of the excitation light was adjusted so that the wavelength became 450 nm, which is the excitation wavelength of FAD.
- the pulse energy of excitation light was 25 nJ.
- the pH of HeLa cells was adjusted to pH 7.4 in culture medium, and two kinds of HeLa cell with oxygen concentration of 5 mmHg and oxygen concentration of 40 mmHg were prepared. Further, fluorescence lifetimes of the two kinds of HeLa cell were measured for fluorescence wavelength of 520 nm.
- FAD is present in a protein bond state and in a free state. However, FAD in the free state the fluorescence lifetime of which was longer than or equal to 4.8 nanoseconds was measured.
- the measurement temperature was 37°C.
- the fluorescence lifetime of FAD was 5.13 nanoseconds for the HeLa cell with oxygen concentration of 5 mmHg, and the fluorescence lifetime of FAD was 5.10 nanoseconds for the HeLa cell with oxygen concentration, of 40 mmHg.
- Hematoporphyrin was used as an autofluorescent material to be excited. Further, SHG light of a titanium sapphire laser with a pulse width of 1 picosecond was used as excitation light. Further, the wavelength of the excitation light was adjusted so that the wavelength become 420 nm, which is the excitation wavelength of hematoporphyrin. Other conditions were same as Example 1 (the pulse energy of excitation light was 50nJ). Further, two kinds of HeLa cell with oxygen concentration of 5 mmHg and oxygen concentration of 30 mmHg were prepared. Further, fluorescence lifetimes of the two kinds of HeLa cell were measured for fluorescence wavelength of 615 nm.
- the fluorescence lifetime of hematoporphyrin was 14.3 nanoseconds for the HeLa cell with oxygen concentration of 5 mmHg, and the fluorescence lifetime of hematoporphyrin was 14.2 nanoseconds for the HeLa cell with oxygen concentration of 30 nmHg.
- a laparotomy was performed on a mouse with a cancer in the lower digestive organ that had developed by administration of a drug.
- the large intestine of the mouse was opened, and a cancerous part in the large intestine was used as a substance to be measured.
- oxygen concentration was measured by measuring the fluorescence lifetime of FAD in a manner similar to Example 1.
- oxygen concentration was measured at plural positions, and oxygen concentration of a predetermined region of the opened large intestine was measured.
- a cooling CCD was used as a low oxygen region detection means, and an image of a low oxygen region was generated and detected.
- An xy operation unit was provided for the stage, on which the mouse was placed, so that a region around the cancerous part, which was expected to be normal, was measured at the same time, and an image of the region was obtained.
- a wide field type microscope method was used, and measurement was performed on a small region on an xy plane at the same time. Further, the xy stage was operated to obtain plural images of small regions on the xyplane. Accordingly, measurement on a wide range including the cancerous part and the normal region became possible ( Figure 5 ). Further, the plural images were combined.
- a region to be measured was adjusted to the vicinity of the surface of the substance to be measured by scanning the substance in z direction of the stage.
- the oxygen concentration of the region expected to be a cancerous part was 3 mmHg in average, while the oxygen concentration of the surrounding region, which was expected to be a normal region, was 29 mmHg in average.
- the result of measurement was compared with a generated pathological image of the cancerous part. Consequently, it was confirmed that the location of the cancer and the location of the low oxygen region were substantially the same.
- the operation unit for z direction of the stage was operated by a pitch of 0.05 mm, and data for xy direction was obtained at each depth. Consequently, detection of a low oxygen region was performed on a region within the depth of 0.2 mm from the surface.
- the oxygen concentration of a region expected to be a cancerous region was 5 mmHg in average, while the oxygen concentration of a surrounding region, which was expected to be a normal region, was 35 mmHg. It was possible to obtain a three-dimensional image of the low oxygen region of the substance to be measured based on the obtained data.
- a fiber probe type oxygen concentration measurement apparatus illustrated in Figure 7 was used, and low oxygen region detection was performed on a substance to be measured in a manner similar to Example 3.
- a laparotomy was performed on a mouse, and the large intestine of the mouse was opened.
- a cancerous part in the large intestine was used as a substance to be measured.
- Measurement was performed by placing the leading end of the fiber probe close to a region to be measured.
- the fiber probe was fixed, and an xy operation unit was provided for the stage, on which the mouse was placed. Accordingly, the affected part of the mouse and a region in the vicinity of the affected part were measured ( Figure 7 ). Consequently, in a manner similar to Example 3, it was confirmed that the location of the detected cancer and the location of the low oxygen region were substantially the same.
- the oxygen concentration measurement method, the low oxygen region detection method, and the living matter analysis method of the present invention and the apparatuses for carrying out the methods are desirably used in diagnosis as to whether a cell is a normal cell or an abnormal cell (cancer cell or the like) and in separation of the normal cell and the abnormal cell from each other.
Landscapes
- Health & Medical Sciences (AREA)
- Life Sciences & Earth Sciences (AREA)
- Engineering & Computer Science (AREA)
- Physics & Mathematics (AREA)
- Biomedical Technology (AREA)
- Pathology (AREA)
- Chemical & Material Sciences (AREA)
- Molecular Biology (AREA)
- General Health & Medical Sciences (AREA)
- Immunology (AREA)
- Analytical Chemistry (AREA)
- Nuclear Medicine, Radiotherapy & Molecular Imaging (AREA)
- General Physics & Mathematics (AREA)
- Biochemistry (AREA)
- Hematology (AREA)
- Medical Informatics (AREA)
- Surgery (AREA)
- Animal Behavior & Ethology (AREA)
- Urology & Nephrology (AREA)
- Public Health (AREA)
- Veterinary Medicine (AREA)
- Biophysics (AREA)
- Heart & Thoracic Surgery (AREA)
- Cell Biology (AREA)
- Medicinal Chemistry (AREA)
- Food Science & Technology (AREA)
- Microbiology (AREA)
- Biotechnology (AREA)
- Inorganic Chemistry (AREA)
- Radiology & Medical Imaging (AREA)
- Investigating, Analyzing Materials By Fluorescence Or Luminescence (AREA)
Applications Claiming Priority (1)
| Application Number | Priority Date | Filing Date | Title |
|---|---|---|---|
| JP2010053214A JP2011185842A (ja) | 2010-03-10 | 2010-03-10 | 光誘起自家蛍光の時間分解測定による生物試料の低酸素領域分析方法とその装置 |
Publications (1)
| Publication Number | Publication Date |
|---|---|
| EP2365338A1 true EP2365338A1 (fr) | 2011-09-14 |
Family
ID=43872231
Family Applications (1)
| Application Number | Title | Priority Date | Filing Date |
|---|---|---|---|
| EP11157639A Withdrawn EP2365338A1 (fr) | 2010-03-10 | 2011-03-10 | Procédé d'analyse d'une région à faible oxygène et appareil par la mesure du temps passé de l'autofluorescence induite par la lumière à partir d'un échantillon biologique |
Country Status (3)
| Country | Link |
|---|---|
| US (1) | US20110224519A1 (fr) |
| EP (1) | EP2365338A1 (fr) |
| JP (1) | JP2011185842A (fr) |
Cited By (2)
| Publication number | Priority date | Publication date | Assignee | Title |
|---|---|---|---|---|
| WO2013131062A1 (fr) * | 2012-03-02 | 2013-09-06 | The Regents Of The University Of California | Système et procédé d'imagerie de fluorescence en temps différé et de mise en forme d'impulsions |
| WO2023075597A1 (fr) | 2021-10-28 | 2023-05-04 | Flash Pathology B.V. | Microscopie à impulsions femtosecondes |
Families Citing this family (8)
| Publication number | Priority date | Publication date | Assignee | Title |
|---|---|---|---|---|
| JP5437864B2 (ja) * | 2010-03-10 | 2014-03-12 | 富士フイルム株式会社 | pH測定装置の作動方法、検出装置の作動方法、及び生体物質分析装置の作動方法、並びに各装置 |
| EP3128892A4 (fr) * | 2014-04-05 | 2018-05-09 | Surgisense Corporation | Appareil, systèmes et procédés permettant la cartographie de l'oxygénation tissulaire |
| WO2015182860A1 (fr) | 2014-05-30 | 2015-12-03 | 한국기계연구원 | Dispositif de spectroscopie sur plasma induit par laser et dispositif de diagnostic medical utilisant un tel dispositif |
| JP6878306B2 (ja) * | 2015-05-20 | 2021-05-26 | クアンタム−エスアイ インコーポレイテッドQuantum−Si Incorporated | パルスレーザ及び生物分析システム |
| BR112017024605B1 (pt) * | 2015-05-20 | 2022-11-16 | Quantum-Si Incorporated | Fonte óptica pulsada e método com a finalidade de produzir um pulso óptico com uma fonte óptica pulsada |
| CN116466494A (zh) | 2016-12-16 | 2023-07-21 | 宽腾矽公司 | 紧密的光束整形及操纵总成 |
| KR102061285B1 (ko) * | 2017-01-12 | 2019-12-31 | 한국기계연구원 | 레이저 유도 플라즈마 분광 내시경 장치 및 레이저 유도 플라즈마 분광 장치 |
| CN115210969A (zh) | 2020-01-14 | 2022-10-18 | 宽腾矽公司 | 调幅激光器 |
Citations (8)
| Publication number | Priority date | Publication date | Assignee | Title |
|---|---|---|---|---|
| WO1992013265A1 (fr) * | 1991-01-24 | 1992-08-06 | The University Of Maryland | Procede et appareil d'imagerie multidimensionnelle a duree de vie de fluorescence a modulation de phase |
| JP2001509589A (ja) | 1997-07-07 | 2001-07-24 | シーダーズ−サイナイ・メディカル・センター | レーザー誘起蛍光減衰分光分析の方法と装置 |
| US6272376B1 (en) * | 1999-01-22 | 2001-08-07 | Cedars-Sinai Medical Center | Time-resolved, laser-induced fluorescence for the characterization of organic material |
| US20040073119A1 (en) * | 2001-03-01 | 2004-04-15 | Mary-Ann Mycek | Fluorescence lifetime spectrometer (fls) and methods of detecting diseased tissues |
| WO2005019800A2 (fr) * | 2003-08-19 | 2005-03-03 | Cedars-Sinai Medical Center | Procede de microscopie d'imagerie par duree de vie de fluorescence et de spectroscopie |
| JP2006282653A (ja) | 2005-03-10 | 2006-10-19 | Kyoto Univ | 標的部位で選択的に活性化される新規化合物およびその利用 |
| WO2008012785A2 (fr) * | 2006-07-24 | 2008-01-31 | University College Cork - National University Of Ireland, Cork | Sonde d'oxygène cellulaire |
| WO2008115521A1 (fr) * | 2007-03-19 | 2008-09-25 | The Regents Of The University Of Michigan | Indicateurs photoacoustiques |
Family Cites Families (9)
| Publication number | Priority date | Publication date | Assignee | Title |
|---|---|---|---|---|
| US5125404A (en) * | 1985-03-22 | 1992-06-30 | Massachusetts Institute Of Technology | Apparatus and method for obtaining spectrally resolved spatial images of tissue |
| US5716324A (en) * | 1992-08-25 | 1998-02-10 | Fuji Photo Film Co., Ltd. | Endoscope with surface and deep portion imaging systems |
| JP2000275541A (ja) * | 1999-03-24 | 2000-10-06 | Olympus Optical Co Ltd | レーザ顕微鏡 |
| JP4593739B2 (ja) * | 2000-07-27 | 2010-12-08 | 独立行政法人科学技術振興機構 | 多光子励起蛍光寿命画像化システム |
| US7643145B2 (en) * | 2004-07-28 | 2010-01-05 | Iee International Electronics & Engineering S.A. | Detection and analysis of optical sensing probes |
| WO2006061947A1 (fr) * | 2004-12-08 | 2006-06-15 | Osaka University | Microscope a fluorescence et procede d’observation |
| JP4731225B2 (ja) * | 2005-07-08 | 2011-07-20 | Hoya株式会社 | 蛍光観察装置及び光源装置 |
| GB0601183D0 (en) * | 2006-01-20 | 2006-03-01 | Perkinelmer Ltd | Improvements in and relating to imaging |
| JP4792580B2 (ja) * | 2006-07-26 | 2011-10-12 | 国立大学法人北海道大学 | 発光寿命測定装置およびその測定方法 |
-
2010
- 2010-03-10 JP JP2010053214A patent/JP2011185842A/ja not_active Abandoned
-
2011
- 2011-03-09 US US13/044,439 patent/US20110224519A1/en not_active Abandoned
- 2011-03-10 EP EP11157639A patent/EP2365338A1/fr not_active Withdrawn
Patent Citations (8)
| Publication number | Priority date | Publication date | Assignee | Title |
|---|---|---|---|---|
| WO1992013265A1 (fr) * | 1991-01-24 | 1992-08-06 | The University Of Maryland | Procede et appareil d'imagerie multidimensionnelle a duree de vie de fluorescence a modulation de phase |
| JP2001509589A (ja) | 1997-07-07 | 2001-07-24 | シーダーズ−サイナイ・メディカル・センター | レーザー誘起蛍光減衰分光分析の方法と装置 |
| US6272376B1 (en) * | 1999-01-22 | 2001-08-07 | Cedars-Sinai Medical Center | Time-resolved, laser-induced fluorescence for the characterization of organic material |
| US20040073119A1 (en) * | 2001-03-01 | 2004-04-15 | Mary-Ann Mycek | Fluorescence lifetime spectrometer (fls) and methods of detecting diseased tissues |
| WO2005019800A2 (fr) * | 2003-08-19 | 2005-03-03 | Cedars-Sinai Medical Center | Procede de microscopie d'imagerie par duree de vie de fluorescence et de spectroscopie |
| JP2006282653A (ja) | 2005-03-10 | 2006-10-19 | Kyoto Univ | 標的部位で選択的に活性化される新規化合物およびその利用 |
| WO2008012785A2 (fr) * | 2006-07-24 | 2008-01-31 | University College Cork - National University Of Ireland, Cork | Sonde d'oxygène cellulaire |
| WO2008115521A1 (fr) * | 2007-03-19 | 2008-09-25 | The Regents Of The University Of Michigan | Indicateurs photoacoustiques |
Non-Patent Citations (10)
| Title |
|---|
| CHUNG A ET AL: "Advanced Optical Imaging Requiring No Contrast Agents-A New Armamentarium for Medicine and Surgery", CURRENT SURGERY, WILIAMS AND WILKINS, BALTIMORE, US, vol. 62, no. 3, 1 May 2005 (2005-05-01), pages 365 - 370, XP004910715, ISSN: 0149-7944, DOI: 10.1016/J.CURSUR.2004.12.011 * |
| D. SUD ET AL.: "Time-resolved optical imaging provides a molecular snapshot of altered metabolic function in living human cancer cell models", OPTICS EXPRESS, vol. 14, no. 10, 2006, pages 4412 - 4426 |
| D. SUD ET AL.: "Time-resolved optical imaging provides a molecular snapshot of altered metabolic function in living human cancer cell models", OPTICS EXPRESS, vol. 14, no. 10, 2006, pages 4412 - 4426, XP002635941 * |
| GERRITSEN HP ET AL: "Fluorescence lifetime imaging of oxygen in living cells", JOURNAL OF FLUORESCENCE, vol. 7, no. 1, 1 March 1997 (1997-03-01), pages 11 - 15, XP002635944, DOI: 10.1007/BF02764572 * |
| KONIG KARSTEN ET AL: "High-resolution multiphoton tomography of human skin with subcellular spatial resolution and picosecond time resolution.", JOURNAL OF BIOMEDICAL OPTICS JUL 2003 LNKD- PUBMED:12880349, vol. 8, no. 3, July 2003 (2003-07-01), pages 432 - 439, XP002637697, ISSN: 1083-3668 * |
| PAUL R J ET AL: "Oxygen concentration and the oxidation-reduction state of yeast: Determination of free/bound NADH and flavins by time-resolved spectroscopy", NATURWISSENSCHAFTEN, vol. 83, no. 1, 1996, pages 32 - 35, XP002635943, ISSN: 0028-1042 * |
| SCHWEITZER D ET AL: "[Time-correlated measurement of autofluorescence. A method to detect metabolic changes in the fundus].", DER OPHTHALMOLOGE : ZEITSCHRIFT DER DEUTSCHEN OPHTHALMOLOGISCHEN GESELLSCHAFT OCT 2002 LNKD- PUBMED:12376853, vol. 99, no. 10, October 2002 (2002-10-01), pages 774 - 779, XP002635942, ISSN: 0941-293X * |
| URAYAMA P ET AL: "A UV-visible-NIR fluorescence lifetime imaging microscope for laser-based biological sensing with picosecond resolution", APPLIED PHYSICS B: LASERS AND OPTICS, SPRINGER INTERNATIONAL, BERLIN, DE, vol. B76, no. 5, 1 January 2003 (2003-01-01), pages 483 - 496, XP002289222, ISSN: 0946-2171 * |
| VAN MUNSTER ERIK B ET AL: "Fluorescence lifetime imaging microscopy (FLIM)", ADVANCES IN BIOCHEMICAL ENGINEERING, BIOTECHNOLOGY, SPRINGER, BERLIN, DE, vol. 95, 1 January 2005 (2005-01-01), pages 143 - 175, XP008105148, ISSN: 0724-6145, [retrieved on 20050602], DOI: 10.1007/B102213 * |
| YUEZHI LI ET AL: "Quantitative Time-Resolved Fluorescence Spectrum of the Cortical Sarcoma and the Adjacent Normal Tissue", JOURNAL OF FLUORESCENCE, KLUWER ACADEMIC PUBLISHERS-PLENUM PUBLISHERS, NE, vol. 17, no. 6, 23 June 2006 (2006-06-23), pages 643 - 648, XP019553473, ISSN: 1573-4994 * |
Cited By (4)
| Publication number | Priority date | Publication date | Assignee | Title |
|---|---|---|---|---|
| WO2013131062A1 (fr) * | 2012-03-02 | 2013-09-06 | The Regents Of The University Of California | Système et procédé d'imagerie de fluorescence en temps différé et de mise en forme d'impulsions |
| US10041883B2 (en) | 2012-03-02 | 2018-08-07 | The Regents Of The University Of California | System and method for time-resolved fluorescence imaging and pulse shaping |
| WO2023075597A1 (fr) | 2021-10-28 | 2023-05-04 | Flash Pathology B.V. | Microscopie à impulsions femtosecondes |
| NL2029545B1 (en) * | 2021-10-28 | 2023-05-26 | Flash Pathology B V | Femtosecond pulsed microscopy |
Also Published As
| Publication number | Publication date |
|---|---|
| JP2011185842A (ja) | 2011-09-22 |
| US20110224519A1 (en) | 2011-09-15 |
Similar Documents
| Publication | Publication Date | Title |
|---|---|---|
| EP2365338A1 (fr) | Procédé d'analyse d'une région à faible oxygène et appareil par la mesure du temps passé de l'autofluorescence induite par la lumière à partir d'un échantillon biologique | |
| JP5437864B2 (ja) | pH測定装置の作動方法、検出装置の作動方法、及び生体物質分析装置の作動方法、並びに各装置 | |
| Marcu | Fluorescence lifetime techniques in medical applications | |
| JP5619351B2 (ja) | 組織を視覚的に特徴づけるための方法および装置 | |
| US8574859B2 (en) | In vivo flow cytometry based on cellular autofluorescence | |
| EP2209412B1 (fr) | Appareil d'endoscopie par fluorescence multitrajet, à agrandissement multiple et non confocal et procédés | |
| US20140140594A1 (en) | Methods and systems for three-dimensional real-time intraoperative surgical margin evaluation of tumor tissues | |
| JP2008541891A5 (fr) | ||
| US20150157209A1 (en) | Biomedical detection apparatus | |
| Kanawade et al. | Pilot study of laser induced breakdown spectroscopy for tissue differentiation by monitoring the plume created during laser surgery—An approach on a feedback Laser control mechanism | |
| JP2004514133A (ja) | 多光子イメージ化装置 | |
| EP2365337A1 (fr) | Procédé d'imagerie du pH intracellulaire et appareil utilisant la durée de vie de la fluorescence | |
| JP2011185841A (ja) | 粒子分析装置および粒子分析方法 | |
| CN101181152B (zh) | 时间分辨自体荧光寿命成像用于眼底病变早期诊断的方法及其装置 | |
| Lloyd et al. | Fluorescence spectroscopy | |
| Ghasemi et al. | Optical spectroscopic methods to discriminate in-Vitro Hodgkin cancerous and normal tissues | |
| KR20090104224A (ko) | 다파장 형광분광 및 간섭영상을 융합한 다중모드 조기 암진단 시스템 및 그 방법 | |
| US20230218154A1 (en) | System and Method for Dynamic Optical Contrast Imaging | |
| König | 1 brief history of fluorescence lifetime imaging | |
| Dave et al. | Defining the zone of acute peripheral nerve injury using fluorescence lifetime imaging in a crush injury sheep Model | |
| Fay et al. | High resolution Fluorescence lifetime IMaging Micro-Endoscopy (FLIMME) using a single multimode fiber | |
| Jaliashvili et al. | Laser induced fluorescence model of human goiter | |
| US20250164401A1 (en) | Systems and Methods for Multiphoton Microscopy | |
| RU2775461C1 (ru) | Устройство для оценки состава иммунокомпетентных клеток в опухолевой ткани спектрально-флуоресцентными методами с применением фотосенсибилизатора на основе хлорина е6 | |
| Katika et al. | In vivo time-resolved autofluorescence measurements on human skin |
Legal Events
| Date | Code | Title | Description |
|---|---|---|---|
| PUAI | Public reference made under article 153(3) epc to a published international application that has entered the european phase |
Free format text: ORIGINAL CODE: 0009012 |
|
| AK | Designated contracting states |
Kind code of ref document: A1 Designated state(s): AL AT BE BG CH CY CZ DE DK EE ES FI FR GB GR HR HU IE IS IT LI LT LU LV MC MK MT NL NO PL PT RO RS SE SI SK SM TR |
|
| AX | Request for extension of the european patent |
Extension state: BA ME |
|
| 17P | Request for examination filed |
Effective date: 20120314 |
|
| 17Q | First examination report despatched |
Effective date: 20140616 |
|
| STAA | Information on the status of an ep patent application or granted ep patent |
Free format text: STATUS: THE APPLICATION IS DEEMED TO BE WITHDRAWN |
|
| 18D | Application deemed to be withdrawn |
Effective date: 20141028 |