EP2372481A2 - Betriebszustandsanalysesystem und Betriebzustandsanalyseverfahren - Google Patents
Betriebszustandsanalysesystem und Betriebzustandsanalyseverfahren Download PDFInfo
- Publication number
- EP2372481A2 EP2372481A2 EP11159479A EP11159479A EP2372481A2 EP 2372481 A2 EP2372481 A2 EP 2372481A2 EP 11159479 A EP11159479 A EP 11159479A EP 11159479 A EP11159479 A EP 11159479A EP 2372481 A2 EP2372481 A2 EP 2372481A2
- Authority
- EP
- European Patent Office
- Prior art keywords
- operational state
- processed data
- data items
- state analysis
- waveform
- Prior art date
- Legal status (The legal status is an assumption and is not a legal conclusion. Google has not performed a legal analysis and makes no representation as to the accuracy of the status listed.)
- Withdrawn
Links
Images


Classifications
-
- G—PHYSICS
- G05—CONTROLLING; REGULATING
- G05B—CONTROL OR REGULATING SYSTEMS IN GENERAL; FUNCTIONAL ELEMENTS OF SUCH SYSTEMS; MONITORING OR TESTING ARRANGEMENTS FOR SUCH SYSTEMS OR ELEMENTS
- G05B23/00—Testing or monitoring of control systems or parts thereof
- G05B23/02—Electric testing or monitoring
- G05B23/0205—Electric testing or monitoring by means of a monitoring system capable of detecting and responding to faults
- G05B23/0218—Electric testing or monitoring by means of a monitoring system capable of detecting and responding to faults characterised by the fault detection method dealing with either existing or incipient faults
- G05B23/0224—Process history based detection method, e.g. whereby history implies the availability of large amounts of data
- G05B23/024—Quantitative history assessment, e.g. mathematical relationships between available data; Functions therefor; Principal component analysis [PCA]; Partial least square [PLS]; Statistical classifiers, e.g. Bayesian networks, linear regression or correlation analysis; Neural networks
Definitions
- the present invention relates to an operational state analysis system and an operation state analysis method, in which an operational state of a plant can be analyzed based on processed data items.
- an operational state of a plant there is a method of analyzing the operational state of the plant by using a trend graph or a scatter diagram of processed data items of the plant. For example, while operating the plant, an operator of the plant monitors online a great number of processed data items through a screen display that is controlled by an operational monitoring device, and monitors abnormalities based on the operator's experience or intuition. Also, in the case of making an offline analysis of an abnormality in an operation to improve the plant, plant improvement staff analyze the cause of the abnormality through the trend graph or the scatter diagram by using an offline analysis function of an analysis system.
- the operational state of the plant may not only be determined by the existence/nonexistence of abnormalities in respective processed values, but the balance between the processed data items may be an important factor.
- the operational state analysis system may analyze an operational state of a plant based on processed data items related to the plant.
- the operational state analysis system may include a reception unit that receives a selection of the processed data items, the selection being performed by user of the operational state analysis system, a property value acquisition unit that acquires a plurality of property values, each of the plurality of property values being one of values of the processed data items and statistical values based on the processed data items of which the selection is received by the reception unit, and a waveform display unit that displays the plurality of property values acquired by the property value acquisition unit as waveforms that analyzes the operational state.
- An operational state analysis system may include a field controller that controls field devices disposed in a plant, a manipulation monitoring device that manipulates and monitors the field controller, a data storage unit that stores processed data items related to the plant, and an analysis terminal device that analyzes an operational state of the plant based on the processed data items related to the plant.
- the analysis terminal device may include a reception unit that receives a selection of the processed data items, the selection being performed by user of the operational state analysis system, a property value acquisition unit that acquires a plurality of property values, each of the plurality of property values being one of values of the processed data items and statistical values based on the processed data items of which the selection is received by the reception unit, and a waveform display unit that displays the plurality of property values acquired by the property value acquisition unit as waveforms that analyzes the operational state.
- An operational state analysis method may analyze the operational state of a plant based on processed data items.
- the operational state analysis method may include receiving a selection of the processed data items, acquiring a plurality of property values that are one of values of the processed data items and statistical values based on the processed data items of which the selection has been received, and displaying the plurality of property values as waveforms so as to analyze the operational state of the plant.
- the operational state analysis system may analyze an operational state of a plant based on processed data items related to the plant.
- the operational state analysis system may include a reception unit that receives a selection of the processed data items, the selection being performed by user of the operational state analysis system, a property value acquisition unit that acquires a plurality of property values, each of the plurality of property values being one of values of the processed data items and statistical values based on the processed data items of which the selection is received by the reception unit, and a waveform display unit that displays the plurality of property values acquired by the property value acquisition unit as waveforms that analyzes the operational state.
- the operational state analysis system may further include an analysis unit that calculates a difference between the waveforms displayed by the waveform display unit as a Mahalanobis' generalized distance.
- the analysis unit may calculate a contribution of one of the plurality of property values for the Mahalanobis' generalized distance.
- the waveform display unit may display a first waveform that is obtained through the reception unit when the processed data items in a period in which the operational state is normal is given and a second waveform that is obtained through the reception unit when the processed data items in a predetermined period is given in a comparable manner.
- the reception unit may receive the selection of the processed data items based on a user's operation on a display screen on which the waveforms are displayed by the waveform display unit.
- the processed data items that are given through the reception unit may be stored in advance as historical data.
- the processed data items that are given through the reception unit may be current processed data items obtained from the plant.
- An operational state analysis system may include a field controller that controls field devices disposed in a plant, a manipulation monitoring device that manipulates and monitors the field controller, a data storage unit that stores processed data items related to the plant, and an analysis terminal device that analyzes an operational state of the plant based on the processed data items related to the plant.
- the analysis terminal device may include a reception unit that receives a selection of the processed data items, the selection being performed by user of the operational state analysis system, a property value acquisition unit that acquires a plurality of property values, each of the plurality of property values being one of values of the processed data items and statistical values based on the processed data items of which the selection is received by the reception unit, and a waveform display unit that displays the plurality of property values acquired by the property value acquisition unit as waveforms that analyzes the operational state.
- the analysis terminal device may further include an analysis unit that calculates a difference between the waveforms displayed by the waveform display unit as a Mahalanobis' generalized distance.
- the operational state analysis system may further include a monitor screen on which the waveform display unit displays the waveforms, the reception unit receiving the selection of the processed data items based on a user's operation on the display screen.
- the processed data items that are given through the reception unit may be current processed data items obtained from the plant.
- An operational state analysis method may analyze the operational state of a plant based on processed data items.
- the operational state analysis method may include receiving a selection of the processed data items, acquiring a plurality of property values that are one of values of the processed data items and statistical values based on the processed data items of which the selection has been received, and displaying the plurality of property values as waveforms so as to analyze the operational state of the plant.
- the operational state analysis method may further include calculating a difference between the waveforms that has been displayed as a Mahalanobis' generalized distance.
- the operational state analysis method may further include calculating a contribution of one of the plurality of property values for the Mahalanobis' generalized distance.
- the operational state analysis method may further include displaying a first waveform that is obtained when the processed data items in a period in which the operational state is normal is given and a second waveform that is obtained when the processed data items in a predetermined period is given in a comparable manner.
- the operational state analysis method may further include receiving the selection of the processed data items based on a user's operation on a display screen on which the waveforms are displayed.
- the processed data items may be stored in advance as historical data.
- the processed data items may be current processed data items obtained from the plant.
- a plurality of property values which are values of processed data items themselves or statistical values based on the processed data items, are displayed as waveforms for analyzing the operational state of a plant, and thus the balance between a great number of processed data items can be objectively grasped.
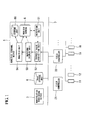
- FIG. 1 is a block diagram illustrating an example of a conjugation of a distributed field control system including the operational state analysis system in accordance with the first preferred embodiment of the present invention.
- the field control system includes field controllers 21, 22, ..., an operational monitoring device 3, a data storage unit 4, an analysis terminal device 5, and a communication bus 7.
- the field controller 21 controls field devices 11, 12, ... that are disposed in a plant.
- the field controller 22 controls field devices 15, 16, ... that are disposed in the plant.
- the operational monitoring device 3 performs operation and monitoring of the field controllers 21, 22, ... through the communication bus 7.
- the data storage unit 4 stores processed data items handled in the field control system as historical data.
- the analysis terminal device 5 analyzes an operational state of the plant.
- the field controllers 21, 22, ..., the operational monitoring device 3, the data storage unit 4, and the analysis terminal device 5 are connected together through a communication bus 7.
- the analysis terminal device 5 includes a reception unit 51, a property value acquisition unit 52, a waveform display unit 53, an analysis unit 54, and a storage unit 55.
- the reception unit 51 receives a selection of processed data items.
- the property value acquisition unit 52 acquires a plurality of property values that are values of the processed data items or statistical values based on the processed data items of which the selection is received by the reception unit 51.
- the waveform display unit 53 displays the plurality of property values acquired by the property value acquisition unit 52 on a monitor screen 6 as waveforms for analyzing the operational state of the plant.
- the analysis unit 54 performs analysis based on the waveforms that are displayed by the waveform display unit 53.
- the storage unit 55 stores the result of the analysis or the like by the analysis unit 54.
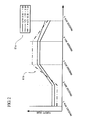
- FIG. 2 is a diagram illustrating an example of waveforms that are displayed on the monitor screen 6 by the waveform display unit 53.
- the horizontal axis of FIG. 2 represents the processed data items A, B, C, D and E.
- the vertical axis of FIG. 2 represents respective property values of the processed data items.
- the plotted points are connected by straight lines as a broken line graph.
- a user selects one of processed data items A, B, C, D, and E of which the balances are desired to be investigated through the reception unit 51.
- historical data stored in the data storage unit 4 or online data that is handled by the operational monitoring device 3 or the field controller 2 may be selected as the processed data items to be analyzed.
- the processed data items may be selected in a designated period.
- one of the processed data items A, B, C, D, and E is selected with respect to three different periods, respectively.
- the user may determine the arrangement of the respective processed data items through the reception unit 51.
- the respective processed data items A, B, C, D, and E are arranged in the order according to the flow of processes. It may facilitate the analysis in consideration of each process or the order of processes to arrange the process in the order of processed data as described above.
- the property value acquisition unit 52 calculates property values of the processed data items.
- the property value is a value of the processed data item or a statistical value based on the processed data item.
- the property value includes an instantaneous value, the average value, the maximum value, the minimum value, the standard deviation of the processed data items, and the like.
- the property value may be freely defined by the user.
- the kinds of property values for the respective processed data items may be common or may differ from one another.
- the average value of the respective processed data items A, B, C, D, and E may be the property value.
- the average value and the maximum value of the processed data items may be mixedly designated.
- the processed data items A, B, C, D, and E that become the basis of the property values are all different data, different property values based on the same processed data items may also be designated.
- the instantaneous value, the average value, the maximum value, and the like, of the processed data item A may be designated as respective independent property values.
- the waveform display unit 53 arranges the processed data items on the horizontal axis, plots the respective property values on the vertical axis, and prepares the broken line graph in which plotted points are connected by straight lines, and displays the graph on the monitor screen 6.
- This broken line graph indicates the balance between the processed data items to be analyzed as pseudo-waveforms.
- three broken line graphs for the processed data items having different periods are illustrated.
- distribution analysis is used as one technique of analyzing the balance between the plurality of data.
- the distribution analysis has the advantages in that the distribution of unevenness of data is visually grasped by a contour diagram or the like.
- the distribution analysis can analyze only the distribution of the same kind of physical amounts. Physical coordinates for indicating the respective data values are required.
- the balances expressed by the pseudo-waveforms can express the distribution state without being conscious of the difference between the kinds of physical amounts such as temperature, pressure, and flow rate, physical positional coordinates, and the kinds of processed data items such as process values, and manipulative values.
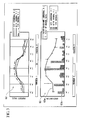
- FIG. 3 is a diagram illustrating an example of a display screen that indicates waveform display by the waveform display unit 53 and the results of calculation of contribution of the waveforms.
- FIG. 3 includes a region 62 that displays the processed value corresponding to each processed data item and a region 63 that displays the contribution of the processed data corresponding to each processed data item.
- the balance between processed data items is indicated by three broken line graphs as the waveform display by the waveform display unit 53. Also, separately from these broken line graphs, a broken line graph of a pseudo-waveform that indicates an ideal balance may be displayed.
- This ideal waveform for example, is determined as a pseudo-waveform that is closest to a pseudo-waveform group that corresponds to a process group which was normal in the past.
- the pseudo-waveform that indicates the ideal balance may be determined, for example, as a waveform that minimizes the total sum of Mahalanobis' generalized distances, that is, MD values, among pseudo-waveform groups that correspond to the process group which was normal in the past, or an average of pseudo-waveform groups that correspond to the process group which was normal in the past.
- the MD value is a value calculated using the Mahalanobis and Taguchi method (MT method).
- the shape of the pseudo-waveform may be adjusted by normalizing the property values. For example, by performing normalization so that the ideal pseudo-waveform becomes a straight line, it becomes easy to uniformly grasp the difference between the respective property values.
- the analysis unit 54 applies the MT method to a feature amount of each property value based on the pseudo-waveform by the waveform display unit 53 that is displayed in the region 62.
- the difference between the pseudo-waveforms is calculated as the Mahalanobis' distance, that is, the MD value.
- the MD value is larger, the difference between the waveforms becomes greater.
- it is obtained as the contribution that is determined for each property value which makers the difference between the pseudo-waveforms greater. That is, based on the contribution that is determined for each property value, it can be known which property value makes the difference between the pseudo-waveforms greater.
- the difference can be indicated as an objective numerical value. Also, in the case where the MD value exceeds a threshold value that is set for the MD value, this case is determined to be abnormal, and thus it becomes possible to discriminate between normality and abnormality based on the objective basis. For example, although in the region 62 of FIG. 3 , the discrimination between normality and abnormality is made with respect to the respective pseudo-waveforms, the normality/abnormality may be determined based on the MD value between the respective pseudo-waveforms and the pseudo-waveform that indicates an ideal balance.
- the average and the deviation of the pseudo-waveform group that corresponds to the process group which was normal in the past are displayed together with the pseudo-waveform 63a to be analyzed in a period in which abnormality occurs. Also, the contribution of the respective property values for the three pseudo-waveforms is displayed as a bar graph 63b. Because of this, the property value that has a great contribution to the pseudo-waveform can be grasped as an index to be watched in the case where abnormalities occur.
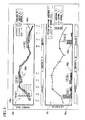
- FIGS. 4 , 5A and 5B are diagrams illustrating an example of a display screen in the case where a feature extraction border is to give a pseudo-waveform and an analysis is performed within the range.
- a region 64 of FIG. 4 three pseudo-waveforms by the waveform display unit 53 are displayed.
- a user can set the feature extraction border. For example, if an extraction border 64a is set in FIG. 4 , the property value acquisition unit 52 acquires the property value in the range that is prescribed by the extraction border 64a, and this property value becomes the subject of analysis in the waveform display unit 53 and the analysis unit 54. That is, a process of receiving the setting of the extraction border 64 on the display screen is performed as the function of the reception unit 51 that receives the selection of the property value to be analyzed or the processed data item.
- "P1-B1" represents "Process 1 - Border 1.”
- the extraction border 64a is set in the region 64, the feature amount by a sample line is obtained with respect to the pseudo-waveform in the range of the extraction border 64a by the operation of the analysis unit 54, and the MD value for the normal pseudo-waveform and the contributions to the MD valuer for the respective property values are calculated by applying the MT method. Further, the calculation result of the contributions is displayed as a bar graph 65a in the region 65. In the bar graph 65a, in the same manner as in the bar graph 63b in FIG. 3 , the contributions of the respective property values are displayed with respect to the three pseudo-waveforms.
- the extraction border 64b is set in the region 64
- the contribution for the respective property values are calculated with respect to the pseudo-waveform in the range of the extraction border 64b, and the calculation result of the contributions is displayed as a bar graph 65b in the region 65.
- the extraction border 64c is set in the region 64, the contribution for the respective property values are calculated with respect to the pseudo-waveform in the range of the extraction border 64c, and the calculation result of the contributions is displayed as a bar graph 65c in the region 65.
- the setting of the sample line corresponds to the coordinate setting within the extraction border.
- the feature amount may be set as an arbitrary value.
- the feature amount may be an average value, the maximum value, the minimum value, the standard deviation, the number of maximum values, the number of minimum values, and the number of inflection points of the numerical values that indicate the pseudo-waveforms within the extraction border, the average value, the maximum value, the minimum value, the standard deviation, the number of maximum values, the number of minimum values, and the number of inflection points of slopes of the pseudo-waveforms within the extraction border, and the like.
- two pseudo-waveforms prepared by the waveform display unit 53 are displayed in a region 66a. Accordingly, balances of the two waveforms can be compared with eyes. Also, in the region 66a, the setting of the feature extraction border is received and displayed.
- the number of the pseudo-waveforms displayed on the region 66a is not limited to two, but may be an arbitrary number.
- a pseudo-waveform selected as the subject of analysis among pseudo-waveforms displayed in the region 66a is displayed.
- the extraction border which is as set in the region 66a may be displayed.
- the MD values between the normal pseudo-waveforms are displayed with respect to the pseudo-waveforms displayed in the region 66b.
- the contributions of specified property values for the MD values between the normal pseudo-waveforms are displayed with respect to the range of which the feature extraction border is set in the region 66b.
- the contributions to the MD values for the specified property values in the ranges that correspond to the respective feature extraction borders are displayed in the region 66d to correspond to the setting of three feature extraction borders in the region 66b.
- the range of which processes have abnormalities can be made narrow based on the contribution to the feature extraction border. Also, the data device tag of the processes that are the cause of the abnormalities can be made narrow from the contribution for each property value.
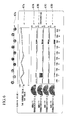
- FIG. 6 is a diagram illustrating an example of an analysis screen that is displayed on a monitor screen 6 during the plant operation.
- a region 67a in which the pseudo-waveforms, which are prepared by the waveform display unit 53, are displayed in real time based on the property values for the respective device tags, for example, the process values
- a region 67b in which a process schematic diagram for indicating the correspondence relationship between the device tag that corresponds to the horizontal axis of the pseudo-waveform and the process, which is displayed together with the simulated waveform displayed in the region 67a
- regions 67A to 67D in which the contributions to the property values of the device tags for quality characteristics A to D are displayed.
- the property value based on a manipulative value and the property value based on the actual process value are displayed to overlap each other as pseudo-waveforms.
- the pseudo-waveform during the normal state and the pseudo-waveform prepared in real time may be displayed to overlap each other.
- the relationship between the quality characteristics A to D and the contribution to the property values is obtained in advance by the MT method. Also, regarding the device tag displayed on the analysis screen, the operator's burden can be reduced by narrowing the range in which the device tag exerts a great influence on the plant operation, for example, the range in which the contribution is high.
- the MD value is calculated in real time in the normal state for the quality characteristics A to D. If the MD value exceeds the threshold value, the abnormality is notified.
- the abnormality is detected in the quality characteristic B, and in this case, the operator can take measures such as operation of the tag or the like since the operator can recognize that the main cause of the abnormality is a tag "Tag 2" that corresponds to the property value having high contribution to the quality characteristics B.
- the plant operator can visually determine the operational state of the plant from the overlapping of pseudo-waveforms during the normal state and the pseudo-waveform prepared in real time. Also, the operator can grasp in a numerical value the estrangement from the normal operational state of the plant and the tendency from the trend of the MD value between the pseudo-waveform during the normal state and the pseudo-waveform prepared in real time. Also, based on the preset threshold value, the operator can grasp the state of the plant. Further, the operator can grasp the cause of the abnormality with reference to the value or change of the contribution for each property value, and perform an appropriate operation.
- the operational state analysis system in accordance with preferred embodiments of the present invention can be widely used in analysis for the operation to improve the plant or the analysis during the plant operation.
- the operational situations in the past can be analyzed based on the pseudo-waveforms, the MD values, and the contributions which are obtained using the processed data of historical data stored in the data storage unit 4.
- an appropriate analytical technique can be searched for. If the condition for obtaining the pseudo-waveforms based on the purpose of analysis or the result of analysis is constructed, it is registered as a new analytical technique and may be stored in the data storage unit 55 of FIG. 1 .
- the analysis for the operation to improve the plant or the result of analysis of the pseudo-waveforms, the MD values, and the contributions obtained by the analysis during the plant operation are appropriately stored in the data storage unit 55.
- the analytical technique or the result of analysis stored in the data storage unit 55 is read from the data storage unit 55 at a proper time to be used.
- the analytical technique that corresponds to the analysis screen as illustrated in FIG. 6 may be registered, and using this, the operational state may be monitored during the plant operation.
- the analysis can be performed in real time on the same condition as that such as performing the analysis step.
- the analysis staff may perform the analysis of the plant operation using the analysis result in the past or may produce a new analytical technique using the analysis result in the past, through proper reference to the analytical technique or the analysis result in the past.
- the pseudo-waveform is a waveform in the form of a broken line graph.
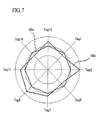
- FIG. 7 is a diagram illustrating an example of displaying the pseudo-waveform through a cobweb chart.
- the pseudo-waveform may be displayed by a cobweb chart.
- the waveform 69a is displayed as the ideal pseudo-waveform
- the waveform 69b is displayed as the pseudo-waveform to be analyzed.
- the balance between the processed data items can be visually grasped as a waveform. Also, by making the pseudo-waveform during the normal state and the pseudo-waveform to be analyzed overlap each other, for example, as illustrated in FIG. 3 , the difference of whether the waveform to be analyzed is normal or abnormal can be visually grasped.
- the process in the abnormal state can be grasped from the MD value, and the property value that is the cause of the abnormality can be grasped from the contribution value.
- the application range of the present invention is not limited to the above-described preferred embodiments.
- the present invention may be widely applied to a filed communication system or the like which transmits/receives process data to/from the field device through wireless communication.
- unit is used to describe a component, section or part of a hardware and/or software that is constructed and/or programmed to carry out the desired function.
- Typical examples of the hardware may include, but are not limited to, a device and a circuit.
Landscapes
- Physics & Mathematics (AREA)
- Engineering & Computer Science (AREA)
- Artificial Intelligence (AREA)
- Evolutionary Computation (AREA)
- Mathematical Physics (AREA)
- General Physics & Mathematics (AREA)
- Automation & Control Theory (AREA)
- Testing And Monitoring For Control Systems (AREA)
Applications Claiming Priority (1)
| Application Number | Priority Date | Filing Date | Title |
|---|---|---|---|
| JP2010074309A JP5062496B2 (ja) | 2010-03-29 | 2010-03-29 | 運転状態解析システムおよび運転状態解析方法 |
Publications (2)
| Publication Number | Publication Date |
|---|---|
| EP2372481A2 true EP2372481A2 (de) | 2011-10-05 |
| EP2372481A3 EP2372481A3 (de) | 2012-03-07 |
Family
ID=44486098
Family Applications (1)
| Application Number | Title | Priority Date | Filing Date |
|---|---|---|---|
| EP11159479A Withdrawn EP2372481A3 (de) | 2010-03-29 | 2011-03-23 | Betriebszustandsanalysesystem und Betriebzustandsanalyseverfahren |
Country Status (3)
| Country | Link |
|---|---|
| US (1) | US20110238372A1 (de) |
| EP (1) | EP2372481A3 (de) |
| JP (1) | JP5062496B2 (de) |
Cited By (1)
| Publication number | Priority date | Publication date | Assignee | Title |
|---|---|---|---|---|
| EP2897013A4 (de) * | 2012-09-13 | 2015-10-14 | Omron Tateisi Electronics Co | Überwachungsvorrichtung, überwachungsverfahren, programm und aufzeichnungsmedium |
Families Citing this family (7)
| Publication number | Priority date | Publication date | Assignee | Title |
|---|---|---|---|---|
| JP6076119B2 (ja) * | 2013-02-14 | 2017-02-08 | 株式会社総合車両製作所 | 摩擦撹拌接合方法及び摩擦撹拌接合装置 |
| JP5991329B2 (ja) * | 2014-01-28 | 2016-09-14 | 横河電機株式会社 | 制御装置、管理装置、プラント制御システム、及びデータ処理方法 |
| US10142199B2 (en) * | 2014-12-19 | 2018-11-27 | Emerson Process Management Lllp | Automatic process data transmission and monitoring for an industrial process network |
| JP6504089B2 (ja) * | 2016-03-10 | 2019-04-24 | 横河電機株式会社 | 工程監視装置、工程監視システム、工程監視方法、工程監視プログラム及び記録媒体 |
| KR102340965B1 (ko) * | 2017-01-27 | 2021-12-17 | 애니와이어 가부시키가이샤 | 상태 판정 시스템 |
| JP6772963B2 (ja) * | 2017-06-05 | 2020-10-21 | トヨタ自動車株式会社 | 異常診断装置及び異常診断方法 |
| JP6984370B2 (ja) * | 2017-12-06 | 2021-12-17 | 横河電機株式会社 | 生産支援システム、生産支援方法及びプログラム |
Citations (4)
| Publication number | Priority date | Publication date | Assignee | Title |
|---|---|---|---|---|
| JP2007227279A (ja) | 2006-02-27 | 2007-09-06 | Mitsubishi Paper Mills Ltd | 光電変換材料、半導体電極並びにそれを用いた光電変換素子 |
| JP2007267474A (ja) | 2006-03-28 | 2007-10-11 | Tokyo Electric Power Co Inc:The | 汎用型装置内通信機器の防護装置 |
| JP2007298525A (ja) | 2007-06-14 | 2007-11-15 | Shoichi Tejima | 波形パターンデータから製品の良品・不良品の検査のための特徴を抽出する方法及びプログラム |
| JP2010074309A (ja) | 2008-09-16 | 2010-04-02 | Olympus Corp | 電子カメラ及びデータ処理システム |
Family Cites Families (15)
| Publication number | Priority date | Publication date | Assignee | Title |
|---|---|---|---|---|
| JP4664469B2 (ja) * | 2000-06-13 | 2011-04-06 | 株式会社東芝 | プラント監視装置および記憶媒体 |
| JP4071449B2 (ja) * | 2001-03-27 | 2008-04-02 | 株式会社東芝 | センサ異常検出方法及びセンサ異常検出装置 |
| JP4878085B2 (ja) * | 2001-04-20 | 2012-02-15 | ラピスセミコンダクタ株式会社 | 製造工程のための管理方法 |
| JP4111158B2 (ja) * | 2004-03-19 | 2008-07-02 | 株式会社デンソー | 圧力センサ |
| US7363195B2 (en) * | 2004-07-07 | 2008-04-22 | Sensarray Corporation | Methods of configuring a sensor network |
| JP2006073602A (ja) * | 2004-08-31 | 2006-03-16 | Omron Corp | 熱処理の異常検出方法、異常検出装置、温度調節器およびプログラム |
| US7646092B2 (en) * | 2005-12-06 | 2010-01-12 | Yamaha Corporation | Semiconductor device and manufacturing method thereof |
| EP1860418A1 (de) * | 2006-05-23 | 2007-11-28 | Sensirion AG | Verfahren zur Herstellung eines Drucksensors unter Verwendung von SOI-Wafern |
| JP5107539B2 (ja) * | 2006-08-03 | 2012-12-26 | 新光電気工業株式会社 | 半導体装置および半導体装置の製造方法 |
| JP4671131B2 (ja) * | 2006-08-10 | 2011-04-13 | 横河電機株式会社 | 安全計装システム |
| US7917330B2 (en) * | 2007-06-15 | 2011-03-29 | Yokogawa Electric Corporation | Situation analyzing system and situation analyzing method, and batch processing analyzing system and batch processing analyzing method |
| JP4957406B2 (ja) * | 2007-06-27 | 2012-06-20 | 横河電機株式会社 | バッチプロセス解析システムおよびバッチプロセス解析方法 |
| JP5234321B2 (ja) * | 2008-01-30 | 2013-07-10 | 横河電機株式会社 | プロセス関連データ表示装置およびプロセス関連データ表示方法 |
| US7756678B2 (en) * | 2008-05-29 | 2010-07-13 | General Electric Company | System and method for advanced condition monitoring of an asset system |
| US8352216B2 (en) * | 2008-05-29 | 2013-01-08 | General Electric Company | System and method for advanced condition monitoring of an asset system |
-
2010
- 2010-03-29 JP JP2010074309A patent/JP5062496B2/ja not_active Expired - Fee Related
-
2011
- 2011-03-23 EP EP11159479A patent/EP2372481A3/de not_active Withdrawn
- 2011-03-28 US US13/073,104 patent/US20110238372A1/en not_active Abandoned
Patent Citations (4)
| Publication number | Priority date | Publication date | Assignee | Title |
|---|---|---|---|---|
| JP2007227279A (ja) | 2006-02-27 | 2007-09-06 | Mitsubishi Paper Mills Ltd | 光電変換材料、半導体電極並びにそれを用いた光電変換素子 |
| JP2007267474A (ja) | 2006-03-28 | 2007-10-11 | Tokyo Electric Power Co Inc:The | 汎用型装置内通信機器の防護装置 |
| JP2007298525A (ja) | 2007-06-14 | 2007-11-15 | Shoichi Tejima | 波形パターンデータから製品の良品・不良品の検査のための特徴を抽出する方法及びプログラム |
| JP2010074309A (ja) | 2008-09-16 | 2010-04-02 | Olympus Corp | 電子カメラ及びデータ処理システム |
Cited By (3)
| Publication number | Priority date | Publication date | Assignee | Title |
|---|---|---|---|---|
| EP2897013A4 (de) * | 2012-09-13 | 2015-10-14 | Omron Tateisi Electronics Co | Überwachungsvorrichtung, überwachungsverfahren, programm und aufzeichnungsmedium |
| US9494932B2 (en) | 2012-09-13 | 2016-11-15 | Omron Corporation | Monitoring device, monitoring method, and recording medium |
| CN104583887B (zh) * | 2012-09-13 | 2017-03-01 | 欧姆龙株式会社 | 监视装置、以及监视方法 |
Also Published As
| Publication number | Publication date |
|---|---|
| JP5062496B2 (ja) | 2012-10-31 |
| US20110238372A1 (en) | 2011-09-29 |
| JP2011209798A (ja) | 2011-10-20 |
| EP2372481A3 (de) | 2012-03-07 |
Similar Documents
| Publication | Publication Date | Title |
|---|---|---|
| EP2372481A2 (de) | Betriebszustandsanalysesystem und Betriebzustandsanalyseverfahren | |
| US20200333777A1 (en) | Abnormality detection method and abnormality detection apparatus | |
| US10025283B2 (en) | Controller, manager, plant control system, and data processing method | |
| JP4046309B2 (ja) | プラント監視装置 | |
| CN113874800B (zh) | 提高生产效率的支援系统 | |
| US12436508B2 (en) | Assistance device, learning device, and plant operation condition setting assistance system | |
| KR102073925B1 (ko) | 열화 진단 장치 | |
| JP2009187175A (ja) | バッチプロセスデータの解析装置およびそれを用いた異常検出/品質推定装置 | |
| CN115847427B (zh) | 双重识别的协作机器人监测工业物联网系统及其控制方法 | |
| WO2021241580A1 (ja) | 異常変調原因特定装置、異常変調原因特定方法及び異常変調原因特定プログラム | |
| WO2019106860A1 (ja) | 工作機械の制御方法、工作機械の制御装置、工作機械の設定支援装置、工作機械の制御システム及びプログラム | |
| CN106370554A (zh) | 一种烟草含水率检测及在线水分仪监测方法 | |
| EP4270277A1 (de) | System und verfahren zur erkennung von arbeitsverhalten | |
| EP3293683A1 (de) | Verfahren und system zum trainieren eines maschinenlernalgorithmus zur auswahl von prozessparametern für ein industrielles verfahren | |
| US20200056797A1 (en) | Area-specific environment management system, method, and program | |
| CN115408089B (zh) | 一种双屏显示切换方法、系统、存储介质及智能终端 | |
| WO2021241579A1 (ja) | 異常変調原因特定装置、異常変調原因特定方法及び異常変調原因特定プログラム | |
| JP2022015794A (ja) | 作業評価システムおよび方法 | |
| CN112656363B (zh) | 视力检测系统及视力检测方法 | |
| US20220004154A1 (en) | Information processing apparatus | |
| CN103733041B (zh) | 管理装置及管理方法 | |
| US20180267520A1 (en) | Method for manufacturing parts based on simultaneous analysis of statistical indicators | |
| WO2021256017A1 (ja) | コントローラ、システム、方法及びプログラム | |
| EP4212979A1 (de) | Computerimplementiertes verfahren und vorrichtung zur überwachung einer anlage | |
| US11687061B2 (en) | Data collection and analysis system, data collection and analysis apparatus, machine learning apparatus, and data collection and analysis method |
Legal Events
| Date | Code | Title | Description |
|---|---|---|---|
| PUAI | Public reference made under article 153(3) epc to a published international application that has entered the european phase |
Free format text: ORIGINAL CODE: 0009012 |
|
| AK | Designated contracting states |
Kind code of ref document: A2 Designated state(s): AL AT BE BG CH CY CZ DE DK EE ES FI FR GB GR HR HU IE IS IT LI LT LU LV MC MK MT NL NO PL PT RO RS SE SI SK SM TR |
|
| AX | Request for extension of the european patent |
Extension state: BA ME |
|
| PUAL | Search report despatched |
Free format text: ORIGINAL CODE: 0009013 |
|
| AK | Designated contracting states |
Kind code of ref document: A3 Designated state(s): AL AT BE BG CH CY CZ DE DK EE ES FI FR GB GR HR HU IE IS IT LI LT LU LV MC MK MT NL NO PL PT RO RS SE SI SK SM TR |
|
| AX | Request for extension of the european patent |
Extension state: BA ME |
|
| RIC1 | Information provided on ipc code assigned before grant |
Ipc: G05B 23/02 20060101AFI20120131BHEP |
|
| STAA | Information on the status of an ep patent application or granted ep patent |
Free format text: STATUS: THE APPLICATION IS DEEMED TO BE WITHDRAWN |
|
| 18D | Application deemed to be withdrawn |
Effective date: 20120908 |