EP2463384A2 - Diagnosekits, genetische Marker und Verfahren zur SCD- oder SCA-Therapieauswahl - Google Patents
Diagnosekits, genetische Marker und Verfahren zur SCD- oder SCA-Therapieauswahl Download PDFInfo
- Publication number
- EP2463384A2 EP2463384A2 EP11192355A EP11192355A EP2463384A2 EP 2463384 A2 EP2463384 A2 EP 2463384A2 EP 11192355 A EP11192355 A EP 11192355A EP 11192355 A EP11192355 A EP 11192355A EP 2463384 A2 EP2463384 A2 EP 2463384A2
- Authority
- EP
- European Patent Office
- Prior art keywords
- seq
- sca
- snp
- snps
- probes
- Prior art date
- Legal status (The legal status is an assumption and is not a legal conclusion. Google has not performed a legal analysis and makes no representation as to the accuracy of the status listed.)
- Withdrawn
Links
Images


Classifications
-
- C—CHEMISTRY; METALLURGY
- C12—BIOCHEMISTRY; BEER; SPIRITS; WINE; VINEGAR; MICROBIOLOGY; ENZYMOLOGY; MUTATION OR GENETIC ENGINEERING
- C12Q—MEASURING OR TESTING PROCESSES INVOLVING ENZYMES, NUCLEIC ACIDS OR MICROORGANISMS; COMPOSITIONS OR TEST PAPERS THEREFOR; PROCESSES OF PREPARING SUCH COMPOSITIONS; CONDITION-RESPONSIVE CONTROL IN MICROBIOLOGICAL OR ENZYMOLOGICAL PROCESSES
- C12Q1/00—Measuring or testing processes involving enzymes, nucleic acids or microorganisms; Compositions therefor; Processes of preparing such compositions
- C12Q1/68—Measuring or testing processes involving enzymes, nucleic acids or microorganisms; Compositions therefor; Processes of preparing such compositions involving nucleic acids
- C12Q1/6876—Nucleic acid products used in the analysis of nucleic acids, e.g. primers or probes
- C12Q1/6883—Nucleic acid products used in the analysis of nucleic acids, e.g. primers or probes for diseases caused by alterations of genetic material
-
- C—CHEMISTRY; METALLURGY
- C12—BIOCHEMISTRY; BEER; SPIRITS; WINE; VINEGAR; MICROBIOLOGY; ENZYMOLOGY; MUTATION OR GENETIC ENGINEERING
- C12Q—MEASURING OR TESTING PROCESSES INVOLVING ENZYMES, NUCLEIC ACIDS OR MICROORGANISMS; COMPOSITIONS OR TEST PAPERS THEREFOR; PROCESSES OF PREPARING SUCH COMPOSITIONS; CONDITION-RESPONSIVE CONTROL IN MICROBIOLOGICAL OR ENZYMOLOGICAL PROCESSES
- C12Q2600/00—Oligonucleotides characterized by their use
- C12Q2600/106—Pharmacogenomics, i.e. genetic variability in individual responses to drugs and drug metabolism
-
- C—CHEMISTRY; METALLURGY
- C12—BIOCHEMISTRY; BEER; SPIRITS; WINE; VINEGAR; MICROBIOLOGY; ENZYMOLOGY; MUTATION OR GENETIC ENGINEERING
- C12Q—MEASURING OR TESTING PROCESSES INVOLVING ENZYMES, NUCLEIC ACIDS OR MICROORGANISMS; COMPOSITIONS OR TEST PAPERS THEREFOR; PROCESSES OF PREPARING SUCH COMPOSITIONS; CONDITION-RESPONSIVE CONTROL IN MICROBIOLOGICAL OR ENZYMOLOGICAL PROCESSES
- C12Q2600/00—Oligonucleotides characterized by their use
- C12Q2600/156—Polymorphic or mutational markers
-
- C—CHEMISTRY; METALLURGY
- C12—BIOCHEMISTRY; BEER; SPIRITS; WINE; VINEGAR; MICROBIOLOGY; ENZYMOLOGY; MUTATION OR GENETIC ENGINEERING
- C12Q—MEASURING OR TESTING PROCESSES INVOLVING ENZYMES, NUCLEIC ACIDS OR MICROORGANISMS; COMPOSITIONS OR TEST PAPERS THEREFOR; PROCESSES OF PREPARING SUCH COMPOSITIONS; CONDITION-RESPONSIVE CONTROL IN MICROBIOLOGICAL OR ENZYMOLOGICAL PROCESSES
- C12Q2600/00—Oligonucleotides characterized by their use
- C12Q2600/172—Haplotypes
Definitions
- Implantable cardioverter-defibrillator (ICD) therapy is effective in primary and secondary prevention for patients at high risk of Sudden Cardiac Arrest (SCA).
- ICDs can effectively terminate life threatening ventricular tachy-arrhythmias, such as ventricular tachycardia ("VT") and ventricular fibrillation ("VF").
- VT ventricular tachycardia
- VF ventricular fibrillation
- ICDs are indicated for various cardiac related ailments including myocardial infarction, ischemic heart disease, coronary artery disease, and heart failure. The use of these devices, however, remains low due in part to lack of reliable markers to select patients who are in need of these devices.
- SNP Single Nucleotide Polymorphism
- Polymorphisms affecting the coding region of a gene may influence the structure of the protein product, whereas others located within the regulatory sequences (also referred to as the promoter region) of a gene can influence the regulation of expression levels of the protein product. In some cases, these genetic variations may alter phenotypic expression following a change in physiological conditions, such as an ischemic event or the administration of a medication. Diagnostic data from a medical device such as an ICD can be used to obtain information of various diagnostic markers, including information about tachyarrhythmia episodes for the identification of possible genetic markers for SCA.
- Novel genetic markers and novel diagnostic kits and methods for assessing the risk of Sudden Cardiac Death (“SCD”) and Sudden Cardiac Arrest (“SCA”) and useful genetic markers thereof are provided. Methods of distinguishing patients having an increased susceptibility to SCD and SCA using these genetic markers, diagnostic kits and methods, including various DNA microarrays, through use of the genetic markers, alone or in combination with other markers, are also provided.
- the DNA microarrays can be in situ synthesized oligonucleotides, randomly or non-randomly assembled bead-based arrays, and mechanically assembled arrays of spotted material where the materials can be an oligonucleotide, a cDNA clone, or a Polymerase Chain Reaction (PCR) amplicon.
- a diagnostic kit for detecting one or more Sudden Cardiac Arrest (SCA)-associated polymorphisms in a genetic sample having at least one probe or a plurality of probes for assessing the presence of a Single Nucleotide Polymorphism (SNP) in any one of SEQ ID Nos. 1-858 is provided.
- the SNP is selected from the group of SEQ ID Nos. 850-855 and 858.
- a DNA microarray for detecting one or more Sudden Cardiac Arrest (SCA)-associated polymorphisms in a genetic sample made up of at least one probe for assessing the presence of a Single Nucleotide Polymorphism (SNP) in any one of SEQ ID Nos. 1-858, more preferably SEQ ID Nos. 850-855 and 858.
- SCA Sudden Cardiac Arrest
- the SNPs in the kits, compositions, and methods of the invention include any one or more selected from the group of SEQ ID Nos. 1-858.
- the SNPs are preferably selected from the group of SEQ ID Nos. 850-855 and 858. It is also understood that the group of SNPs may further include any of the following groups of SEQ ID Nos.: 850-851, 850-852, 850-853, 850-854, 850-855, 851-852, 851-853, 851-854, 851-855, 851-855 and 858, 852-853, 852-854, 852-855, 852-855 and 858, 853-854, 853-855, 853-855 and 858, 854-855, 854-855 and 858, 855 and 858.
- group of SNPs may further include any of the following groups of SEQ ID Nos.: 850 and 852; 850 and 853; 850 and 854; 850 and 855; 850 and 858; 851 and 853; 851 and 854; 851 and 855; 851 and 858; 852 and 854; 852 and 855; 852 and 858; 853 and 855; 853 and 858; 854 and 858.
- group of SNPs may further include any of the following groups of SEQ ID Nos.: 850 and 852-853; 850 and 853-854; 850 and 854-855; 850, 855 and 858; 851 and 853-854; 851 and 854-855; 851, 855 and 858; 852 and 854-855; 852, 855 and 858; 853, 855 and 858.
- group of SNPs may further include any of the following groups of SEQ ID Nos.: 850 and 852-854; 850 and 853-855; 850, 854-855 and 858; 851 and 853-855; 851, 854-855 and 858; 852, 854-855 and 858; 850 and 852-855; 850, 853-855 and 858; 851, 853-855 and 858; 850, 852-855 and 858.
- a system for detecting one or more Single Nucleotide Polymorphisms (SNPs) associated with SCA comprises a computer system having a computer processor programmed with an algorithm and one or more genetic databases in communication the programmed processor.
- the system imputes p-values for one or more known SNPs that are detected from one or more genetic samples obtained from a patient. Additionally or alternatively, the system imputes p-values for one or more known SNPs obtained from the one or more genetic databases.
- a p-value of less than a specified range indicates association with SCA.
- Novel genetic markers useful in assessing the risk of Sudden Cardiac Death (“SCD”) and Sudden Cardiac Arrest (“SCA”) are provided. Methods of distinguishing patients having an increased susceptibility to SCD, or SCA, through use of these markers, alone or in combination with other markers, are also provided. Further, methods of assessing the need for an ICD in a patient are taught. Specifically, an isolated nucleic acid molecule is contemplated that is useful to predict SCD, or SCA risk, and Single Nucleotide Polymorphisms (“SNPs”) selected from the group of SEQ ID Nos. 1-858 that can be used in the diagnosis, distinguishing, and detection thereof.
- SCD Sudden Cardiac Death
- SCA Sudden Cardiac Arrest
- isolated nucleotides to be used in the diagnostic kits and methods that are useful to predict SCD, or SCA risk, which are complementary to any one of SEQ ID Nos. 1-849 where the complement is between 3 to 101 nucleotides in length and overlaps a position 51 in any of the SEQ ID Nos. 1-849, which represents a SNP.
- the invention also contemplates isolated nucleotides useful to predict SCD or SCA risk, complementary to any one of SEQ ID Nos. 850-858, where the complement is between 3 to 101 nucleotides in length and overlaps at position 26 or 27 in any of SEQ ID Nos. 850-858, each of which represent a SNP.
- An amplified nucleotide is further contemplated for use in the diagnostic kits containing a SNP embodied in any one of SEQ ID Nos. 1-849, or a complement thereof, overlapping position 51, wherein the amplified nucleotide is between 3 and 101 base pairs in length.
- An amplified nucleotide is contemplated containing a SNP embodied in any one of SEQ ID Nos. 850-858, or a complement thereof, overlapping position 26 or 27, wherein the amplified nucleotide is between 3 and 101 base pairs in length.
- the lower limit of the number of nucleotides in the isolated nucleotides, and complements thereof can range from about 3 base pairs from position 50 to 52 in any one of SEQ ID Nos. 1-849 such that the SNP at position 51 is flanked on either the 5' and 3' side by a single base pair, to any number of base pairs flanking the 5' and 3' side of the SNP sufficient to adequately identify, or result in hybridization.
- the lower limit of the number of nucleotides in the isolated nucleotides, and complements thereof can range from about 3 base pairs from position 26 to 27 in any one of SEQ ID Nos.
- This lower limit of nucleotides can be from about 3 to 99 base pairs, the optimal length being determinable by a person of ordinary skill in the art.
- the isolated nucleotides or complements thereof can be from about 5 to 101 nucleotides in length, or from about 7 to 101, or from about 9 to 101, or from about 15 to 101, or from about 20 to 101, or from about 25 to 101, or from about 30 to 101, or from about 40 to 101, or from about 50 to 101, or from about 60 to 101, or from about 70 to 101, or from about 80 to 101, or from about 90 to 101, or from about 99 to 101 nucleotides, so long as position 51 in any of SEQ ID Nos. 1-849 and position 26 or 27 of SEQ ID Nos. 850-858 are overlapped.
- Preferred primer lengths can be from 25 to 35, 18 to 30, and 17 to 24 nucleotides.
- 3 ⁇ x ⁇ 101 and i y ⁇ Z - ⁇
- 1-849 is overlapped, or where positions 26 or 27 in any of SEQ ID Nos. 850-858 is overlapped.
- Some preferred primer and nucleotide lengths can be from 25 to 35, 18 to 30, and 17 to 24 nucleotides.
- Preferred primer lengths can be from 25 to 35, 18 to 30, and 17 to 24 nucleotides.
- a preferred length is 52 nucleotides with the polymorphism at position 27 for SEQ ID Nos. 850-858.
- An amplified nucleotide is further contemplated containing a SNP embodied in any one of SEQ ID Nos.
- n x ⁇ Z
- 3 ⁇ x ⁇ 101 and i y ⁇ Z -
- the isolated nucleic acid molecules of the invention may also consist of nucleotide sequences having a SNP that is selected as being associated with SCA using the system of the invention.
- a method of distinguishing patients having an increased or decreased susceptibility to SCD or SCA from patients who do not is provided, and a diagnostic kit or method thereof, where at least one SNP is detected at position 51 in any of SEQ ID Nos. 1-858 in a nucleic acid sample from the patients using any of the diagnostic kits described herein.
- the presence or absence of the SNP can be used to assess increased susceptibility to SCD or SCA.
- a method of determining SCA or SCD risk in a patient, and a diagnostic thereof, is contemplated which requires identifying one or more SNP at position 51 in any of SEQ ID Nos. 1-858 in a nucleic acid sample from the patient.
- a method for determining whether a patient needs an Implantable Cardio Defibrillator (“ICD”), and a diagnostic thereof is contemplated by identifying one or more SNPs at position 51 in any of SEQ ID Nos. 1-858 in a nucleic acid sample from the patient.
- ICD Implantable Cardio Defibrillator
- a method of detecting SCA or SCD-associated polymorphisms, and a diagnostic kit or method thereof, is further contemplated by extracting genetic material from a biological sample and screening the genetic material for at least one SNP in any of SEQ ID Nos. I-858, which is at position 51 using any of the diagnostic kits described herein.
- nucleotides present in one or several of the SNP markers in an individual's nucleic acid can be done by any method or technique capable of determining nucleotides present at a polymorphic site.
- nucleotides present in SNP markers can be determined from either nucleic acid strand or from both strands.
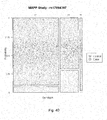
- Figure 1 depicts increase in the Number Needed to Treat (“NNT”) observed for the ICD therapy as devices are implanted in patients with lower risks.
- NNT Number Needed to Treat
- FIG. 2 is a flow chart of a MAPP sub-study design.
- MAPP was a preliminary genetic association study conducted to search for markers of SCA. The study involved collection of blood samples from 240 ICD patients who were then followed for more than 2 years for their arrhythmic outcomes. Resulting data was used for the search of statistical associations between life threatening events and SNPs.
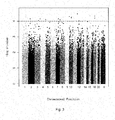
- FIG 3 is a statistical plot of Single Nucleotide Polymorphisms ("SNPs").
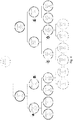
- Figure 4 is a decision tree based on a recursive partitioning algorithm.
- Figures 5A and 5B are genomic groupings of MAPP based on the recursive partitioning algorithm.
- IDEA-VF was a pilot study to demonstrate the feasibility of collecting blood samples from post Myocardial Infarction ("MI") patients to search for genetic markers that indicate the patient risk for SCA. Approximately 100 post-MI patients participated in the study and roughly half of them were ICD patients with life threatening arrhythmias and the rest were patients without ICDs.
- MI Myocardial Infarction
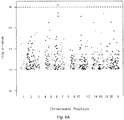
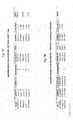
- Figure 7A represents a listing of SNPs potentially useful as genetic markers based on logical criteria (CART tree).
- Figure 7B represents a listing of SNPs potentially useful as genetic markers based on biological criteria (clustering in genome).
- Figure 7C represents a listing of SNPs potentially useful as genetic markers based on statistical criteria (min radius).
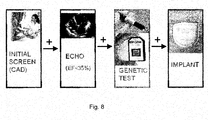
- Figure 8 shows graphically the operation of a genetic screen in conjunction with existing medical tests.
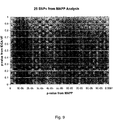
- Figure 9 shows 25 SNPs identified as SCD or SCA-associated SNPs having p-values less than 0.0001 from the analysis of the MAPP data.
- Figure 10 shows the SNPs identified by the MAPP and IDEA-VF studies associated with risk at SCD.
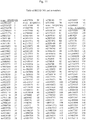
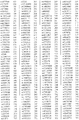
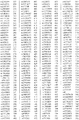
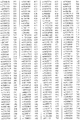
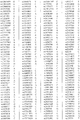
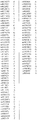
- Figure 11 is a list of rs numbers and corresponding SEQ ID Nos.
- Figure 12 is a schematic of a two-color analysis of SNPs using microarray technology.
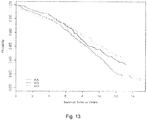
- Figure 13 is a Cox proportional hazards model adjusted for age, sex, and race/ethnicity for GPC5. Individuals homozygous for the protective allele (GG) are shown in green, heterozygotes (AG) in blue, and homozygous for the risk allele (AA) are in red.
- GG protective allele
- AG heterozygotes
- AA risk allele
- Figure 14 shows individuals classified by counting their number of QT-prolonging alleles in all ten identified markers (max score 20). Dosages for the QT-prolonging allele as calculated by MACH1 were added and then rounded to the nearest integer.
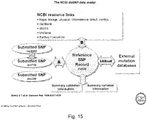
- Figure 15 depicts schematics showing the National Center for Biotechnology Information (NCBI) SNP database model.
- NCBI National Center for Biotechnology Information
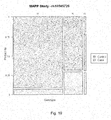
- Figure 16 is mosaic plot illustrating the probability of experiencing life threatening arrhythmia (LTA) as a function of allele specific inheritance of the SNP rs1439098.
- the horizontal width corresponds to the three genotypes and is proportional to their percentage distribution within the study.
- the vertical axis divides the case and control groups.
- Figure 17 is a mosaic plot illustrating the probability of experiencing LTA as a function of allele specific inheritance of the SNP rs4878412.
- the horizontal width corresponds to the three genotypes and is proportional to their percentage distribution within the study.
- the vertical axis divides the case and control groups.
- Figure 18 is a mosaic plot illustrating the probability of experiencing LTA as a function of allele specific inheritance of the SNP rs2839372.
- the horizontal width corresponds to the three genotypes and is proportional to their percentage distribution within the study.
- the vertical axis divides the case and control groups.
- Figure 19 is a mosaic plot illustrating the probability of experiencing LTA as a function of allele specific inheritance of the SNP rs10505726.
- the horizontal width corresponds to the three genotypes and is proportional to their percentage distribution within the study.
- the vertical axis divides the case and control groups.
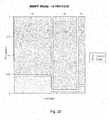
- Figure 20 is a mosaic plot illustrating the probability of experiencing LTA as a function of allele specific inheritance of the SNP rs10919336.
- the horizontal width corresponds to the three genotypes and is proportional to their percentage distribution within the study.
- the vertical axis divides the case and control groups.
- Figure 21 is a mosaic plot illustrating the probability of experiencing LTA as a function of allele specific inheritance of the SNP rs6828580.
- the horizontal width corresponds to the three genotypes and is proportional to their percentage distribution within the study.
- the vertical axis divides the case and control groups.
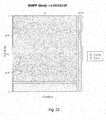
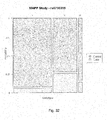
- Figure 22 is a mosaic plot illustrating the probability of experiencing LTA as a function of allele specific inheritance of the SNP rs16952330.
- the horizontal width corresponds to the three genotypes and is proportional to their percentage distribution within the study.
- the vertical axis divides the case and control groups.
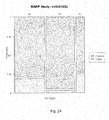
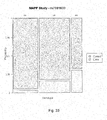
- Figure 23 is a mosaic plot illustrating the probability of experiencing LTA as a function of allele specific inheritance of the SNP rs2060117.
- the horizontal width corresponds to the three genotypes and is proportional to their percentage distribution within the study.
- the vertical axis divides the case and control groups.
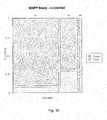
- Figure 24 is a mosaic plot illustrating the probability of experiencing LTA as a function of allele specific inheritance of the SNP rs9983892.
- the horizontal width corresponds to the three genotypes and is proportional to their percentage distribution within the study.
- the vertical axis divides the case and control groups.
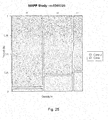
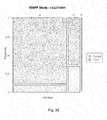
- Figure 25 is a mosaic plot illustrating the probability of experiencing LTA as a function of allele specific inheritance of the SNP rs 1500325.
- the horizontal width corresponds to the three genotypes and is proportional to their percentage distribution within the study.
- the vertical axis divides the case and control groups.
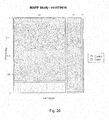
- Figure 26 is a mosaic plot illustrating the probability of experiencing LTA as a function of allele specific inheritance of the SNP rs1679414.
- the horizontal width corresponds to the three genotypes and is proportional to their percentage distribution within the study.
- the vertical axis divides the case and control groups.
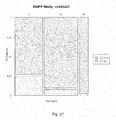
- Figure 27 is a mosaic plot illustrating the probability of experiencing LTA as a function of allele specific inheritance of the SNP rs486427.
- the horizontal width corresponds to the three genotypes and is proportional to their percentage distribution within the study.
- the vertical axis divides the case and control groups.
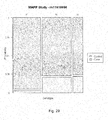
- Figure 28 is a mosaic plot illustrating the probability of experiencing LTA as a function of allele specific inheritance of the SNP rs6480311.
- the horizontal width corresponds to the three genotypes and is proportional to their percentage distribution within the study.
- the vertical axis divides the case and control groups.
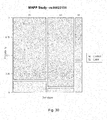
- Figure 29 is a mosaic plot illustrating the probability of experiencing LTA as a function of allele specific inheritance of the SNP rs11610690.
- the horizontal width corresponds to the three genotypes and is proportional to their percentage distribution within the study.
- the vertical axis divides the case and control groups.
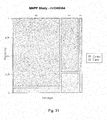
- Figure 30 is a mosaic plot illustrating the probability of experiencing LTA as a function of allele specific inheritance of the SNP rs10823151.
- the horizontal width corresponds to the three genotypes and is proportional to their percentage distribution within the study.
- the vertical axis divides the case and control groups.
- Figure 31 is a mosaic plot illustrating the probability of experiencing LTA as a function of allele specific inheritance of the SNP rs1346964.
- the horizontal width corresponds to the three genotypes and is proportional to their percentage distribution within the study.
- the vertical axis divides the case and control groups.
- Figure 32 is a mosaic plot illustrating the probability of experiencing LTA as a function of allele specific inheritance of the SNP rs6790359.
- the horizontal width corresponds to the three genotypes and is proportional to their percentage distribution within the study.
- the vertical axis divides the case and control groups.
- Figure 33 is a mosaic plot illustrating the probability of experiencing LTA as a function of allele specific inheritance of the SNP rs7591633.
- the horizontal width corresponds to the three genotypes and is proportional to their percentage distribution within the study.
- the vertical axis divides the case and control groups.
- Figure 34 is a mosaic plot illustrating the probability of experiencing LTA as a function of allele specific inheritance of the SNP rs10487115.
- the horizontal width corresponds to the three genotypes and is proportional to their percentage distribution within the study.
- the vertical axis divides the case and control groups.
- Figure 35 is a mosaic plot illustrating the probability of experiencing LTA as a function of allele specific inheritance of the SNP rs2240887.
- the horizontal width corresponds to the three genotypes and is proportional to their percentage distribution within the study.
- the vertical axis divides the case and control groups.
- Figure 36 is a mosaic plot illustrating the probability of experiencing LTA as a function of allele specific inheritance of the SNP rs248670.
- the horizontal width corresponds to the three genotypes and is proportional to their percentage distribution within the study.
- the vertical axis divides the case and control groups.
- Figure 37 is a mosaic plot illustrating the probability of experiencing LTA as a function of allele specific inheritance of the SNP rs4691391.
- the horizontal width corresponds to the three genotypes and is proportional to their percentage distribution within the study.
- the vertical axis divides the case and control groups.
- Figure 38 is a mosaic plot illustrating the probability of experiencing LTA as a function of allele specific inheritance of the SNP rs2270801.
- the horizontal width corresponds to the three genotypes and is proportional to their percentage distribution within the study.
- the vertical axis divides the case and control groups.
- Figure 39 is a mosaic plot illustrating the probability of experiencing LTA as a function of allele specific inheritance of the SNP rs12891099.
- the horizontal width corresponds to the three genotypes and is proportional to their percentage distribution within the study.
- the vertical axis divides the case and control groups.
- Figure 40 is a mosaic plot illustrating the probability of experiencing LTA as a function of allele specific inheritance of the SNP rs17694397.
- the horizontal width corresponds to the three genotypes and is proportional to their percentage distribution within the study.
- the vertical axis divides the case and control groups.
- Figure 41 is a list of rs numbers and corresponding risk alleles.
- the invention relates to diagnostic kits and methods using a nucleic acid molecule that can predict Sudden Cardiac Death ("SCA”) or Sudden Cardiac Arrest (“SCA”) risk having a single nucleotide polymorphisms ("SNPs") selected from the group of SEQ ID Nos. 1-858 that can be used in the diagnosis, distinguishing, and detection thereof.
- SCA Sudden Cardiac Death
- SCA Sudden Cardiac Arrest
- the invention further relates to an isolated nucleic acid molecule or molecules useful to predict SCD or SCA risk and SNPs selected from SEQ ID Nos. 1-858 that can be used in the diagnosis, distinguishing, and detecting thereof.
- phrases “consisting essentially of” includes any elements listed after the phrase and is limited to other elements that do not interfere with or contribute to the activity or action specified in the disclosure for the listed elements. Thus, the phrase indicates that the listed elements are required or mandatory but that other elements are optional and may or may not be present, depending upon whether or not they affect the activity or action of the listed elements.
- isolated refers to nucleic acid, or a fragment thereof, that has been removed from its natural cellular environment.
- nucleic acid refers to a deoxyribonucleotide or ribonucleotide polymer in either single- or double-stranded form, and unless otherwise limited, encompasses known analogues of natural nucleotides that hybridize to nucleic acids in a manner similar to naturally occurring nucleotides.
- nucleic acid encompasses the terms “oligonucleotide” and “polynucleotide.”
- amplified polynucleotide or “amplified nucleotide” as used herein refers to polynucleotides or nucleotides that are copies of a portion of a particular polynucleotide sequence and/or its complementary sequence, which correspond to a template polynucleotide sequence and its complementary sequence.
- An "amplified polynucleotide” or “amplified nucleotide” according to the present invention may be DNA or RNA, and it may be double-stranded or single-stranded.
- Synthesis and “amplification” as used herein are used interchangeably to refer to a reaction for generating a copy of a particular polynucleotide sequence or increasing in copy number or amount of a particular polynucleotide sequence. It may be accomplished, without limitation, by the in vitro methods of polymerase chain reaction (PCR), ligase chain reaction (LCR), polynucleotide-specific based amplification (NSBA), or any other method known in the art.
- PCR polymerase chain reaction
- LCR ligase chain reaction
- NBA polynucleotide-specific based amplification
- polynucleotide amplification may be a process using a polymerase and a pair of oligonucleotide primers for producing any particular polynucleotide sequence, i.e., the target polynucleotide sequence or target polynucleotide, in an amount which is greater than that initially present.
- primer pair means two oligonucleotides designed to flank a region of a polynucleotide to be amplified.
- an implantable cardioverter-defibrillator is a small battery-powered electrical impulse generator implanted in patients who are at risk of sudden cardiac death due to ventricular fibrillation and/or ventricular tachycardia.
- the device is programmed to detect cardiac arrhythmia and correct it by delivering a jolt of electricity.
- the ability to revert ventricular fibrillation has been extended to include both atrial and ventricular arrhythmias as well as the ability to perform biventricular pacing in patients with congestive heart failure or bradycardia.
- Single nucleotide polymorphisms refers to a variation in the sequence of a gene in the genome of a population that arises as the result of a single base change, such as an insertion, deletion or, a change in a single base.
- a locus is the site at which divergence occurs.
- rs number refers to a SNP database record archived and curated on dbSNP, which is a database for Single Polymorphism Polynucleotides and Other Classes of Minor Genetic Variations.
- the dbSNP database maintains two types of records: ss records of each original submission and rs records.
- the ss records may represent variations in submissions for the same genome location.
- the rs numbers represent a unique record for a SNP and are constructed and periodically reconstructed based on subsequent submissions and Builds. In each new build cycle, the set of new data entering each build typically includes all submissions received since the close of data in the previous build.
- refSNP (rs) numbers might have been merged if they are found to map the same location at a later build, however, it is understood that a particular rs number with a Build number provides the requisite detail so that one of ordinary skill in the art will be able to make and use the invention as contemplated herein. Hence, one of ordinary skill will generally be able to determine a particular SNP by reviewing the entries for an rs number and related ss numbers.
- Data submitted to the NCBI database are clustered and provide a non-redundant set of variations for each organism in the database. The clusters are maintained as rs numbers in the database in parallel to the underlying submitted data.
- Reference Sequences are a curated, non-redundant set of records for mRNAs, proteins, contigs, and gene regions constructed from a GenBank exemplar for that protein or sequence.
- accession numbers under "Submitter-Referenced Accessions” is annotation that is included with a submitted SNP (ss) when it is submitted to dbSNP as shown in Figure 15 ( Sherry et al., "dbSNP— Database for Single Polymorphism Polynucleotides and Other Classes of Minor Genetic Variation," GENOME RES. 1999; 9: 677-679 ).
- dbSNP Database for Single Polymorphism Polynucleotides and Other Classes of Minor Genetic Variation
- the term "MACH” or “MACH 1.0” refers to a haplotyper program using a Hidden Markov Model (HMM) that can resolve long haplotypes or infer missing genotypes in samples of unrelated individuals as known within the art.
- HMM Hidden Markov Model
- Hidden Markov Model describes a statistical method for determining a state, which has not been observed or "hidden.”
- the HMM is generally based on a Markov chain, which describes a series of observations in which the probability of an observation depends on a number of previous observations. For a HMM, the Markov process itself cannot be observed, but only the steps in the sequence.
- Probes or “primers” refer to single-stranded nucleic acid sequences that are complementary to a desired target nucleic acid.
- the 5' and 3' regions flanking the target complement sequence reversibly interact by means of either complementary nucleic acid sequences or by attached members of another affinity pair.
- Hybridization can occur in a base-specific manner where the primer or probe sequence is not required to be perfectly complementary to all of the sequences of a template. Hence, non-complementary bases or modified bases can be interspersed into the primer or probe, provided that base substitutions do not inhibit hybridization.
- the nucleic acid template may also include "nonspecific priming sequences" or “nonspecific sequences" to which the primers or probes have varying degrees of complementarity.
- primers or primer comprises from about 3 to 101 nucleotides.
- the following formula is provided in support of every possible range within 3 to 101 nucleotides.
- the formula is intended to provide express support for ranges such as 3 to 4 nucleotides in length, or from about 3 to 5, 3 to 6, 3 to 7, 3 to 8, ..., 3 to 99, 3 to 100, 3 to 101, 4 to 5, 4 to 6, etc., with no limitation on the permutations of various ranges that can be selected from the range of about 3 to 101 nucleotides.
- 3 ⁇ x ⁇ 101 and i y ⁇ Z -
- x is the integer 3
- the lower bound (n) is 3
- the upper bound (n + i) ranges from 3 to 101 where i ranges from 0 to 98, so that the following ranges of nucleotides are provided: 3 to 3, 3 to 4, 3 to 5, 3 to 6, ... 3 to 101.
- x is the integer 4
- the lower bound (n) is 4, and the upper bound (n + i) ranges from 4 to 101 for i equals 0 to 97, so that the following ranges of nucleotides are provided: 4 to 4, 4 to 5, 4 to 6, 4 to 7, ... 4 to 101.
- x is the integer 5
- the lower bound (n) is 5
- the upper bound (n + i) ranges from 5 to 101 for i equals 0 to 96, so that the following ranges of nucleotides are provided: 5 to 5, 5 to 6, 5 to 7, 5 to 8, ... 5 to 101, and so forth for each x.
- x is the integer 100
- the lower bound (n) is 100
- the upper bound (n + i) ranges from 100 to 101 for i equals 0 to 1, so that the following ranges of nucleotides are provided: 100 to 100 and 100 to 101.
- the ranges can be chosen from group A and B where for A: the probe or primer is greater than 5, greater than 10, greater than 15, greater than 20, greater than 25, greater than 30, greater than 40, greater than 50, greater than 60, greater than 70, greater than 80, greater than 90 and greater than 100 base pairs in length.
- the probe or primer is less than 102, less than 95, less than 90, less than 85, less than 80, less than 75, less than 70, less than 65, less than 60, less than 55, less than 50, less than 45, less than 40, less than 35, less than 30, less than 25, less than 20, less than 15, or less than 10 base pairs in length.
- the probe or primer is at least 70% identical to the contiguous nucleic acid sequence or to the complement of the contiguous nucleotide sequence, for example, at least 80% identical, at least 90°/a identical, at least 95% identical, and is capable of selectively hybridizing to the contiguous nucleic acid sequence or to the complement of the contiguous nucleotide sequence.
- Preferred primer lengths include 25 to 35, 18 to 30, and 17 to 24 nucleotides.
- the probe or primer further comprises a label, e.g., radioisotope, fluorescent compound, enzyme, or enzyme co-factor.
- One primer is complementary to nucleotides present on the sense strand at one end of a polynucleotide to be amplified and another primer is complementary to nucleotides present on the antisense strand at the other end of the polynucleotide to be amplified.
- the polynucleotide to be amplified can be referred to as the template polynucleotide.
- the nucleotide of a polynucleotide to which a primer is complementary is referred to as a target sequence.
- a primer can have at least about 15 nucleotides, preferably, at least about 20 nucleotides, most preferably, at least about 25 nucleotides.
- a primer has at least about 95% sequence identity, preferably at least about 97% sequence identity, most preferably, about 100% sequence identity with the target sequence to which the primer hybridizes.
- the conditions for amplifying a polynucleotide by PCR vary depending on the nucleotide sequence of primers used, and methods for determining such conditions are routine in the art.
- primer length is taken into account in the present invention.
- T m melting temperature
- specificity is taken into account in the present invention.
- Primer specificity is related to primer length and the final 8 to 10 bases of the 3" end sequence where a primer length of 18 to 30 bases is one possible embodiment.
- T m is closely correlated to primer length, GC content and primer base composition.
- One preferred primer T m is in the range of 50 to 65°C with GC content in the range of 40 to 60% for standard primer pairs.
- Dieffenbatch CW Lowe TMJ, Dveksler GS, General concepts for PCR primer design, PCR PRIMER, A LABORATORY MANUAL, Edited by: Dieffenbatch CW, Dveksler GS. New York , Cold Spring Harbor Laboratory Press; 1995:133-155 .
- an optimal primer length varies depending on different types of primers.
- SNP genotyping primers may require a longer primer length of 25 to 35 bases to enhance their specificity, and thus the corresponding T m might be higher than 65°C.
- a suitable T m can be obtained by setting a broader GC content range (20 to 80%).
- the probes or primers can also be variously referred to as "antisense nucleic acid molecules," “polynucleotides,” or “oligonucleotides” and can be constructed using chemical synthesis and enzymatic ligation reactions known in the art.
- an antisense nucleic acid molecule e.g., an antisense oligonucleotide
- an antisense nucleic acid molecule can be chemically synthesized using naturally occurring nucleotides or variously modified nucleotides designed to increase the biological stability of the molecules or to increase the physical stability of the duplex formed between the antisense and sense nucleic acids.
- the primers or probes can further be used in "Polymerase Chain Reaction” (PCR), a well known amplification and analytical technique that generally uses two “primers” of short, single-stranded DNA synthesized to correspond to the beginning of a DNA stretch to be copied, and a polymerase enzyme that moves along the segment of DNA to be copied that assembles the DNA copy.
- PCR Polymerase Chain Reaction
- the term "genetic material” refers to a nucleic acid sequence that is sought to be obtained from any number of sources, including without limitation, whole blood, a tissue biopsy, lymph, bone marrow, hair, skin, saliva, buccal swabs, purified samples generally, cultured cells, and lysed cells, and can comprise any number of different compositional components (e.g., DNA, RNA, tRNA, siRNA, mRNA, or various non-coding RNAs).
- the nucleic acid can be isolated from samples using any of a variety of procedures known in the art. In general, the target nucleic acid will be single stranded, though in some embodiments the nucleic acid can be double stranded, and a single strand can result from denaturation.
- nucleic acid sequence can be methylated, non-methylated, or both, and can contain any number of modifications. Further, the nucleic acid sequence can refer to amplification products as well as to the native sequences.
- screening within the phrase “screening for a genetic sample” means any testing procedure known to those of ordinary skill in the art to determine the genetic make-up of a genetic sample.
- hybridization is defined as the ability of two nucleotide sequences to bind with each other based on a degree of complementarity of the two nucleotide sequences, which in turn is based on the fraction of matched complementary nucleotide pairs.
- the more nucleotides in a given sequence that are complementary to another sequence the more stringent the conditions can be for hybridization and the more specific will be the binding of the two sequences.
- Increased stringency is achieved by elevating the temperature, increasing the ratio of co-solvents, lowering the salt concentration, and the like.
- Stringent conditions are conditions under which a probe can hybridize to its target subsequence, but to no other sequences. Stringent conditions are sequence-dependent and are different in different circumstances.
- stringent conditions are selected to be about 5° C. lower than the thermal melting point (Tm) for the specific sequence at a defined ionic strength and pH.
- Tm is the temperature (under defined ionic strength, pH, and nucleic acid concentration) at which 50% of the probes complementary to the target sequence hybridize to the target sequence at equilibrium.
- stringent conditions include a salt concentration of at least about 0.01 to 1.0 M Na ion concentration (or other salts) at pH 7.0 to 8.3 and the temperature is at least about 30° C. for short probes (e.g., 10 to 50 nucleotides).
- Stringent conditions can also be achieved with the addition of destabilizing agents such as formamide or tetraalkyl ammonium salts.
- destabilizing agents such as formamide or tetraalkyl ammonium salts.
- SxSSPE 750 mM NaCl, 50 mM Na Phosphate, 5 mM EDTA, pH 7.4
- a temperature of 25-30° C. are suitable for allele-specific probe hybridizations.
- Allele Specific Oligomer refers to a primary oligonucleotide having a target specific portion and a target-identifying portion, which can query the identity of an allele at a SNP locus.
- the target specific portion of the ASO of a primary group can hybridize adjacent to the target specific portion and can be made by methods well known to those of ordinary skill.
- the ordinary meaning of the term "allele” is one of two or more alternate forms of a gene occupying the same locus in a particular chromosome or linkage structure and differing from other alleles of the locus at one or more mutational sites. ( Rieger et al., GLOSSARY OF GENETICS, 5th Ed., Springer-herlag, Berlin 1991; 16 ).
- allele is one of two or more alternate forms of a gene occupying the same locus in a particular chromosome or linkage structure and differing from other alleles of the locus at one or more mutational sites.
- Bi-allelic and multi-allelic refers to two, or more than two alternate forms of a SNP, respectively, occupying the same locus in a particular chromosome or linkage structure and differing from other alleles of the locus at a polymorphic site.
- assessing the presence of said one or more SNPs in a genetic sample encompasses any known process that can be implemented to determine if a polymorphism is present in a genetic sample.
- amplified DNA obtained from a genetic sample can be labeled before it is hybridized to a probe on a solid support.
- the amplified DNA is hybridized to probes which are immobilized to known locations on a solid support, e.g., in an array, microarray, high density array, beads or microtiter dish.
- the presence of labeled amplified DNA products hybridized to the solid support indicates that the nucleic acid sample contains at the polymorphic locus a nucleotide which is indicative of the polymorphism.
- the quantities of the label at distinct locations on the solid support can be compared, and the genotype can be determined for the sample from which the DNA was obtained.
- Two or more pairs of primers can be used for determining the genotype of a sample. Each pair of primers specifically amplifies a different allele possible at a given SNP.
- the hybridized nucleic acids can be detected, e.g., by detecting one or more labels attached to the target nucleic acids.
- the labels can be incorporated by any convenient means. For example, a label can be incorporated by labeling the amplified DNA product using a terminal transferase and a fluorescently labeled nucleotide.
- Useful detectable labels include labels that can be detected by spectroscopic, photochemical, biochemical, immunochemical, and electrical, optical, or chemical means. Radioactive labels can be detected using photographic film or scintillation counters. Fluorescent labels can be detected using a photodetector.
- detecting refers to any suitable method for determining the identity of a nucleotide at a position including, but not limited to, sequencing, allele specific hybridization, primer specific extension, oligonucleotide ligation assay, restriction enzyme site analysis and single- stranded conformation polymorphism analysis.
- antisense DNA In double-stranded DNA, only one strand codes for the RNA that is translated into protein. This DNA strand is referred to as the "antisense” strand. The strand that does not code for RNA is called the “sense” strand. Another way of defining antisense DNA is that it is the strand of DNA that carries the information necessary to make proteins by binding to a corresponding messenger RNA (mRNA). Although these strands are exact mirror images of one another, only the antisense strand contains the information for making proteins.
- mRNA messenger RNA
- Antisense compounds are oligomeric compounds that are at least partially complementary to a target nucleic acid molecule to which they hybridize.
- an antisense compound modulates (increases or decreases) expression of a target nucleic acid.
- Antisense compounds include, but are not limited to, compounds that are oligonucleotides, oligonucleosides, oligonucleotide analogs, oligonucleotide mimetics, and chimeric combinations of these. Consequently, while all antisense compounds are oligomeric compounds, not all oligomeric compounds are antisense compounds.
- Mutations are changes in a genomic sequence.
- naturally occurring mutants refers to any preexisting, not artificially induced change in a genomic sequence.
- Mutations, mutant sequences, or, simply, “mutants” include additions, deletions and substitutions or one or more alleles.
- the optimal probe length, position, and number of probes for detection of a single nucleotide polymorphism or for hybridization may vary depending on various hybridization conditions.
- the phrase "sufficient to identify the SNP or result in a hybridization” is understood to encompass design and use of probes such that there is sufficient specificity and sensitivity to detect and identify a SNP sequence or result in a hybridization. Hybridization is described in further detail below.
- cDNA refers to DNA that is synthesized to be complementary to a mRNA molecule, and that represents a portion of the DNA that specifies a protein (is translated). If the sequence of the cDNA is known, by complementarity, the sequence of the DNA is known.
- selective hybridizing refers to the ability of a probe used in the invention to hybridize, with a target nucleotide sequence with specificity.
- treatable means that a patient is potentially or would be expected to be responsive to a particular form of treatment.
- the "p-value" is the probability of obtaining a test statistic at least as extreme as the one that was actually observed, assuming that the null hypothesis is true. The lower the p-value, the less likely the result is if the null hypothesis is true, and consequently the more "significant” the result is, in the sense of statistical significance.
- to impute a p-value to one or more SNPs outside of a test sample means to mathematically attribute a p-value to one or more known and documented SNPs, using the methods described herein, that are not present on the test microchips used in a specific experiment or study. Using the p-values obtained from the tested microchips, p-values may be mathematically imputed to other known SNPs using algorithms such as those described herein.
- indicaciones it is meant that the statistical analysis suggests, by, for example, a p-value, that a SNP may be linked to or associated with a particular medical disease, condition, or disorder.
- isolated refers to a nucleic acid that is not immediately contiguous with both of the sequences with which it is immediately contiguous in the naturally occurring genome of the organism from which it is derived.
- isolated also includes any non-naturally occurring nucleic acid because such engineered or artificial nucleic acid molecules do not have immediately contiguous sequences in a naturally occurring genome.
- the DNA microarrays generally have probes that are supported by a substrate so that a target sample is bound or hybridized with the probes.
- the microarray surface is contacted with one or more target samples under conditions that promote specific, high-affinity binding of the target to one or more of the probes as shown in Fig. 12 .
- a sample solution containing the target sample typically contains radioactively, chemoluminescently or fluorescently labeled molecules that are detectable.
- the hybridized targets and probes can also be detected by voltage, current, or electronic means known in the art.
- a plurality of microarrays may be formed on a larger array substrate.
- the substrate can be diced into a plurality of individual microarray dies in order to optimize use of the substrate.
- Possible substrate materials include siliceous compositions where a siliceous substrate is generally defined as any material largely comprised of silicon dioxide. Natural or synthetic assemblies can also be employed.
- the substrate can be hydrophobic or hydrophilic or capable of being rendered hydrophobic or hydrophilic and includes inorganic powders such as silica, magnesium sulfate, and alumina; natural polymeric materials, particularly cellulosic materials and materials derived from cellulose, such as fiber-containing papers, e.g., filter paper, chromatographic paper, etc .; synthetic or modified naturally occurring polymers, such as nitrocellulose, cellulose acetate, poly (vinyl chloride), polyacrylamide, cross linked dextran, agarose, polyacrylate, polyethylene, polypropylene, poly (4-methylbutene), polystyrene, polymethacrylate, poly(ethylene terephthalate), nylon, poly(vinyl butyrate), etc .; either used by themselves or in conjunction with other materials; glass available as Bioglass, ceramics, metals, and the like.
- inorganic powders such as silica, magnesium sulfate, and alumina
- natural polymeric materials particularly cellulos
- the surface of the substrate is then chemically prepared or derivatized to enable or facilitate the attachment of the molecular species to the surface of the array substrate.
- Surface derivatizations can differ for immobilization of prepared biological material, such as cDNA, and in situ synthesis of the biological material on the microarray substrate.
- Surface treatment or derivatization techniques are well known in the art.
- the surface of the substrate can have any number of shapes, such as strip, plate, disk, rod, particle, including bead, and the like.
- one technique that has been used is derivatization with bifunctional silanes, i.e., silanes having a first functional group enabling covalent binding to the surface and a second functional group that can impart the desired chemical and/or physical modifications to the surface to covalently or non-covalently attach ligands and/or the polymers or monomers for the biological probe array.
- Adsorbed polymer surfaces are used on siliceous substrates for attaching nucleic acids, for example cDNA, to the substrate surface. Since a microarray die may be quite small and difficult to handle for processing, an individual microarray die can also be packaged for further handling and processing. For example, the microarray may be processed by subjecting the microarray to a hybridization assay while retained in a package.
- oligonucleotide for use in a microarray.
- In situ synthesis of oligonucleotide or polynucleotide probes on a substrate is performed in accordance with well-known chemical processes, such as sequential addition of nucleotide phosphoramidites to surface-linked hydroxyl groups.
- Indirect synthesis may also be performed in accordance with biosynthetic techniques such as Polymerase Chain Reaction ("PCR").
- PCR Polymerase Chain Reaction
- Other methods of oligonucleotide synthesis include phosphotriester and phosphodiester methods and synthesis on a support, as well as phosphoramidate techniques.
- Chemical synthesis via a photolithographic method of spatially addressable arrays of oligonucleotides bound to a substrate made of glass can also be employed.
- the probes or oligonucleotides, themselves, can be obtained by biological synthesis or by chemical synthesis.
- Chemical synthesis provides a convenient way of incorporating low molecular weight compounds and/or modified bases during specific synthesis steps. Furthermore, chemical synthesis is very flexible in the choice of length and region of target polynucleotides binding sequence.
- the oligonucleotide can be synthesized by standard methods such as those used in commercial automated nucleic acid synthesizers.
- Immobilization of probes or oligonucleotides on a substrate or surface may be accomplished by well-known techniques.
- One type of technology makes use of a bead-array of randomly or non-randomly arranged beads.
- a specific oligonucleotide or probe sequence is assigned to each bead type, which is replicated any number of times on an array.
- a series of decoding hybridizations is then used to identify each bead on the array.
- the concept of these assays is very similar to that of DNA chip based assays. However, oligonucleotides are attached to small microspheres rather than to a fixed surface of DNA chips.
- Bead-based systems can be combined with most of the allele-discrimination chemistry used in DNA chip based array assays, such as single-base extension and oligonucleotide ligation assays.
- the bead-based format has flexibility for multiplexing and SNP combination.
- the identity of each bead needs is determined where that information is combined with the genotype signal from the bead to assign a "genotype call" to each SNP and individual.
- One bead-based genotyping technology uses fluorescently coded microspheres developed by Luminex. Fulton R, McDade R, Smith P, Kienker L, Keltman J. J. Advanced multiplexed analysis with the FlowMetrix system, CLIN. CHEM. 1997; 43: 1749-1756 . These beads are coated with two different dyes (red and orange), and can be identified and separated using flow cytometry, based on the amount of these two dyes on the surface. By having a hundred types of microspheres with a different red:orange signal ratio, a hundred-plex detection reaction can be performed in a single tube.
- microspheres are distinguished using a flow fluorimeter where a genotyping signal (green) from each group of microspheres is measured separately.
- This bead-based platform is useful in allele-specific hybridization, single-base extension, allele-specific primer extension, and oligonucleotide ligation assay.
- microspheres are captured in solid wells created from optical fibers. Michael K. , Taylor L., Schultz S, Walt D. Randomly ordered addressable high-density optical sensor arrays, ANAL. CHEM.., 1998; 70: 1242-1248 ; Steemers F.
- each well is similar to that of the spheres, allowing only a single sphere to fit in one well. Once the microspheres are set in these wells, all of the spheres can be treated like a high-density microarray. The high degree of replication in DNA microarray technology makes robust measurements for each bead type possible. Bead-array technology is particularly useful in SNP genotyping.
- Software used to process raw data from a DNA microarray or chip is well known in the art and employs various known methods for image processing, background correction and normalization. Many available public and proprietary software packages are available for such processing whereby a quality assessment of the raw data can be carried out, and the data then summarized and stored in a format which can be used by other software to perform additional analyses.
- the diagnostic kit, microarray or probes or nucleotides immobilized on a substrate or surface, a bead-based platform, and any of the methods for detecting an SNP described above can contain or be provided, or be performed with a limited number of probes.
- Probes include, but are not limited to, nucleotides that hybridize with the locus of a SNP, allele specific oligomers (OAS) or primers that bind to a flanking region relative to the locus of the SNP to assist in determining the identity of the SNP by Sanger sequencing or similar technique.
- OAS allele specific oligomers
- a plurality of probes can be provided on a common or shared substrate or as part of the same kit.
- the limited number of probes is from about 1 to about 50 probes. In other embodiments, the limited number of probes is less than about 10 probes, or any of less than about 100 probes, less than about 50 probes, less than about 30 probes or less than about 10 probes. In some embodiments, the limited number of probes is any of from about 2 to about 100 probes, from about 2 to about 50 probes, from 2 to about 30 probes, and from 2 to about 6 probes.
- the limited number of probes is from about 1 to about 1000 probes. In other embodiments, the limited number of probes is less than about 1000 probes, or any of less than about 900 probes, less than about 700 probes, less than about 500 probes or less than about 30 probes. In some embodiments, the limited number of probes is any selected from about 2 to about 1000 probes, from about 2 to about 900 probes, from 2 to about 500 probes, and from 2 to about 30 probes.
- the limited number of probes in the diagnostic kit or microarray is selected from probes for detecting an SNP at position number 51 in any of SEQ ID Nos. 1-849 or at position 26 or 27 in any of SEQ ID Nos. 850-858. In certain embodiments, at least about 90% of the limited number of probes in the diagnostic kit or microarray is selected from probes for detecting an SNP at position number 51 in any of SEQ ID Nos. 1-849 or at position number 26 or 27 in SEQ ID Nos. 850-858. In certain embodiments, at least about 80% of the limited number of probes in the diagnostic kit or microarray is selected from probes for detecting an SNP at position number 51 in any of SEQ ID Nos.
- the limited number of probes in the diagnostic kit or microarray includes at least one probe for determining an SNP at position 51 in any of SEQ ID Nos. 835, 832, 844, 846, 838, 848, 829, 842, 827, 828, 824, 836, 840, 845, 826, 837, 841, 843, 117, 535, 823, 834, 830, 847, and 849.
- the limited number of probes in the diagnostic kit or microarray contains probes for detecting an SNP at position 51 in all of SEQ ID Nos.
- the limited number of probes in the diagnostic kit or microarray includes at least one probe for determining an SNP at position 26 or 27 in any of SEQ ID Nos. 850-855 and 858. In certain embodiments, the limited number of probes in the diagnostic kit or microarray contains probes for detecting an SNP at position 26 or 27 in all of SEQ ID Nos. 850-855 and 858.
- the limited number of probes in the diagnostic kit or microarray includes at least one probe for determining an SNP at position 51 in any of SEQ ID Nos. 844, 831, 825, 839 and 833. In certain embodiments, the limited number of probes in the diagnostic kit or microarray contains probes for detecting an SNP at position 51 in all of SEQ ID Nos. 844, 831, 825, 839 and 833.
- the limited number of probes in the diagnostic kit or microarray includes at least one probe for determining an SNP at position 51 in any of SEQ ID Nos. 535, 505 and 515. In certain embodiments, the limited number of probes in the diagnostic kit or microarray contains probes for detecting an SNP at position 51 in all of SEQ ID Nos. 535, 505 and 515.
- any individual or genetic sample can be heterozygous or homozygous at any particular genomic locus corresponding with an SNP at position 51 in any of SEQ ID Nos. 1-849 or at position 26 or 27 in any of SEQ ID Nos. 850-858 or any subset thereof.
- the probes in the diagnostic kits or DNA microarrays described herein including methods for determining the presence of SNPs can determine the heterozygous or homozygous status of an individual or genetic sample by assessing SNPs at the same locus on homologous chromosomes. That is, probes to determine and identify different alleles at position 51 in any of SEQ ID Nos. 1-849 or at position 26 or 27 in any of SEQ ID Nos. 850-858 can be present in the diagnostic kit or microarray, where more than one probe is provided for determining the presence of bi-allelic or multi-allelic SNPs in any one of SEQ ID Nos. 1-858 or any subset thereof.
- SNP Single Nucleotide Polymorphism
- SNPs can undergo linkage disequilibrium, which refers to the tendency of specific alleles at different genomic locations to occur together more frequently than would be expected by random change. Alleles at given loci are said to be in complete equilibrium if the frequency of any particular set of alleles (or haplotype) is the product of their individual population frequencies. Several statistical measures can be used to quantify this relationship. ( Devlin and Risch, A comparison of linkage disequilibrium measures for fine-scale mapping, Genomics, 1995 Sep. 20; 29(2): 311-22 ).
- a more common nucleotide is known as the major allele and the less common nucleotide is known as the minor allele.
- An allele found to have a higher than expected prevalence among individuals positive for a given outcome is considered a risk allele for that outcome.
- An allele found to have a lower than expected prevalence among individuals positive for an outcome is considered a protective allele for that outcome.
- the human genome harbors 10 million "common" SNPs minor alleles indicative of heart disease are often only shared by as little as one percent of a population.
- SNPs found by one or a combination of these methods have been found useful as genetic markers for risk-stratification of SCD or SCA in individuals.
- Genome-wide association studies are used to identify disease susceptibility genes for common diseases and involve scanning thousands of samples, either as case-control cohorts or in family trios, utilizing hundreds of thousands of SNP markers located throughout the human genome. Algorithms can then be applied that compare the frequencies of single SNP alleles, genotypes, or multi-marker haplotypes between disease and control cohorts. Regions (loci) with statistically significant differences in allele or genotype frequencies between cases and controls, pointing to their role in disease, are then analyzed. For example, following the completion of a whole genome analysis of patient samples, SNPs for use as clinical markers can be identified by any, or combination, of the following three methods:
- Genetic markers are non-invasive, cost-effective and conducive to mass screening of individuals.
- the SNPs identified herein can be effectively used alone or in combination with other SNPs as well as with other clinical markers for risk-stratification/assessment and diagnosis of SCD, or SCA. Further, these genetic markers in combination with other clinical markers for SCA are effectively used for identification and implantation of ICDs in individuals at risk for SCA.
- the genetic markers taught herein provide greater specificity and sensitivity in identification of individuals at risk.
- rs The National Center for Biotechnology Information
- NCBI National Center for Biotechnology Information
- dbSNP database serves as a central repository for both single base nucleotide substitutions, single nucleotide polymorphisms (SNPs) and short deletion and insertion polymorphisms.
- Reference Sequences, or RefSeqs (rs) are a curated, non-redundant set of records for mRNAs, proteins, contigs, and gene regions constructed from a GenBank exemplar for that protein or sequence.
- the rs numbers represent a unique record for a SNP.
- Submitted SNPs are records that are independently submitted to NCBI, are used to construct the rs record, and are cross-referenced with the rs record for the corresponding genome location.
- Submitter-Referenced Accession numbers are annotations that are included with a SS number. For rs records relevant to the present invention, these accession numbers may be associated with a GenBank accession record, which will start with one or two letters, such as "AL” or "AC,” followed by five or six numbers.
- the NCBI RefSeq database accession numbers have different formatting: "NT_123456.”
- the RefSeq accession numbers are unique identifiers for a sequence, and when minor changes are made to a sequence, a new version number is assigned, such as "NT_123456.1,” where the version is represented by the number after the decimal.
- the rs number represents a specific range of bases at a certain contig position. Although the contig location of the rs sequence may move relative to the length of the larger sequence encompassed by the accession number, that sequence of bases represented by the rs number, i.e., the SNP, will remain constant.
- rs numbers can be used to uniquely identify a SNP and fully enables one of ordinary skill in the art to make and use the invention using rs numbers.
- the sequences provided in the Sequence Listing each correspond to a unique sequence represented by an rs number known at the time of invention.
- the SEQ ID Nos. and the rs numbers claimed disclosed herein are understood to represent uniquely identified sequences for identified SNPs and may be used interchangeably.
- SCA Sudden Cardiac Arrest
- SCA Sudden Cardiac Death
- SCA results from an abrupt loss of heart function. It is commonly brought on by an abnormal heart rhythm. Sudden cardiac death occurs within a short time period, generally less than an hour from the onset of symptoms.
- SCA remains both a problem for the practicing clinician and a major public health issue.
- SCA occurs in the setting of Coronary Artery Disease ("CAD"). Most instances involve Ventricular Tachycardias (“VT”) degenerating to Ventricular Fibrillation (“VF”) and subsequent asystole. Fibrillation occurs when transient neural triggers impinge upon an unstable heart causing normally organized electrical activity in the heart to become disorganized and chaotic. Complete cardiac dysfunction results.
- Non-ischemic cardiomyopathy and infiltrative, inflammatory, and acquired valvular diseases account for most other SCA, or SCD, events.
- a small percentage of SCAs occur in the setting of ion channel mutations responsible for inherited abnormalities such as the long/short QT syndromes, Brugada syndrome, and catecholaminergic vent ricular tachycardia. These conditions account for a small number of SCAs.
- other genetic abnormalities such as hypertrophic cardiomyopathy and congenital heart defects such as anomalous coronary arteries are responsible for SCA.
- MI Myocardial Infarction
- HR Heart Rate
- ECG signal averaged Electro Cardio Gram
- EF left ventricular Ejection Fraction
- EP electrophysiology
- ECG parameters indicative of SCA, or SCD are QRS duration, late potentials, QT dispersion, T-wave morphology, Heart rate variability and T-wave alternans.
- Electrical alternans is a pattern of variation in the shape of the ECG waveform that appears on an every-other-beat basis.
- alternation in ventricular repolarization namely, repolarization alternans
- Pham, Q., et al., T-wave alternans marker, mechanism, and methodology for predicting sudden cardiac death.
- Analysis of the morphology of an ECG i.e., T-wave alternans and QT interval dispersion
- T-wave alternans T-wave morphology
- Heart rate variability T-wave alternans.
- Electrical alternans is a pattern of variation in the shape of the ECG waveform that appears on an every-other-beat basis.
- alternation in ventricular repolarization namely, repolarization alternans
- Heart rate variability a measure of beat-to-beat variations of sinus-initiated RR intervals, with its Fourier transform-derived parameters, is blunted in patients at risk for SCD. Bigger, JT. Heart rate variability and sudden cardiac death, Zipes DP, Jalife J, Eds. CARDIAC ELECTROPHYSIOLOGY: FROM CELL TO BEDSIDE, Philadelphia, Pa: WB Saunders; 1999 .
- Patient history is helpful to analyze the risk of SCA, or SCD.
- SCA cardiac tachycardia after myocardial infarction
- the following four variables identify patients at increased risk of sudden cardiac death: (1) syncope at the time of the first documented episode of arrhythmia, (2) New York Heart Association (“NYHA") Classification class III or IV, (3) ventricular tachycardia/fibrillation occurring early after myocardial infarction (3 days to 2 months), and (4) history of previous myocardial infarctions.
- NYHA New York Heart Association
- ventricular tachycardia/fibrillation occurring early after myocardial infarction (3 days to 2 months) ventricular tachycardia/fibrillation occurring early after myocardial infarction (3 days to 2 months)
- (4) history of previous myocardial infarctions Unfortunately, most of these clinical indicators lack sufficient sensitivity, specificity, and predictive accuracy to pinpoint the patient at risk for SCA, with a degree of accuracy that would permit using
- Autonomic effects at the sinus node and ventricle can easily be dissociated experimentally and may possibly be a cause of false-positive or false-negative test results. Zipes, DP et al., Sudden Cardiac Death, CIRCULATION, 1998;98:2334-2351 .
- NNT Number Needed to Treat
- Table 3 provides a brief summary of the demographic and physiologic variables that were recorded at the time of enrollment. Except for the Ejection Fraction ("EF"), none of the variables were found to be predictive of the patient outcome, as shown by the large p-values in Table 3. Although the EF gave a p-value less than 0.05, indicating a correlation with the presence of arrhythmic events, it did not provide a sufficient separation of the two groups to act as a prognostic predictor for individual patients, which in turn further confirmed the initial assessment that there is no strong predictor for SCA.
- EF Ejection Fraction
- Association of genetic variation and disease can be a function of many factors, including, but not limited to, the frequency of the risk allele or genotype, the relative risk conferred by the disease-associated allele or genotype, the correlation between the genotyped marker and the risk allele, sample size, disease prevalence, and genetic heterogeneity of the sample population.
- genomic DNA was isolated from the blood samples collected from the 240 patients who participated in this study. Following the DNA isolation, a whole genome scan consisting of 317,503 SNPs was conducted using Illumina 300K HapMap gene chips.
- nucleic acid reads were done from each patient, representing the nucleotide variants on two chromosomes, except for the loci chromosomes on male patients.
- Four letter symbols were used to represent the nucleotides that were read: cytosine (C), guanine (G), adenine (A), and thymine (T).
- C cytosine
- G guanine
- A adenine
- T thymine
- FIG. 3 a statistical plot of SNPs: p-values graphed as a function of chromosomal position. The dotted line corresponds to a p-value of 0.0001. There were 25 SNPs found in this analysis with a p-value at or less than 0.0001.
- the y-axis is the negative base 10 logarithm of the p-value.
- Fisher exact test is a statistical significance test used in the analysis of categorical data where sample sizes are small.
- the null of conditional independence is equivalent to the hypothesis that the odds ratio equals one.
- "Exact” inference can be based on observing that in general given all marginal totals are fixed, the first element of the contingency table has a non-central hypergeometric distribution with non-centrality parameter given by the odds ratio (Fisher, 1935).
- Recursive partitioning is a nonparametric technique that recursively partitions the data up into homogeneous subsets (with regard to the response).
- a multi-level "tree" is formed by bisecting each subset of patients based on their value of a given predictor variable. This point of bisection is called a "node.”
- SNPs were the predictors and the three potential genotypes for each SNP (major allele homozygotes. heterozygotes and minor allele homozygotes) were split into two groups, where the heterozygotes were compacted with one of the two homozygote groups.
- this method recursively splits the data at each node until either the patients at the resulting end nodes are homogeneous with respect to the response or the end nodes contain too few observations.
- the decision tree is a visual diagram of the results of recursive partitioning, with the topmost nodes indicating the most discriminatory SNP and each node further split into subnodes accordingly.
- Figure 4 provides the decision tree resulting from the application of the recursive partitioning algorithm to the SNPs that were found to be correlated with the patient outcomes in the MAPP study.
- the two numbers shown in each node correspond to the case and the control patients grouped in that node.
- the overall specificity and sensitivity of the combined tests described by Groups A through E in Table 5 can be determined by examining the contingency table (Table 6) of the combined test and MAPP patients in Case 1 patients, who experienced a life threatening VT/VF event versus Case 2 and Control patients who did not. It is desirable that the given test should have a high sensitivity and specificity value. Furthermore, it is not acceptable to sacrifice either one of these features to enhance the other. Therefore, values that are high enough to improve the clinical patient selection process, but low enough to be achievable with current research capabilities were chosen as indicative of SCA. The goal is to have 80% sensitivity and 80% specificity, which is met by 84.8% and 84.5%, respectively, based on calculations from the data in Table 6.
- Figures 5A and 5B indicates how 4 SNP markers could potentially be used to differentiate patients into high risk and low risk groups.
- the five SNPs indicated in Table 7 are shown visually among the SNPs in the decision tree in Figure 4 .
- Group A consists of patients with the TT genotype for rs10505726 and the TC or TT genotype for rs2716727. As indicated by Figure 5B , these patients would not be considered to be at relatively high risk for a life threatening VT/VF based solely on the genetic diagnostic test.
- Group B consists of patients with the TT genotype for rs10505726, but with the CC genotype for rs2716727.
- a triple test given during pregnancy utilizes the three factors measured from a female subject, and a medical decision is made by further addition of the age of the subject.
- SNPs described in this invention can be combined with other patient information, such as co-morbidities (e.g., diabetes, obesity, cholesterol, family history), parameters derived from electrophysiological measurements such as T-wave alternans, heart rate variability and heart rate turbulence, hemodynamic variables such as ejection fraction and end diastolic left ventricular volume, to yield a superior diagnostic technique.
- co-morbidities e.g., diabetes, obesity, cholesterol, family history
- parameters derived from electrophysiological measurements such as T-wave alternans, heart rate variability and heart rate turbulence
- hemodynamic variables such as ejection fraction and end diastolic left ventricular volume
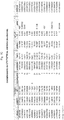
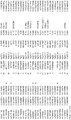
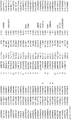
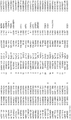
- Figures 7A , 7B and 7C contain a detailed table of all the 849 SNPs (SEQ ID Nos. 1 to 849) chosen based on logical, biological and statistical criteria.
- SEQ ID Nos. 1-849 of the Sequence Listing of the invention the SNP is located at position 51.
- an array having nucleotide probes from each of the sequences listed in SEQ ID Nos. 1 to 849 can be constructed where each probe is a different nucleotide sequence from 3 to 101 base pairs overlapping the SNP at position 51.
- the nucleotide probes are from each of the sequences listed in SEQ ID Nos. 850-858 and can be constructed where each probe is a different nucleotide sequence from 3 to 101 base pairs overlapping the SNP at position 26 or 27.
- 1 to 858 can be individually used to monitor loss of heterozygosity, identify imprinted genes; genotype polymorphisms, determine allele frequencies in a population, characterize bi-allelic or multi-allelic markers, produce genetic maps, detect linkage disequilibrium, determine allele frequencies, do association studies, analyze genetic variation, or to identify markers linked to a phenotype or, compare genotypes between different individuals or populations.
- Figure 8 depicts one embodiment of a clinical utilization of the genetic test created for screening of patients for susceptibility to life threatening arrhythmias.
- patients already testing positively for CAD and a low EF would undergo the test for genetic susceptibility using any of the methods described herein.
- Positive genetic test results would then be used in conjunction with the other test, such as the ones based on the analysis of ECG, and be used to make the ultimate decision of whether or not to implant an ICD.
- Figure 9 shows the performance of the genetic markers obtained from the MAPP Study when they were applied to the IDEA-VF patient population. Only the markers with MAPP p-values that are less than 0.0001 were tested. As it can be seen from this graph, not all the markers identified as highly significant in MAPP did not give low p-values when they are applied to the IDEA-VF population.
- a total of 25 SNPs are represented in Figure 9 : rs4878412, rs2839372, rs10505726, rs10919336, rs6828580, rs16952330, rs2060117, rs9983892, rs1500325, rs1679414, rs486427, rs6480311, rs7305353, rs10823151, rs1346964, rs6790359, rs7591633, rs10487115, rs2240887, rs1439098, rs248670, rs4691391, rs2270801, rs12891099, and rs17694397.
- Figures 16-40 contain mosaic plots illustrating the probability of experiencing LTA as a function of allele specific inheritance of the 25 SNPs represented in Figure 9 .
- Figure 16 illustrates the resulting risk stratification of rs1439098.
- the presence of a at the SNP position indicates decreased susceptibility to SCA or SCD as compared to the presence of g at the SNP position.
- Patients with genotype a/a have about an 11% probability of experiencing SCA or SCD, while the a/g genotype indicates about a 47% probability, and the g/g genotype indicates about a 50% probability of experiencing SCA or SCD.
- Table 8 shows the statistical breakdown of the genotypes for this SNP.
- the first (top) value in each cell in each of the statistical tables is the number, or count, of patients placed in that set.
- the second value is the percentage of the total number of patients placed in the set.
- the third value is the percentage of control or case patients (depending on the column) having a specific genotype from the total number of patients having that specific genotype.
- the fourth value is the percentage of patients from either the control or case patients (depending on the column) placed in the set.
- the bottom right cell is the total number of patients (100%) utilized for the SNP analysis.
- Figure 17 illustrates the resulting risk stratification of rs4878412.
- the presence of t at the SNP position indicates decreased susceptibility to SCA or SCD as compared to the presence of g at the SNP position.
- Patients with genotype t/t have about a 9% probability of experiencing SCA or SCD, while the t/g genotype indicates about a 35% probability, and the g/g genotype indicates greater than 99% probability of experiencing SCA or SCD.
- Table 9 shows the statistical breakdown of the genotypes for this SNP.
- Figure 18 illustrates the resulting risk stratification of rs2839372.
- the presence of g at the SNP position indicates decreased susceptibility to SCA or SCD as compared to the presence of a at the SNP position.
- Patients with genotype g/g have about a 9% probability of experiencing SCA or SCD, while the g/a genotype indicates about a 15% probability, and the a/a genotype indicates about a 62% probability of experiencing SCA or SCD.
- Table 10 shows the statistical breakdown of the genotypes for this SNP.
- Figure 19 illustrates the resulting risk stratification of rs10505726.
- the presence of t at the SNP position indicates decreased susceptibility to SCA or SCD as compared to the presence of c at the SNP position.
- Patients with genotype t/t have about a 7% probability of experiencing SCA or SCD, while the t/c genotype indicates about a 30% probability, and the c/c genotype indicates about a 29% probability of experiencing SCA or SCD.
- Table 11 shows the statistical breakdown of the genotypes for this SNP.
- Figure 20 illustrates the resulting risk stratification of rs 10919336.
- the presence of a at the SNP position indicates increased susceptibility to SCA or SCD as compared to the presence of g at the SNP position.
- Patients with genotype a/a have about a 22% probability of experiencing SCA or SCD, while the a/g genotype indicates less than 5% probability, and the g/g genotype indicates about a 9% probability of experiencing SCA or SCD.
- Table 12 shows the statistical breakdown of the genotypes for this SNP.
- Figure 21 illustrates the resulting risk stratification of rs6828580.
- the presence of g at the SNP position indicates decreased susceptibility to SCA or SCD as compared to the presence of a at the SNP position.
- Patients with genotype g/g have about an 8% probability of experiencing SCA or SCD, while the g/a genotype indicates about a 28% probability, and the a/a genotype indicates about a 50% probability of experiencing SCA or SCD.
- Table 13 shows the statistical breakdown for the genotypes of this SNP.
- Figure 22 illustrates the resulting risk stratification of rs16952330.
- the presence of a at the SNP position indicates increased susceptibility to SCA or SCD as compared to the presence of g at the SNP position.
- Patients with genotype a/a have about an 11% probability of experiencing SCA or SCD, while the a/g genotype indicates about a 70% probability, and no patients in the case or control populations had the genotype g/g.
- Table 14 shows the statistical breakdown of the genotypes for this SNP.
- Figure 23 illustrates the resulting risk stratification of rs2060117.
- the presence of c at the SNP position indicates decreased susceptibility to SCA or SCD as compared to the presence of t at the SNP position.
- Patients with genotype c/c have about a 7% probability of experiencing SCA or SCD, while the c/t genotype indicates about a 29% probability, and the t/t genotype indicates about a 33% probability of experiencing SCA or SCD.
- Table 15 shows the statistical breakdown of the genotypes for this SNP.
- Figure 24 illustrates the resulting risk stratification of rs9983892.
- the presence of a at the SNP position indicates decreased susceptibility to SCA or SCD as compared to the presence of c at the SNP position.
- Patients with genotype a/a have about a 19% probability of experiencing SCA or SCD, while the a/c genotype indicates less than 5% probability, and the c/c genotype indicates about a 27% probability of experiencing SCD or SCA.
- Table 16 shows the statistical breakdown of the genotypes for this SNP.
- Figure 25 illustrates the resulting risk stratification of rs1500325.
- the presence of t at the SNP position indicates decreased susceptibility to SCA or SCD as compared to the presence of c at the SNP position.
- Patients with genotype t/t have less than 5% probability of experiencing SCA or SCD, while the t/c genotype indicates about a 21% probability, and the c/c genotype indicates about a 26% probability of experiencing SCA or SCD.
- Table 17 shows the statistical breakdown of the genotypes for this SNP.
- Figure 26 illustrates the resulting risk stratification of rs1679414.
- the presence of g at the SNP position indicates decreased susceptibility to SCA or SCD as compared to the presence of t at the SNP position.
- Patients with genotype g/g have about a 15% probability of experiencing SCA or SCD, while the g/t genotype indicates less than 5% probability, and the t/t genotype indicates greater than 99% probability of experiencing SCA or SCD.
- Table 18 shows the statistical breakdown of the genotypes for this SNP.
- Figure 27 illustrates the resulting risk stratification of rs486427.
- the presence of c at the SNP position indicates increased susceptibility to SCA or SCD as compared to the presence of a the SNP position.
- Patients with genotype c/c have about a 26% probability of experiencing SCA or SCD, while the c/a genotype indicates about an 8% probability, and the a/a genotype indicates less than 1% probability of experiencing SCA or SCD.
- Table 19 shows the statistical breakdown of the genotypes for this SNP.
- Figure 28 illustrates the resulting risk stratification of rs6480311.
- the presence of c at the SNP position indicates decreased susceptibility to SCA or SCD as compared to the presence of t at the SNP position.
- Patients with genotype c/c have about an 18% probability of experiencing SCA or SCD, while the c/t genotype indicates about a 5% probability, and the t/t genotype indicates about a 35% probability of experiencing SCA or SCD.
- Table 20 shows the statistical breakdown of the genotypes for this SNP.
- Figure 29 illustrates the resulting risk stratification of rs11610690.
- the presence of t at the SNP position indicates decreased susceptibility to SCA or SCD as compared to the presence of c at the SNP position.
- Patients with genotype t/t have less than 5% probability of experiencing SCA or SCD, while the t/c genotype indicates about a 21% probability, and the c/c genotype indicates about a 22% probability of experiencing SCA or SCD.
- Table 21 shows the statistical breakdown of the genotypes for this SNP.
- Figure 30 illustrates the resulting risk stratification of rs10823151.
- the presence of g at the SNP position indicates decreased susceptibility to SCA or SCD as compared to the presence of a at the SNP position.
- Patients with genotype g/g have about a 15% probability of experiencing SCA or SCD, while the g/a genotype indicates about a 5% probability, and the a/a genotype indicates about a 42% probability of experiencing SCA or SCD.
- Table 22 shows the statistical breakdown of the genotypes for this SNP.
- Figure 31 illustrates the resulting risk stratification of rs 1346964.
- the presence of g at the SNP position indicates decreased susceptibility to SCA or SCD as compared to the presence of a at the SNP position.
- Patients with genotype g/g have about a 7% probability of experiencing SCA or SCD, while the g/a genotype indicates about a 27% probability, and the a/a genotype indicates about a 37% probability of experiencing SCA or SCD.
- Table 23 shows the statistical breakdown of the genotypes for this SNP.
- Figure 32 illustrates the resulting risk stratification of rs6790359.
- the presence of t at the SNP position indicates decreased susceptibility to SCA or SCD as compared to the presence of c at the SNP position.
- Patients with genotype t/t have about a 65% probability of experiencing SCA or SCD, while the t/c genotype indicates about a 26% probability, and the c/c genotype indicates about a 14% probability of experiencing SCA or SCD.
- Table 24 shows the statistical breakdown of the genotypes for this SNP.
- Figure 33 illustrates the resulting risk stratification of rs7591633.
- the presence of g at the SNP position indicates decreased susceptibility to SCA or SCD as compared to the presence of a at the SNP position.
- Patients with genotype g/g have less than 5% probability of experiencing SCA or SCD, while the g/a genotype indicates about a 16% probability, and the a/a genotype indicates about a 31% probability of experiencing SCA or SCD.
- Table 25 shows the statistical breakdown of the genotypes for this SNP.
- Figure 34 illustrates the resulting risk stratification of rs10487115.
- the presence of c at the SNP position indicates decreased susceptibility to SCA or SCD as compared to the presence of a at the SNP position.
- Patients with genotype c/c have about a 10% probability of experiencing SCA or SCD, while the c/a genotype indicates about a 7% probability, and the a/a genotype indicates about a 32% probability of experiencing SCA or SCD.
- Table 26 shows the statistical breakdown of the genotypes for this SNP.
- Figure 35 illustrates the resulting risk stratification of rs2240887.
- the presence of g at the SNP position indicates decreased susceptibility to SCA or SCD as compared to the presence of a at the SNP position.
- Patients with genotype g/g have about a 7% probability of experiencing SCA or SCD, while the g/a genotype indicates about a 30% probability, and the a/a genotype indicates about a 20% probability of experiencing SCA or SCD.
- Table 27 shows the statistical breakdown of the genotypes for this SNP.
- Figure 36 illustrates the resulting risk stratification of rs248670.
- the presence of t at the SNP position indicates decreased susceptibility to SCA or SCD as compared to the presence of c at the SNP position.
- Patients with genotype t/t have less than 5% probability of experiencing SCA or SCD, while the t/c genotype indicates about a 21 % probability, and the c/c genotype indicates about a 16% probability of experiencing SCA or SCD.
- Table 28 shows the statistical breakdown of the genotypes for this SNP.
- Figure 37 illustrates the resulting risk stratification of rs4691391.
- the presence of g at the SNP position indicates increased susceptibility to SCA or SCD as compared to the presence of a at the SNP position.
- Patients with genotype g/g have about a 9% probability of experiencing SCA or SCD, while the g/a genotype indicates about a 36% probability, and the a/a genotype indicates less than 1% probability of experiencing SCA or SCD.
- Table 29 shows the statistical breakdown of the genotypes for this SNP.
- Figure 38 illustrates the resulting risk stratification of rs2270801.
- the presence of c at the SNP position indicates increased susceptibility to SCA or SCD as compared to the presence of t at the SNP position.
- Patients with genotype c/c have about a 9% probability of experiencing SCA or SCD, while the c/t genotype indicates about a 36% probability, and the t/t genotype indicates less than 1% probability of experiencing SCA or SCD.
- Table 30 shows the statistical breakdown of the genotypes for this SNP.
- Figure 39 illustrates the resulting risk stratification of rs12891099.
- the presence of g at the SNP position indicates decreased susceptibility to SCA or SCD as compared to the presence of a at the SNP position.
- Patients with genotype g/g have about an 11% probability of experiencing SCA or SCD, while the g/a genotype indicates about a 10% probability, and the a/a genotype indicates about a 56% probability of experiencing SCA or SCD.
- Table 31 shows the statistical breakdown of the genotypes for this SNP.
- Figure 40 illustrates the resulting risk stratification of rs17694397.
- the presence of c at the SNP position indicates increased susceptibility to SCA or SCD as compared to the presence of t at the SNP position.
- Patients with genotype c/c have about an 8% probability of experiencing SCA or SCD, while the c/t genotype indicates about a 30% probability, and the t/t genotype indicates less than 1% probability of experiencing SCA or SCD.
- Table 32 shows the statistical breakdown of the genotypes for this SNP.
- Figure 10 shows 849 SNPs identified by the MAPP and IDEA-VF studies that are associated with risk of SCA, and is a subset of the total number of 317,503 SNPs scanned from the whole genome using the Illumina 300K HapMap gene chips described herein.
- Figure 11 is a list of rs numbers and corresponding SEQ ID Nos. Both the rs numbers and the SEQ ID Nos. can be used interchangeably to identify a particular SNP.
- a third study to identify genetic markers associated with SCA or SCD (referred to herein as "DISCOVERY”) has been designed and implemented.
- the DISCOVERY study is undertaken to determine if certain cardiac ion-channel genetic polymorphisms predispose a patient to ventricular and atrial arrhythmia.
- the study aimed to identify which polymorphism combinations, optionally in further combination with other markers, serve as prognostics that identify appropriate candidates for ICD therapy.
- the DISCOVERY study's primary objectives are to correlate genetic polymorphisms with a diagnostic stratification of patients through a determination of risk of ventricular tachycardia and to evaluate the utility of ICD-based diagnostic information on the long-term treatment and management of primary prevention ICD patients.
- the predictive utility of SNPs in specific genes for ventricular arrhythmia of ⁇ 400ms was evaluated.
- the genes studied were GNB3, GNAS and GNAQ genes, and the positive value was determined for SNPs as predictor for death, sudden cardiac death and atrial fibrillation or flutter in the genes GNB3, GNAS, GNAQ and other SNPs involving signal transduction components that have an impact on the activity of cardiac ion channels.
- Other genes under consideration include the CAPON and GPC5 genes.
- SNPs may be used to determine the optimal combination of all genetic parameters, including the presence or absence of any of the SNPs disclosed herein or otherwise known to be markers for cardiovascular diseases or disorders, patient baseline data, and patient follow-up data as a predictor for use in diagnostic and treatment methods and further methods of classification or stratification of patients based on the likelihood of SCA or SCD.
- the GNB3 gene consists of 12 exons localized on chromosome 12p13. It codes for the ⁇ 3 -subunit of the hetero-trimeric G-proteins.
- the widely distributed C825T polymorphism exhibits exchange between Cytosine (C) and Thymine (T) in nucleotide position 825 of the cDNA as shown in Table 33.
- C Cytosine
- T Thymine
- This SNP is localized in exon 10 and associated with changes in cellular signal transduction. Id.
- This polymorphism is represented by rs5443 (SEQ ID No.
- SEQ ID No. 850 5'-gag agc atc atc tgc ggc atc acg tc [c/t] gtg gcc ttc tcc ctc agt ggc cgc c-3'.
- US 6,242,181 describes a method for diagnosing an increased likelihood of hypertension in a human subject comprising determining the presence of a genetic modification in a gene obtained from said subject which encodes a human G protein ⁇ 3 subunit wherein a genetic modification is a substitution of cytosine by thymine at position 825.
- Homozygotes of the 825T-allele exhibit changes in ion current in atrial cells ( Dobrev, D. et al., G-Protein beta(3)-Subunit 825T Allele Is Associated with Enhanced Human Atrial Inward Rectifier Potassium Currents, CIRCULATION, 2000; 102:692-697 ) and results in reduced risk of atrial fibrillation.
- the GNAQ gene codes for the Gaq subunit of hetero-trimeric G-proteins.
- the Gaq protein transmits signals over ⁇ l-adrenoceptors (nor-adrenaline), endothelin receptors and similar receptors. Gaq directly regulates many ion channels. Hyper-expression of Gaq in the heart leads to cardiac hypertrophy ( Adams, J. W. et al., Enhanced Galphaq signaling: A Common Pathway Mediates Cardiac Hypertrophy and Apoptotic Heart Failure, Proc. Natl. Acad. Sci. U.S.A., 1998; 95:10140-10145 ), whereas the knockout of Gaq (plus G ⁇ 11) counteracts pressure-induced hypertrophy. ( Wettschureck, N.
- the polymorphism G (-382)A is known by rs72466454 (SEQ ID No. 851) and has the following sequence: 5'-cgc cgc cag gcg cac ggc gta ggg ga [a/g] cct cgc agg cgg cgg cgg cgg c-3'.
- the polymorphism G (-387)A is known by rs72466453 (SEQ ID No. 852) and has the following sequence: 5'-gct ctc gcc gcc agg cgc acg gcg ta [a/g] ggg agc ctc gca ggc ggc ggc ggc ggc g-3'.
- the GNAS gene codes for the Gas-subunit of hetero-trimeric G-proteins. Activation of Gas (formerly the stimulating G-protein), activates adenyl cyclase, leading to increases in cAMP. Gas is activated by many hormone receptors. The activation of ⁇ 1 - adenoceptors is particularly important for the heart, as this leads to positive chronotropy and inotropy. Several somatic mutations in GNAS lead to rare endocrinological diseases ( Weinstein, L.S. et al., Genetic Diseases associated with Heterotrimeric G Proteins, TRENDS PHARMACOL. SCI., 2006; 27: 260-266 ).
- C393T is known by rs7121 (SEQ ID No.
- the polymorphism G-1211A is known by rs6123837 (SEQ ID No. 855) and has the following sequence: 5'-ctg gtc ttc tcg gtg cgc agc ccc tc [a/g] tgg gtg ctc aac ttc ctg cag a-3'.
- the polymorphism C2291T is known by rs6026584 (SEQ ID No. 854) and has the following sequence: 5'-atc tgc agc tta agc cag tga cac aa [c/t] att ttg cat ttt taa atg gtg att c-3'.
- GPC5 The minor allele of GPC5 (GLYPICAN 5, rs3864180) was associated with a lower risk of SCA in Oregon-SUDS, an effect that was also observed in ARIC/CHS whites (p ⁇ 0.05) and blacks (p ⁇ 0.04).
- Genome-Wide Association Study Identifies GPC5 as a Novel Genetic Locus Protective against Sudden Cardiac Arrest, Arking et al., PLosOne 2010 http://www.plosone.org/article/info:doi%2F10.1371%2Fjournal.pone.0009879 .
- the minor allele exhibited a hazard ratio of 0.85 (95% CI 0.74 to 0.98; p ⁇ 0.01).
- Figure 13 shows Cox proportional hazards model was adjusted for age, sex, and race/ethnicity. Individuals homozygous for the protective allele (GG) are shown in green, heterozygotes (AG) in blue, and homozygous for the risk allele (AA) are in red. Further, a statistically significant interaction between rs3864180 and sex (P ⁇ 0.012), with a stronger effect in women, has been reported in the association with SCA. However, the GPC5 association to SCD was shown in a non-ICD population. The polymorphism of GPC5 is known by rs3864180 (SEQ ID No.
- the CAPON (NOS1AP) gene was shown to modulate the QT duration.
- "Common variants at ten loci modulate the QT interval A. Pfeufer et al., Nature Genetics 2009 ).
- Figure 14 shows individuals classified by counting their number of QT-prolonging alleles in all ten identified markers (max score 20). Dosages for the QT-prolonging allele as calculated by MACH1 were added and then rounded to the nearest integer. Gray bars indicate the number of individuals in each score class, blue dots indicate the mean QT interval for each class, and the black line is the linear regression though these points.
- the polymorphism of GPC5 is known by rs12143842 (SEQ ID No.
- the DISCOVERY study determined whether a correlation exists between genotypes and the incidence of atrial and ventricular arrhythmia, as measured by a dual chamber ICD produced by Medtronic, Inc.
- the differentiated diagnostic data Saoudi, N. et al., How Smart Should Pacemakers Be? AM. J.
- CARDIOL., 1999; 83:180-186 afforded by the ICDs can produce information on arrhythmia trigger ( Marshall, A.J., et al., Pacemaker Diagnostics to Determine Treatment and Outcome in Sick Sinus Syndrome with Paroxysmal Atrial Fibrillation, PACE, 2004; 27: 1130-1135 ) and IEGMs ( Mitrani, R.D., et al., The Use Of Pacemaker Diagnostic Data To Guide Clinical Decision Making, Presented at Cardiostim, 2006 ), supraventricular tachycardia which are a known independent risk factor for mortality and stroke. ( Benjamin, E.J.
- the second part of the DISCOVERY study evaluated the therapeutic utility of ICD-based diagnostic information on patient treatment or management of symptoms related to cardiovascular disease. Recently developed ICD algorithms target improved patient-specific therapies. However, ICDs can also provide physicians with increasingly differentiated diagnostic information (Saoudi, N. et al., 1999).
- the diagnostic information available in the ICDs is separated into system-related and patient-related diagnoses. ( Nowak, B., Taking Advantage of Sophisticated Pacemaker Diagnostics, AM. J. CARDIOL., 1999; 83:172-179 ). This separation provided a systematic approach for the classification of the information generated.
- System-related diagnostic data includes device query, battery and lead status, thresholds, sensing, and related long-term trends. This data enables early detection of hardware dysfunction.
- Patient-related diagnostics include intra-cardiac EGM, sensor data, and channel markers. This data supports the evaluation of device reactions to a patient's intrinsic rhythm and provides information on arrhythmia and heart disease progression.
- Patient-related diagnostic data may also be used to evaluate device programming and the impact of medication on the treatment or suppression of cardiovascular disease.
- the study evaluated the use of system-based and patient-based diagnostics and the resulting medical consequences, including medical interventions, prescription of medication and changes in medication, surgery, additional diagnostics, and changes in ICD programming. Similarly, the frequency of programming changes involving AF-prevention or AF-therapy algorithms and programming changes involving changes in pacing parameters were evaluated along with the resulting medical consequences.
- the Medtronic, Inc. ICDs used in the study stored long-term trends for numerous diagnostic parameters over a period of up to 14 months.
- the device long-term diagnostics complement the information collected during patient follow-up examinations, which reflect only a brief exposure to a physician. For example, early identification of lead defects is improved by examining long-term impedance and sensing trends where major fluctuations are visible (Soudi, N. et al., 1999).
- Arrhythmia therapy also significantly relies on stored ICD information and can be qualified by device-based system diagnostics (Mitriani, R.D. et al., 2006).
- the stored information related to atrial arrhythmia trends permits differentiated diagnosis of atrial arrhythmias, which comprise an independent risk factor for morality, stroke, and atrial fibrillation ("AF") in pacemaker patients with sinus node disease (Benjamin, E.J. et al., 1998; Glotzer, T.V. et al., 2003). Understanding the triggers of atrial arrhythmias can be of decisive importance in the treatment or reduction of atrial arrhythmias (Marshall, A.J. et al., 2004). Additionally, assessment of atrial coherence is important for the diagnostic interpretation of atrial arrhythmias provided by ICDs. Atrial leads with long-term trends in sensing values and EGM episodes support the evaluation of sensing integrity and of atrial arrhythmia episodes by highlighting sensing malfunction on atrial channels and leads which would otherwise result in a faulty assessment of arrhythmias.
- AF atrial fibrillation
- the DISCOVERY study was an interventional non-randomized, longitudinal, prospective, multi-centric, diagnostic study. It was composed of two parts: Part One was a double-blind study, and analyzed data on genetic polymorphisms as prognostic of ventricular and atrial tachyarrhythmia. Part Two of the study evaluated the influence of ICD-based diagnostic information on long-term patient management and treatment. Subjects were enrolled for a period of approximately 24 months, and the total study duration was 48 months.
- the DISCOVERY study intended to determine the diagnostic value obtained from SNPs studied within the framework of Cardiac Compass and other diagnostic tools available in the commercially released Medtronic, Inc. produced ICD devices. The devices were manufactured in accordance with the provisions of the Active Medical Device Directive (90/385/EEC) and comply with all relevant legal requirements. The devices and leads were market released and used within labeling.
- Ion channelopathies such as Long- and Short-QT Syndrome, Brugada Syndrome, Catecholaminergic Polymorphic Ventricular Tachycardia (CPTV)
- the ICD devices used in the study were multi-programmable, Dual-chamber ICDs as previously described. All devices automatically detect and treat episodes of VT, VF, fast ventricular tachycardia and bradyarrhythmia. When a cardiac arrhythmia is detected, the implantable device delivers defibrillation, cardioversion, anti-tachycardia pacing or standard pacing therapy. The devices collect and store various types of data and provide a range of diagnostic tools to manage patient care.
- the devices provided a Quick Look screen which supplies a summary of the episode data, device and lead status information, programmed bradycardia pacing parameters, conduction status, and device observations since the last patient session.
- the Quick Look screen is displayed after the software application is started.
- the Observations section of the Quick Look screen highlights significant device status events, lead status events, Patient Alert events, parameter programming, diagnostic data, and clinical status data.
- the Cardiac Compass report provides up to 14 months of clinically significant data including arrhythmia episodes, therapies delivered, physical activity, heart rate, and bradycardia pacing activity.
- the report can be useful in correlating changes in data trends to changes in programmed parameters, drug regimen, or patient condition.
- the Cardiac Compass report provides an overall view based on the following daily checks or measurements: VT/VF episodes; indication of a cardioversion or defibrillation therapy delivered; ventricular rate during VF, FVT, or VT episodes; the number of VT-NS episodes per day; the total time in AT or AF (EnTrust and Virtuoso devices only); ventricular rate during AT or AF (EnTrust and Virtuoso devices only); percentage of atrial and ventricular pacing; average day and night ventricular rate; overall patient activity; heart rate variability; and OptiVol fluid index (Virtuoso device only).
- the Cardiac Compass report also provides the following trend data.
- the "VT/VF episodes per day trend" provides a history of ventricular tachyarrhythmia and may reveal correlations between clusters of episodes and other clinical trends.
- the ICD records the total number of spontaneous VT and VF episodes.
- the episode counts are provided in histogram format on the report.
- the device also records a shock indicator for any day on which it delivers an automatic defibrillation therapy, cardioversion therapy, or atrial shock therapy.
- the Cardiac Compass report displays an annotation for the day on which a defibrillation therapy, cardioversion therapy, or atrial shock therapy was delivered.
- the Cardiac Compass displays a graph of the daily median ventricular rate for spontaneous VF, FVT and VT episodes, which may have occurred. This may provide an indication of the effects of anti- arrhythmic drugs on VF, FVT, and VT rates and a better understanding of the safety margins for detection.
- the "non-sustained VT episodes" trend may reveal correlations between patient symptoms (such as palpitations) and VT-NS episodes and may indicate a need for further investigation of the status of the patient.
- the ICD records the total number of spontaneous VT-NS episodes.
- the episode counts are provided in histogram format on the report.
- the "AT/AF total hour per day" trend for EnTrust and Virtuoso devices helps in the assessment of the need for anti-arrhythmic drugs or ablations to reduce AT/AF episode occurrences or for anti-coagulant drugs to reduce the risk of stroke.
- the device records a daily total for the time the patient spent in AT or AF.
- the "ventricular rate during AT/AF" trend reveals correlations between patient symptoms and rapid ventricular responses to AT/AF. It is also useful in the assessment of the efficacy of an AV node ablation procedure or in the assessment VT/VF detection safety margins so that programming may be modified to avoid treating rapidly conducted AT/AF as VT/VF. The trend may be used further to prescribe or titrate anti-arrhythmic and rate control drugs.
- the device records average and maximum ventricular rates during episodes of AT and AF each day. The values are plotted on the Cardiac Compass report along with the average ventricular rates.
- the percent pacing per day graph provides a view of pacing over time that can help identify pacing changes and trends. It displays the percentage of events occurring during each day that are atrial paces (AT and DR devices only) and ventricular paces. It can be useful to program the pacing parameters in a way that helps to avoid unnecessary ventricular stimulation in those patients that have no indication for ventricular pacing.
- the "patient activity” trend can be evaluated and used for the following types of information.
- the trend can act as an early indicator of symptoms due to progressive diseases like heart failure, which causes fatigue and a consequent reduction in patient activity.
- the trend allows monitoring of a patient's exercise regimen.
- the trend is an objective measurement of a patient's response to changes in therapy.
- the trend may also be used to study outcomes in ICD patients, along with additional parameters such as quality of life.
- the device uses activity count data derived from the rate response accelerometer signal to determine patient activity.
- the activity values are stored daily. For each seven days of stored data, the device calculates a seven-day average. This average is plotted for the Cardiac Compass report.
- the night and day heart rate trend provides the following clinically useful information: gradual increase in heart rate, which may indicate cardiac decompensation as a symptom of heart failure; objective data that may be correlated with patient symptoms; indications of autonomic dysfunction or heart failure; and information regarding diurnal variations.
- the device measures the median atrial interval value every five minutes and calculates a variability value each day.
- the heart rate variability value in milliseconds, is plotted on the Cardiac Compass report.
- the "OptiVol" fluid index trend for Virtuoso devices displays the accumulation of the time and magnitude that the daily impedance is less than the reference impedance. If the daily impedance is less than the reference impedance, then the OptiVol fluid index trend increases. This may indicate that the patient's thoracic fluid has increased.
- the OptiVol fluid monitoring feature is an additional source of information for patient management.
- the "rate histograms report” counts and collects atrial or ventricular events and classifies them by rate range and the percentage of time.
- the device automatically collects the histogram data without any programming by the clinician.
- This diagnostic is intended for ambulatory monitoring uses, such as monitoring rate distribution. Rate histograms also collect the ventricular rate during AT/AF. This diagnostic may be used to evaluate drug titration.
- Flashback Memory allows analysis of heart rates leading to a VF, VT, or AT/AF episode and compares the pre-VF, pre-VT, and pre-AT/AF rhythms to the normal sinus rhythm and to other episodes.
- Flashback Memory automatically records V-V and A-A intervals and stored marker data for the following events: the most recent VF episode, the most recent VT episode, the most recent AT/AF episode, and the most recent interrogation.
- the ICD automatically and continuously monitors battery and lead status.
- the Battery and Lead Measurements screens after interrogation views and prints the following data: current battery voltage, last capacitor formation, last capacitor charge, sensing integrity counter data, last atrial lead position check (EnTrust and Virtuoso devices only), last lead impedance data, last sensing data, and last high-voltage therapy.
- the automatically performed daily lead impedance and sensing measurements are used to generate lead performance graphs based on up to 82 weeks of measurements.
- a separate graph is provided for each of the following measurements: atrial placing lead impedance (AT and DR devices only), ventricular pacing lead impedance, defibrillation lead impedance, SVC lead impedance (if used), P-wave sensing amplitude (AT and DR devices only), and R-wave sensing amplitude.
- Methods of stratifying patients into diagnostic groups based on a determination of risk of ventricular tachycardia are provided.
- Methods of evaluating ICD-based diagnostic information for the long-term treatment and management of primary prevention ICD patients are also provided.
- Subjects suitable for evaluation are first identified. A review of each subject is required to determine preliminary eligibility according to subject inclusion and exclusion criteria.
- Clinical data is collected via study electronic or paper case report forms ("eCRF" or "CRF") at the time of subject's baseline, planned follow-up examinations, unscheduled follow-up examinations, system modification and subject exit, including deaths, as applicable.
- the Baseline CRF is used to record the baseline data for all subjects.
- the information documented may include, for example, (1) verification of inclusion and exclusion criteria; (2) recording of the subject's demographic and medical history; (3) cardiovascular status and history, including arrhythmia history; (4) ICD implant indication; (5) physical assessment such as LV ejection fraction, 12-lead ECG; (6) New York Heart Association (NYHA) classification; (7) Recording of cardiovascular medications; and (8) date of blood test for the genetics analysis.
- a subject's cardiovascular history includes heart failure ("HF") etiology, previous surgery and history of arrhythmia.
- Cardiac medications are recorded at the baseline evaluation, but recordation of non-cardiac medications is not required. During every follow-up visit, however, only medication changes as a result of the use of patient-related diagnostics will be recorded, as described below.
- Cardiac medications include, but are not limited to, angiotensin-converting enzyme inhibitors and angiotensin receptor blockers, anti-arrhythmic medications, beta-blockers, diuretics, calcium channel blockers, anticoagulants, inotropes, nitrates, cardiac glycosides, and anti-lipidemics, e.g., statins.
- New York Heart Association classification of functional capacity is based on a classification system originating in 1928, when the NYHA published a classification of subjects with cardiac disease based on clinical severity and prognosis. This classification has been updated in seven subsequent editions of Nomenclature and Criteria for Diagnosis of Diseases of the Heart and Great Vessels (Little, Brown & Co.). The ninth edition, revised by the Criteria Committee of the American Heart Association, New York City affiliate, was released March 4, 1994 . These classifications are summarized below in Table 34. TABLE 34 Functional Capacity Class I Subjects with cardiac disease but without resulting limitation of physical activity. Ordinary physical activity does not cause undue fatigue, palpitation, dyspnea, or angina.
- Class II Subjects with cardiac disease resulting in slight limitation of physical activity They are comfortable at rest. Ordinary physical activity results in fatigue, palpitation, dyspnea, or angina.
- Class III Subjects with cardiac disease resulting in marked limitation of physical activity They are comfortable at rest. Less than ordinary activity causes fatigue, palpitation, dyspnea, or angina.
- a left ventricular ejection fraction (“LVEF”) measurement is also performed at baseline if one has not been performed within 30 days prior to subject enrollment. The following information is collected: LVEF measurement, the method of LVEF measurement, radionucleotide entriculo-cardiography/MUGA, echocardiography, and ventricularcardiography via catheterization.
- a 12-lead ECG is also performed during the baseline evaluation if one has not been performed within 30 days prior to subject enrollment.
- the QRS width and the lead used for measurement will be circled and maintained in the patient's file.
- the device After a subject receives an IMD, the device is programmed. The programming is done according to the applicable Medtronic ICD System Reference Manual for the programs for detection and therapy parameters for bradycardia pacing and anti-tachycardia therapy. Table 35 outlines the required programming parameters and concern only the diagnostic quality of the data collected. Deviation from these settings must be recorded with the clinical evidence justifying deviation from the programming requirements. TABLE 35 Parameter Feature Value VF Detection ON initial beats to detect (NID) 18/24 VT Detection ON or Monitor Initial beats to detect (NID) 16 V Interval > 400 ms EGM 1 Source Atip - Aring EGM 2 Source Vtip - Vring
- the device is interrogated, and the data is collected via the device's Save-to-Disk function. A full interrogation is performed without clearing any episodes. If any Save-to-Disk files related to a follow-up visit are permanently missing, a Study Deviation form is completed. Subject data may be excluded from analysis if a sequential device-based arrhythmic history cannot be provided at a later time.
- Clinical data is also collected at the time of the subject's planned follow-up, unscheduled follow-up, system modification and subject exit. Regular follow-up examinations take place at 6, 12, 18, and 24 months after device implantation. To obtain sufficient incidence of ventricular arrhythmia, a follow-up duration of 24 months per subject is required. If a follow-up visit falls outside the acceptable target day +/- 30 days, the original follow-up schedule will be maintained for the remaining visits. Table 37 shows the method for determining appropriate follow-up visit scheduling. Medical treatment and device programming not included in Table 9 are left to the discretion of the examining physician during follow-up examinations. TABLE 37 Days post Device-Implantation Visits Window start Target day Window end 6 month follow-up 153 183 213 12 month follow-up 335 365 395 18 month follow-up 518 548 578 24 month follow-up 700 730 760
- cardiac symptoms At every scheduled and unscheduled follow-up visit, the following information is recorded: (1) cardiac symptoms, (2) occurrence and classification of arrhythmia, (3) use of system-related diagnostics such as battery status, impedance, pacing threshold, and sensing, (4) use of patient-related diagnostics such as arrhythmia information, heart frequency and stimulation that may lead to a change in treatment, (5) programming changes of the device using the device diagnostic, (6) follow-up duration, (7) number of medication changes as a result of the use of patient-related diagnostics, and (8) NYHA classification.
- the procedures for collecting the subject demographic and medical history and NYHA classification and cardiac medication information are as previously described.
- a Save-to-Disk function is performed using the ICD.
- AE Adverse Event
- ADE Adverse Device Effect
- a Serious Adverse Event is an AE that (1) leads to death, (2) leads to fetal distress, fetal death, or a congenital abnormality or birth defect, or (3) leads to a serious deterioration in the health of a subject that (i) resulted in a life-threatening illness or injury, (ii) resulted in a permanent impairment of a body structure or a body function, (iii) required in-patient hospitalization or prolongation of existing hospitalization, or (iv) resulted in medical or surgical intervention to prevent permanent impairment to a body structure or body function.
- SAE Serious Adverse Event
- SADE serious adverse device effects
- An SADE is an event that has resulted in any of the consequences characteristic of a Serious Adverse Event or that might have led to any of those consequences if (i) suitable action had not been taken, (ii) intervention had not been made, or (iii) if circumstances had been less opportune.
- Serious procedure related adverse events are those that occur due to any procedure specific to the treatment and examination of the subject, including the implantation or modification of the system. Ventricular or supraventricular arrhythmias that are detected are not treated as adverse events, whether or not treated, because they constitute material events analysis.
- Adverse Event Information reported on the Adverse Event form includes a description of the event, the diagnosis, the date of event onset, the relationship of the event to the procedure, the relationship of the event to the device or system, actions taken as a result of the event, and the outcome of the event. Adverse events are to be reported as soon as possible after the event occurs.
- a system modification CRF is completed.
- An Adverse Event CRF is likewise completed to document the underlying cause of the system modification.
- explanted ICD devices and/or leads are returned to Medtronic, Inc. for analysis.
- the devices and other components contemplated by the invention are those described as being used in and intended for the DISCOVERY study. If the device or lead is not replaced with those not meeting these criteria, then the following steps are performed. First, prior to explant, the device is interrogated and the data is saved onto one or more diskettes as needed using the Save-to-Disk function. The subject is then followed over the next 30 days or until all Adverse Events associated with the initial system are either resolved or unresolved with no further action required, whichever occurs last. Finally, a study termination CRF is completed for the subject.
- the device prior to explant, the device is interrogated and the data is saved onto one or more diskettes as needed using the Save-to-Disk function. The subject is then followed according to his or her regular examination schedule.
- Each patient death is classified as follows: (1) cardiac, non-cardiac, or unknown; and (2) sudden, non-sudden, or unknown. All deaths are reported. In addition, deaths will be classified based on whether they are related to the device or lead system and whether they were arrhythmic, non-arrhythmic (vascular) or unknown. The following information will also be collected when a death occurs, if available: a medical report, EGM or IEGM related to the death, an autopsy report, and a full device interrogation using Save-to-Disk.
- a cardiac death is defined as a death related to the electrical or mechanical dysfunction of the heart.
- the initiating event which may be preventable, is differentiated from the terminal event.
- the initiating event of cardiac death thus requires further classification as either arrhythmic or vascular: (1) initiating event is arrhythmic, non-arrhythmic, or unknown; (2) initiating event is vascular, non-vascular or unknown.
- Non-cardiac deaths are all deaths with a known cause not classified as cardiac deaths. If insufficient information is available to classify a death as cardiac or non-cardiac, the death is classified as unknown.
- Non-sudden death is a death that is not classified as sudden death, including cardiac death of hospitalized subjects on inotropic support.
- Blood samples are collected from each subject and analyzed for seven single nucleotide polymorphisms in the genes GNB3, GNAQ, GNAS. Then, the subject data is analyzed to determine the existence of a correlation between these SNPs and the occurrence of arrhythmia.
- additional genetic factors related to other medical conditions which may or may not be cardiac related, may also be revealed.
- the genetic profiles of the subjects may be used in additional research and analysis. This additional research involves medical research related to genetic effects on diseases and diagnostic and therapeutic applications of that research.
- Statistical analysis is then performed on the data collected. For all analyses, a two-sided p-value or 0.05 is considered to be statistically significant. Groups of patients for which statistical analysis is performed must contain no fewer than four patients. No populations are defined for the statistical analyses. All data is analyzed as collected. There is no imputation of missing data. Continuous variables are reported using N, N missing, mean, standard deviation, minimum, median and maximum. Categorical variables are reported using N per category and percentages. In addition, for categorical variables where more than one category can be crossed, a report of how often a combination of categories has been checked is made. The analyses are performed after two years of follow-up have been completed for each subject. There is no correction for multiple testing.
- sensitivity, specificity, and positive and negative predictive value are calculated as a predictor of the primary endpoint in patients without a history of spontaneous VT/VF (primary prevention indication for ICD implantation).
- Confidence intervals are calculated (95%, 2-sided).
- a primary endpoint is a ventricular arrhythmia which can be detected within a Tachycardia Detection Interval (TDI) programmed as follows: 18 out of 24 for ventricular fibrillation or 16 consecutive beats for ventricular tachycardia with a maximum cycle length of 400 ms. A cutoff value of 400 ms has been selected in order to capture a high amount of ventricular tachy-arrhythmias and at the same time avoid inappropriate ICD therapies. Sweeney et al.
- TDI Tachycardia Detection Interval
- the sample size calculation is based upon a required accuracy of the estimate of the positive predictive value (PPV) of the potential risk stratifiers under study.
- a 95% confidence interval with a maximal width of ⁇ 5 % is deemed appropriate.
- This level of accuracy of the estimated PPV requires a sample of 386 patients with a positive risk stratifier, assuming actual PPV is 40%.
- the positive value of SNPs as predictor for death, cardiac death and atrial fibrillation or flutter in genes GNB3, GNAS and GNAQ is determined. A determination of the positive predictive value is also made for other SNPs having signal transduction components that impact on the activity of cardiac ion channels. To evaluate the predictive power of the various SNPs, sensitivity, specificity, positive and negative predictive value will be calculated as predictor of the endpoints: death, cardiac death, and atrial fibrillation or flutter.
- a determination as to the most useful combination of genetic parameters, baseline data and follow-up data is made regarding the predictor of primary endpoint, all-cause mortality, cardiac death, and atrial arrhythmia. This determination involves analysis of the following parameters: (1) available genetic tests, (2) QRS width, (3) baseline medication, (4) age, (5) heart rate variability documented by the device diagnostics such as Cardiac Compass, (6) history of AT/AF, and (7) documented AT/AF by the device or Holter ECG. NYHA and EF data are related to ICD implantation indication and are assessed as eventual baseline correction. Usefulness is evaluated in terms of the greatest positive predictive value for the prognosis of sustained ventricular arrhythmia, non-cardiac death, cardiac death, and atrial arrhythmia.
- a univariate Cox proportional hazards model is used to assess the predictive value of the test.
- the tests with a univariate correlation of p ⁇ 0.05 are included in the multivariate Cox proportional hazard regression analysis. The best combination of these tests is selected by an automatic algorithm applied to a Cox proportional hazard model.
- diagnostic data collected by the implanted devices is observed, compared, and analyzed.
- the results of such analyses may lead to conclusions and insights that, in turn, could result in device programming that might be more favorable for an individual patient or patient subgroups compared to the settings originally chosen. If new aspects regarding optimization of treatment such as the programming of the devices arise, appropriate changes in treatment may be made that will provide a benefit to the patient(s).
- the correlations made between the results of the genetic analyses and the amount of ventricular and atrial arrhythmia which are statistically significant benefit patients by providing for more appropriate patient selection for ICD therapy.
- a method of determining the medical consequences of using ICD-based diagnostics is also provided.
- patient treatment using ICD-based diagnostics is evaluated along with the medical consequences of such treatment.
- the medical consequences of ICD-based rhythmic diagnostic data are evaluated. This analysis is performed using the subject follow-up CRFs. The determination is made by setting a value on diagnostic and treatment utility of the diagnostics based on the medical consequences.
- a method of evaluating the frequency of programming changes involving AF-prevention and AF-therapy algorithms triggered by device diagnostics is also provided.
- Device interrogations documented at the beginning and end of each subject follow-up examination are used to identify changes in device programming regarding AF-prevention and AF-therapy.
- a determination is made as to the frequency of changes in device programming.
- the frequency of pacing parameter programming changes and the resulting medical consequences is also evaluated.
- a determination is made of the medical consequences of such programming changes.
- ICD systems and ICD-based diagnostics may include certain potential risks. These risks may include, but are not limited to, the following types of events and medical consequences.
- Adverse events associated with ICD systems include, but are not limited to: acceleration of arrhythmia (caused by the ICD), inappropriate detection of tachy-arrhythmia, inappropriate therapy for tachy-arrhythmia including shocks, potential sudden death due to failure to detect and/or inability to defibrillate or pace, air embolism, bleeding, chronic nerve damage, erosion, excessive fibrotic tissue growth, extrusion, fluid accumulation, hematoma or cysts, infection, body rejection, keloid formation, lead abrasion and discontinuity, lead migration/dislodgement, movement of the device from its original location, myocardial damage, pain, pneumothorax, seroma, thromboemboli, venous occlusion, venous or cardiac perforation, shunting current or insulating myocardium during
- Patient conditions may also change. Even when there has been a satisfactory response to tachyarrhythmia therapies during clinically conducted electrophysiology studies, underlying or accompanying diseases or a change in anti-arrhythmic drug therapy may, over time, alter electrophysiologic characteristics of the heart. As a result of the changes, the programmed therapies may become ineffective and possibly dangerous, e.g., initiate an atrial tachyarrhythmia or accelerate a ventricular tachycardia to flutter or fibrillation. Changing patient conditions may also require modification of the ICD system due to factors such as increased defibrillation requirements, unacceptable sensing, elevated pacing thresholds, loss of pacing capture and diaphragmatic stimulation.
- potential adverse events related to the use of leads include, but are not limited to, the following patient related conditions: cardiac perforation, cardiac tamponade, constrictive pericarditis, embolism, endocarditis, fibrillation or other arrhythmia, heart wall rupture, hemothorax, infection, pneumothorax, thrombosis and tissue necrosis.
- Other potential adverse events related to the lead include, but are not limited to, the following: insulation failure, lead conductor or electrode fracture, lead dislodgement, and poor connection to the ICD. These may lead to oversensing, undersensing, or loss of therapy.
- risks have been minimized by the careful assessment of each subject prior to, during, and after implantation of the ICD.
- the devices contemplated by the invention have independently selectable parameters available to maximize the detection and/or rejection of tachyarrhythmia.
- the efficacy of programmed detection and therapies for the treatment of episodes of ventricular tachycardia is routinely evaluated prior to permanent implantation and programming of any device.
- the risk of failure to terminate an arrhythmia by the ICD is minimized by demonstrating an adequate defibrillation safety margin at the time of implant and the ability to select and deliver up to six therapies for detected episodes of ventricular tachycardia or fibrillation.
- Careful follow-up of patients receiving ICD systems also helps to minimize risks associated with the device (such as battery depletion) or associated with the patient (such as altered drug regimen). Patients are followed at regular intervals to confirm that the programmed parameters are appropriate and to monitor the implanted system. At each follow-up examination, the ICD is interrogated, and verification of an adequate pacing threshold margin is made as well as an evaluation of pacing and sensing characteristics.
- Telemetry reports such as device status data, episode counter data, therapy counter data, episode data reports, lead trend data, daily automatic lead measurements and Patient AlertTM reports provide information about the operation and status of the ICD system.
- Various programmable EGM recording sources can be useful for troubleshooting possible lead and connector problems.
- Specific SNPs can be used to predict SCA, or SCD, risk and to select to which drugs or device therapies a patients may be more or less likely to respond. Identification of therapies to which a subject is unlikely to respond allows for quicker access to a more appropriate drug or device therapy.
- the genetic information can be taken from a biological specimen containing the patient DNA to be used for SNP detection, or from a previously obtained genetic sequence specific to the given patient. Once it is determined that the given patient has a high risk for SCA, then evaluation of possible therapies can be performed.
- Specific anti-arrhythmic drugs and device therapies including ICD, cardiac resynchronization therapy, anti-tachycardiac pacing therapy and Subcutaneous ICD, or similar therapies can be assessed for their likely effect on the individual patient.
- a template can be generated by obtaining genomic DNA probes representing the SNPs of SEQ ID Nos. 1-849.
- Nested PCR can be used to generate a template for typing where amplifications could be performed using PCR Mastermix (Abgene, Inc., Rochester, NY).
- Primary PCRs can be carried out with 20 ng genomic DNA in 10 ⁇ l 1 ⁇ PCR Mastermix, 0.2 ⁇ M of primers, and 2 mM MgCl 2 with the following cycling conditions: 95°C for 5 min; 40 cycles at 95°C for 30 s, 58°C for 30 s, 72°C for 2 min 30 s; 72°C for 10 min.
- the product can then be diluted 1:500 in 1 ⁇ TE and re-amplified using asymmetric PCR.
- the amplified products can then be analyzed by gel electrophoresis and then used directly in a bead-based genotyping and haplotyping reaction.
- ASOs allele-specific oligonucleotides
- SNPs SEQ ID Nos. 1-849
- the ASO can be 25 nucleotides long with a 5' Uni-Link amino modifier where each ASO can be attached to a different colored bead.
- Genotyping can be performed in a 30 ⁇ l hybridization reaction containing 5 ⁇ l unpurified PCR product, 83 nM biotinylated sequence-specific oligonucleotide and beads corresponding to each allele of the SNPs of SEQ ID NO.'s 1-849 reacted in 1 ⁇ TMAC buffer (4.5 M TMAC, 0.15% Sarkosyl, 75 mM Tris-HCl, pH 8.0 and 6 mM EDTA, pH 8.0). The reactions can then be denatured at 95°C for 2 min and incubated at 54°C for 30 min.
Landscapes
- Chemical & Material Sciences (AREA)
- Life Sciences & Earth Sciences (AREA)
- Proteomics, Peptides & Aminoacids (AREA)
- Health & Medical Sciences (AREA)
- Organic Chemistry (AREA)
- Wood Science & Technology (AREA)
- Analytical Chemistry (AREA)
- Zoology (AREA)
- Genetics & Genomics (AREA)
- Engineering & Computer Science (AREA)
- Pathology (AREA)
- Immunology (AREA)
- Microbiology (AREA)
- Molecular Biology (AREA)
- Biotechnology (AREA)
- Biophysics (AREA)
- Physics & Mathematics (AREA)
- Biochemistry (AREA)
- Bioinformatics & Cheminformatics (AREA)
- General Engineering & Computer Science (AREA)
- General Health & Medical Sciences (AREA)
- Measuring Or Testing Involving Enzymes Or Micro-Organisms (AREA)
Applications Claiming Priority (2)
| Application Number | Priority Date | Filing Date | Title |
|---|---|---|---|
| US12/961,596 US20110143345A1 (en) | 2007-11-14 | 2010-12-07 | Genetic Markers for SCD or SCA Therapy Selection |
| US12/961,694 US20110143956A1 (en) | 2007-11-14 | 2010-12-07 | Diagnostic Kits and Methods for SCD or SCA Therapy Selection |
Publications (2)
| Publication Number | Publication Date |
|---|---|
| EP2463384A2 true EP2463384A2 (de) | 2012-06-13 |
| EP2463384A3 EP2463384A3 (de) | 2013-03-13 |
Family
ID=45346297
Family Applications (1)
| Application Number | Title | Priority Date | Filing Date |
|---|---|---|---|
| EP11192355A Withdrawn EP2463384A3 (de) | 2010-12-07 | 2011-12-07 | Diagnosekits, genetische Marker und Verfahren zur SCD- oder SCA-Therapieauswahl |
Country Status (1)
| Country | Link |
|---|---|
| EP (1) | EP2463384A3 (de) |
Cited By (1)
| Publication number | Priority date | Publication date | Assignee | Title |
|---|---|---|---|---|
| CN111593103A (zh) * | 2019-02-20 | 2020-08-28 | 葛猛 | 检测GNB3基因rs5443位点多态性的人工模拟核酸分子信标与试剂盒 |
Citations (2)
| Publication number | Priority date | Publication date | Assignee | Title |
|---|---|---|---|---|
| US6242181B1 (en) | 1996-05-14 | 2001-06-05 | Winfried Siffert | Methods for diagnosing hypertension by detecting a mutation in the human G protein β3 subunit gene |
| US6924100B2 (en) | 1998-09-10 | 2005-08-02 | Winfried Siffert | Gene alteration in the gene for the Gβ3-subunit of the human G protein |
Family Cites Families (2)
| Publication number | Priority date | Publication date | Assignee | Title |
|---|---|---|---|---|
| US20050287574A1 (en) * | 2004-06-23 | 2005-12-29 | Medtronic, Inc. | Genetic diagnostic method for SCD risk stratification |
| EP2222877A4 (de) * | 2007-11-14 | 2011-10-12 | Medtronic Inc | Genetische marker für die scd- oder sca-therapieauswahl |
-
2011
- 2011-12-07 EP EP11192355A patent/EP2463384A3/de not_active Withdrawn
Patent Citations (2)
| Publication number | Priority date | Publication date | Assignee | Title |
|---|---|---|---|---|
| US6242181B1 (en) | 1996-05-14 | 2001-06-05 | Winfried Siffert | Methods for diagnosing hypertension by detecting a mutation in the human G protein β3 subunit gene |
| US6924100B2 (en) | 1998-09-10 | 2005-08-02 | Winfried Siffert | Gene alteration in the gene for the Gβ3-subunit of the human G protein |
Non-Patent Citations (47)
Cited By (1)
| Publication number | Priority date | Publication date | Assignee | Title |
|---|---|---|---|---|
| CN111593103A (zh) * | 2019-02-20 | 2020-08-28 | 葛猛 | 检测GNB3基因rs5443位点多态性的人工模拟核酸分子信标与试剂盒 |
Also Published As
| Publication number | Publication date |
|---|---|
| EP2463384A3 (de) | 2013-03-13 |
Similar Documents
| Publication | Publication Date | Title |
|---|---|---|
| US20090131276A1 (en) | Diagnostic kits and methods for scd or sca therapy selection | |
| Andersen et al. | Diagnostic yield, interpretation, and clinical utility of mutation screening of sarcomere encoding genes in Danish hypertrophic cardiomyopathy patients and relatives | |
| US11312994B2 (en) | Methods and compositions for SCD, CRT, CRT-D, or SCA therapy identification and/or selection | |
| US20250127771A1 (en) | Methods of diagnosing and treating tourette syndrome | |
| Wahbi et al. | High cardiovascular morbidity and mortality in myofibrillar myopathies due to DES gene mutations: a 10-year longitudinal study | |
| US20100317006A1 (en) | Sca risk stratification by predicting patient response to anti-arrhythmics | |
| EP2118320A2 (de) | Genkarte von mit adhd assoziierten menschlichen genen | |
| CN104736723B (zh) | 用于预测对fgf‑18化合物的响应性的遗传标记 | |
| WO2014202541A1 (en) | Method for predicting a treatment response to a crhr1 antagonist and/or a v1b antagonist in a patient with depressive and/or anxiety symptoms | |
| US20110143956A1 (en) | Diagnostic Kits and Methods for SCD or SCA Therapy Selection | |
| US20050287574A1 (en) | Genetic diagnostic method for SCD risk stratification | |
| EP2463384A2 (de) | Diagnosekits, genetische Marker und Verfahren zur SCD- oder SCA-Therapieauswahl | |
| US20110143345A1 (en) | Genetic Markers for SCD or SCA Therapy Selection | |
| KR102158673B1 (ko) | 양극성장애 환자의 계절성 또는 일주기 변화 진단을 위한 단일염기다형성 마커를 이용한 정보 제공 방법 | |
| US20090092964A1 (en) | Methods for Individualizing Cardiovascular Disease Treatment Protocols Based on Beta-1 Adrenergic Receptor Haplotype | |
| Collyer et al. | Combining whole exome sequencing with in silico analysis and clinical data to identify candidate variants in pediatric left ventricular noncompaction | |
| WO2008010082A2 (en) | Diagnostic method for fibromyalgia (fms) or chronic fatigue syndrome (cfs) | |
| US20120309641A1 (en) | Diagnostic kits, genetic markers, and methods for scd or sca therapy selection | |
| US20150211066A1 (en) | Methods and Compositions for Correlating Genetic Markers with Sudden Cardiac Death Risk | |
| Sheldon et al. | Have we found the genetic signature for vasovagal syncope? | |
| Kamuli | The molecular genetics of familial cardiomyopathy | |
| List et al. | Arrhythmogenic Right Ventricular Cardiomyopathy Panel | |
| JP5791171B2 (ja) | 第1染色体長腕24領域、neurl遺伝子、またはcux2遺伝子の一塩基多型に基づく不整脈の検査方法 | |
| Wieneke et al. | Polymorphisms associated with ventricular tachyarrhythmias: rationale, design, and endpoints of the ‘diagnostic data influence on disease management and relation of genomics to ventricular tachyarrhythmias in implantable cardioverter/defibrillator patients (DISCOVERY)’study | |
| CA2577407A1 (en) | Genetic diagnostic method for scd risk stratification |
Legal Events
| Date | Code | Title | Description |
|---|---|---|---|
| PUAI | Public reference made under article 153(3) epc to a published international application that has entered the european phase |
Free format text: ORIGINAL CODE: 0009012 |
|
| AK | Designated contracting states |
Kind code of ref document: A2 Designated state(s): AL AT BE BG CH CY CZ DE DK EE ES FI FR GB GR HR HU IE IS IT LI LT LU LV MC MK MT NL NO PL PT RO RS SE SI SK SM TR |
|
| AX | Request for extension of the european patent |
Extension state: BA ME |
|
| RIC1 | Information provided on ipc code assigned before grant |
Ipc: C12Q 1/68 20060101AFI20121019BHEP Ipc: G06F 19/00 20110101ALI20121019BHEP |
|
| PUAL | Search report despatched |
Free format text: ORIGINAL CODE: 0009013 |
|
| AK | Designated contracting states |
Kind code of ref document: A3 Designated state(s): AL AT BE BG CH CY CZ DE DK EE ES FI FR GB GR HR HU IE IS IT LI LT LU LV MC MK MT NL NO PL PT RO RS SE SI SK SM TR |
|
| AX | Request for extension of the european patent |
Extension state: BA ME |
|
| RIC1 | Information provided on ipc code assigned before grant |
Ipc: C12Q 1/68 20060101AFI20130205BHEP Ipc: G06F 19/00 20110101ALI20130205BHEP |
|
| STAA | Information on the status of an ep patent application or granted ep patent |
Free format text: STATUS: THE APPLICATION IS DEEMED TO BE WITHDRAWN |
|
| 18D | Application deemed to be withdrawn |
Effective date: 20130914 |