EP2500865A2 - Appareil, procédé et programme de segmentation d'image - Google Patents
Appareil, procédé et programme de segmentation d'image Download PDFInfo
- Publication number
- EP2500865A2 EP2500865A2 EP12000945A EP12000945A EP2500865A2 EP 2500865 A2 EP2500865 A2 EP 2500865A2 EP 12000945 A EP12000945 A EP 12000945A EP 12000945 A EP12000945 A EP 12000945A EP 2500865 A2 EP2500865 A2 EP 2500865A2
- Authority
- EP
- European Patent Office
- Prior art keywords
- pixel
- image
- intensity
- edge
- weight
- Prior art date
- Legal status (The legal status is an assumption and is not a legal conclusion. Google has not performed a legal analysis and makes no representation as to the accuracy of the status listed.)
- Withdrawn
Links
Images





Classifications
-
- G—PHYSICS
- G06—COMPUTING OR CALCULATING; COUNTING
- G06T—IMAGE DATA PROCESSING OR GENERATION, IN GENERAL
- G06T7/00—Image analysis
- G06T7/10—Segmentation; Edge detection
- G06T7/11—Region-based segmentation
-
- G—PHYSICS
- G06—COMPUTING OR CALCULATING; COUNTING
- G06T—IMAGE DATA PROCESSING OR GENERATION, IN GENERAL
- G06T7/00—Image analysis
- G06T7/10—Segmentation; Edge detection
- G06T7/143—Segmentation; Edge detection involving probabilistic approaches, e.g. Markov random field [MRF] modelling
-
- G—PHYSICS
- G06—COMPUTING OR CALCULATING; COUNTING
- G06T—IMAGE DATA PROCESSING OR GENERATION, IN GENERAL
- G06T7/00—Image analysis
- G06T7/10—Segmentation; Edge detection
- G06T7/162—Segmentation; Edge detection involving graph-based methods
-
- G—PHYSICS
- G06—COMPUTING OR CALCULATING; COUNTING
- G06T—IMAGE DATA PROCESSING OR GENERATION, IN GENERAL
- G06T2207/00—Indexing scheme for image analysis or image enhancement
- G06T2207/10—Image acquisition modality
- G06T2207/10068—Endoscopic image
-
- G—PHYSICS
- G06—COMPUTING OR CALCULATING; COUNTING
- G06T—IMAGE DATA PROCESSING OR GENERATION, IN GENERAL
- G06T2207/00—Indexing scheme for image analysis or image enhancement
- G06T2207/20—Special algorithmic details
- G06T2207/20076—Probabilistic image processing
-
- G—PHYSICS
- G06—COMPUTING OR CALCULATING; COUNTING
- G06T—IMAGE DATA PROCESSING OR GENERATION, IN GENERAL
- G06T2207/00—Indexing scheme for image analysis or image enhancement
- G06T2207/20—Special algorithmic details
- G06T2207/20081—Training; Learning
Definitions
- the present invention relates to an image processing apparatus which divides an image into a plurality of areas, an image processing method, and an image processing program.
- an endoscope has been widely used as a medical observation device which is inserted to an inside of a body of a subject such as a patient and allows non-invasive observation of an inside of a lumen.
- a swallowable endoscope capsule endoscope which houses an imaging device, a communication device, and the like in an inside of a capsule-shaped casing and wirelessly transits image data captured by the imaging device to an outside of the body has also been used.
- An observation of and a diagnosis on the images obtained by the medical observation device are difficult tasks requiring a lot of experiences and efforts.
- the number of successive images (intraluminal images) obtained in one examination becomes huge (not less than several tens of thousands of images) in the case of a capsule endoscope, a burden imposed on a doctor who makes a diagnosis is heavy. Therefore, medical diagnosis supporting functions which assist a diagnosis by a doctor have been desired.
- an image recognition technique in which an abnormal site and the like are automatically detected from intraluminal images and an image which needs to be intensively diagnosed has been proposed.
- a predetermined segment is extracted by obtaining an energy function based on a probability indicating that pixel data shows a color in a predetermined segment and based on a relation between pixel data of pixels adjacent to each other (whether or not an edge is present between neighboring pixels) and minimizing the energy function in Japanese Patent Application Laid-Open No. 2007-172224 .
- the present invention has been achieved in view of the foregoing and an object of the present invention is to provide an image processing apparatus, an image processing method, and an image processing program by which a degradation of a performance in detecting a border can be suppressed in dividing an intraluminal image into a specific area such as a residue area.
- an image processing apparatus which divides an image into a plurality of areas, includes: a probability value calculator (16) that calculates, based on color feature data of a pixel included in the image, respective probabilities that the pixel belongs to the plurality of areas; a weighted edge intensity calculator (17; 21) that calculates a weighted edge intensity between neighboring pixels based on pixel values and color feature data of the pixel included in the image and a neighboring pixel of the pixel; an energy function creator (18) that uses the probabilities and the weighted edge intensity to create an energy function whose variable is a result of an area determination of the pixel; and an area divider (19) that divides the image into the plurality of areas based on the energy function.
- an image processing method performed by an image processing apparatus which divides an image into a plurality of areas includes steps of: calculating (S11), based on color feature data of a pixel included in the image, respective probabilities that the pixel belongs to the plurality of areas; calculating (S12) a weighted edge intensity between neighboring pixels based on pixel values and color feature data of the pixel included in the image and a neighboring pixel of the pixel; creating (S13) an energy function whose variable is a result of an area determination of the pixel by using the probabilities and the weighted edge intensity; and dividing (S14) the image into the plurality of areas based on the energy function.
- an image processing program causes a computer to execute an image processing of dividing an image into a plurality of areas and to execute steps of: calculating (S11), based on color feature data of a pixel included in the image, respective probabilities that the pixel belongs to the plurality of areas; calculating (S12) a weighted edge intensity between neighboring pixels based on pixel values and color feature data of the pixel included in the image and a neighboring pixel of the pixel; creating (S13) an energy function whose variable is a result of an area determination of the pixel by using the probabilities and the weighted edge intensity; and dividing (S14) the image into the plurality of areas based on the energy function.
- An image processing apparatus performs a processing of dividing, into a specific area and a non-specific area, an intraluminal image capturing an inside of a subject (inside of a lumen) by a medical observation device such as an endoscope and a capsule endoscope, for example.
- a medical observation device such as an endoscope and a capsule endoscope, for example.
- a mucus membrane area which is an observation target in a medical diagnosis is processed as the specific area and a residue area which is not treated as an observation target is processed as the non-specific area.
- the residue area means an area capturing, by having an overlap with a mucus membrane (more specifically on a near side from the mucus membrane) in a screen of the intraluminal image, a residue attaching on the mucus membrane or a residue floating away from the mucus membrane.
- the intraluminal image to which an image processing is performed in the embodiments below is, for example, a color image having a pixel level (pixel value) for each of color components red (R), green (G), and blue (B) in each pixel.
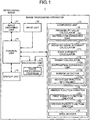
- FIG. 1 is a block diagram of a configuration of an image processing apparatus according to a first embodiment of the present invention.
- an image processing apparatus 1 is provided with a control unit 10 that controls operations of an entirety of the image processing apparatus 1, an image obtaining unit 11 that obtains image data of intraluminal images captured by a medical observation device, an input unit 12 that receives a signal input from an outside, a display unit 13 that displays a view including intraluminal images and information of various kinds, a recording unit 14, and a computing unit 15 that performs a computing processing in which a division into a residue area and a mucus membrane area is performed.
- the control unit 10 is realized by a hardware such as a CPU; reads programs of various kinds stored in the recording unit 14 to instruct units constituting the image processing apparatus 1, transmit data, and the like in accordance with image data input from the image obtaining unit 11, an operation signal input through the input unit 12, and the like; and overall controls entire operations of the image processing apparatus 1.
- the image obtaining unit 11 is arbitrarily configured depending on a mode of a system including a medical observation device.
- the medical observation device is a capsule endoscope and a portable recording medium is used for receiving and passing image data with the medical observation device
- the image obtaining unit 11 is configured by a reader to which the recording medium is detachably attached and which reads out image data of the stored intraluminal images.
- the image obtaining unit 11 is configured by a communication device and the like to be connected to the server and obtains the image data of the intraluminal images via data communication with the server.
- the image obtaining unit 11 may be configured by an interface arrangement and the like through which an image signal is input from the medical observation device such as an endoscope via a cable.
- the input unit 12 is, for example, realized by a keyset, a mouse, a touchscreen, switches of various kinds, and the like and outputs an input signal having received from the outside to the control unit 10.
- the display unit 13 is realized by a display device such as an LCD and an EL display.
- the recording unit 14 is realized by IC memories of various kinds including a ROM and a RAM such as a flash memory in which editing and recording functions are allowed, an internal or external hard disk, an information recording medium such as a CD-ROM and the information-recording-medium-dedicated reader in combination, and the like.
- the recording unit 14 stores programs which enable the image processing apparatus 1 to operate and to execute various functions, data to be used while the programs are executed, and the like in addition to the image data of the intraluminal images obtained by the image obtaining unit 11.
- the recording unit 14 stores an image processing program 141 which enables an area division into a residue area and a mucus membrane area.
- the computing unit 15 is realized by a hardware such as a CPU and reads the image processing program 141 to perform various computing processing for the division done by processing the image data of the intraluminal images and identifying the residue area and the mucus membrane area.
- the computing unit 15 is provided with a probability value calculator 16, a weighted edge intensity calculator 17, an energy function creator 18, and an area divider 19.
- the probability value calculator 16 calculates, based on color feature data of each of the pixels included in an intraluminal image, a probability that each pixel belongs to a residue area and a probability that each pixel belongs to a mucus membrane area in the image. More specifically, the probability value calculator 16 is provided with a distribution estimating unit 161 that estimates a distribution of color feature data of a pixel belonging to the residue area and a distribution of color feature data of a pixel belonging to the mucus membrane area based on the color feature data of the pixel, and calculates respective probabilities that each pixel belongs to the residue area and the mucus membrane area based on the estimated two distributions (frequencies) of the color feature data.
- the weighted edge intensity calculator 17 calculates a weighted edge intensity between pixels adjacent to each other based on pixel values and color feature data of a pixel included in an intraluminal image and of another pixel adjacent to the pixel (neighboring pixel). More specifically, the weighted edge intensity calculator 17 is provided with an edge intensity calculator 171 that calculates an edge intensity based on pixel values of the pixel included in the intraluminal image and of the neighboring pixel and a weight calculator 172 that calculates a weight to be given to the calculated edge intensity based on the color feature data of the pixel included in the intraluminal image and of the neighboring pixel.
- the weight calculator 172 includes a distribution estimating unit 172a that estimates a distribution of color feature data of a pixel belonging to the residue area and a distribution of color feature data of a pixel belonging to the mucus membrane area based on the color feature data of the pixel included in the intraluminal image; a border detector 172b that detects a border between the color feature data distribution of the residue area and the color feature data distribution of the mucus membrane area; and a weight distribution setting unit 172c that sets a weight distribution which allows a value for weight to become maximum at the border of the distributions, and sets a function corresponding to the set weight distribution as a weight function.
- the energy function creator 18 uses the respective probabilities that each pixel in an intraluminal image 100 belongs to the residue area and the mucus membrane area and the weighted edge intensity between each pixel and its neighboring pixel to create an energy function expressed by a result of a determination on which area each pixel belongs to. More specifically, the energy function creator 18 is provided with a first energy function creator 181 that creates a first energy function based on the probabilities calculated for each pixel and a second energy function creator 182 that creates a second energy function based on the weighted edge intensity between neighboring pixels, and sets a sum of the first and the second energy functions as an energy function.
- the area divider 19 calculates an area determination result which minimizes the energy function and divides the intraluminal image into the residue area and the mucus membrane area.
- FIG. 2 is a flowchart of an operation of the image processing apparatus 1.
- FIG. 3 schematically shows an example of an intraluminal image captured by a capsule endoscope and processed by the image processing apparatus 1.
- the computing unit 15 obtains the intraluminal image 100 as a processing target from the recording unit 14.
- the intraluminal image 100 includes a residue area 101 and a mucus membrane area 102. Since four corners of the intraluminal image 100 do not have effectual information about a subject, a masking treatment is applied in advance.
- the probability value calculator 16 calculates respective probabilities that each pixel in the intraluminal image 100 belongs the residue area and the mucus membrane area based on color feature data of the pixel included in the intraluminal image 100.
- a hue value is used as the color feature data.
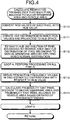
- FIG. 4 is a flowchart of a detailed operation of the probability value calculator 16 at step S11.
- the probability value calculator 16 converts RGB values of each pixel in the intraluminal image 100 into a hue value.
- a method for the conversion into the hue value it is only necessary to use a known conversion equation in an HSI conversion (reference: Digital image processing, pp.64-67, COMPUTER GRAPHIC ARTS SOCIETY ).
- the probability value calculator 16 creates a hue distribution in which RGB values are projected to a feature space (a hue space) formed by a single axis for hue based on the hue value of each pixel.
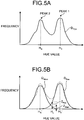
- FIG. 5A is a histogram of a hue distribution created in this manner.
- a hue distribution D T0T represents a diphasic form having two peaks (peak 1 and peak 2) respectively corresponding to a residue's center hue H Y and a mucus membrane's center hue H R when both the residue area 101 and the mucus membrane area 102 are present in the intraluminal image 100.
- the distribution estimating unit 161 estimates a hue distribution of a pixel belonging to the residue area 101 and a hue distribution of a pixel belonging to the mucus membrane area 102 by applying a mixed normal distribution formed of two normal distributions to the hue distribution D T0T .
- the mixed normal distribution can be obtained by using a known method such as an expectation-maximization (EM) algorithm, for example.
- EM expectation-maximization
- the EM algorithm is a computing method of estimating parameters by calculating an expectation of a likelihood of a model based on certain parameters and calculating parameters maximizing the calculated expectation repetitively.
- FIG. 5B shows hue distributions of the respective areas estimated with respect to the hue distribution D T0T (the distributions being hereinafter referred to as "estimated distributions".
- an estimated distribution D Res whose average is a hue value H Y ' (H Y ' ⁇ H Y ) is a hue distribution of a pixel which is estimated to belong to the residue area 101.
- an estimated distribution D Mem whose average is a hue value H R ' (H R ' ⁇ H R ) is a hue distribution of a pixel which is estimated to belong to the mucus membrane area 102.
- the distribution estimating unit 161 records the estimated distributions D Res and D Mem in the recording unit 14.
- the probability value calculator 16 then executes a processing of a loop A on each pixel included in the intraluminal image 100.
- the probability value calculator 16 obtains frequency values in the two estimated distributions D Res and D Mem with respect to the hue value of each pixel.
- the probability value calculator 16 calculates a probability that the pixel belongs to the residue area 101 and a probability that the pixel belongs to the mucus membrane area 102 based on a ratio of the obtained frequency values.
- a frequency value in the estimated distribution D Res is Z Res and a frequency value in the estimated distribution D Mem is Z Mem .
- a probability P u (Res) that the pixel u belongs to the residue area 101 and a probability P u (Mem) that the pixel u belongs to the mucus membrane area 102 are provided by following equations (1) and (2), respectively.
- P u Res Z Res / Z Mem + Z Res
- P u Mem Z Mem / Z Mem + Z Res
- the weighted edge intensity calculator 17 calculates a weighted edge intensity between pixels adjacent to each other (between neighboring pixels) based on the pixel values and the color feature data of each pixel in the intraluminal image 100.
- the reason why the edge intensity between neighboring pixels is provided with a weight is as follows. Specifically, in the case of calculating an edge intensity by a general Sobel filter and the like, an edge of a groove 104 in the mucus membrane and the like is detected with high intensity other than the border (hereinafter referred to as a "residue border") 103 between the residue area 101 and the mucus membrane area 102. Therefore, the edge intensity of the residue border 103 becomes low relatively, which causes a failure in detecting the residue border 103 appropriately.
- an edge indicating the residue border 103 is configured to have a higher intensity value to be emphasized more than other edges by focusing an attention on a difference in color between the residue area 101 and the mucus membrane area 102 and giving a weight to an edge intensity based on color feature data (hue in the first embodiment).
- FIG. 6 is a flowchart of a detailed operation of the weighted edge intensity calculator 17 at step S12.
- the distribution estimating unit 172a obtains a hue distribution of a pixel estimated to be included in the residue area 101 and a hue distribution of a pixel estimated to be included in the mucus membrane area 102 based on the hue value of the pixel in the intraluminal image 100. Since the estimating processing has already been performed by the probability value calculator 16 in the first embodiment, the distribution estimating unit 172a obtains the estimated hue distributions (specifically, the estimated distributions D Mem and D Res shown in FIG. 5B ) from the recording unit 14.
- the distribution estimating unit 172a may estimate respective hue distributions in the residue area 101 and the mucus membrane area 102 via the same processing as steps S110 to S112 shown in FIG. 4 .
- the border detector 172b detects a border BOR (hereinafter referred to as a "hue border”) at which the frequency value of the estimated distribution D Res and the frequency value of the estimated distribution D Mem become comparable with each other (see FIG. 7 ).
- a border border hereinafter referred to as a "hue border”
- H BOR hue value of the residue border 103 in an actual image space
- a border therebetween does not necessarily accord with the actual residue border 103.
- the weight distribution setting unit 172c creates a weight distribution D W in which a value at the hue border BOR becomes maximum and sets a function corresponding to the weight distribution as a weight function f W .
- the weight distribution D W may be anything as long as the distribution marks a maximum value at the hue border BOR and values (at least two values) in the distribution vary depending on a distance from the hue border BOR in the hue space.
- the distribution may be a normal distribution whose average is the hue value H BOR , a distribution which has a stepwise pattern and presents a maximum value at the hue border BOR, or a distribution which has a triangular shape and presents a peak at the hue border BOR, for example.
- a normal distribution whose average is the hue value H BOR is created as the weight distribution D W as shown in FIG. 7 .
- an arbitrary value may be determined in advance as a dispersion in the weight distribution D W .
- the weight distribution D W may have a symmetric shape or an asymmetric shape with respect to the hue border BOR.
- the latter case may be realized, for example, by creating a distribution which shows a normal distribution in which an average is the hue value H BOR and has a dispersion equal to the dispersion of the estimated distribution D Res at a side of the estimated distribution D Res ; and a normal distribution in which an average is the hue value H BOR and has a dispersion equal to the dispersion of the estimated distribution D Mem at a side of the estimated distribution D Mem across the hue border BOR.
- the weight distribution setting unit 172c may create a data table in which a hue value and a weight are associated with each other instead of setting the weight function f W .
- the weighted edge intensity calculator 17 executes a processing of a loop B on each pixel included in the intraluminal image 100.
- the edge intensity calculator 171 calculates a difference Diff(u, v) in a value for "R" between the pixel u and a neighboring pixel v in the intraluminal image 100 ("v” being an index which discerns the neighboring pixel).
- v being an index which discerns the neighboring pixel.
- the reason of calculating the difference in the value for "R” is that the value for "R” is likely to show a difference between the residue area 101 and the mucus membrane area 102 since the residue area 101 and the mucus membrane area 102 have respective absorbances different from each other with respect to a wavelength corresponding to the value for "R".
- the edge intensity calculator 171 calculates an average value H AVE of a hue value H u of the pixel u and a hue value H v of the neighboring pixel v.
- the weight calculator 172 calculates a weight W(u, v) corresponding to the average value H AVE from the weight function f W and calculates a weighted edge intensity Edge(u, v) obtained by following equation (3) by using the weight W(u, v) and the difference Diff(u, v).
- Edge u , v W u , v ⁇ Diff u , v
- the weight calculator 172 may extract the weight W(u, v) from the data table.
- weighted edge intensity calculator 17 executes the processing of the loop B on all the pixels in the intraluminal image 100, the operation returns to the main routine.
- the energy function creator 18 creates an energy function E(X) based on the probabilities P u (Res) and P u (Mem) calculated at step S11 and the weighted edge intensity Edge(u, v) calculated at step S12.
- the energy function E(X) is a function whose variable is a class determination result X with respect to all the pixels in the intraluminal image 100.
- the class determination result X indicates a result of determining which each pixel belongs to, the residue area 101 or the mucus membrane area 102 and there are 2 n combinations when the number of pixels in the intraluminal image 100 is n.
- the energy function E(X) is expressed by a sum of a first energy function E1(X) calculated based on the respective probabilities that each pixel is included in respective areas and a second energy function E2(X) calculated based on the weighted edge intensity of each pixel as shown in following equation (4).
- E X ⁇ ⁇ E ⁇ 1 X + ⁇ ⁇ E ⁇ 2 X
- symbols " ⁇ " and " ⁇ " are arbitrary coefficients (constants).
- the first energy function E1(X) is obtained by following equation (5).
- E ⁇ 1 X ⁇ u ⁇ U - ln P u X u
- a symbol "X u " indicates a class determination result with respect to the pixel u
- a symbol "P u (X u )" indicates a probability that the pixel u belongs to a class X u
- a symbol "U” indicates a set of all the pixels in the intraluminal image 100.
- the more probable area means an area presenting a larger value in the probability P u (Mem) or the probability P u (Res). Therefore, the larger the number of pixels belonging to more probable area is, the smaller a total value in the first energy function E1(X) becomes.
- a symbol "D” indicates a combination of all neighboring pixels (u, v).
- a symbol " ⁇ (X u , X v )" represents a function showing a combination of a determination result in neighboring pixels and is obtained by following equation (7).
- a value for a member "exp ⁇ -Edge(u, v) ⁇ " at a right-hand side of equation (6) becomes smaller as a value for the weighted edge intensity Edge(u, v) between neighboring pixels is larger. Therefore, the larger the difference Diff(u, v) between the neighboring pixels in which the residue border 103 is determined to be present or the closer to the hue border BOR the neighboring pixels (u, v) in which the residue border 103 is determined to be present are, the smaller a total value in the second energy function E2(X) becomes.
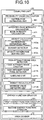
- the area divider 19 obtains the class determination result X which enables optimizing (minimizing) the energy function E(X) and divides the intraluminal image 100 based on the class determination result X. By this division, the intraluminal image 100 from which the residue area 101 is eliminated can be obtained as shown in FIG. 9 , for example.
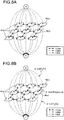
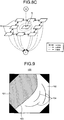
- a directed graph which is constituted by a node N corresponding to each pixel in the intraluminal image 100; nodes S and T respectively corresponding to the classes to which each pixel can belong (i.e., the residue area 101 and the mucus membrane area 102 as the determination result); an n-link which connects neighboring nodes N, for example, a node N(u) and a node N(v) (each of u and v being an index which discerns each pixel); an s-link which connects the node N and the node S; and a t-link which connects the node N and the node T as shown in FIG. 8A .
- the node S and the node T are set as the residue area and the mucus membrane area, respectively.
- a cost based on the probabilities calculated at step S11 and the weighted edge intensity calculated at step S12 is provided to each link.
- a cost ⁇ exp ⁇ -Edge(u, v) ⁇ based on the inter-neighboring-pixel weighted edge intensity Edge(u, v) is provided to the n-link as shown in FIG. 8B .
- the directed graph is divided into two sets, one of which includes the node S and the other of which includes the node T.
- the division processing is performed so that a summation of costs provided to the cut links becomes minimum.
- This represents searching a route in which a flow from the node S to the node T becomes maximum and cutting a link whose redundant capacity in route is run out (minimum cost and maximum flow algorithm).
- a set of node N connected to the node S and a set of node N connected to the node T are obtained as shown in FIG. 8C , for example.
- the summation of the costs provided to the links cut in this manner corresponds to a value of the energy function E(X) to which the class determination result X corresponding to this division result is input.
- an area division result enabling the value of the energy function E(X) to become minimum can be obtained by cutting the directed graph so that the summation of costs becomes minimum.
- any other functions may be used as long as the function is a decreasing function whose variable is the probability P u (X u ).
- any other functions may be used as long as the function is a decreasing function whose variable is the weighted edge intensity Edge(u, v).
- the probability value calculator 16 uses the estimated distributions D Res and D Mem to calculate the probability P u (Res) and the probability P u (Mem) that each pixel belongs to the residue area 101 and the mucus membrane area 102 respectively at step S11, any methods other than this may be adopted as long as a probability based on color feature data can be obtained.
- a data table in which pixel values (RGB values) or a hue value obtained via a conversion of the pixel values and the probabilities P u (Res) and P u (Mem) are associated may be recorded in the recording unit 14 in advance and the probabilities P u (Res) and P u (Mem) in each pixel in the intraluminal image 100 may be obtained by referring to the data table.
- An image processing apparatus is provided with a computing unit 20 shown in FIG. 10 instead of the computing unit 15 shown in FIG. 1 .
- the other configuration is the same as that shown in FIG. 1 .
- the computing unit 20 is provided with the probability value calculator 16, a weighted edge intensity calculator 21, the energy function creator 18, and the area divider 19. Among these components, the configuration and the operations of the probability value calculator 16, the energy function creator 18, and the area divider 19 are the same as those in the first embodiment.
- the weighted edge intensity calculator 21 is further provided with a high-intensity edge area detector 211 and a weight recalculator 212 in addition to the edge intensity calculator 171 and the weight calculator 172.
- the configuration and the operations of the edge intensity calculator 171 and the weight calculator 172 are the same as those in the first embodiment.
- the high-intensity edge area detector 211 detects a high-intensity edge area whose edge intensity is high based on values of pixels included in the intraluminal image 100. More specifically, the high-intensity edge area detector 211 is provided with an edge intensity image creator 211a that creates an edge intensity image based on an edge intensity between neighboring pixels; a high-intensity edge pixel detector 211b that detects a high-intensity edge pixel from the edge intensity image; and a labeling unit 211c that unites high-intensity edge pixels adjacent to each other to perform a labeling thereon, and detects the united high-intensity edge pixels as a high-intensity edge area.
- an edge intensity image creator 211a that creates an edge intensity image based on an edge intensity between neighboring pixels
- a high-intensity edge pixel detector 211b that detects a high-intensity edge pixel from the edge intensity image
- the weight recalculator 212 recalculates a weight to be provided to the edge intensity between neighboring pixels in the high-intensity edge area with respect to the weight calculated by the weight calculator 172.
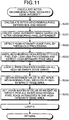
- FIG. 11 is a flowchart of the operation of the computing unit 20 at step S12.
- a processing on an intraluminal image 110 shown in FIG. 12 will be taken as an example.
- the intralumianl image 110 includes a residue area 111 and a mucus membrane area 112.
- the intralumianl image 110 also captures a groove 114 in a mucus membrane in addition to a residue border 113.
- the weighted edge intensity calculator 21 calculates a difference Diff(u, v) between neighboring pixels and a weight W(u, v) to be provided to the difference Diff(u, v).
- the operation at step S220 is equivalent to steps S120 to S125 shown in FIG. 6 .
- the high-intensity edge pixel detector 211b performs a threshold processing on the edge intensity image to detect a high-intensity edge pixel whose edge intensity is higher than a predetermined threshold.
- FIG. 14 shows an image having high-intensity edge pixels detected in this manner.
- a high-intensity edge pixel group 121 is equivalent to the residue border 113 shown in FIG. 12 and high-intensity edge pixel groups 122a to 122c are equivalent to the groove 114 shown in FIG. 12 .
- high-intensity edge pixel groups 123a to 123c attributed to a partial change in hue are detected in the residue area 111.
- the labeling unit 211c performs a labeling processing on the image 120 having high-intensity edge pixels and sets a high-intensity edge area by assigning the same label to the high-intensity edge pixels adjacent to each other. Specifically, labels different from each other are assigned to the high-intensity edge pixel groups 121, 122a to 122c, and 123a to 123c shown in FIG. 14 . As a result of this, the high-intensity edge pixel groups 121, 122a to 122c, and 123a to 123c are each set as a high-intensity edge area.
- a maximum value obtaining unit 212a obtains a weight W MAX which becomes maximum in the weights W(u, v) between neighboring pixels in each of the high-intensity edge areas in the intraluminal image 110.
- the weight recalculator 212 sets again the maximum value in weight W MAX as a weight to be provided to all the inter-neighboring-pixel edge intensities in each of the high-intensity edge areas.
- a weight to be provided to an edge intensity is set to be high with respect to pixels locating at a border position of an area (an area 131, for example) whose hue is close to H BOR (pixels at an upper side in the high-intensity edge pixel group 121 shown in FIG. 14 and the high-intensity edge pixel group 123a, for example).
- a weight to be provided to an edge intensity is set to be small with respect to pixels locating at a border position of an area (an area 132, for example) whose hue is distant from H BOR (pixels at a lower side in the high-intensity edge pixel group 121, for example).
- an area corresponding to the pixels at the lower side of the high-intensity edge pixel group 121 is not recognized as a residue border and an area corresponding to the high-intensity edge pixel group 123a to which the weight is set to be high is instead detected as a residue border wrongly.
- a weight to be provided to an edge intensity is offset by focusing an attention on a continuity of the residue border 113 and uniformly setting the maximum value in weight W MAX with respect to pixels constituting the same coupled component.
- the weight recalculator 212 executes the processing of the loop C on all the high-intensity edge areas, the operation returns to the main routine.
- the detected high-intensity edge pixels are united via the labeling processing to set a high-intensity edge area, and a maximum value in weight in the high-intensity edge area is applied as a weight to be provided to edge intensities of the other neighboring pixels in the same high-intensity edge area.
- a kind of images and an area as a detection target are not limited to the first and the second embodiments and the modification and it is possible to perform an area division as long as the area includes a difference in a feature of color information.
- the present invention can be applied to a case of dividing an image into three or more areas.
- a case where there is a definite difference in a feature of color information among a plurality of detection targets for example, probabilities that each pixel belongs to respective areas and a weight to be provided to an edge intensity are calculated based on color feature data of respective detection targets to deal with a minimization problem with multiple values (reference: Yasushi Yagi, et al., Computer vision leading edge guide 1, pp. 54-59, Advanced Communication Media Co., Ltd. , for example).
- the area division into two areas explained in the first and the second embodiments may be performed repetitively by changing parameters of color feature data to perform the division into three or more areas.
- hue is used as color feature data in the first and the second embodiments and the modification, other color feature data (color saturation, luminosity, color difference, and the like) may be used.
- the image processing apparatus can be realized by having a computer system such as a personal computer and a workstation execute an image processing program recorded in a recording medium.
- the computer system may be used by connecting devices including another computer system, a server, and the like via public lines such as a local area network (LAN), a wide area network (WAN), or the Internet.
- LAN local area network
- WAN wide area network
- the image processing apparatus may obtain image data of intraluminal images via these networks, output a result of an image processing to an output device of various kinds (a viewer, a printer, and the like) connected via these networks, and store the result of the image processing in a storage device (a recording medium, a recording-medium-dedicated reader, and the like) connected via these networks.
- a storage device a recording medium, a recording-medium-dedicated reader, and the like
- the present invention is not limited to the first and the second embodiments and the modification and various inventions may be formed by arbitrarily combining a plurality of constituents disclosed in the embodiments and the modification. For example, some constituents may be eliminated among all the constituents shown in the embodiment and the modification or constituents separately shown in different embodiments and modification may be arbitrarily combined to form an invention.
Landscapes
- Engineering & Computer Science (AREA)
- Physics & Mathematics (AREA)
- Computer Vision & Pattern Recognition (AREA)
- General Physics & Mathematics (AREA)
- Theoretical Computer Science (AREA)
- Probability & Statistics with Applications (AREA)
- Software Systems (AREA)
- Image Analysis (AREA)
- Endoscopes (AREA)
Applications Claiming Priority (1)
| Application Number | Priority Date | Filing Date | Title |
|---|---|---|---|
| JP2011058577A JP5766986B2 (ja) | 2011-03-16 | 2011-03-16 | 画像処理装置、画像処理方法、及び画像処理プログラム |
Publications (2)
| Publication Number | Publication Date |
|---|---|
| EP2500865A2 true EP2500865A2 (fr) | 2012-09-19 |
| EP2500865A3 EP2500865A3 (fr) | 2016-04-13 |
Family
ID=45654997
Family Applications (1)
| Application Number | Title | Priority Date | Filing Date |
|---|---|---|---|
| EP12000945.1A Withdrawn EP2500865A3 (fr) | 2011-03-16 | 2012-02-14 | Appareil, procédé et programme de segmentation d'image |
Country Status (4)
| Country | Link |
|---|---|
| US (1) | US9165370B2 (fr) |
| EP (1) | EP2500865A3 (fr) |
| JP (1) | JP5766986B2 (fr) |
| CN (1) | CN102737374B (fr) |
Cited By (2)
| Publication number | Priority date | Publication date | Assignee | Title |
|---|---|---|---|---|
| US10963988B2 (en) * | 2018-09-25 | 2021-03-30 | Fujifilm Corporation | Image processing device, image processing system, image processing method, and program |
| CN117197166A (zh) * | 2023-11-06 | 2023-12-08 | 中南大学 | 基于边缘和邻域信息的息肉图像分割方法及成像方法 |
Families Citing this family (8)
| Publication number | Priority date | Publication date | Assignee | Title |
|---|---|---|---|---|
| JP5881625B2 (ja) * | 2013-01-17 | 2016-03-09 | 富士フイルム株式会社 | 領域分割装置、プログラムおよび方法 |
| JP6176978B2 (ja) * | 2013-01-31 | 2017-08-09 | オリンパス株式会社 | 内視鏡用画像処理装置、内視鏡装置、内視鏡用画像処理装置の作動方法及び画像処理プログラム |
| WO2018155560A1 (fr) | 2017-02-24 | 2018-08-30 | 富士フイルム株式会社 | Système d'endoscope, dispositif de type processeur, et procédé de fonctionnement d'un système d'endoscope |
| TWI768096B (zh) * | 2017-08-25 | 2022-06-21 | 瑞士商西克帕控股有限公司 | 光學效果層、用於產生此光學效果層的裝置及進程、及此裝置的使用方法 |
| CN110020354B (zh) * | 2017-09-30 | 2021-02-26 | 北京国双科技有限公司 | 点击热力图异常检测方法及装置 |
| US11521319B2 (en) | 2018-02-07 | 2022-12-06 | Hoya Corporation | Endoscope system |
| WO2019187206A1 (fr) * | 2018-03-27 | 2019-10-03 | オリンパス株式会社 | Dispositif de traitement d'image, système d'endoscope de type capsule, procédé de fonctionnement de dispositif de traitement d'image et programme de fonctionnement de dispositif de traitement d'image |
| WO2020195246A1 (fr) * | 2019-03-28 | 2020-10-01 | ソニー株式会社 | Dispositif d'imagerie, procédé d'imagerie et programme |
Citations (2)
| Publication number | Priority date | Publication date | Assignee | Title |
|---|---|---|---|---|
| JP2007172224A (ja) | 2005-12-21 | 2007-07-05 | Sony Corp | 画像処理方法、その装置およびそのプログラム |
| US20100124365A1 (en) * | 2008-11-14 | 2010-05-20 | Olympus Corporation | Image display device, computer readable storage medium storing image processing program, and image processing method |
Family Cites Families (16)
| Publication number | Priority date | Publication date | Assignee | Title |
|---|---|---|---|---|
| JP3512885B2 (ja) * | 1995-01-20 | 2004-03-31 | 株式会社東芝 | 画像処理方法及びその装置 |
| US6434261B1 (en) * | 1998-02-23 | 2002-08-13 | Board Of Regents, The University Of Texas System | Method for automatic detection of targets within a digital image |
| US6697497B1 (en) * | 1998-12-22 | 2004-02-24 | Novell, Inc. | Boundary identification and characterization through density differencing |
| US7892169B2 (en) * | 2000-07-21 | 2011-02-22 | Olympus Corporation | Endoscope apparatus |
| EP1353516A1 (fr) * | 2002-04-08 | 2003-10-15 | Mitsubishi Electric Information Technology Centre Europe B.V. | Méthode et appareil de détection et/ou de suivi d'une ou de plusieurs zones colorées dans une image ou une séquence d'images |
| US7260250B2 (en) * | 2002-09-30 | 2007-08-21 | The United States Of America As Represented By The Secretary Of The Department Of Health And Human Services | Computer-aided classification of anomalies in anatomical structures |
| US7630530B2 (en) * | 2005-01-14 | 2009-12-08 | Siemens Medical Solutions Usa, Inc. | System and method for fast tensor field segmentation |
| JP4624841B2 (ja) * | 2005-04-13 | 2011-02-02 | オリンパスメディカルシステムズ株式会社 | 画像処理装置および当該画像処理装置における画像処理方法 |
| JP4624842B2 (ja) * | 2005-04-13 | 2011-02-02 | オリンパスメディカルシステムズ株式会社 | 画像処理方法、画像処理装置及びプログラム |
| US7577283B2 (en) * | 2005-09-30 | 2009-08-18 | Given Imaging Ltd. | System and method for detecting content in-vivo |
| JP5121204B2 (ja) * | 2006-10-11 | 2013-01-16 | オリンパス株式会社 | 画像処理装置、画像処理方法、および画像処理プログラム |
| US20080118136A1 (en) * | 2006-11-20 | 2008-05-22 | The General Hospital Corporation | Propagating Shell for Segmenting Objects with Fuzzy Boundaries, Automatic Volume Determination and Tumor Detection Using Computer Tomography |
| US20100046816A1 (en) * | 2008-08-19 | 2010-02-25 | Igual-Munoz Laura | Method for automatic classification of in vivo images |
| US8620077B1 (en) * | 2009-01-26 | 2013-12-31 | Google Inc. | Spatio-temporal segmentation for video |
| JP2011034178A (ja) * | 2009-07-30 | 2011-02-17 | Sony Corp | 画像処理装置および画像処理方法、並びにプログラム |
| US8331669B2 (en) * | 2009-08-25 | 2012-12-11 | Siemens Aktiengesellschaft | Method and system for interactive segmentation using texture and intensity cues |
-
2011
- 2011-03-16 JP JP2011058577A patent/JP5766986B2/ja active Active
-
2012
- 2012-02-14 EP EP12000945.1A patent/EP2500865A3/fr not_active Withdrawn
- 2012-02-15 US US13/396,844 patent/US9165370B2/en active Active
- 2012-03-14 CN CN201210066947.3A patent/CN102737374B/zh active Active
Patent Citations (2)
| Publication number | Priority date | Publication date | Assignee | Title |
|---|---|---|---|---|
| JP2007172224A (ja) | 2005-12-21 | 2007-07-05 | Sony Corp | 画像処理方法、その装置およびそのプログラム |
| US20100124365A1 (en) * | 2008-11-14 | 2010-05-20 | Olympus Corporation | Image display device, computer readable storage medium storing image processing program, and image processing method |
Non-Patent Citations (3)
| Title |
|---|
| "Digital image processing", COMPUTER GRAPHIC ARTS SOCIETY, pages 64 - 67 |
| Y. BOYKOV; M. JOLLY: "Interactive Graph Cuts for Optimal Boundary & Region Segmentation of Objects in N-D Images", PROCEEDING OF ''INTERNATIONAL CONFERENCE ON COMPUTER VISION, vol. 1, July 2001 (2001-07-01), pages 105 - 112, XP010553969 |
| YASUSHI YAGI ET AL.: "Computer vision leading edge guide", vol. 1, ADVANCED COMMUNICATION MEDIA CO., LTD., pages: 54 - 59 |
Cited By (3)
| Publication number | Priority date | Publication date | Assignee | Title |
|---|---|---|---|---|
| US10963988B2 (en) * | 2018-09-25 | 2021-03-30 | Fujifilm Corporation | Image processing device, image processing system, image processing method, and program |
| CN117197166A (zh) * | 2023-11-06 | 2023-12-08 | 中南大学 | 基于边缘和邻域信息的息肉图像分割方法及成像方法 |
| CN117197166B (zh) * | 2023-11-06 | 2024-02-06 | 中南大学 | 基于边缘和邻域信息的息肉图像分割方法及成像方法 |
Also Published As
| Publication number | Publication date |
|---|---|
| US20120237122A1 (en) | 2012-09-20 |
| CN102737374A (zh) | 2012-10-17 |
| JP2012192051A (ja) | 2012-10-11 |
| EP2500865A3 (fr) | 2016-04-13 |
| US9165370B2 (en) | 2015-10-20 |
| JP5766986B2 (ja) | 2015-08-19 |
| CN102737374B (zh) | 2016-09-28 |
Similar Documents
| Publication | Publication Date | Title |
|---|---|---|
| EP2500865A2 (fr) | Appareil, procédé et programme de segmentation d'image | |
| EP2523164B1 (fr) | Appareil de traitement d'images numériques, procédé de traitement d'images numériques et programme de traitement d'images numériques | |
| Zhang et al. | Automation‐assisted cervical cancer screening in manual liquid‐based cytology with hematoxylin and eosin staining | |
| US20230005140A1 (en) | Automated detection of tumors based on image processing | |
| Tulsani et al. | Segmentation using morphological watershed transformation for counting blood cells | |
| US10192099B2 (en) | Systems and methods for automated screening and prognosis of cancer from whole-slide biopsy images | |
| US11900592B2 (en) | Method, device, and storage medium for pancreatic mass segmentation, diagnosis, and quantitative patient management | |
| EP2557539B1 (fr) | Appareil de traitement d'images numériques, procédé de traitement d'images numériques et programme de traitement d'images numériques | |
| CN102724909B (zh) | 医用图像处理装置和医用图像处理方法 | |
| Javed et al. | An intelligent saliency segmentation technique and classification of low contrast skin lesion dermoscopic images based on histogram decision | |
| EP2565846A1 (fr) | Détéction des lésions intraluminales par classification des couleurs des pixels | |
| US11357435B2 (en) | Automatic extraction of disease-specific features from doppler images | |
| EP3971762A1 (fr) | Procédé, dispositif et système de traitement d'image | |
| US20060204953A1 (en) | Method and apparatus for automated analysis of biological specimen | |
| Wighton et al. | A fully automatic random walker segmentation for skin lesions in a supervised setting | |
| Maiora et al. | Abdominal CTA image analisys through active learning and decision random forests: Aplication to AAA segmentation | |
| EP2584526B1 (fr) | Dispositif, procédé et programme de traitement d'images | |
| US20210209755A1 (en) | Automatic lesion border selection based on morphology and color features | |
| Khan et al. | Segmentation of developing human embryo in time-lapse microscopy | |
| US20060153451A1 (en) | System and method for detecting ground glass nodules in medical images | |
| Pai et al. | Nucleus and cytoplast contour detector from a cervical smear image | |
| Vercio et al. | Detection of morphological structures for vessel wall segmentation in ivus using random forests | |
| Chang et al. | Autofluorescence bronchoscopy video analysis for lesion frame detection | |
| Law et al. | Color image processing in Hirschsprung's disease diagnosis | |
| Rajitha et al. | Q-MorphNet: A quantum clustering model for glaucoma detection |
Legal Events
| Date | Code | Title | Description |
|---|---|---|---|
| PUAI | Public reference made under article 153(3) epc to a published international application that has entered the european phase |
Free format text: ORIGINAL CODE: 0009012 |
|
| 17P | Request for examination filed |
Effective date: 20120214 |
|
| AK | Designated contracting states |
Kind code of ref document: A2 Designated state(s): AL AT BE BG CH CY CZ DE DK EE ES FI FR GB GR HR HU IE IS IT LI LT LU LV MC MK MT NL NO PL PT RO RS SE SI SK SM TR |
|
| AX | Request for extension of the european patent |
Extension state: BA ME |
|
| PUAL | Search report despatched |
Free format text: ORIGINAL CODE: 0009013 |
|
| AK | Designated contracting states |
Kind code of ref document: A3 Designated state(s): AL AT BE BG CH CY CZ DE DK EE ES FI FR GB GR HR HU IE IS IT LI LT LU LV MC MK MT NL NO PL PT RO RS SE SI SK SM TR |
|
| AX | Request for extension of the european patent |
Extension state: BA ME |
|
| RIC1 | Information provided on ipc code assigned before grant |
Ipc: G06T 7/00 20060101AFI20160309BHEP |
|
| RAP1 | Party data changed (applicant data changed or rights of an application transferred) |
Owner name: OLYMPUS CORPORATION |
|
| RAP1 | Party data changed (applicant data changed or rights of an application transferred) |
Owner name: OLYMPUS CORPORATION |
|
| RAP1 | Party data changed (applicant data changed or rights of an application transferred) |
Owner name: OLYMPUS CORPORATION |
|
| RIN1 | Information on inventor provided before grant (corrected) |
Inventor name: KANDA, YAMATO Inventor name: MATSUDA, TAKEHIRO Inventor name: HIROTA, MASASHI Inventor name: KITAMURA, MAKOTO Inventor name: KONO, TAKASHI |
|
| STAA | Information on the status of an ep patent application or granted ep patent |
Free format text: STATUS: EXAMINATION IS IN PROGRESS |
|
| 17Q | First examination report despatched |
Effective date: 20170411 |
|
| GRAP | Despatch of communication of intention to grant a patent |
Free format text: ORIGINAL CODE: EPIDOSNIGR1 |
|
| STAA | Information on the status of an ep patent application or granted ep patent |
Free format text: STATUS: GRANT OF PATENT IS INTENDED |
|
| RIC1 | Information provided on ipc code assigned before grant |
Ipc: G06T 7/143 20170101ALI20180115BHEP Ipc: G06T 7/162 20170101ALI20180115BHEP Ipc: G06T 7/11 20170101AFI20180115BHEP |
|
| INTG | Intention to grant announced |
Effective date: 20180205 |
|
| STAA | Information on the status of an ep patent application or granted ep patent |
Free format text: STATUS: THE APPLICATION IS DEEMED TO BE WITHDRAWN |
|
| 18D | Application deemed to be withdrawn |
Effective date: 20180616 |
|
| RIC1 | Information provided on ipc code assigned before grant |
Ipc: G06T 7/162 20170101ALI20180115BHEP Ipc: G06T 7/143 20170101ALI20180115BHEP Ipc: G06T 7/11 20170101AFI20180115BHEP |