EP2510355B1 - Multiplex-mikroarrays zur analytquantifizierung mit interner und externer kalibrierung - Google Patents
Multiplex-mikroarrays zur analytquantifizierung mit interner und externer kalibrierung Download PDFInfo
- Publication number
- EP2510355B1 EP2510355B1 EP10825894.8A EP10825894A EP2510355B1 EP 2510355 B1 EP2510355 B1 EP 2510355B1 EP 10825894 A EP10825894 A EP 10825894A EP 2510355 B1 EP2510355 B1 EP 2510355B1
- Authority
- EP
- European Patent Office
- Prior art keywords
- calibration
- analyte
- spots
- concentration
- rheumatoid factor
- Prior art date
- Legal status (The legal status is an assumption and is not a legal conclusion. Google has not performed a legal analysis and makes no representation as to the accuracy of the status listed.)
- Not-in-force
Links
- 239000012491 analyte Substances 0.000 title claims description 160
- 238000002493 microarray Methods 0.000 title claims description 96
- 238000011002 quantification Methods 0.000 title description 6
- 239000000523 sample Substances 0.000 claims description 94
- 239000011159 matrix material Substances 0.000 claims description 82
- 238000000034 method Methods 0.000 claims description 75
- 238000012360 testing method Methods 0.000 claims description 74
- 239000000758 substrate Substances 0.000 claims description 70
- 238000003556 assay Methods 0.000 claims description 66
- 238000006243 chemical reaction Methods 0.000 claims description 61
- 150000001875 compounds Chemical class 0.000 claims description 45
- 238000011088 calibration curve Methods 0.000 claims description 44
- 239000013641 positive control Substances 0.000 claims description 26
- 206010039073 rheumatoid arthritis Diseases 0.000 claims description 23
- 239000012472 biological sample Substances 0.000 claims description 17
- 239000011324 bead Substances 0.000 claims description 15
- 239000012634 fragment Substances 0.000 claims description 12
- 108090000765 processed proteins & peptides Proteins 0.000 claims description 12
- 239000013642 negative control Substances 0.000 claims description 11
- 238000004422 calculation algorithm Methods 0.000 claims description 8
- 239000003795 chemical substances by application Substances 0.000 claims description 8
- 102000004169 proteins and genes Human genes 0.000 claims description 8
- 108090000623 proteins and genes Proteins 0.000 claims description 8
- 238000010790 dilution Methods 0.000 claims description 7
- 239000012895 dilution Substances 0.000 claims description 7
- 238000012544 monitoring process Methods 0.000 claims description 7
- 238000010606 normalization Methods 0.000 claims description 7
- 239000000090 biomarker Substances 0.000 description 37
- 230000000875 corresponding effect Effects 0.000 description 17
- 208000037265 diseases, disorders, signs and symptoms Diseases 0.000 description 16
- 201000010099 disease Diseases 0.000 description 15
- 238000004458 analytical method Methods 0.000 description 13
- 238000001514 detection method Methods 0.000 description 12
- 239000000872 buffer Substances 0.000 description 10
- 239000000427 antigen Substances 0.000 description 7
- 102000036639 antigens Human genes 0.000 description 7
- 108091007433 antigens Proteins 0.000 description 7
- 239000003153 chemical reaction reagent Substances 0.000 description 7
- 238000012790 confirmation Methods 0.000 description 7
- 230000000694 effects Effects 0.000 description 7
- 238000003018 immunoassay Methods 0.000 description 6
- 210000002966 serum Anatomy 0.000 description 6
- 238000005259 measurement Methods 0.000 description 5
- 238000000611 regression analysis Methods 0.000 description 5
- 239000000243 solution Substances 0.000 description 5
- 230000008901 benefit Effects 0.000 description 4
- 239000011248 coating agent Substances 0.000 description 4
- 238000000576 coating method Methods 0.000 description 4
- 238000003745 diagnosis Methods 0.000 description 4
- 230000008569 process Effects 0.000 description 4
- 238000003908 quality control method Methods 0.000 description 4
- 230000004044 response Effects 0.000 description 4
- 239000007787 solid Substances 0.000 description 4
- 230000031018 biological processes and functions Effects 0.000 description 3
- 238000007796 conventional method Methods 0.000 description 3
- 239000003814 drug Substances 0.000 description 3
- 230000036541 health Effects 0.000 description 3
- 238000012067 mathematical method Methods 0.000 description 3
- 239000013610 patient sample Substances 0.000 description 3
- 238000007619 statistical method Methods 0.000 description 3
- 101100086437 Drosophila melanogaster Rap1 gene Proteins 0.000 description 2
- 101100247319 Drosophila melanogaster Ras64B gene Proteins 0.000 description 2
- 238000002965 ELISA Methods 0.000 description 2
- 101100247326 Mucor circinelloides f. lusitanicus RAS3 gene Proteins 0.000 description 2
- 101150076031 RAS1 gene Proteins 0.000 description 2
- 101150019218 RAS2 gene Proteins 0.000 description 2
- 101150045048 Ras85D gene Proteins 0.000 description 2
- 108010061103 cyclic citrullinated peptide Proteins 0.000 description 2
- 229940079593 drug Drugs 0.000 description 2
- 238000009396 hybridization Methods 0.000 description 2
- 239000007788 liquid Substances 0.000 description 2
- 239000003550 marker Substances 0.000 description 2
- 238000007837 multiplex assay Methods 0.000 description 2
- 108020004707 nucleic acids Proteins 0.000 description 2
- 102000039446 nucleic acids Human genes 0.000 description 2
- 150000007523 nucleic acids Chemical class 0.000 description 2
- 238000002360 preparation method Methods 0.000 description 2
- 238000004886 process control Methods 0.000 description 2
- 238000012545 processing Methods 0.000 description 2
- 238000012552 review Methods 0.000 description 2
- 239000000126 substance Substances 0.000 description 2
- 230000001225 therapeutic effect Effects 0.000 description 2
- 238000012546 transfer Methods 0.000 description 2
- 208000023275 Autoimmune disease Diseases 0.000 description 1
- 108090000695 Cytokines Proteins 0.000 description 1
- 102000004127 Cytokines Human genes 0.000 description 1
- 102000004190 Enzymes Human genes 0.000 description 1
- 108090000790 Enzymes Proteins 0.000 description 1
- 241000283074 Equus asinus Species 0.000 description 1
- 108060003951 Immunoglobulin Proteins 0.000 description 1
- 239000004743 Polypropylene Substances 0.000 description 1
- 239000004793 Polystyrene Substances 0.000 description 1
- 102000007056 Recombinant Fusion Proteins Human genes 0.000 description 1
- 108010008281 Recombinant Fusion Proteins Proteins 0.000 description 1
- 238000012896 Statistical algorithm Methods 0.000 description 1
- 230000006978 adaptation Effects 0.000 description 1
- 230000000890 antigenic effect Effects 0.000 description 1
- 238000003491 array Methods 0.000 description 1
- 238000011948 assay development Methods 0.000 description 1
- 210000001124 body fluid Anatomy 0.000 description 1
- 239000010839 body fluid Substances 0.000 description 1
- 239000007853 buffer solution Substances 0.000 description 1
- 244000309464 bull Species 0.000 description 1
- 239000007795 chemical reaction product Substances 0.000 description 1
- 230000000052 comparative effect Effects 0.000 description 1
- 230000002596 correlated effect Effects 0.000 description 1
- 150000001925 cycloalkenes Chemical class 0.000 description 1
- 238000007405 data analysis Methods 0.000 description 1
- 230000001419 dependent effect Effects 0.000 description 1
- 238000011161 development Methods 0.000 description 1
- 238000002405 diagnostic procedure Methods 0.000 description 1
- 208000035475 disorder Diseases 0.000 description 1
- 229940000406 drug candidate Drugs 0.000 description 1
- 238000012362 drug development process Methods 0.000 description 1
- 238000002651 drug therapy Methods 0.000 description 1
- 239000000975 dye Substances 0.000 description 1
- 239000007850 fluorescent dye Substances 0.000 description 1
- 239000011521 glass Substances 0.000 description 1
- 238000013537 high throughput screening Methods 0.000 description 1
- 230000001900 immune effect Effects 0.000 description 1
- 230000000984 immunochemical effect Effects 0.000 description 1
- 102000018358 immunoglobulin Human genes 0.000 description 1
- 230000003993 interaction Effects 0.000 description 1
- 239000003446 ligand Substances 0.000 description 1
- 238000012417 linear regression Methods 0.000 description 1
- MYWUZJCMWCOHBA-VIFPVBQESA-N methamphetamine Chemical compound CN[C@@H](C)CC1=CC=CC=C1 MYWUZJCMWCOHBA-VIFPVBQESA-N 0.000 description 1
- 238000012986 modification Methods 0.000 description 1
- 230000004048 modification Effects 0.000 description 1
- 239000002547 new drug Substances 0.000 description 1
- 239000002773 nucleotide Substances 0.000 description 1
- 125000003729 nucleotide group Chemical group 0.000 description 1
- 210000000056 organ Anatomy 0.000 description 1
- 230000008520 organization Effects 0.000 description 1
- 230000001717 pathogenic effect Effects 0.000 description 1
- 230000037361 pathway Effects 0.000 description 1
- 239000004033 plastic Substances 0.000 description 1
- -1 polypropylene Polymers 0.000 description 1
- 229920001155 polypropylene Polymers 0.000 description 1
- 229920001296 polysiloxane Polymers 0.000 description 1
- 229920002223 polystyrene Polymers 0.000 description 1
- 238000004393 prognosis Methods 0.000 description 1
- 238000000159 protein binding assay Methods 0.000 description 1
- 238000012797 qualification Methods 0.000 description 1
- 238000004451 qualitative analysis Methods 0.000 description 1
- 238000004445 quantitative analysis Methods 0.000 description 1
- 238000011160 research Methods 0.000 description 1
- 239000012488 sample solution Substances 0.000 description 1
- 239000012086 standard solution Substances 0.000 description 1
- 239000000725 suspension Substances 0.000 description 1
- 239000012085 test solution Substances 0.000 description 1
- 238000005406 washing Methods 0.000 description 1
Images



Classifications
-
- G—PHYSICS
- G01—MEASURING; TESTING
- G01N—INVESTIGATING OR ANALYSING MATERIALS BY DETERMINING THEIR CHEMICAL OR PHYSICAL PROPERTIES
- G01N33/00—Investigating or analysing materials by specific methods not covered by groups G01N1/00 - G01N31/00
- G01N33/48—Biological material, e.g. blood, urine; Haemocytometers
- G01N33/50—Chemical analysis of biological material, e.g. blood, urine; Testing involving biospecific ligand binding methods; Immunological testing
- G01N33/68—Chemical analysis of biological material, e.g. blood, urine; Testing involving biospecific ligand binding methods; Immunological testing involving proteins, peptides or amino acids
- G01N33/6803—General methods of protein analysis not limited to specific proteins or families of proteins
- G01N33/6845—Methods of identifying protein-protein interactions in protein mixtures
-
- G—PHYSICS
- G01—MEASURING; TESTING
- G01N—INVESTIGATING OR ANALYSING MATERIALS BY DETERMINING THEIR CHEMICAL OR PHYSICAL PROPERTIES
- G01N2440/00—Post-translational modifications [PTMs] in chemical analysis of biological material
- G01N2440/18—Post-translational modifications [PTMs] in chemical analysis of biological material citrullination
-
- G—PHYSICS
- G01—MEASURING; TESTING
- G01N—INVESTIGATING OR ANALYSING MATERIALS BY DETERMINING THEIR CHEMICAL OR PHYSICAL PROPERTIES
- G01N2800/00—Detection or diagnosis of diseases
- G01N2800/10—Musculoskeletal or connective tissue disorders
- G01N2800/101—Diffuse connective tissue disease, e.g. Sjögren, Wegener's granulomatosis
-
- G—PHYSICS
- G01—MEASURING; TESTING
- G01N—INVESTIGATING OR ANALYSING MATERIALS BY DETERMINING THEIR CHEMICAL OR PHYSICAL PROPERTIES
- G01N2800/00—Detection or diagnosis of diseases
- G01N2800/52—Predicting or monitoring the response to treatment, e.g. for selection of therapy based on assay results in personalised medicine; Prognosis
Definitions
- the present invention relates to multiplex microarrays and methods for the quantification of protein analytes, in particular, the invention relates to improved methods which standardize analyte concentrations against an internal reference standardization curve and a standardization curve obtained from known reference standards.
- the present invention also relates to methods and checks for simultaneous measurement of confidence confirming normalization standards and controls.
- a biomarker is a characteristic that may be measured and evaluated as an indicator of the biological state of an organism.
- a biomarker may be an exogenous substance that is introduced into a patient to examine biological processes, such as organ function, and biochemical functions and pathways.
- a biomarker may also be a biomolecule obtained from a patient, such as a protein or a nucleic acid, that indicates a particular disease state or response to a drug therapy.
- biochemical biomarkers are also particularly useful in the discovery and development of new drugs. During early phase clinical research of such drugs, quantification of suitable biomarkers may potentially aid researchers in more rapid identification of the most promising drug candidates, thus streamlining the drug development process.
- Disease-related biomarkers may also be used for diagnosis or prognosis of disease, and as a measure of therapeutic efficacy. Thus, it is of great importance to identify and validate new biomarkers that may be of use in assessing patient health and/or response to therapeutic interventions, as well as provide a method for accurate and reproducible determination of known biomarkers.
- Biomarker analysis is highly dependent on the integrity of reagents such as antibodies, which are themselves derived from biologic sources and thus may be subject to issues of quality control and stability.
- non-certified standards such as recombinant proteins and surrogate matrices have been used, in order to derive a calibration curve.
- parallel studies need to be performed where the response of the assay to a range of calibration standard concentrations made up in the surrogate matrices is comparable to that of a series of dilutions of patient samples. Dilution linearity can also be problematic, as antibody and ligand-binding affinities can vary significantly in different media.
- the goal of biomarker assay development and qualification is to develop assays for clinical benefit.
- Immunoassays such as the Enzyme Linked Immunosorbent Assay ("ELISA"), based on the binding specificity of antibodies for a target antigen, are well-known in the art (see for example, Engvall et al., Immunochem. 1971, 8:871 ; Ljunggren et al., J. Immuno. Meth. 1987, 88:104 ; Kemeny et al., Immunol. Today 1986, 7:67 ). Immunoassays are highly useful for identifying new biochemical biomarkers such as proteins or nucleic acids, as well as quantifying known biomarkers, as antibodies can be generated against a specific biomarker.
- ELISA Enzyme Linked Immunosorbent Assay
- Previously employed immunoassay methods tended to be limited as they could only detect one target analyte per test cycle, within a single reaction vessel. Attempts have been made to decrease the time for completion of each test cycle, and to increase the number of tests that are carried out per cycle, by adhering probe molecules (e.g. antibodies) to a solid substrate (e.g. a bead or a well on a plate), and then washing test samples, buffers, and reagent solutions over the solid substrate.
- probe molecules e.g. antibodies
- a microarray is a device in which a large number (e.g. hundreds to thousands) of samples of biomolecules, such as DNA and proteins, are affixed or immobilized to a suitable non-reactive substrate surface, such as plastic (e.g. polypropylene, polystyrene, cycloolefins), silicone, and glass.
- a suitable non-reactive substrate surface such as plastic (e.g. polypropylene, polystyrene, cycloolefins), silicone, and glass.
- the substrate surface is relatively flat, the biomolecules may be "printed" on the surface, whereby printing is carried out by application of a known volume of a "spotting" buffer containing a known concentration of the biomolecule. With the biomolecules fixed to a known substrate or known locations on a substrate surface, the substrate surface may then be exposed to biochemical/chemical reagents for the purposes of detection, and qualitative and quantitative analysis.
- a microarray may be used to carry out an ELISA-type immunoassay, wherein the biomolecule affixed to the substrate is an antibody, and the substrate surface is then exposed to a test solution containing an antigen to which the antibody can bind.
- the substrate surface can then be washed with a buffer solution and exposed to a secondary antibody which is conjugated to either a detectable label (e.g. a radiolabel or a fluorescent dye) or an enzyme which catalyzes a reaction for which the reaction product is coloured and thus detectable.
- a detectable label e.g. a radiolabel or a fluorescent dye
- an enzyme which catalyzes a reaction for which the reaction product is coloured and thus detectable.
- microarrays and methods of handling the data provided by microarrays are known in the art. See for example, U.S. Patent 6,516,276 to Ghandour et al. , entitled “Method and apparatus for analysis of data from biomolecular arrays", U.S. Patent No. 6,916,621 to by Shah , entitled “Methods for array-based comparative binding assays", and U.S. Patent No. 7,072,806 to Minor , entitled “Methods and systems for comparing data values across multiple platforms”.
- microarrays may be adapted to perform multiplex analyte detection.
- "multiplex" microarrays have been developed, wherein multiple different probe biomolecules are present in the same microarray. This allows users to detect and analyse more than one target analyte in a test sample. This is particularly useful for high-throughput screening of tissue/body fluid samples for multiple biomarkers that may be used for detection and diagnosis of biological processes including pathogenic and physiological disorders. Ling et al., Expert Rev. Mol. Diagn., 7(1), 87-98 (2007 ) provides a review of microspot array and bead array methods for providing high throughput and a high degree of multiplexing diagnostic testing.
- the actual amount of the biomolecule within a given location on a substrate surface during the course of the assay may be less than the theoretical printed amount, i.e. the amount calculated based on the known concentration of the spotting buffer and the volume of spotting buffer applied to the surface.
- the theoretical printed amount i.e. the amount calculated based on the known concentration of the spotting buffer and the volume of spotting buffer applied to the surface.
- prior art methods for quantifying analyte amounts in a test sample do not take into account the discrepancies between the theoretical amounts and the actual amounts of the biomolecule immobilized on the microarray.
- a method for quantifying one or more protein analyte(s) in a test sample comprises:
- step (e(iii)) the first and second calibration curves are generated by:
- step (e(iv)) the concentration of the analyte in the test sample or the reference standard is determined by:
- the normalization of the measured signal intensity value for each of the spots of calibration matrix and the sample capture matrix may be performed by applying the Tukey Biweight algorithm.
- the total number of the spots of the analyte capture matrix is at least equal to the total number of spots of the calibration matrix. Further, there are between 3 to 20 different theoretical concentrations of the analyte(s), corresponding to a linear dilution series, and there are between 3 to 15 spots for each of the theoretical concentrations of the calibration standard.
- the labelled reporter compound is a fluorescently labelled antibody.
- the plurality of reaction substrates is in the form of a multi-well assay plate. In yet another embodiment of the invention, the plurality of reaction substrates is in the form of a plurality of beads.
- the test sample is a biological sample.
- the biological sample can be obtained from a patient, and can be used in a method for any one of the following:
- the method according to the above-noted embodiments can be used for diagnosing rheumatoid arthritis in a subject, the method comprising:
- the method according to the above-noted embodiments can be used for monitoring rheumatoid arthritis treatment in a subject suffering therefrom, comprising measuring the concentration levels of: rheumatoid factor-lgA, rheumatoid factor-IgG, rheumatoid factor-IgM and at least one anti-cyclic citrullinated antibody selected from the group consisting of anti-cyclic citrullinated peptide-IgG, anti-cyclic citrullinated peptide-lgA, and anti-cyclic citrullinated peptide-lgM.
- the measurement of the concentration levels of the above-noted biomarkers is carried out a plurality of times during the treatment.
- the above-noted method is used for diagnosing rheumatoid arthritis and/or monitoring rheumatoid arthritis treatment, wherein the microarray comprises the calibration matrix comprising a plurality of spots comprising a predetermined amount of the calibration compound, each spot corresponding to a theoretical concentration of the calibration compound; a first analyte capture matrix comprising a plurality of spots comprising a predetermined amount of rheumatoid factor; and a second analyte capture matrix comprising a plurality of spots comprising a predetermined amount of cyclic citrullinated peptide.
- the above-noted method is used for diagnosing rheumatoid arthritis and/or monitoring rheumatoid arthritis treatment, wherein the microarray further comprises one or more of the following:
- the method may be carried out on a multi-well assay plate, wherein a well of the assay plate comprises a microarray as described above, and wherein the multi-well assay plate comprises one or more confidence confirmation normalization standards and controls.
- the method may be carried out on a plurality of beads, wherein an individual bead comprises a microarray as described above, and wherein the plurality of beads comprises one or more confidence confirmation normalization standards and controls.
- the above-noted method is used for diagnosing rheumatoid arthritis and/or monitoring rheumatoid arthritis treatment, wherein the plurality of reaction substrates (which may be either one or more individual wells of the above-noted multi-well assay place, or one or more beads of the above-noted plurality of beads) may further comprise one or more of the following controls:
- An advantage of the present invention is that it provides an improved microarray based method for quantifying the amount of a target analyte in a test sample which corrects for these inherent discrepancies in the amount of the applied probe and calibration standard.
- the method may be used to measure one or more analytes in a test sample in a single reaction vessel.
- the method is particularly useful for accurately quantifying the amounts of multiple target analytes in a test sample, using multiplex microarrays.
- Yet another advantage of the invention is that it provides a method to more accurately quantify clinically relevant biomarkers in biological samples for diagnostic or prognostic purposes.
- the method disclosed herein may also be used to more accurately monitor the progress of a disease and also the effect of a treatment on a disease.
- microarrays for the detection and quantification of target analytes in a test sample, such as a biological sample obtained from a patient, is well known.
- the process for quantifying the amount of a target analyte in the test sample typically involves providing a microarray comprising an agent (also referred to as a "probe") which selectively binds to the target analyte, wherein the probe is first immobilized onto a solid surface of the microarray (also referred to as the "substrate").
- the probe may be immobilized onto the surface of the microarray by preparing a spotting solution comprising a known concentration of the probe and printing a predetermined volume of the spotting buffer onto the surface to provide capture spots (also referred to as "test dots") which will bind the target analyte, if present, in the test sample.
- the probe may be immobilized onto the surface of the bead by preparing a coating solution comprising a known concentration of the probe, and immersing the bead(s) in the coating solution.
- Calibration standards of known concentration of the target analyte can be used for the purpose of constructing a calibration curve.
- the calibration standard may also be a surrogate compound with similar biochemical characteristics to the target analyte.
- the calibration standards may be applied to the microarray in the same manner as the capture spot containing the probe for the target analyte, to form "calibration spots".
- the microarray comprises a plurality of calibration spots, each of which include a predetermined amount of the target analyte or surrogate compound, immobilized on the substrate surface of the microarray.
- a reporting system is provided which detects the amount of analyte bound to the microarray.
- a commonly used reporting system is a fluorescently labelled antibody which selectively binds to the analyte.
- a calibration curve is generated by fitting a curve to a graph of the measured signal intensity of the labelled reporter for the calibrations spots (y axis) versus the theoretical concentrations of the calibration standards (x axis). Fitting the curve to the graph may be done by well-known mathematical and statistical methods, such as linear regression.
- the calibration curve is then used to determine the concentration of the analyte in the test samples based on measured signal intensities for the capture spots, wherein the measured signal intensities of the capture spots, taken as y values, are plotted on the calibration curve, and the corresponding x value is taken as the concentration of the analyte in the test samples.
- the actual amount of the probe or calibration standard immobilized on the surface during the course of the assay is less than the theoretical printed amount, i.e. the amount calculated based on the known concentration of the probe or the calibration standard in their respective spotting buffer and the volume of spotting buffer applied to the surface.
- the theoretical printed amount i.e. the amount calculated based on the known concentration of the probe or the calibration standard in their respective spotting buffer and the volume of spotting buffer applied to the surface.
- prior art methods for quantifying analyte amounts in a test sample do not take into account the discrepancies between the theoretical amounts and the actual amounts of the probe and the calibration standard immobilized on the microarray.
- microarray-based method for quantifying the amount of a target analyte in a test sample which corrects for these inherent discrepancies in the amount of the applied probe and calibration standard.
- the method may also be used in a multiplex microarray, to measure more than one target analyte in a test sample in a single reaction vessel.
- the method comprises two stages as illustrated in Figure 1 ("Fig. 1 ").
- microarray In order to carry out the method as described below, there is provided a plurality of discrete reaction substrates, each having a microarray printed thereon.
- the microarray can be fixed, by printing or coating, on the surface of each of the reaction substrates using conventional methods that are well-known in the art.
- the reaction substrate is a flat surface such as provided by the base of a well of a multi-well assay plate.
- other types of reaction substrates, such as beads may be used.
- the term "microarray” refers to series of discrete deposits, also referred to as “spots", of a specific compound such as a protein or a nucleotide sequence attached to a solid substrate.
- Each microarray comprises the following sets of spots:
- each microarray is printed on a surface of a discrete reaction substrate.
- the discrete reaction substrate may be in the form of a bead or a multi-well assay plate with each individual well having one or more microarrays printed thereon.
- the method is carried out using a multi-well assay plate suitable for microarray printing thereon.
- the number of analyte capture matrices and calibration matrices will depend on the number of target analytes and the nature of the target analytes.
- the term "reference standard” refers to a solution comprising a known amount of the target analyte, such as a commercially available standard solution of a biomolecule. Where possible, the reference standard is a standard which is established to be equivalent and traceable to an internationally recognised standard which is appropriate for use in the present assay, and has been proven to be stable prior to its stated expiration date. For a given target analyte, the number of reference standards at different concentrations ranges between 3 to 16 and more preferably from 5 to 8. The reference standards are in the form of a linear dilution series with the concentrations falling within the dynamic range of the detection system used to read the microarray.
- a test sample containing an unknown concentration of the target analyte is applied to one of the reaction substrates comprising a microarray as described above ( Fig. 1 , (a1) and (b1)).
- two or more reference standard(s), each containing a known concentration of the target analyte is each applied to the remaining reaction substrate(s), each reaction substrate comprising a set of spots (i) and (ii) as described above ( Fig. 1 , (a2) and (b2)).
- a reporting system that provides a signal intensity may be detected and measured ("the measured signal intensity").
- the measured signal intensity varies in direct proportion relative to the amount of target analyte or calibration standard that is present in any given spot on the microarray.
- An example of a suitable reporting system is a fluorescently labelled antibody that binds specifically to the target analyte, wherein the intensity of fluorescence may be measured and is proportional to the amount of bound antibody.
- the measured signal intensities for the set of calibration spots from each substrate is plotted against the respective theoretical concentrations of the calibration spots (x axis).
- Regression analysis and/or other well-known mathematical and statistical methods are used to prepare a standard curve that best fits the data points, thus forming an initial calibration curve.
- a first initial calibration curve derived from the calibration spots exposed to the test sample Fig. 1 , (c1)
- a second initial calibration curve derived from the calibration spots exposed to the reference standard Fig. 1 , (c2)
- the "analyte equivalent concentration" (“AEC”) is determined by plotting the measured signal intensity of the capture spot(s) on each substrate as a y value on the respective initial calibration curve, finding the corresponding x value (the x axis being in units of concentration), and thus determining the concentration of the target analyte in the test sample ( Fig. 1 , (d1)), and in the reference standard ( Fig. 1 , (d2)). Doing so provides the following values:
- analyte equivalent concentration values AEC1 and AEC2 as obtained in this first stage of the method do not take into account deviations and variations in assay kinetics nor minor inter-lot variations between microarrays, such as may occur during the printing of the capture and calibration spots and during application and removal of assay reagents.
- the analyte equivalent concentrations for the reference standards, AEC2 are plotted against the respective known concentrations of the reference standard ("the reference concentrations"). Regression analysis and/or other well known mathematical and statistical methods are then used to determine a standard curve that best fits the data points, referred to as the "Reference Standardization Curve” ( Fig. 1 , (f)).
- the analyte equivalent concentration for the test sample, AEC1 is plotted on the Reference Standardization Curve and the corresponding x value for AEC1 is taken as the corrected target analyte concentration ( Fig. 1 , (g) and (h), respectively).
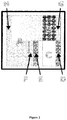
- Figure 2 illustrates an embodiment, wherein there is provided a microarray useful for quantifying multiple analytes which bind to two different probe compounds.
- the microarray as illustrated may be useful for quantifying antibodies which bind to two different antigens.
- the microarray as illustrated in Figure 2 comprises a calibration matrix A.
- the calibration matrix may be printed on the surface of a discrete reaction substrate in the form of a linear, proportional dilution series with the theoretical concentrations of the calibration standard falling within the dynamic range of the detection system used to read the microarray.
- the number of different concentration levels of the calibration standard ranges between 3 and 20 and more preferably from 5 to 12.
- the calibration matrix also comprises replicate spots for each of the theoretical concentrations.
- the number of replicate spots ranges between 3 to 15 spots for each concentration level and more preferably between 5 to 8 spots.
- the calibration standard may be an antibody different from the target antibodies and which is recognized by further differentially labelled antibody.
- the calibration standard may be a readily available and inexpensive antibody such as human IgA and human IgM.
- the microarray also comprises an analyte capture matrix, which is a subarray of spots comprising an agent (also referred to as a "probe") that selectively binds to the target analyte.
- an agent also referred to as a "probe”
- the probe may be an antibody or fragment thereof that binds specifically to the target analyte.
- the probe may be an antigen specifically bound by the antibody.
- the microarray may be used to detect and capture antibodies that selectively bind to two different antigens.
- the illustrated microarray comprises analyte capture matrices B and C, made up of analyte capture spots comprising a first and second antigen, respectively.
- the total number of replicate spots in the analyte capture matrix is typically at least equal to the total number of replicate spots for each predetermined concentration of the reference standard in the calibration matrix. For example, if the calibration matrix comprises 7 replicate spots for each of the predetermined concentrations of the reference standard, then the sample capture matrix will comprise at least 7 replicate spots for the target analyte.
- the microarray may further comprise a positive control matrix for each target analyte.
- a positive control matrix refers to a subarray of spots comprising a conjugate of the target analyte and the agent which selectively binds the target analyte.
- a signal intensity reading for each positive control matrix confirms that the reporting system (for example, fluorescently labelled antibodies which selectively bind to the target analytes) and the microarray scanner are functioning properly in a given channel.
- signal intensity readings in each of the positive control matrices allows spot finding algorithms such as those of the SQiDworksTM Diagnostic Platform (SQI Diagnostics Systems, Inc.) to identify the intensity values for all spots of the microarray for automated analysis.
- the microarray illustrated in Figure 2 comprises a positive control matrix for each type of antibody to be quantified.
- the IgA positive control matrix H is a subarray of spots comprising an IgA antibody or IgA fragments to verify that the IgA specific labelled reporter and scanner channel of the reporting system are functioning properly.
- the IgM positive control matrix E is a subarray of spots comprising an IgM antibody or IgM fragments to verify that the IgM specific labelled reporter and scanner channel of the reporting system are functioning.
- the IgG positive control matrix G is a subarray of spots comprising an IgG antibody or IgG fragments to verify that the IgG specific labelled reporter and scanner channel of the reporting system are functioning.
- the microarray may also comprise a negative control matrix F.
- a negative control matrix refers to a subarray of spots which is free of any compound which interacts with a detectable level of any assay analyte or any labelled reporter. In use, a negative signal intensity reading in this region of the microarray confirms that there are no spurious interactions between the differential detectable labels and the microarray.
- the microarray may further comprise a sample control matrix D.
- sample control matrix refers to a subarray of spots comprising an agent which selectively binds to a compound associated with the biological sample.
- the compound can be a compound naturally occurring in the biological sample with the proviso that the compound is not the same as a target analyte.
- the compound may be a foreign compound added to the biological sample.
- Each of the matrices making up the microarray may be printed on the surface of a reaction substrate such as a bead or a well of an assay plate.
- the matrices are printed at predetermined X-Y coordinates on the base of a well of an assay plate.
- the microarray of Figure 2 is used to determine the analyte equivalent concentrations of the target analyte in the test sample and in the reference standards.
- a predetermined volume of the test sample and of each reference standard is applied to discrete reaction substrates.
- a separate reaction substrate is used for each test sample and for each reference standard.
- the target analyte in the test sample and the reference standards are allowed to bind to the probe in the analyte capture spots.
- the amount of bound analyte is measured using a labelled reporter which selectively binds to the target analyte.
- the hybridization conditions and choice of labelled reporter will depend on the nature of the target analyte and can be determined using conventional methods.
- the reporting system may comprise the use of differentially labelled antibodies which specifically recognize multiple different target analytes.
- the signal intensity value corresponding to the amount of the bound labelled reporter in each spot within an microarray is measured using conventional methods.
- differentially labelled reporters can be used, e,g. fluorescently labelled antibodies which each fluoresce at a different characteristic wavelength.
- a charge couple device (CCD) array scanner can be used to measured for the specific fluorescent signal intensity generated by the requisite dye wavelengths emitted by each spot. The scanner generates a multi-color intensity image map of each spot. The intensity of the generated signal is directly proportional to the amount of reporter contained within the printed calibration spots and the amount of analyte from the test sample or reference standard bound to the printed analyte capture spot. For each reaction substrate, measured signal intensity values are obtained for each of the analyte capture spots and for each of the calibration spots.
- a calibration curve is generated by fitting a curve to the measured signal intensity values versus the theoretical concentration of the calibration standard as described above in Figure 1 , (c1) and (c2).
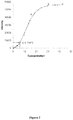
- the analyte equivalent concentration for test sample (AEC1) or for the reference standard (AEC2) is then determined using the initial calibration curve by plotting the measured signal intensity for the test sample or the reference standard on the calibration curve as shown in Figure 3 (see also Figure 1 , (d1) and (d2), and relevant description above regarding the same).
- Figure 3 illustrates an initial calibration curve prepared from the results of an assay employing 12 different concentration levels of the calibration standard (denoted in Table 1(a) below as AGM-01 to AGM-12).
- the measured signal intensity value for each calibration standard ( y axis) was plotted against the respective theoretical concentration level of the calibration standard ( x axis).
- the initial calibration curve was then obtained, using well-known methods of regression analysis to fit a curve to the data points.
- the measured intensity value was normalized by identifying the corresponding y value on the calibration curve for each theoretical concentration level (taken as the x value), the corresponding y value being denoted as the "fitted signal intensity".
- the analyte equivalent concentration for the test sample (AEC1) or for the reference standard (AEC2) may then be determined as follows.
- the mean value of measured signal intensities of a set of capture spots, taken as the y value, would be plotted on the calibration curve.
- the corresponding x value would then be the analyte equivalent concentration.
- Table 1(b) For a mean measured signal intensity of 7187 for a given capture spot, a corresponding AEC1 value, calculated from the calibration curve as illustrated in Figure 3 , would be 5.8.
- an initial calibration curve may be generated as follows.
- the measured intensity signal for each of the replicate spots for a given theoretical concentration of the calibration compound may be normalized to a mean measured intensity signal value, and fitting a curve to the mean measured intensity signal values for each of the theoretical concentrations of the calibration standard, using well-known methods of regression analysis.
- the concentration of the target analyte in the test sample or the reference standard may be determined by normalizing the measured intensity signal value for each of the replicate spots to a mean measured intensity signal value, and calculating the concentration of the target analyte by plotting the mean measured intensity signal value on the calibration curve.
- the normalization of the measured intensity signal value for each of the spots of calibration matrix and the sample capture matrix is performed by applying an algorithm.
- the algorithm is preferably the Tukey Biweight algorithm, an accepted statistical algorithm which places less emphasis on values as they exist further from the median value of all inclusive replicates ( Mosteller, F. and Tukey, J. W. Data Analysis and Regression: A Second Course in Statistics; Addison-Wesley: Reading, 1977; pp. 203-209 ).
- the analyte equivalent concentrations for the reference standards are used in the second stage of the method to modulate or correct the analyte equivalent concentration for the test sample (AEC1) to provide a more accurate measurement of the amount of target analyte in the test sample (see also Figure 1 , Stage 2 and relevant description above regarding the same).
- a Reference Standardization Curve is generated by fitting a curve to a graph of the analyte equivalent concentrations for the reference standards (AEC2 values; y axis) versus the known concentrations of the reference standards ( x axis). The amount of target analyte in the test sample is then determined by correcting the analyte equivalent concentration.
- the corrected target analyte concentration value is a more accurate quantification of the target analyte.
- Figure 4 illustrates the results of an assay employing 8 different concentration levels of the reference standard, each concentration level provided in replicates of two.
- AEC2 analyte equivalent concentration
- Each set of AEC2 values for each known concentration level ( x value) was then normalized to the corresponding y value on the Reference Standardization Curve, to provide normalized AEC2 values.
- the normalized AEC2 values and the corresponding known concentration values (x values) noted above are summarized in Table 2(a) below.
- the analyte equivalent concentration for the test sample, AEC1 5.8, was then plotted on the Reference Standardization Curve to provide a corrected target analyte concentration of 42.36 (see Table 2(b) below).
- the corrected target analyte concentration may be expressed as a concentration, i.e. amount per volume (for example: ⁇ g/mL; units/mL), or if standardized against a recognized traceable internationally recognized reference calibrator, in International Units (IU) per volume (for example, IU/mL). It is understood that the relevant units of measure will depend on the target analyte to be assayed and whether traceable reference standards were used.
- the method disclosed herein can be used to more accurately quantify clinically relevant biomarkers in biological samples for diagnostic or prognostic purposes. For example, the corrected target analyte concentrations for a disease related biomarker can be compared with established index normal levels for that biomarker. Corrected target analyte concentrations levels which exceed index normal levels may be identified as being diagnostic of the disease.
- the method disclosed herein can also be used to monitor the progress of a disease and also the effect of a treatment on the disease. Levels of a clinically relevant biomarker can be quantified using the disclosed method a plurality of times during a period of treatment. A trending decrease in biomarker levels may be correlated with a positive patient response to treatment.
- a set of internal quality control rules may be provided for the purposes of evaluating the assay results. These rules can be identified by safety and hazard analysis to mitigate risks such as missing test samples and general failures in the immunochemical reactions. They may include quality control rules for checking fit of calibration and standardization curves, as well as thresholds of controls measuring reporter activity and sample presence. When data is found that does not fit the required control levels or rules, further processing of the data is halted and the value "No Result" may be reported.
- the internal quality control rules, or invalidation rules can be present at each level of data processing. For example, the rules may provide for the invalidation of single analyte results where there is a high co-efficient of variance of the replicate capture spots. The rules may provide for the invalidation of results for a given microarray or a given reaction substrate if there is an improper calibration curve or control threshold. The rules may provide the invalidation of a result due to an improper standardization curve.
- Example 1 Multiplex Microarray for Assaying Rheumatoid Arthritis Biomarkers
- Figure 5 illustrates a microarray useful for the diagnosing rheumatoid arthritis and for monitoring the effects of treatment in a patient suffering rheumatoid arthritis.
- the microarray can be used to quantify biomarkers associated with rheumatoid arthritis: rheumatoid factor-IgA (RF-IgA), rheumatoid factor-IgG (RF-IgG), rheumatoid factor-IgM (RF-IgM) and anti-cyclic citrullinated peptide-IgG (CCP-IgG), anti-cyclic citrullinated peptide-lgA (CCP-IgA), and anti-cyclic citrullinated peptide-IgM (CCP-IgM).
- the microarray can be used with a reporting system comprising differentially labelled antibodies which specifically recognize IgA, IgG, and IgM antibodies.
- the reporter antibodies can be differentially labelled fluorescent antibodies.
- the microarray was printed on each well of a 96-well assay plate.
- the microarray comprised two different sample capture matrices, each capture matrix comprising 21 capture spots.
- Each capture spot comprised a predetermined relevant amount of rheumatoid factor for capturing RF-IgA, RF-IgG, and RF-IgM and a second analyte capture matrix comprising a predetermined relevant amount of cyclic citrullinated peptide for capturing CCP-IgG, CCP-IgA and/or CCP-IgM.
- the microarray can comprise sample capture matrices for capturing RF-IgA, RF, IgG and RF-IgM and at least one of the anti-cyclic citrullinated peptide antibodies (CCP-IgG, CCP-IgA, and/or CCP-IgM.
- the microarray comprised capture spots for all of the above-noted biomarkers.
- the microarray also comprised a calibration matrix.
- the calibration standard was IgG Fab, which is recognized by a IgG reporter antibody. Twelve (12) different concentrations of the calibration standard, spanning a more than 200-fold concentration range, were provided on the microarray.
- the calibration matrix comprised 7 replicate spots for each of the 12 different concentration levels.
- the microarray further comprised a negative control matrix and a positive control matrix for each of type of antibody to be quantified.
- the negative control matrix and the positive control matrix each contained 7 replicate spots.
- the negative control matrix comprised a plurality of spots which were free of any compound which interacts at a detectable level of any of the assay analytes or any labelled reporter.
- the IgA positive control matrix was a subarray of spots comprising an IgA antibody or fragment thereof to verify that the IgA specific labelled reporter and scanner channel of the reporting system were functioning properly.
- the IgM positive control matrix was a subarray of spots comprising an IgM antibody or fragment thereof to verify that the IgM specific labelled reporter and scanner channel of the reporting system were functioning.
- the IgG positive control matrix was a subarray of spots comprising an IgG antibody or fragment thereof to verify that the IgG specific labelled reporter and scanner channel of the reporting system are functioning.
- the microarray comprised a test control matrix comprising a subarray of spots comprising a donkey anti-human IgM antibody which selectively binds any serum IgM antibodies to confirm a test sample was added to the reaction vessel during the assay.
- the assay was conducted by applying a predetermined volume (100 microlitres, ⁇ L) of a patient's serum sample to an individual reaction well of the multi-well assay plate. Prior to application to the reaction well, the test sample was combined with the IgA, IgG, and IgM specific reporter antibodies. The test sample was reacted with the reporter antibodies for approximately 2 minutes and was then dispensed into the reaction well. Typically, there were at least 2 replicate wells for each patient sample. Each of the reference standards were similarly reacted with the reporter antibodies and were applied to individual reaction wells in the assay plate. Typically, there were at least 2 replicate wells for each reference standard. For each of the reaction wells, a multi-coloured intensity image map was generated for each spot of the microarray contained in each of the reaction wells.
- the assay plate comprised one or more confidence confirmation normalization standards and controls including:
- the measured signal intensities of each the replicate calibrations were normalized by applying the Tukey Biweight algorithm to provide a mean measured signal intensity value for reach concentration level.
- An initial calibration curve was generated by fitting a curve to the mean measured signal intensity values for each of the concentrations of the calibration standard.
- the measured signal intensities for each of the analyte capture spots was normalized by applying the Tukey Biweight algorithm to provide a mean measured signal intensity value which was proportional to the amount of IgA, IgG, or IgM present in the test sample or the reference standard.
- the mean measured signal intensity value was plotted on the initial calibration curve to provide the analyte equivalent concentrations for each of RF-IgA, RF-IgG, RF-IgM and at least one of CCP-IgG, CCP-IgA and CCP-IgM in the test samples and in the reference standards.
- a Reference Standardization Curve was generated for each of RF-IgA, RF-IgG, RF-IgM and at least one of CCP-IgG, CCP-IgA and CCP-IgM.
- Each of the standardization curves was generated by fitting a curve to the analyte equivalent concentration values for each of the concentrations of the reference standard (AEC2 values).
- the analyte equivalent concentrations for each of RF-IgA, RF-IgG, RF-IgM and at least of CCP-IgG CCP-IgA and CCP-IgM in the test samples were corrected by plotting the appropriate analyte equivalent concentration value on the Reference Standardization Curve to provide a corrected target analyte concentration for each of the above-noted biomarkers.
- a bar graph illustrates measured rheumatoid factor-lgA (RF-IgA), rheumatoid factor-IgG (RF-IgG), rheumatoid factor-IgM (RF-IgM) and anti-cyclic citrullinated peptide-IgG (CCP-IgG) levels and their respective clinical cut-off values.
- Measured levels of the biomarkers that were found to be above the normal levels for each of the biomarkers were identified as being diagnostic for rheumatoid arthritis.
- the measurement of the rheumatoid arthritis biomarker levels may be used to monitor the effect of treatment by measuring the biomarker levels a plurality of times during a treatment period.
Landscapes
- Life Sciences & Earth Sciences (AREA)
- Health & Medical Sciences (AREA)
- Molecular Biology (AREA)
- Engineering & Computer Science (AREA)
- Hematology (AREA)
- Physics & Mathematics (AREA)
- Chemical & Material Sciences (AREA)
- Urology & Nephrology (AREA)
- Immunology (AREA)
- Biomedical Technology (AREA)
- Bioinformatics & Computational Biology (AREA)
- Analytical Chemistry (AREA)
- Biotechnology (AREA)
- Proteomics, Peptides & Aminoacids (AREA)
- Microbiology (AREA)
- Biophysics (AREA)
- Bioinformatics & Cheminformatics (AREA)
- Food Science & Technology (AREA)
- Medicinal Chemistry (AREA)
- Cell Biology (AREA)
- Biochemistry (AREA)
- General Health & Medical Sciences (AREA)
- General Physics & Mathematics (AREA)
- Pathology (AREA)
- Apparatus Associated With Microorganisms And Enzymes (AREA)
- Investigating Or Analysing Materials By The Use Of Chemical Reactions (AREA)
- Investigating Or Analysing Biological Materials (AREA)
Claims (11)
- Verfahren zur Quantifizierung eines oder mehrerer Proteinanalyten in einer Prüfprobe, das Folgendes umfasst:a) Bereitstellen mehrerer diskreter Reaktionssubstrate, auf denen jeweils ein Mikroarray aufgedruckt ist, wobei jedes Reaktionssubstrat in einem Reaktionsgefäß enthalten ist, wobei das Mikroarray Folgendes umfasst:eine Kalibrierungsmatrix, die mehrere Kalibrierungspunkte umfasst, wobei jeder Kalibrierungspunkt eine vorbestimmte Menge einer Kalibrierungsverbindung umfasst, die der eine bzw. die mehreren Analyten ist bzw. sind, wobei jeder Kalibrierungspunkt einer theoretischen Konzentration der Kalibrierungsverbindung entspricht, wobei zwischen 3 und 20 verschiedene theoretische Konzentrationsniveaus des Analyten vorhanden sind, die einer linearen Verdünnungsreihe entsprechen, und wobei zwischen 3 und 15 Wiederholungspunkte für jede der theoretischen Konzentrationen der Kalibrierungsverbindung vorhanden sind; undeine Analytanlagerungsmatrix, die mehrere Anlagerungspunkte umfasst, wobei die Anzahl der mehreren Anlagerungspunkte wenigstens gleich der Gesamtzahl der Punkte der Kalibrierungsmatrix ist, wobei jeder Anlagerungspunkt eine vorbestimmte Menge eines Agens umfasst, der gezielt an den Analyten bindet;b) Aufbringen eines vorbestimmten Volumens der Prüfprobe auf eines der diskreten Reaktionssubstrate;c) Bereitstellen von 3 bis 16 Referenzstandards, die jeweils eine bekannte Konzentration aufweisen und jeweils eine vorbestimmte Menge des einen oder jedes der mehreren Analyten umfassen;d) Aufbringen eines vorbestimmten Volumens jedes Referenzstandards auf eines der diskreten Reaktionssubstrate, vorausgesetzt, dass nur ein Referenzstandard auf jedes Reaktionssubstrat aufgebracht wird; unde) bei jedem diskreten Reaktionssubstrat aus Schritt b) und Schritt d) wird:i) eine markierte Reporterverbindung aufgebracht, wobei die markierte Reporterverbindung eine messbare Signalintensität liefert, die direkt proportional zur Menge des Analyten bzw. der Kalibrierverbindung ist, der bzw. die an jeden Punkt gebunden ist;ii) ein Signalintensitätswert für jeden Punkt innerhalb des Mikroarrays gemessen;iii) eine erste Kalibrierungskurve für das Reaktionssubstrat von Schritt b) erzeugt und eine zweite Kalibrierungskurve für das Reaktionssubstrat von Schritt d) erzeugt, wobei die Kalibrierungskurve jeweils durch Anpassen einer Kurve an ein Diagramm der Signalintensitätswerte gegenüber den theoretischen Konzentrationen der Kalibrierungsverbindung erstellt wird;iv) eine erste zum Analyten äquivalente Konzentration der Prüfprobe unter Verwendung der ersten Kalibrierungskurve bestimmt und eine zweite zum Analyten äquivalente Konzentration jedes der Referenzstandards unter Verwendung der zweiten Kalibrierungskurve bestimmt;f) Erzeugen einer Referenzstandardisierungskurve durch Anpassen einer Kurve an ein Diagramm der zweiten zum Analyten äquivalenten Konzentration gegenüber der bekannten Konzentration jedes der Referenzstandards; undg) Normieren der ersten zum Analyten äquivalenten Konzentration der Prüfprobe unter Verwendung der Referenzstandardisierungskurve, um eine berichtigte Analytkonzentration zu erhalten.
- Verfahren nach Anspruch 1, bei dem in Schritt e)iii) die erste und die zweite Kalibrierungskurve erzeugt werden, indem:1) in der Kalibrierungsmatrix der Signalintensitätswert für jeden der Wiederholungskalibrierungspunkte auf einen mittleren Signalintensitätswert für jeden der Kalibrierungspunkte normiert wird; und2) eine Kurve an ein Diagramm der mittleren Signalintensitätswerte für jeden der Kalibrierungspunkte gegenüber jeder der entsprechenden theoretischen Konzentrationen des entsprechenden Kalibrierungsstandards angepasst wird.
- Verfahren nach Anspruch 1 oder 2, bei dem in Schritt e)iv) die Konzentration des Analyten in der Prüfprobe oder des Referenzstandards bestimmt wird, indem:3) wenn die Analytanlagerungsmatrix zwei oder mehr Anlagerungspunkte umfasst, die Wiederholungen sind, in der Analytanlagerungsmatrix jedes der Reaktionssubstrate von Schritt b) und von Schritt d) der Signalintensitätswert für jeden der Wiederholungsanlagerungspunkte auf einen mittleren Signalintensitätswert normiert wird und der Signalintensitätswert für jeden der Punkte auf einen mittleren Signalintensitätswert für jeden der Anlagerungspunkte normiert wird; und4)i) die Konzentration des Analyten in der Prüfprobe anhand des mittleren Signalintensitätswerts für jeden der Anlagerungspunkte des Reaktionssubstrats von Schritt b) und der ersten Kalibrierungskurve berechnet wird; undii) die Konzentration des Analyten in jedem der Referenzstandards anhand des mittleren Signalintensitätswerts für jeden der Anlagerungspunkte des Reaktionssubstrats von Schritt d) und der zweiten Kalibrierungskurve berechnet wird.
- Verfahren nach Anspruch 2 oder 3, bei dem die Normierung des Messsignalintensitätswerts für jeden der Punkte der Kalibrierungsmatrix und der Probenanlagerungsmatrix durch Anwendung des Tukey's-Biweight-Algorithmus durchgeführt wird.
- Verfahren nach einem der Ansprüche 1 bis 4, bei dem die markierte Reporterverbindung ein fluoreszierend markierter Antikörper ist.
- Verfahren nach einem der Ansprüche 1 bis 5, bei dem die mehreren Reaktionssubstrate in Form einer Multiwell-Assayplatte vorliegen.
- Verfahren nach einem der Ansprüche 1 bis 5, bei dem die mehreren Reaktionssubstrate in Form von mehreren Kügelchen vorliegen.
- Verfahren nach einem der Ansprüche 1 bis 7, bei dem die Prüfprobe eine biologische Probe ist.
- Verfahren nach Anspruch 1, bei dema) die Prüfprobe eine von einer Versuchsperson gewonnene biologische Probe ist,b) der eine oder die mehreren Analyten jeweils Rheumafaktor-IgA, Rheumafaktor-IgG und Rheumafaktor-IgM und wenigstens ein aus der aus antizyklischem citrullinierten Peptid-IgG, antizyklischem citrullinierten Peptid-lgA und antizyklischem citrullinierten Peptid-lgM bestehenden Gruppe ausgewählter antizyklischer citrullinierter Peptid-Antikörper sind,c) der eine oder die mehreren Referenzstandards bekannter Konzentration jeweils Rheumafaktor IgA, Rheumafaktor IgG und Rheumafaktor-IgM und der wenigstens eine ausgewählte antizyklische citrullinierte Peptid-Antikörper sind; und bei demdie in Schritt g) von Anspruch 1 jeweils für Rheumafaktor-IgA, Rheumafaktor-IgG und Rheumafaktor-IgM erlangten berichtigten Analytkonzentrationsgrade mit entsprechenden Indexnormpegeln von Rheumafaktor-IgA, Rheumafaktor-IgG, Rheumafaktor-IgM verglichen werden und die in Schritt g) für den bzw. die ausgewählten antizyklischen citrullinierten Peptid-Antikörper erlangten berichtigten Analytkonzentrationsgrade mit entsprechenden Indexnormpegeln des bzw. der ausgewählten antizyklischen citrullinierten Peptid-Antikörper(s) verglichen werden;
und bei dem ein gemessener, berichtigter Analytkonzentrationsgrad, der die entsprechenden Indexnormpegel überschreitet, charakteristisch für rheumatoide Arthritis ist. - Verfahren nach Anspruch 1 zur Verwendung bei der Überwachung der Behandlung von rheumatoider Arthritis bei einer Versuchsperson, die darunter leidet, wobei der eine oder die mehreren Analyten jeweils Rheumafaktor-IgA, Rheumafaktor-IgG, Rheumafaktor-IgM und wenigstens ein aus der aus antizyklischem citrullinierten Peptid-IgG, antizyklischem citrullinierten Peptid-lgA und antizyklischem citrullinierten Peptid-lgM bestehenden Gruppe ausgewählter antizyklischer citrullinierter Antikörper sind
und die in Schritt g) von Anspruch 1 für den einen oder die mehreren Analyten erlangten berichtigten Analytkonzentrationsgrade während der Behandlung der rheumatoiden Arthritis mehrmals gemessen werden. - Verfahren nach Anspruch 9 oder 10, bei dem das Mikroarray ferner eines oder mehrere der Folgenden umfasst:eine Positivkontrollmatrix mit mehreren Punkten, die eine vorbestimmte Menge an IgA oder Fragmenten davon, eine vorbestimmte Menge an IgG oder Fragmenten davon und eine vorbestimmte Menge an IgM oder Fragmenten davon umfassen;eine Negativkontrollmatrix mit mehreren Punkten, die frei sind von:jeder Verbindung, die mit einer markierten Reporterverbindung wechselwirkt;jeder Verbindung, die gezielt an eine der Folgenden bindet, die aus der aus Rheumafaktor-IgA, Rheumafaktor-IgG, Rheumafaktor-IgM bestehenden Gruppe ausgewählt ist; und jeder Verbindung, die gezielt an eine der Folgenden bindet, die aus der aus antizyklischem citrullinierten Peptid-IgG, antizyklischem citrullinierten Peptid-lgA und antizyklischem citrullinierten Peptid-lgM bestehenden Gruppe ausgewählt ist; undeine Probenkontrollmatrix mit mehreren Punkten, die ein Agens umfassen, das einen der biologischen Probe zugeordneten Analyten gezielt bindet, wobei der Analyt eine in der biologischen Probe natürlich vorkommende Verbindung oder eine der biologischen Probe zugegebene fremde Verbindung ist; mit der Maßgabe, dass der Analyt nicht Rheumafaktor-IgA, Rheumafaktor-IgG, Rheumafaktor-IgM, antizyklisches citrulliniertes Peptid-IgG, antizyklisches citrulliniertes Peptid-lgA oder antizyklisches citrulliniertes Peptid-lgM ist.
Applications Claiming Priority (2)
| Application Number | Priority Date | Filing Date | Title |
|---|---|---|---|
| CA2684636A CA2684636A1 (en) | 2009-10-30 | 2009-10-30 | Multiplex microarrays and methods for the quantification of analytes |
| PCT/CA2010/001698 WO2011050463A1 (en) | 2009-10-30 | 2010-10-29 | Analyte quantification multiplex microarrays combining internal and external calibration |
Publications (3)
| Publication Number | Publication Date |
|---|---|
| EP2510355A1 EP2510355A1 (de) | 2012-10-17 |
| EP2510355A4 EP2510355A4 (de) | 2013-05-22 |
| EP2510355B1 true EP2510355B1 (de) | 2018-08-29 |
Family
ID=43921203
Family Applications (1)
| Application Number | Title | Priority Date | Filing Date |
|---|---|---|---|
| EP10825894.8A Not-in-force EP2510355B1 (de) | 2009-10-30 | 2010-10-29 | Multiplex-mikroarrays zur analytquantifizierung mit interner und externer kalibrierung |
Country Status (7)
| Country | Link |
|---|---|
| US (1) | US10119973B2 (de) |
| EP (1) | EP2510355B1 (de) |
| JP (1) | JP5823968B2 (de) |
| CN (1) | CN102713620B (de) |
| AU (1) | AU2010312284B2 (de) |
| CA (2) | CA2684636A1 (de) |
| WO (1) | WO2011050463A1 (de) |
Families Citing this family (16)
| Publication number | Priority date | Publication date | Assignee | Title |
|---|---|---|---|---|
| CA2647953A1 (en) * | 2008-12-29 | 2010-06-29 | Sqi Diagnostics Systems Inc. | Multiplex analyte detection |
| US10488393B2 (en) | 2010-09-30 | 2019-11-26 | Robert Bosch Gmbh | Device and method for self-referenced confidence test |
| GB201105828D0 (en) * | 2011-04-06 | 2011-05-18 | Vivacta Ltd | A device for detecting an analyte |
| AU2012271858B2 (en) * | 2011-06-13 | 2017-05-25 | Indevr, Inc. | Low density microarrays for vaccine related protein quantification, potency determination and efficacy evaluation |
| US10379110B2 (en) | 2011-09-14 | 2019-08-13 | Phadia Ab | Calibration reagent and method |
| EP2761585B1 (de) * | 2011-09-30 | 2019-08-07 | Life Technologies Corporation | Verfahren zur effizienzsteigerung optischer kalibration |
| WO2013077864A1 (en) * | 2011-11-22 | 2013-05-30 | Robert Bosch Gmbh | Method for self-referenced confidence test |
| US10732180B2 (en) | 2014-06-04 | 2020-08-04 | Indevr, Inc. | Universal capture array for multiplexed subtype-specific quantification and stability determination of influenza proteins |
| WO2016120762A1 (en) * | 2015-01-26 | 2016-08-04 | Dh Technologies Development Pte. Ltd. | Automatic quantitative regression |
| US9904890B2 (en) * | 2015-03-13 | 2018-02-27 | Instrumentation Laboratory Company | Detecting a transient error in a body fluid sample |
| EP3692367B1 (de) * | 2017-10-04 | 2025-07-02 | Unisensor | Vorrichtung zum optischen auslesen "a la carte" von einem abnehmbaren festen träger zum nachweis und/oder zur quantifizierung von analyten in einer probe |
| WO2019193034A1 (en) * | 2018-04-06 | 2019-10-10 | Boehringer Ingelheim Vetmedica Gmbh | Method for determining an analyte, and analysis system |
| EP3591401A1 (de) * | 2018-07-06 | 2020-01-08 | Euroimmun Medizinische Labordiagnostika AG | Verfahren zum automatisierten detektieren von antikörpern in einer flüssigen biologischen probe unter verwendung eines antigen-chips und antigen-chip hierfür |
| WO2020044151A1 (en) | 2018-08-29 | 2020-03-05 | CANNAVALE, Giuseppe | System and method for solid phase analysis of biological samples |
| IT201800008227A1 (it) * | 2018-08-29 | 2020-02-29 | Cannavale Giuseppe | Metodo e sistema per la determinazione di immunoglobuline totali o dirette contro allergeni o altre molecole in campioni acquosi |
| GB201904472D0 (en) * | 2019-03-29 | 2019-05-15 | Immunovia Ab | Methods, arrays and uses thereof |
Family Cites Families (13)
| Publication number | Priority date | Publication date | Assignee | Title |
|---|---|---|---|---|
| EP0063810B1 (de) | 1981-04-29 | 1986-03-05 | Ciba-Geigy Ag | Prüfmittel und Ausrüstung für immunologische Analysen |
| US6429027B1 (en) * | 1998-12-28 | 2002-08-06 | Illumina, Inc. | Composite arrays utilizing microspheres |
| DE10127572A1 (de) * | 2001-05-30 | 2002-12-05 | Pathoarray Gmbh | Werkzeuge zur Diagnostik, molekularen Definition und Therapieentwicklung chronischer entzündlicher Gelenkerkrankungen |
| US6916621B2 (en) * | 2002-03-27 | 2005-07-12 | Spectral Genomics, Inc. | Methods for array-based comparitive binding assays |
| US20060210984A1 (en) * | 2003-03-03 | 2006-09-21 | Jeremy Lambert | Use of nucleic acid mimics for internal reference and calibration in a flow cell microarray binding assay |
| GB0311902D0 (en) * | 2003-05-22 | 2003-06-25 | Cambridge Life Sciences | Assay method and apparatus |
| JP2005114532A (ja) * | 2003-10-07 | 2005-04-28 | Fuji Photo Film Co Ltd | 化学発光検出方法およびシステム並びに生化学解析アレイ |
| CA2475240A1 (en) * | 2004-07-20 | 2006-01-20 | Biophys, Inc. | Method and device to measure dynamic internal calibration true dose response curves |
| CA2475456A1 (en) * | 2004-07-20 | 2006-01-20 | Biophys, Inc. | Method and device to optimize analyte and antibody substrate binding by least energy adsorption |
| JP4789518B2 (ja) * | 2005-06-30 | 2011-10-12 | キヤノン株式会社 | 製造条件付きプローブ固定担体を用いた標的物質の検出方法ならびにそのための装置、キット及びシステム |
| JP5071987B2 (ja) * | 2005-11-14 | 2012-11-14 | ジェン−プロウブ インコーポレイテッド | パラメトリック較正方法 |
| GB0803107D0 (en) * | 2008-02-20 | 2008-03-26 | Axis Shield Diagnostics Ltd | Method |
| CA2647953A1 (en) | 2008-12-29 | 2010-06-29 | Sqi Diagnostics Systems Inc. | Multiplex analyte detection |
-
2009
- 2009-10-30 CA CA2684636A patent/CA2684636A1/en not_active Abandoned
-
2010
- 2010-10-29 JP JP2012535560A patent/JP5823968B2/ja not_active Expired - Fee Related
- 2010-10-29 AU AU2010312284A patent/AU2010312284B2/en not_active Ceased
- 2010-10-29 EP EP10825894.8A patent/EP2510355B1/de not_active Not-in-force
- 2010-10-29 US US13/504,748 patent/US10119973B2/en active Active
- 2010-10-29 CN CN201080060201.0A patent/CN102713620B/zh not_active Expired - Fee Related
- 2010-10-29 CA CA2779306A patent/CA2779306C/en active Active
- 2010-10-29 WO PCT/CA2010/001698 patent/WO2011050463A1/en not_active Ceased
Non-Patent Citations (1)
| Title |
|---|
| None * |
Also Published As
| Publication number | Publication date |
|---|---|
| US20120283122A1 (en) | 2012-11-08 |
| WO2011050463A1 (en) | 2011-05-05 |
| EP2510355A4 (de) | 2013-05-22 |
| CA2779306A1 (en) | 2011-05-05 |
| AU2010312284B2 (en) | 2015-11-05 |
| CA2779306C (en) | 2016-06-14 |
| AU2010312284A1 (en) | 2012-06-14 |
| CN102713620A (zh) | 2012-10-03 |
| EP2510355A1 (de) | 2012-10-17 |
| US10119973B2 (en) | 2018-11-06 |
| JP5823968B2 (ja) | 2015-11-25 |
| CA2684636A1 (en) | 2011-04-30 |
| JP2013508732A (ja) | 2013-03-07 |
| CN102713620B (zh) | 2016-02-10 |
Similar Documents
| Publication | Publication Date | Title |
|---|---|---|
| US10119973B2 (en) | Analyte quantification multiplex microarrays combining internal and external calibration | |
| Kingsmore | Multiplexed protein measurement: technologies and applications of protein and antibody arrays | |
| Hartmann et al. | Protein microarrays for diagnostic assays | |
| Schweitzer et al. | Measuring proteins on microarrays | |
| CN101044402B (zh) | 测量动态内部校准真值剂量反应曲线的方法 | |
| CN103149369B (zh) | 一种检测食管鳞癌标志物的蛋白质芯片及其试剂盒 | |
| US20110306511A1 (en) | Methods for multiplex analyte detection and quantification | |
| WO2001014425A1 (en) | Multipurpose diagnostic systems using protein chips | |
| Master et al. | Diagnostic challenges for multiplexed protein microarrays | |
| US12174187B2 (en) | Methods for detecting multiple sclerosis (MS) diagnostic autoantibodies | |
| EP2515271B1 (de) | Verfahren zur Analyse von Reagenzkügelchen | |
| WO2010009387A1 (en) | Methods for controlling protein loading variability in reverse phase protein microarrays | |
| HK1176679A (en) | Analyte quantification multiplex microarrays combining internal and external calibration | |
| Kricka et al. | Validation and quality control of protein microarray-based analytical methods | |
| US20060281134A1 (en) | Method for analyzing biological data sets | |
| CN119351550A (zh) | 腹膜后脂肪肉瘤预后生物标志物及其应用 | |
| EP2783215B1 (de) | Methode für selbstreferenzierten konfidenztest | |
| Knickerbocker et al. | Detecting and quantifying multiple proteins in clinical samples in high-throughput using antibody microarrays | |
| EP2535862A1 (de) | Verfahren zur Analyse von Reagenzkügelchen | |
| Sonntag et al. | Microspot immunoassay-based analysis of plasma protein profiles for biomarker discovery strategies |
Legal Events
| Date | Code | Title | Description |
|---|---|---|---|
| PUAI | Public reference made under article 153(3) epc to a published international application that has entered the european phase |
Free format text: ORIGINAL CODE: 0009012 |
|
| 17P | Request for examination filed |
Effective date: 20120903 |
|
| AK | Designated contracting states |
Kind code of ref document: A1 Designated state(s): AL AT BE BG CH CY CZ DE DK EE ES FI FR GB GR HR HU IE IS IT LI LT LU LV MC MK MT NL NO PL PT RO RS SE SI SK SM TR |
|
| DAX | Request for extension of the european patent (deleted) | ||
| REG | Reference to a national code |
Ref country code: DE Ref legal event code: R079 Ref document number: 602010053191 Country of ref document: DE Free format text: PREVIOUS MAIN CLASS: G01N0033530000 Ipc: G01N0033680000 |
|
| A4 | Supplementary search report drawn up and despatched |
Effective date: 20130419 |
|
| RIC1 | Information provided on ipc code assigned before grant |
Ipc: G01N 33/68 20060101AFI20130415BHEP |
|
| 17Q | First examination report despatched |
Effective date: 20140509 |
|
| GRAP | Despatch of communication of intention to grant a patent |
Free format text: ORIGINAL CODE: EPIDOSNIGR1 |
|
| INTG | Intention to grant announced |
Effective date: 20180322 |
|
| GRAS | Grant fee paid |
Free format text: ORIGINAL CODE: EPIDOSNIGR3 |
|
| GRAA | (expected) grant |
Free format text: ORIGINAL CODE: 0009210 |
|
| AK | Designated contracting states |
Kind code of ref document: B1 Designated state(s): AL AT BE BG CH CY CZ DE DK EE ES FI FR GB GR HR HU IE IS IT LI LT LU LV MC MK MT NL NO PL PT RO RS SE SI SK SM TR |
|
| REG | Reference to a national code |
Ref country code: GB Ref legal event code: FG4D |
|
| REG | Reference to a national code |
Ref country code: CH Ref legal event code: EP |
|
| REG | Reference to a national code |
Ref country code: AT Ref legal event code: REF Ref document number: 1035738 Country of ref document: AT Kind code of ref document: T Effective date: 20180915 |
|
| REG | Reference to a national code |
Ref country code: IE Ref legal event code: FG4D |
|
| REG | Reference to a national code |
Ref country code: DE Ref legal event code: R096 Ref document number: 602010053191 Country of ref document: DE |
|
| REG | Reference to a national code |
Ref country code: FR Ref legal event code: PLFP Year of fee payment: 9 |
|
| REG | Reference to a national code |
Ref country code: NL Ref legal event code: MP Effective date: 20180829 |
|
| REG | Reference to a national code |
Ref country code: LT Ref legal event code: MG4D |
|
| PG25 | Lapsed in a contracting state [announced via postgrant information from national office to epo] |
Ref country code: FI Free format text: LAPSE BECAUSE OF FAILURE TO SUBMIT A TRANSLATION OF THE DESCRIPTION OR TO PAY THE FEE WITHIN THE PRESCRIBED TIME-LIMIT Effective date: 20180829 Ref country code: GR Free format text: LAPSE BECAUSE OF FAILURE TO SUBMIT A TRANSLATION OF THE DESCRIPTION OR TO PAY THE FEE WITHIN THE PRESCRIBED TIME-LIMIT Effective date: 20181130 Ref country code: LT Free format text: LAPSE BECAUSE OF FAILURE TO SUBMIT A TRANSLATION OF THE DESCRIPTION OR TO PAY THE FEE WITHIN THE PRESCRIBED TIME-LIMIT Effective date: 20180829 Ref country code: IS Free format text: LAPSE BECAUSE OF FAILURE TO SUBMIT A TRANSLATION OF THE DESCRIPTION OR TO PAY THE FEE WITHIN THE PRESCRIBED TIME-LIMIT Effective date: 20181229 Ref country code: NL Free format text: LAPSE BECAUSE OF FAILURE TO SUBMIT A TRANSLATION OF THE DESCRIPTION OR TO PAY THE FEE WITHIN THE PRESCRIBED TIME-LIMIT Effective date: 20180829 Ref country code: NO Free format text: LAPSE BECAUSE OF FAILURE TO SUBMIT A TRANSLATION OF THE DESCRIPTION OR TO PAY THE FEE WITHIN THE PRESCRIBED TIME-LIMIT Effective date: 20181129 Ref country code: BG Free format text: LAPSE BECAUSE OF FAILURE TO SUBMIT A TRANSLATION OF THE DESCRIPTION OR TO PAY THE FEE WITHIN THE PRESCRIBED TIME-LIMIT Effective date: 20181129 Ref country code: RS Free format text: LAPSE BECAUSE OF FAILURE TO SUBMIT A TRANSLATION OF THE DESCRIPTION OR TO PAY THE FEE WITHIN THE PRESCRIBED TIME-LIMIT Effective date: 20180829 Ref country code: SE Free format text: LAPSE BECAUSE OF FAILURE TO SUBMIT A TRANSLATION OF THE DESCRIPTION OR TO PAY THE FEE WITHIN THE PRESCRIBED TIME-LIMIT Effective date: 20180829 |
|
| REG | Reference to a national code |
Ref country code: AT Ref legal event code: MK05 Ref document number: 1035738 Country of ref document: AT Kind code of ref document: T Effective date: 20180829 |
|
| PG25 | Lapsed in a contracting state [announced via postgrant information from national office to epo] |
Ref country code: AL Free format text: LAPSE BECAUSE OF FAILURE TO SUBMIT A TRANSLATION OF THE DESCRIPTION OR TO PAY THE FEE WITHIN THE PRESCRIBED TIME-LIMIT Effective date: 20180829 Ref country code: LV Free format text: LAPSE BECAUSE OF FAILURE TO SUBMIT A TRANSLATION OF THE DESCRIPTION OR TO PAY THE FEE WITHIN THE PRESCRIBED TIME-LIMIT Effective date: 20180829 Ref country code: HR Free format text: LAPSE BECAUSE OF FAILURE TO SUBMIT A TRANSLATION OF THE DESCRIPTION OR TO PAY THE FEE WITHIN THE PRESCRIBED TIME-LIMIT Effective date: 20180829 |
|
| PG25 | Lapsed in a contracting state [announced via postgrant information from national office to epo] |
Ref country code: ES Free format text: LAPSE BECAUSE OF FAILURE TO SUBMIT A TRANSLATION OF THE DESCRIPTION OR TO PAY THE FEE WITHIN THE PRESCRIBED TIME-LIMIT Effective date: 20180829 Ref country code: EE Free format text: LAPSE BECAUSE OF FAILURE TO SUBMIT A TRANSLATION OF THE DESCRIPTION OR TO PAY THE FEE WITHIN THE PRESCRIBED TIME-LIMIT Effective date: 20180829 Ref country code: PL Free format text: LAPSE BECAUSE OF FAILURE TO SUBMIT A TRANSLATION OF THE DESCRIPTION OR TO PAY THE FEE WITHIN THE PRESCRIBED TIME-LIMIT Effective date: 20180829 Ref country code: IT Free format text: LAPSE BECAUSE OF FAILURE TO SUBMIT A TRANSLATION OF THE DESCRIPTION OR TO PAY THE FEE WITHIN THE PRESCRIBED TIME-LIMIT Effective date: 20180829 Ref country code: CZ Free format text: LAPSE BECAUSE OF FAILURE TO SUBMIT A TRANSLATION OF THE DESCRIPTION OR TO PAY THE FEE WITHIN THE PRESCRIBED TIME-LIMIT Effective date: 20180829 Ref country code: AT Free format text: LAPSE BECAUSE OF FAILURE TO SUBMIT A TRANSLATION OF THE DESCRIPTION OR TO PAY THE FEE WITHIN THE PRESCRIBED TIME-LIMIT Effective date: 20180829 Ref country code: RO Free format text: LAPSE BECAUSE OF FAILURE TO SUBMIT A TRANSLATION OF THE DESCRIPTION OR TO PAY THE FEE WITHIN THE PRESCRIBED TIME-LIMIT Effective date: 20180829 |
|
| PG25 | Lapsed in a contracting state [announced via postgrant information from national office to epo] |
Ref country code: DK Free format text: LAPSE BECAUSE OF FAILURE TO SUBMIT A TRANSLATION OF THE DESCRIPTION OR TO PAY THE FEE WITHIN THE PRESCRIBED TIME-LIMIT Effective date: 20180829 Ref country code: SM Free format text: LAPSE BECAUSE OF FAILURE TO SUBMIT A TRANSLATION OF THE DESCRIPTION OR TO PAY THE FEE WITHIN THE PRESCRIBED TIME-LIMIT Effective date: 20180829 Ref country code: SK Free format text: LAPSE BECAUSE OF FAILURE TO SUBMIT A TRANSLATION OF THE DESCRIPTION OR TO PAY THE FEE WITHIN THE PRESCRIBED TIME-LIMIT Effective date: 20180829 |
|
| REG | Reference to a national code |
Ref country code: CH Ref legal event code: PL Ref country code: DE Ref legal event code: R097 Ref document number: 602010053191 Country of ref document: DE |
|
| REG | Reference to a national code |
Ref country code: BE Ref legal event code: MM Effective date: 20181031 |
|
| PG25 | Lapsed in a contracting state [announced via postgrant information from national office to epo] |
Ref country code: LU Free format text: LAPSE BECAUSE OF NON-PAYMENT OF DUE FEES Effective date: 20181029 Ref country code: MC Free format text: LAPSE BECAUSE OF FAILURE TO SUBMIT A TRANSLATION OF THE DESCRIPTION OR TO PAY THE FEE WITHIN THE PRESCRIBED TIME-LIMIT Effective date: 20180829 |
|
| PLBE | No opposition filed within time limit |
Free format text: ORIGINAL CODE: 0009261 |
|
| STAA | Information on the status of an ep patent application or granted ep patent |
Free format text: STATUS: NO OPPOSITION FILED WITHIN TIME LIMIT |
|
| 26N | No opposition filed |
Effective date: 20190531 |
|
| PG25 | Lapsed in a contracting state [announced via postgrant information from national office to epo] |
Ref country code: BE Free format text: LAPSE BECAUSE OF NON-PAYMENT OF DUE FEES Effective date: 20181031 Ref country code: LI Free format text: LAPSE BECAUSE OF NON-PAYMENT OF DUE FEES Effective date: 20181031 Ref country code: CH Free format text: LAPSE BECAUSE OF NON-PAYMENT OF DUE FEES Effective date: 20181031 Ref country code: SI Free format text: LAPSE BECAUSE OF FAILURE TO SUBMIT A TRANSLATION OF THE DESCRIPTION OR TO PAY THE FEE WITHIN THE PRESCRIBED TIME-LIMIT Effective date: 20180829 |
|
| PG25 | Lapsed in a contracting state [announced via postgrant information from national office to epo] |
Ref country code: MT Free format text: LAPSE BECAUSE OF NON-PAYMENT OF DUE FEES Effective date: 20181029 |
|
| PG25 | Lapsed in a contracting state [announced via postgrant information from national office to epo] |
Ref country code: TR Free format text: LAPSE BECAUSE OF FAILURE TO SUBMIT A TRANSLATION OF THE DESCRIPTION OR TO PAY THE FEE WITHIN THE PRESCRIBED TIME-LIMIT Effective date: 20180829 |
|
| PG25 | Lapsed in a contracting state [announced via postgrant information from national office to epo] |
Ref country code: PT Free format text: LAPSE BECAUSE OF FAILURE TO SUBMIT A TRANSLATION OF THE DESCRIPTION OR TO PAY THE FEE WITHIN THE PRESCRIBED TIME-LIMIT Effective date: 20180829 |
|
| PG25 | Lapsed in a contracting state [announced via postgrant information from national office to epo] |
Ref country code: CY Free format text: LAPSE BECAUSE OF FAILURE TO SUBMIT A TRANSLATION OF THE DESCRIPTION OR TO PAY THE FEE WITHIN THE PRESCRIBED TIME-LIMIT Effective date: 20180829 Ref country code: HU Free format text: LAPSE BECAUSE OF FAILURE TO SUBMIT A TRANSLATION OF THE DESCRIPTION OR TO PAY THE FEE WITHIN THE PRESCRIBED TIME-LIMIT; INVALID AB INITIO Effective date: 20101029 Ref country code: MK Free format text: LAPSE BECAUSE OF NON-PAYMENT OF DUE FEES Effective date: 20180829 |
|
| PGFP | Annual fee paid to national office [announced via postgrant information from national office to epo] |
Ref country code: FR Payment date: 20221031 Year of fee payment: 13 |
|
| PGFP | Annual fee paid to national office [announced via postgrant information from national office to epo] |
Ref country code: IE Payment date: 20221021 Year of fee payment: 13 Ref country code: GB Payment date: 20221020 Year of fee payment: 13 Ref country code: DE Payment date: 20221021 Year of fee payment: 13 |
|
| REG | Reference to a national code |
Ref country code: DE Ref legal event code: R119 Ref document number: 602010053191 Country of ref document: DE |
|
| GBPC | Gb: european patent ceased through non-payment of renewal fee |
Effective date: 20231029 |
|
| PG25 | Lapsed in a contracting state [announced via postgrant information from national office to epo] |
Ref country code: GB Free format text: LAPSE BECAUSE OF NON-PAYMENT OF DUE FEES Effective date: 20231029 |
|
| PG25 | Lapsed in a contracting state [announced via postgrant information from national office to epo] |
Ref country code: GB Free format text: LAPSE BECAUSE OF NON-PAYMENT OF DUE FEES Effective date: 20231029 Ref country code: FR Free format text: LAPSE BECAUSE OF NON-PAYMENT OF DUE FEES Effective date: 20231031 Ref country code: DE Free format text: LAPSE BECAUSE OF NON-PAYMENT OF DUE FEES Effective date: 20240501 |
|
| PG25 | Lapsed in a contracting state [announced via postgrant information from national office to epo] |
Ref country code: IE Free format text: LAPSE BECAUSE OF NON-PAYMENT OF DUE FEES Effective date: 20231029 |
|
| PG25 | Lapsed in a contracting state [announced via postgrant information from national office to epo] |
Ref country code: IE Free format text: LAPSE BECAUSE OF NON-PAYMENT OF DUE FEES Effective date: 20231029 |