EP2526871A1 - Ultraschalldiagnosevorrichtung und verfahren zur anzeige von ultraschallbildern - Google Patents
Ultraschalldiagnosevorrichtung und verfahren zur anzeige von ultraschallbildern Download PDFInfo
- Publication number
- EP2526871A1 EP2526871A1 EP10843129A EP10843129A EP2526871A1 EP 2526871 A1 EP2526871 A1 EP 2526871A1 EP 10843129 A EP10843129 A EP 10843129A EP 10843129 A EP10843129 A EP 10843129A EP 2526871 A1 EP2526871 A1 EP 2526871A1
- Authority
- EP
- European Patent Office
- Prior art keywords
- opacity
- elastic
- region
- dimensional
- line
- Prior art date
- Legal status (The legal status is an assumption and is not a legal conclusion. Google has not performed a legal analysis and makes no representation as to the accuracy of the status listed.)
- Withdrawn
Links
Images





Classifications
-
- A—HUMAN NECESSITIES
- A61—MEDICAL OR VETERINARY SCIENCE; HYGIENE
- A61B—DIAGNOSIS; SURGERY; IDENTIFICATION
- A61B8/00—Diagnosis using ultrasonic, sonic or infrasonic waves
- A61B8/08—Clinical applications
-
- A—HUMAN NECESSITIES
- A61—MEDICAL OR VETERINARY SCIENCE; HYGIENE
- A61B—DIAGNOSIS; SURGERY; IDENTIFICATION
- A61B8/00—Diagnosis using ultrasonic, sonic or infrasonic waves
- A61B8/46—Ultrasonic, sonic or infrasonic diagnostic devices with special arrangements for interfacing with the operator or the patient
- A61B8/461—Displaying means of special interest
- A61B8/463—Displaying means of special interest characterised by displaying multiple images or images and diagnostic data on one display
-
- A—HUMAN NECESSITIES
- A61—MEDICAL OR VETERINARY SCIENCE; HYGIENE
- A61B—DIAGNOSIS; SURGERY; IDENTIFICATION
- A61B8/00—Diagnosis using ultrasonic, sonic or infrasonic waves
- A61B8/46—Ultrasonic, sonic or infrasonic diagnostic devices with special arrangements for interfacing with the operator or the patient
- A61B8/461—Displaying means of special interest
- A61B8/466—Displaying means of special interest adapted to display 3D data
-
- A—HUMAN NECESSITIES
- A61—MEDICAL OR VETERINARY SCIENCE; HYGIENE
- A61B—DIAGNOSIS; SURGERY; IDENTIFICATION
- A61B8/00—Diagnosis using ultrasonic, sonic or infrasonic waves
- A61B8/48—Diagnostic techniques
- A61B8/483—Diagnostic techniques involving the acquisition of a 3D volume of data
-
- A—HUMAN NECESSITIES
- A61—MEDICAL OR VETERINARY SCIENCE; HYGIENE
- A61B—DIAGNOSIS; SURGERY; IDENTIFICATION
- A61B8/00—Diagnosis using ultrasonic, sonic or infrasonic waves
- A61B8/48—Diagnostic techniques
- A61B8/485—Diagnostic techniques involving measuring strain or elastic properties
-
- A—HUMAN NECESSITIES
- A61—MEDICAL OR VETERINARY SCIENCE; HYGIENE
- A61B—DIAGNOSIS; SURGERY; IDENTIFICATION
- A61B8/00—Diagnosis using ultrasonic, sonic or infrasonic waves
- A61B8/52—Devices using data or image processing specially adapted for diagnosis using ultrasonic, sonic or infrasonic waves
- A61B8/5215—Devices using data or image processing specially adapted for diagnosis using ultrasonic, sonic or infrasonic waves involving processing of medical diagnostic data
- A61B8/5223—Devices using data or image processing specially adapted for diagnosis using ultrasonic, sonic or infrasonic waves involving processing of medical diagnostic data for extracting a diagnostic or physiological parameter from medical diagnostic data
-
- G—PHYSICS
- G01—MEASURING; TESTING
- G01S—RADIO DIRECTION-FINDING; RADIO NAVIGATION; DETERMINING DISTANCE OR VELOCITY BY USE OF RADIO WAVES; LOCATING OR PRESENCE-DETECTING BY USE OF THE REFLECTION OR RERADIATION OF RADIO WAVES; ANALOGOUS ARRANGEMENTS USING OTHER WAVES
- G01S7/00—Details of systems according to groups G01S13/00, G01S15/00, G01S17/00
- G01S7/52—Details of systems according to groups G01S13/00, G01S15/00, G01S17/00 of systems according to group G01S15/00
- G01S7/52017—Details of systems according to groups G01S13/00, G01S15/00, G01S17/00 of systems according to group G01S15/00 particularly adapted to short-range imaging
- G01S7/52053—Display arrangements
- G01S7/52057—Cathode ray tube displays
- G01S7/52071—Multicolour displays; using colour coding; Optimising colour or information content in displays, e.g. parametric imaging
-
- G—PHYSICS
- G06—COMPUTING OR CALCULATING; COUNTING
- G06T—IMAGE DATA PROCESSING OR GENERATION, IN GENERAL
- G06T15/00—Three-dimensional [3D] image rendering
- G06T15/08—Volume rendering
-
- G—PHYSICS
- G16—INFORMATION AND COMMUNICATION TECHNOLOGY [ICT] SPECIALLY ADAPTED FOR SPECIFIC APPLICATION FIELDS
- G16H—HEALTHCARE INFORMATICS, i.e. INFORMATION AND COMMUNICATION TECHNOLOGY [ICT] SPECIALLY ADAPTED FOR THE HANDLING OR PROCESSING OF MEDICAL OR HEALTHCARE DATA
- G16H50/00—ICT specially adapted for medical diagnosis, medical simulation or medical data mining; ICT specially adapted for detecting, monitoring or modelling epidemics or pandemics
- G16H50/30—ICT specially adapted for medical diagnosis, medical simulation or medical data mining; ICT specially adapted for detecting, monitoring or modelling epidemics or pandemics for calculating health indices; for individual health risk assessment
-
- G—PHYSICS
- G01—MEASURING; TESTING
- G01S—RADIO DIRECTION-FINDING; RADIO NAVIGATION; DETERMINING DISTANCE OR VELOCITY BY USE OF RADIO WAVES; LOCATING OR PRESENCE-DETECTING BY USE OF THE REFLECTION OR RERADIATION OF RADIO WAVES; ANALOGOUS ARRANGEMENTS USING OTHER WAVES
- G01S15/00—Systems using the reflection or reradiation of acoustic waves, e.g. sonar systems
- G01S15/88—Sonar systems specially adapted for specific applications
- G01S15/89—Sonar systems specially adapted for specific applications for mapping or imaging
- G01S15/8906—Short-range imaging systems; Acoustic microscope systems using pulse-echo techniques
- G01S15/8993—Three dimensional imaging systems
-
- G—PHYSICS
- G01—MEASURING; TESTING
- G01S—RADIO DIRECTION-FINDING; RADIO NAVIGATION; DETERMINING DISTANCE OR VELOCITY BY USE OF RADIO WAVES; LOCATING OR PRESENCE-DETECTING BY USE OF THE REFLECTION OR RERADIATION OF RADIO WAVES; ANALOGOUS ARRANGEMENTS USING OTHER WAVES
- G01S7/00—Details of systems according to groups G01S13/00, G01S15/00, G01S17/00
- G01S7/52—Details of systems according to groups G01S13/00, G01S15/00, G01S17/00 of systems according to group G01S15/00
- G01S7/52017—Details of systems according to groups G01S13/00, G01S15/00, G01S17/00 of systems according to group G01S15/00 particularly adapted to short-range imaging
- G01S7/52053—Display arrangements
- G01S7/52057—Cathode ray tube displays
- G01S7/52073—Production of cursor lines, markers or indicia by electronic means
Definitions
- the present invention relates to an ultrasonic diagnostic apparatus and an ultrasonic image display method capable of displaying a 3-dimensional elastic image showing the hardness or softness of biological tissue in an object using ultrasonic waves.
- An ultrasonic diagnostic apparatus transmits ultrasonic waves to the inside of an object to be examined by an ultrasonic probe, and is capable of obtaining and displaying a 3-dimensional tomographic image and a 3-dimensional elastic image on the basis of the reception signals received from the biological tissue in the object.
- the opacity of the 3-dimensional tomographic image is set so that the profile or volume of the hard region or soft region in the 3-dimensional elastic image can be recognized (for example, Patent Document 1).
- Patent Document 1 JP-A-2008-259605
- Patent Document 1 performs volume rendering of a 3-dimensional tomographic image based on an opacity table in which the opacity is defined in accordance with the feature quantity of an elasticity value, the setting of opacity in the volume rendering process of the 3-dimensional elastic image is not disclosed therein.
- the objective of the present invention is to provide the ultrasonic diagnostic apparatus and the ultrasonic image display method capable of appropriately displaying a desired region of interest in a 3-dimensional elastic image.
- the ultrasonic diagnostic apparatus of the present invention comprises:
- the ultrasonic diagnostic apparatus 100 comprises an ultrasonic probe 102 configured to be used by applying to an object 101, a transmission unit 105 configured to repeatedly transmit ultrasonic waves to the object 101 via the ultrasonic probe 102 at predetermined time intervals, a reception unit 106 configured to receive the reflected echo signals reflected from the object 101, a transmission/reception control unit 107 configured to control the transmission unit 105 and the reception unit 106, and a phasing and adding unit 108 configured to perform phasing and adding on the reflected echoes received by the reception unit 106.
- the ultrasonic probe 102 is formed by a plurality of transducers arrayed therein, and has a function to transmit/receive ultrasonic waves to the object via the transducers.
- the ultrasonic probe 102 is formed by a plurality of rectangle or fan-shaped transducers, capable of transmitting/receiving ultrasonic waves 3-dimensionally by mechanically vibrating the transducers in the direction orthogonal to the array direction of the plurality of transducers.
- the ultrasonic probe 102 may also be provided with a plurality of transducers being 2-dimensionally arrayed therein and a function capable of electronically controlling transmission and reception of ultrasonic waves.
- the transmission unit 105 generates a transmission pulse for generating an ultrasonic wave by activating transducers of the ultrasonic probe 102.
- the transmission unit 105 has a function to set the convergent point of a transmitted ultrasonic wave at a certain depth.
- the reception unit 106 generates an RF signal, i.e. a reception signal by amplifying the reflected echo signal received by the ultrasonic probe 102 at a predetermined gain.
- the ultrasonic transmission/reception control unit 107 controls the transmission unit 105 and the reception unit 106.
- the phasing and adding unit 108 controls the phase of the RF signal which is amplified in the reception unit 106 and generates RF signal frame data (equivalent to RAW data) by forming an ultrasonic beam with respect to one or plural convergent points.
- the ultrasonic diagnostic apparatus 100 comprises a data storage unit 109 configured to store the RF signal frame data generated in the phasing and adding unit 108, a 2-dimensional tomographic image constructing unit 113 configured to construct a 2-dimensional tomographic image on the basis of the RF signal frame data stored in the data storage unit 109, a tomographic volume data generating unit 115 configured to generate tomographic volume data by performing 3-dimensional coordinate conversion on the 2-dimensional tomographic image constructed by the 2-dimensional tomographic image constructing unit 113 on the basis of the position where the 2-dimensional tomographic image is obtained, a 3-dimensional tomographic image constructing unit 117 configured to construct a 3-dimensional tomographic image from tomographic volume data, a 2-dimensional elastic image constructing unit 114 configured to construct a 2-dimensional elastic image on the basis of the plural sets of RF signal frame data stored in the data storage unit 109, an elastic volume data generating unit 116 configured to generate elastic volume data by performing 3-dimensional coordinate conversion on the 2-dimensional elastic image constructed in the 2-dimensional elastic image
- the ultrasonic diagnostic apparatus 100 comprises a control unit 103 configured to control the above-described components and an operation unit 104 configured to perform various input to the control unit 103.
- the operation unit 104 comprises devices such as a keyboard or a trackball.
- the 2-dimensional tomographic image constructing unit 113 executes signal processing such as gain compensation, log compression, detection, edge enhancement or filtering by inputting the RF signal frame data output from the data storage unit 109 on the basis of the setting condition in the control unit 103, and constructs a 2-dimensional tomographic image.
- signal processing such as gain compensation, log compression, detection, edge enhancement or filtering
- the ultrasonic probe 2 is capable of measuring the transmission/reception directions ( ⁇ , ⁇ ) at the time of transmitting and receiving ultrasonic waves, and the tomographic volume data generating unit 115 generates the tomographic volume data by executing 3-dimensional conversion on plural 2-dimensional tomographic images on the basis of the transmission/reception directions ( ⁇ , ⁇ ) which are equivalent to the positions where the 2-dimensional images are obtained.
- the 3-dimensional tomographic image constructing unit 117 performs volume rendering on the basis of the luminance and the opacity of the tomographic volume data.
- the 3-dimensional tomographic image constructing unit 117 is configured by a tomogrpahic opacity table creating section 200 and a tomographic rendering calculation section 202 as shown in Fig. 2(a) .
- the tomographic opacity table creating section 200 creates a tomographic opacity table in which the luminance of a tomographic image represented by voxel values is set as the lateral axis and the opacity is set as the vertical axis.
- the tomographic rendering calculation section 202 performs volume rendering on the basis of the created tomographic opacity table using the following equation for constructing a 3-dimensional tomographic image from the tomographic volume data.
- C(i) is the luminance value of the i-th voxel that exists on the line of sight when a 3-dimensional tomographic image is viewed from a certain point on the created 2-dimensional projected plane.
- Cout(i-1) represents the integrated value up to the (i-1)-th voxel.
- A(i) is the opacity of the i-th luminance value that exists on the line of sight, and is the tomographic opacity table which takes the values of 0 ⁇ 1.0 as indicated in the above equation (3).
- the tomographic opacity table is generated in the tomographic opacity table creating section 200, and determines the contribution ratio on the output 2-dimensional projected plane (3-dimensional tomographic image) by referring to the opacity based on the luminance value.
- S(i) is the weighting component for shading to be computed by the slope which is acquired by luminance C(i) and the surrounding pixel values thereof.
- 1.0 is given for the maximum reflection
- 0.0 is given which indicates accentuation effect.
- Both Cout(i) and Aout(i) have 0 as the initial value.
- Aout (i) is integrated each time it passes through a voxel and converged to 1.0.
- Aout (i-1) of up to the (i-1)-th opacity is about 1.0, the i-th and sequence luminance values C(i) will not be reflected on the output image.
- the tomographic opacity table creating section 200 is capable of imaging the tomographic volume data with high luminance without imaging the tomographic volume data with low luminance by, for example, setting the opacity of the low luminance value in the tomographic opacity table as zero.
- the tomographic rendering calculation section 202 perform volume rendering on the basis of the created tomographic opacity table, and outputs the constructed 3-dimensional tomographic image to the synthesis processing unit 110.
- the tomographic opacity table creating section 200 can make changes in the tomographic opacity table, thereby the tomographic volume data in which the changes are made in accordance with the changed tomographic opacity table can be imaged.
- the 2-dimensional elastic image constructing unit 114 measures the displacement from the plural sets of RF signal frame data stored in the data storage unit 109. Then the 2-dimensional elastic image constructing unit 114 calculates the elasticity value on the basis of the measured displacement, and constructs a 2-dimensional elastic image.
- the elasticity value includes elasticity information such as the strain, elasticity modulus, displacement, viscosity or strain ratio.
- the elastic volume data generating unit 116 executes 3-dimensional conversion on plural 2-dimensional elastic images on the basis of the transmission/reception directions ( ⁇ , ⁇ ) equivalent to the positions where the 2-dimensional elastic images are obtained, and generates the elastic volume data.
- color values blue, light blue, green, yellow, red, etc.
- a hard region is colored in blue and a soft region is colored in red.
- the 3-dimensional elastic image constructing unit 118 constructs a 3-dimensional elastic image by setting the opacity in volume rendering of the elastic volume data on the basis of the elasticity values.
- the opacity is set by the elastic opacity table in which the relationship between the opacity and the elasticity value is set.
- the 3-dimensional elastic image constructing unit 118 is configured by an elastic opacity table creating section 204 and an elastic rendering calculation section 206 as shown in Fig. 2(b) .
- the elastic opacity table creating section 204 creates the elastic opacity table in which the relationship between the opacity and the elasticity value is set.
- the elastic opacity table is created for setting the opacity in the volume rendering on the basis of the elasticity value.
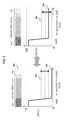
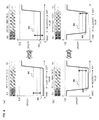
- Fig. 3 and Fig. 4 show the elastic opacity table to be created by the elastic opacity table creating section 204.
- the relationship between the elasticity value and the opacity is determined by the elastic opacity table, and the contribution ratio of the elastic volume data is set on the 2-dimensional projected plane in the display unit 111.
- the elastic opacity table is formed by an opacity line 300 for setting the opacity on the basis of the elasticity value and a guideline 302 for guiding the setting of the opacity line 300. Also, a color bar 304 which corresponds to the elasticity value of the opacity table is displayed on Fig. 3 and Fig. 4 .
- the elastic opacity table is set by the opacity line 300 to emphasize and display the region of interest (hard region) to which blue color is given based on the elasticity value.
- the opacity is set by the opacity line 300 so that the opacity of the region of interest (hard region) determined by the elasticity value becomes higher compared to the opacity of the region other than the region of interest (standard region, soft region) to which green color or red color is given.
- the standard region to be the region other than the region of interest has the average hardness in the elastic volume data, to which mainly green color is given.
- the region other than the region of interest mainly includes the standard region.
- T1 is set at a value which is close to 1.0 (for example, 0.7 ⁇ T1 ⁇ 1.0).
- T2 is set at a value which is close to 0 (for example, 0 ⁇ T2 ⁇ 0.5).
- the opacity of the opacity line 300 is set so that opacity T2 of the region other than the region of interest will not be zero.
- the purpose of this setting is to display the region of interest (hard region) to which blue color is given relatively. Also, when the opacity in the opacity line 300 of the region between the region of interest to which light blue is given and the region other than the region of interest is set as T3, it is set at a value between T2 and T1 (for example, T2 ⁇ T3 ⁇ T1).
- opacity of the elastic opacity table can be changed by the elastic opacity table creating section 204 under the control of the control unit 104 based on the operation in the operation unit 104.
- the elastic opacity table creating section 204 makes changes in the opacity of the opacity line 300 which is equivalent to the region (the region including the standard region) other than the region of interest to which green color, etc. is given.
- the elastic opacity table creating section 204 sets the opacity of the elastic opacity table so that the opacity of the region other than the region of interest is at the higher level as shown in the right view of Fig. 3 .
- the elastic opacity table creating section 204 sets the opacity of the elastic opacity table so that the opacity of the region other than the region of interest is at the lower level.
- the guideline 302 for guiding the setting of the opacity line 300 indicates the movable range of the opacity line 300 (for example, 0 ⁇ T2 ⁇ 0.5). In this manner, the operator can set the opacity in the opacity line 300 to be set at the region other than the region of interest (hard region).
- the opacity line 300 is represented by a straight line in the present embodiment, it may also be represented by a curved line. In the case that the opacity line 300 is represented by a curved line, the elastic opacity table creating section 204 sets the opacity corresponding to the curved line in the region (the region which includes the standard region) other than the region of interest.
- the elastic rendering calculation section 206 performs volume rendering using the elastic opacity table based on the opacity line 300 created in the elastic opacity table creating section 204 and the following equation.
- Eout i Eout ⁇ i - 1 + 1 - Aout ⁇ i - 1 • A i • E i • S i 4
- Aout i Aout ⁇ i - 1 + 1 - Aout ⁇ i - 1 • A i 5
- a i Opacity E i 6
- E(i) is the i-th elasticity value that exists on the line of sight in the case that a 3-dimensional elastic image is viewed from a certain point on the created 2-dimensional projected plane.
- Eout(i) is the output pixel value.
- Eout(i-1) represents the integrated value up to the (i-1)-th voxel.
- A(i) is the opacity of the i-th elasticity value which exists in the line of sight, and is the elastic opacity table which is created in the elastic opacity table creating section 204 as shown in the equation (6).
- S(i) is the weighting component for shading to be computed by the slope which is acquired based on elasticity value E (i) and the surrounding elasticity values thereof.
- E (i) elasticity value
- S(i) is the weighting component for shading to be computed by the slope which is acquired based on elasticity value E (i) and the surrounding elasticity values thereof.
- Both Eout(i) and Aout(i) have 0 as the initial value.
- Aout(i) is integrated each time it passes through a voxel and converged to 1.0.
- Aout(i-1) of the opacity of up to the (i-1)-th voxel is about 1.0, the i-th and subsequent voxel values E (i) will not be reflected on the output image.
- the synthesis processing unit 110 respectively reads out the 3-dimensional tomographic image which is constructed as above and a 3-dimensional elastic image, performs cumulative addition by multiplying the transmission factor which is set in the operation unit 104 on a 2-dimensional projected plane, and creates a 3-dimensional synthetic image.
- the display unit 111 displays the 3-dimensional synthetic image created in the synthesis processing unit 110.
- the elastic opacity table creating section 204 is capable of setting the opacity by the opacity line 300 of the elastic opacity table so that the region of interest (soft region) to which red color is given based on the elasticity value is emphasized and displayed as shown in Fig. 4(a) .
- the elastic opacity table is set such that the opacity of the region of interest determined by the elasticity value becomes higher compared to the opacity of the region other than the region of interest.
- the opacity is set by the opacity line 300 so that the region of interest (soft region) determined on the basis of the elasticity value becomes higher compared to the opacity of the region other than the region of interest (standard region, hard region) to which green color or blue color, etc. is given.
- the elastic opacity table creating section 204 is capable of setting the opacity of an opacity line 400 which is equivalent to the region other than the region of interest (standard region, hard region) to which green color or red color, etc. is given under the control of the control unit 103 based on the operation of the operation unit 104.
- the opacity line 400 set at the region other than the region of interest is moved in the upward direction as shown in the left view of Fig. 4(a)
- the opacity of the region other than the region of interest is set at the higher level as shown in the right view of Fig. 4(a) .
- a guideline 402 for guiding the setting of the opacity line 400 indicates the movable range of the opacity line 400 (for example, 0 ⁇ T2 ⁇ 0.5).
- the elastic opacity table creating section 204 is capable of setting the opacity by an opacity line 404 of the elastic opacity table such that the region of interest (hard region, soft region) to which blue color or red color is given on the basis of the elasticity value is emphasized and displayed as shown in Fig. 4(b) .
- the opacity is set by the opacity line 404 so that the opacity of the region of interest (hard region, soft region) determined by the elasticity value becomes higher compared to the opacity of the region other than the region of interest (standard region) to which green color, etc. is given.
- the elastic opacity table creating section 204 is capable of setting the opacity of the opacity line 404 which is equivalent to the region other than the region of interest (standard region) to which green color, etc. is given, under control of the control unit 103 based on the operation of the operation unit 104.
- the opacity line 404 set at the region other than the region of interest shown in the left view of Fig. 4 (b) is moved in the upward direction, the opacity of the region other than the region of interest is set at the higher level as shown in the right view of Fig. 4(b) .
- a guideline 406 for guiding the setting of the opacity line 404 indicates the movable range of the opacity line 404 (for example, 0 ⁇ T2 ⁇ 0.5).
- Fig. 5 shows a display pattern of the display unit 111.
- An image 500, an opacity table selecting area 502, an opacity setting area 504 and an elastic opacity table 506 are displayed on the same screen.
- the image 500 is, for example a 3-dimensional synthetic image in which a 3-dimensional tomographic image and a 3-dimensional elastic image are synthesized, or a 3-dimensional elastic image.
- the opacity table selecting area 502 is for selecting the elastic opacity table from among a plurality of opacity tables which are stored in advance. It comprises a storage area (not shown in the diagram) that stores a plurality of elastic opacity tables in Fig. 3 , Figs. 4(a) and (b) that are described above. A plurality of opacity tables are displayed on the display unit 111, and an elastic opacity table can be selected under control of the control unit 103 based on the operation of the operation unit 104.
- the elastic opacity table 506 which is selected by the operation unit 104 is displayed. Here, the concaved elastic opacity table in Fig. 4(b) is selected, and is displayed as shown in 506.
- the opacity setting area 504 is capable of setting the opacity of the opacity line 404 which is equivalent to the region other than the region of interest (standard region) by a numeric setting unit or a slide bar which is equivalent to the operation unit 104.
- the opacity of the opacity line 404 is set at "0.5".
- the numeric or the slide bar can also indicate the settable range of the opacity of the opacity line 400.
- the operator can select the pattern of the opacity table or set the opacity of the elastic opacity table while observing the image 500, for constructing an optimum image.
- the region of interest can be displayed without being hidden by the region (the region including the standard region) other than the region of interest by setting the opacity of an elastic opacity table in accordance with the elasticity value.
- the region of interest can be observed by lowering the opacity of the region (the region including the standard region) other than the region of interest to make the region (the region including the standard region) other than the region of interest which is on the near side of the region of interest transparent.
- the second embodiment will be described referring to Fig. 1 ⁇ Fig. 6 .
- the difference from the first embodiment is that the opacity of the region excluding the standard region is set by the elastic opacity table creating section 204.
- the configuration other than the elastic opacity table creating section 204 will be omitted since it is the same as the first embodiment.
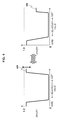
- the elastic opacity table creating section 204 sets the opacity by an opacity line 600 of an elastic opacity table so that the region of interest (hard region, soft region) to which blue color or red color is given on the basis of the elasticity value is emphasized and displayed, as shown in the left view of Fig. 6 .
- the elastic opacity table creating section 204 sets the opacity of the opacity line 600 which is equivalent to the region excluding the standard region to which red color is given.
- the opacity line 600 which is set at the opacity of the region excluding the standard region shown in the left view of Fig. 6 is moved in downward direction, the opacity of the region excluding the standard region is set lower as shown in the right view of Fig. 6 .
- the elastic opacity table creating section 204 can also set the opacity of the opacity line 600 which is equivalent to the region excluding the standard region to which blue color is given.
- the third embodiment will be described referring to Fig. 1 ⁇ Fig. 8 .
- the difference from the first embodiment and the second embodiment is that the opacity of the elastic opacity table is set for every line of sight (direction) on the basis of the number of voxels in the elastic volume data on which volume rendering is performed.
- the opacity in the elastic opacity table is set on the basis of the number of voxels in the elastic volume data on which volume rendering is performed.
- the 3-dimensional elastic image constructing unit 118 is formed by a visual-line setting section 700 configured to set the line of sight (direction) with respect to the elastic volume data, a voxel counting section 702 configured to count the number of voxels in the line of sight (direction) set in the elastic volume data, an elastic opacity table creating section 704 configured to create the elastic opacity table based on the counted number of voxels, and an elastic rendering calculation section 706 configured to perform volume rendering on the elastic volume data using the created elastic opacity table.
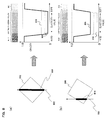
- the 3-dimensional elastic image constructing unit 118 in the present embodiment will be described in concrete terms referring to Fig. 8 .
- the visual-line setting section 700 sets a line of sight 802 on the diagonal line of elastic volume data 800 under control of the control unit 103 based on the operation of the operation unit 104.
- the display unit 111 can display the elasticity volume data 800 and the line of sight 802.
- the voxel counting section 702 counts the number of voxels in the line of sight 802 which is set in the elastic volume data 800. The counted number of voxels is indicated by the length of a line 806.
- the voxel counting section 702 may also execute the processing for searching a structural object that positions at the shallowest or deepest portion in the line of sight and calculate the number of voxels up to the target structural object.
- the elastic opacity table creating section 704 first sets the opacity of the elastic opacity table by an opacity line 808 so that the opacity of the region of interest (hard region, soft region) to which blue color or red color that are determined by the elasticity value is given becomes higher compared to the opacity of the region other than the region of interest (standard region) to which green color, etc. is given.
- the elastic opacity creating section 704 sets the opacity of the elastic opacity table in accordance with the number of voxels, so that the region of interest (hard region, soft region) will not be hidden by the region other than the region of interest (standard region) due to having higher number of voxels for performing volume rendering.
- the elastic opacity table creating section 704 when the opacity in the opacity line 808 of the region other than the region of interest (standard region) to which green color is given is set as T2, sets the opacity line 808 so that an opacity T2 of the region other than the region of interest becomes low (for example, 0 ⁇ T2 ⁇ 0.1).
- a guideline 810 is for indicating the movable range of the opacity line 808 (for example, 0 ⁇ T2 ⁇ 0.5).
- the elastic rendering calculation section 706 performs volume rendering using the elastic opacity table based on the opacity line 808 created in the elastic opacity table creating section 704 and the above equation (equation 2).
- the visual-line setting section 700 sets the line of sight 802 so that the line of sight 802 will not cross orthogonally with respect to a side of the elastic volume data 800, under control of the control unit 103 based on the operation of the operation unit 104.
- the voxel counting section 702 counts the number of voxels in the line of sight 802 which is set in the elastic volume data 800. The counted number of voxels is indicated by the length of a line 814.
- the elastic opacity table creating section 704 first sets the opacity of the elastic opacity table by the opacity line 808 so that the opacity of the region of interest (hard region, soft region) to which blue color or red color determined by the elasticity is given becomes higher compared to the opacity of the region other than the region of interest (standard region) to which green color, etc. is given.
- the number of voxels for performing volume rendering is smaller than the pattern in Fig. 8(a) .
- the elastic opacity creating section 704 sets the opacity of the elastic opacity table in accordance with the number of voxels, so that the region of interest (hard region, soft region) will not be hidden by the region other than the region of interest (standard region).
- the elastic opacity table creating section 704 when the opacity in the opacity line 808 of the region other than the region of interest (standard region) to which green color is given is set as T2, sets the opacity line 808 so that an opacity T2 of the region other than the region of interest becomes high (for example, 0.1 ⁇ T2 ⁇ 0.3).
- the elastic rendering calculation section 706 performs volume rendering using the elastic opacity table based on the opacity line 808 created in the elastic opacity table creating section 704 and the above equation (equation 2).
- the elastic opacity table creating section 704 sets the opacity line 808 so that the opacity of the region other than the region of interest becomes low.
- the elastic opacity table creating section 704 sets the opacity line 808 so that the opacity of the region other than the region of interest becomes low.
- the fourth embodiment will be described referring to Fig. 1 ⁇ Fig. 10 .
- the difference between the present embodiment and the first ⁇ third embodiments is that the cumulative opacity of the elastic volume data in the line of sight (direction) is analyzed and the opacity of the elastic opacity table is set on the basis of the analyzed cumulative opacity.
- the 3-dimensional elastic image constructing unit 118 is formed by a visual-line setting section 900 configured to set the line of sight (direction) with respect to the elastic volume data, a cumulative opacity analyzing section 902 configured to analyze the cumulative opacity with respect to the distance of the line of sight (number of voxels) in the set line of sight (direction), an elastic opacity table creating section 904 configured to create an elastic opacity table on the basis of the analyzed cumulative opacity, and an elastic rendering calculation section 906 configured to perform volume rendering of the elastic volume data using the created elastic opacity table.
- a visual-line setting section 900 configured to set the line of sight (direction) with respect to the elastic volume data
- a cumulative opacity analyzing section 902 configured to analyze the cumulative opacity with respect to the distance of the line of sight (number of voxels) in the set line of sight (direction)
- an elastic opacity table creating section 904 configured to create an elastic o
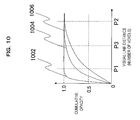
- Fig. 10 shows the cumulative opacity with respect to the distance of the line of sight (number of voxels) in the line of sight (direction) set in the visual-line setting section 900.
- a cumulative opacity graph 1004 is set as optimal cumulative opacity graph, since the setting of the opacity thereof is generally well-balanced.
- the cumulative opacity analyzing section 902 analyzes the cumulative opacity with respect to the visual-line distance (number of voxels) in the set line of sight (direction).
- a cumulative opacity graph 1002 is acquired as a result of analyzing the cumulative opacity in the line of sight (direction) in the cumulative opacity analyzing section 902.
- the cumulative opacity graph 1002 has a high cumulative opacity with respect to the visual-line distance (number of voxels), and the cumulative opacity reaches 1.0 at the point where the visual-line distance (number of voxels) reaches P1.
- the elastic opacity table creating section 904 sets the opacity in the elastic opacity table so that the cumulative opacity graph 1002 in the line of sight (direction) becomes the optimal cumulative opacity graph 1004.
- elastic opacity table creating section 904 for example moves the opacity line 404 which is set in the region other than the region of interest to which green color, etc. is given in the downward direction, and lowers the opacity of the region other than the region of interest as shown in Fig. 4(b) .
- a cumulative opacity graph 1006 is acquired as a result of analyzing the cumulative opacity in the line of sight (direction) by the cumulative opacity analyzing section 902.
- the cumulative opacity of the cumulative opacity graph 1006 with respect to the visual-line distance (number of voxels) is low, and the cumulative opacity reaches 1.0 at the point where the visual-line distance (number of voxels) reaches P2.
- the cumulative opacity of the cumulative opacity graph 1006 reaches 0.5 at the position of a visual-line distance (number of voxels) P1.
- the output elasticity value becomes half the elasticity value of the elastic volume data, and the value can be diagnosed as harder than the actual hardness.
- the elasticity opacity table creating section 904 sets the opacity in the elasticity opacity table so that the cumulative opacity graph 1006 in the line of sight (direction) becomes the optimal cumulative opacity graph 1004.
- the elastic opacity table creating section 904 moves the opacity line 404 which is set at the region other than the region of interest to which green color, etc. is given toward upward direction, and sets the opacity at a higher value than the opacity in the region other than the region of interest, as shown in Fig. 4(b) .
- the elastic rendering calculation unit 906 performs volume rendering using the elasticity opacity table created in the elastic opacity table creating section 904 the above equation (equation 2).
- a 3-dimensional elastic image can be displayed evenly from any line of sight (direction), by analyzing the cumulative opacity in the line of sight (direction) and setting the opacity of the elastic opacity table on the basis of the analyzed cumulative opacity.
Landscapes
- Health & Medical Sciences (AREA)
- Life Sciences & Earth Sciences (AREA)
- Engineering & Computer Science (AREA)
- Physics & Mathematics (AREA)
- Medical Informatics (AREA)
- Public Health (AREA)
- Pathology (AREA)
- General Health & Medical Sciences (AREA)
- Biomedical Technology (AREA)
- Veterinary Medicine (AREA)
- Molecular Biology (AREA)
- Surgery (AREA)
- Animal Behavior & Ethology (AREA)
- Radiology & Medical Imaging (AREA)
- Nuclear Medicine, Radiotherapy & Molecular Imaging (AREA)
- Biophysics (AREA)
- Heart & Thoracic Surgery (AREA)
- Computer Graphics (AREA)
- General Physics & Mathematics (AREA)
- Computer Vision & Pattern Recognition (AREA)
- Theoretical Computer Science (AREA)
- Physiology (AREA)
- General Engineering & Computer Science (AREA)
- Computer Networks & Wireless Communication (AREA)
- Radar, Positioning & Navigation (AREA)
- Remote Sensing (AREA)
- Primary Health Care (AREA)
- Epidemiology (AREA)
- Databases & Information Systems (AREA)
- Data Mining & Analysis (AREA)
- Ultra Sonic Daignosis Equipment (AREA)
- Image Generation (AREA)
Applications Claiming Priority (2)
| Application Number | Priority Date | Filing Date | Title |
|---|---|---|---|
| JP2010007699 | 2010-01-18 | ||
| PCT/JP2010/070965 WO2011086774A1 (ja) | 2010-01-18 | 2010-11-25 | 超音波診断装置及び超音波画像表示方法 |
Publications (2)
| Publication Number | Publication Date |
|---|---|
| EP2526871A1 true EP2526871A1 (de) | 2012-11-28 |
| EP2526871A4 EP2526871A4 (de) | 2017-04-05 |
Family
ID=44304067
Family Applications (1)
| Application Number | Title | Priority Date | Filing Date |
|---|---|---|---|
| EP10843129.7A Withdrawn EP2526871A4 (de) | 2010-01-18 | 2010-11-25 | Ultraschalldiagnosevorrichtung und verfahren zur anzeige von ultraschallbildern |
Country Status (5)
| Country | Link |
|---|---|
| US (1) | US9247922B2 (de) |
| EP (1) | EP2526871A4 (de) |
| JP (1) | JP5723790B2 (de) |
| CN (1) | CN102711625B (de) |
| WO (1) | WO2011086774A1 (de) |
Families Citing this family (10)
| Publication number | Priority date | Publication date | Assignee | Title |
|---|---|---|---|---|
| WO2010143587A1 (ja) * | 2009-06-10 | 2010-12-16 | 株式会社 日立メディコ | 超音波診断装置、超音波画像処理装置、超音波画像処理プログラム、及び超音波画像生成方法 |
| JP5606998B2 (ja) * | 2011-07-28 | 2014-10-15 | ジーイー・メディカル・システムズ・グローバル・テクノロジー・カンパニー・エルエルシー | 超音波診断装置及びその制御プログラム |
| EP2929840A4 (de) * | 2012-12-06 | 2016-08-24 | Hitachi Aloka Medical Ltd | Ultraschalldiagnosevorrichtung und verfahren zur anzeige von ultraschallbildern |
| KR101590876B1 (ko) | 2014-02-21 | 2016-02-02 | 삼성전자주식회사 | 움직임 벡터 평활화 방법 및 장치 |
| KR102297346B1 (ko) * | 2014-10-31 | 2021-09-03 | 삼성메디슨 주식회사 | 의료 영상 장치 및 그에 따른 의료 영상을 디스플레이 하는 방법 |
| US10062200B2 (en) * | 2015-04-03 | 2018-08-28 | Dental Imaging Technologies Corporation | System and method for displaying volumetric images |
| US10542953B2 (en) | 2016-09-27 | 2020-01-28 | Covidien Lp | Fissural assessment and surgical and interventional planning |
| US10543044B2 (en) | 2016-09-27 | 2020-01-28 | Covidien Lp | Systems and methods for detecting pleural invasion for surgical and interventional planning |
| JP7078487B2 (ja) * | 2018-08-02 | 2022-05-31 | 富士フイルムヘルスケア株式会社 | 超音波診断装置及び超音波画像処理方法 |
| JP7308600B2 (ja) * | 2018-09-12 | 2023-07-14 | キヤノンメディカルシステムズ株式会社 | 超音波診断装置、医用画像処理装置、及び超音波画像表示プログラム |
Family Cites Families (15)
| Publication number | Priority date | Publication date | Assignee | Title |
|---|---|---|---|---|
| US5782762A (en) * | 1994-10-27 | 1998-07-21 | Wake Forest University | Method and system for producing interactive, three-dimensional renderings of selected body organs having hollow lumens to enable simulated movement through the lumen |
| US5720291A (en) * | 1996-03-22 | 1998-02-24 | Advanced Technology Laboratories, Inc. | Three dimensional medical ultrasonic diagnostic image of tissue texture and vasculature |
| JP4421016B2 (ja) * | 1999-07-01 | 2010-02-24 | 東芝医用システムエンジニアリング株式会社 | 医用画像処理装置 |
| JP4025110B2 (ja) * | 2002-04-18 | 2007-12-19 | アロカ株式会社 | 超音波診断装置 |
| US7972269B2 (en) | 2003-07-22 | 2011-07-05 | Hitachi Medical Corporation | Ultrasonographic device and ultrasonographic method |
| WO2005048847A1 (ja) * | 2003-11-21 | 2005-06-02 | Hitachi Medical Corporation | 超音波診断装置 |
| JP4653542B2 (ja) * | 2005-04-06 | 2011-03-16 | 株式会社東芝 | 画像処理装置 |
| CN101175444B (zh) * | 2005-06-07 | 2010-04-21 | 株式会社日立医药 | 超声波诊断装置及超声波弹性图像取得方法 |
| KR100825054B1 (ko) * | 2005-06-28 | 2008-04-28 | 주식회사 메디슨 | 컬러 플로우 영상을 촬상하는 방법 및 초음파 진단 시스템 |
| JP4711775B2 (ja) * | 2005-08-10 | 2011-06-29 | 株式会社日立メディコ | 超音波診断装置 |
| JP2007117384A (ja) * | 2005-10-27 | 2007-05-17 | Toshiba Corp | 画像診断・治療支援装置及び治療効果判定用画像データ生成方法 |
| JP4801968B2 (ja) | 2005-11-02 | 2011-10-26 | 株式会社東芝 | 画像診断・治療支援装置及び画像データ表示方法 |
| JP5264097B2 (ja) | 2007-04-11 | 2013-08-14 | 株式会社日立メディコ | 超音波診断装置 |
| GB0712432D0 (en) * | 2007-06-26 | 2007-08-08 | Isis Innovation | Improvements in or relating to determination and display of material properties |
| US20090096807A1 (en) * | 2007-08-27 | 2009-04-16 | Silverstein Jonathan C | Systems and methods for image colorization |
-
2010
- 2010-11-25 CN CN201080061672.3A patent/CN102711625B/zh active Active
- 2010-11-25 EP EP10843129.7A patent/EP2526871A4/de not_active Withdrawn
- 2010-11-25 JP JP2011549868A patent/JP5723790B2/ja active Active
- 2010-11-25 WO PCT/JP2010/070965 patent/WO2011086774A1/ja not_active Ceased
- 2010-11-25 US US13/513,371 patent/US9247922B2/en active Active
Also Published As
| Publication number | Publication date |
|---|---|
| US20120259223A1 (en) | 2012-10-11 |
| JPWO2011086774A1 (ja) | 2013-05-16 |
| CN102711625B (zh) | 2015-03-25 |
| EP2526871A4 (de) | 2017-04-05 |
| US9247922B2 (en) | 2016-02-02 |
| JP5723790B2 (ja) | 2015-05-27 |
| WO2011086774A1 (ja) | 2011-07-21 |
| CN102711625A (zh) | 2012-10-03 |
Similar Documents
| Publication | Publication Date | Title |
|---|---|---|
| EP2526871A1 (de) | Ultraschalldiagnosevorrichtung und verfahren zur anzeige von ultraschallbildern | |
| US9101289B2 (en) | Ultrasonic diagnostic apparatus | |
| CN102458255B (zh) | 超声波诊断装置、超声波图像处理装置、超声波图像处理程序、以及超声波图像生成方法 | |
| US10548572B2 (en) | Ultrasound processing device | |
| EP2524652B1 (de) | Ultraschalldiagnosevorrichtung und ultraschallbildanzeigeverfahren | |
| US9514564B2 (en) | Ultrasonic diagnostic apparatus and ultrasonic image display method | |
| US9332958B2 (en) | Ultrasonic diagnostic apparatus and method of displaying ultrasonic image | |
| EP2502566A1 (de) | Ultraschalldiagnosevorrichtung und verfahren zur berechnung eines dreidimensionalen elastischen modulus | |
| JP5815541B2 (ja) | 超音波診断装置、超音波画像表示方法、および、プログラム | |
| EP2612600B1 (de) | Verfahren zur erzeugung dreidimensionaler elastischer bilder und ultraschalldiagnosevorrichtung | |
| EP2189118A1 (de) | Ultraschallgerät | |
| EP2548514A1 (de) | Ultraschalldiagnosevorrichtung und verfahren zur anzeige von ultraschallbildern | |
| JP6358954B2 (ja) | 超音波診断装置 | |
| EP2620103B1 (de) | Ultraschalldiagnosevorrichtung und verfahren zur anzeige von ultraschallbildern | |
| JP2013111102A (ja) | 超音波診断装置 |
Legal Events
| Date | Code | Title | Description |
|---|---|---|---|
| PUAI | Public reference made under article 153(3) epc to a published international application that has entered the european phase |
Free format text: ORIGINAL CODE: 0009012 |
|
| 17P | Request for examination filed |
Effective date: 20120820 |
|
| AK | Designated contracting states |
Kind code of ref document: A1 Designated state(s): AL AT BE BG CH CY CZ DE DK EE ES FI FR GB GR HR HU IE IS IT LI LT LU LV MC MK MT NL NO PL PT RO RS SE SI SK SM TR |
|
| DAX | Request for extension of the european patent (deleted) | ||
| RAP1 | Party data changed (applicant data changed or rights of an application transferred) |
Owner name: HITACHI, LTD. |
|
| RA4 | Supplementary search report drawn up and despatched (corrected) |
Effective date: 20170302 |
|
| RIC1 | Information provided on ipc code assigned before grant |
Ipc: A61B 8/08 20060101AFI20170224BHEP |
|
| STAA | Information on the status of an ep patent application or granted ep patent |
Free format text: STATUS: REQUEST FOR EXAMINATION WAS MADE |
|
| STAA | Information on the status of an ep patent application or granted ep patent |
Free format text: STATUS: THE APPLICATION IS DEEMED TO BE WITHDRAWN |
|
| 18D | Application deemed to be withdrawn |
Effective date: 20171003 |