EP2593771B1 - Verfahren, speichermedien und systeme zur analyse einer partikelmenge und -verteilung in einem abbildungsbereich eines assay-analysesystems und zur bewertung der leistung eines in einem assay-analysesystem durchgeführten fokussierungsroutings - Google Patents
Verfahren, speichermedien und systeme zur analyse einer partikelmenge und -verteilung in einem abbildungsbereich eines assay-analysesystems und zur bewertung der leistung eines in einem assay-analysesystem durchgeführten fokussierungsroutings Download PDFInfo
- Publication number
- EP2593771B1 EP2593771B1 EP11807558.9A EP11807558A EP2593771B1 EP 2593771 B1 EP2593771 B1 EP 2593771B1 EP 11807558 A EP11807558 A EP 11807558A EP 2593771 B1 EP2593771 B1 EP 2593771B1
- Authority
- EP
- European Patent Office
- Prior art keywords
- imaging region
- particles
- frequency spectrum
- analysis system
- image
- Prior art date
- Legal status (The legal status is an assumption and is not a legal conclusion. Google has not performed a legal analysis and makes no representation as to the accuracy of the status listed.)
- Active
Links
Images



Classifications
-
- G—PHYSICS
- G01—MEASURING; TESTING
- G01N—INVESTIGATING OR ANALYSING MATERIALS BY DETERMINING THEIR CHEMICAL OR PHYSICAL PROPERTIES
- G01N15/00—Investigating characteristics of particles; Investigating permeability, pore-volume or surface-area of porous materials
- G01N15/10—Investigating individual particles
- G01N15/14—Optical investigation techniques, e.g. flow cytometry
- G01N15/1429—Signal processing
- G01N15/1433—Signal processing using image recognition
-
- G—PHYSICS
- G01—MEASURING; TESTING
- G01J—MEASUREMENT OF INTENSITY, VELOCITY, SPECTRAL CONTENT, POLARISATION, PHASE OR PULSE CHARACTERISTICS OF INFRARED, VISIBLE OR ULTRAVIOLET LIGHT; COLORIMETRY; RADIATION PYROMETRY
- G01J3/00—Spectrometry; Spectrophotometry; Monochromators; Measuring colours
- G01J3/28—Investigating the spectrum
- G01J3/2823—Imaging spectrometer
-
- G—PHYSICS
- G01—MEASURING; TESTING
- G01J—MEASUREMENT OF INTENSITY, VELOCITY, SPECTRAL CONTENT, POLARISATION, PHASE OR PULSE CHARACTERISTICS OF INFRARED, VISIBLE OR ULTRAVIOLET LIGHT; COLORIMETRY; RADIATION PYROMETRY
- G01J3/00—Spectrometry; Spectrophotometry; Monochromators; Measuring colours
- G01J3/28—Investigating the spectrum
- G01J3/42—Absorption spectrometry; Double beam spectrometry; Flicker spectrometry; Reflection spectrometry
-
- G—PHYSICS
- G01—MEASURING; TESTING
- G01N—INVESTIGATING OR ANALYSING MATERIALS BY DETERMINING THEIR CHEMICAL OR PHYSICAL PROPERTIES
- G01N15/00—Investigating characteristics of particles; Investigating permeability, pore-volume or surface-area of porous materials
- G01N15/06—Investigating concentration of particle suspensions
-
- G—PHYSICS
- G01—MEASURING; TESTING
- G01N—INVESTIGATING OR ANALYSING MATERIALS BY DETERMINING THEIR CHEMICAL OR PHYSICAL PROPERTIES
- G01N21/00—Investigating or analysing materials by the use of optical means, i.e. using sub-millimetre waves, infrared, visible or ultraviolet light
- G01N21/62—Systems in which the material investigated is excited whereby it emits light or causes a change in wavelength of the incident light
- G01N21/63—Systems in which the material investigated is excited whereby it emits light or causes a change in wavelength of the incident light optically excited
- G01N21/64—Fluorescence; Phosphorescence
- G01N21/645—Specially adapted constructive features of fluorimeters
- G01N21/6456—Spatial resolved fluorescence measurements; Imaging
- G01N21/6458—Fluorescence microscopy
-
- G—PHYSICS
- G01—MEASURING; TESTING
- G01N—INVESTIGATING OR ANALYSING MATERIALS BY DETERMINING THEIR CHEMICAL OR PHYSICAL PROPERTIES
- G01N15/00—Investigating characteristics of particles; Investigating permeability, pore-volume or surface-area of porous materials
- G01N15/06—Investigating concentration of particle suspensions
- G01N15/075—Investigating concentration of particle suspensions by optical means
Definitions
- This invention generally relates to methods, storage mediums, and systems for analyzing particle quantity and distribution within an imaging region of an assay analysis system and, further, to methods, storage mediums, and systems for evaluating the performance of a focusing routine performed on an assay analysis system.
- Fluid assays are used for a variety of purposes, including but not limited to biological screenings and environmental assessments.
- particles are used in fluid assays to aid in the detection and quantification of one or more analytes of interest within a sample.
- particles provide substrates for carrying reagents configured to react with analytes of interest within a sample such that the analytes may be detected.
- a multiplexing scheme is employed in assay analysis systems such that multiple analytes may be evaluated in a single analysis process for a single sample.
- particles are configured into distinguishable groups and each group is used to indicate the presence, absence, and/or amount of a different analyte in an assay.
- the different particle subsets may be distinguishable, for example, by different fluorescent dyes and/or different concentrations of dyes absorbed into particles and/or bound to the surface of particles.
- the size of particles among the different subsets may vary.
- optical imaging instruments may be used to analyze fluid assays induced with particles. More specifically, optical imaging instruments may be configured to image particles within an illuminated region of a chamber in which an assay is introduced and may be further configured to analyze the imaged particles for the detection and quantification of one or more analytes of interest.
- the number of particles delivered into the imaging chamber is estimated based on expected particle densities present in the sample volume.
- Particle densities can vary substantially from sample to sample and, thus, such a technique requires the particle density of a sample to be known and inputted into a system prior to injecting the sample into the imaging chamber.
- Some assay analysis techniques involve counting particles within an imaging chamber. For example, spatial-domain image analysis is often performed using thresholding for edge or peak detection of particles. Thresholding, however, can become complicated if particle brightness varies significantly (such as in a multiplexing scheme). Furthermore, once an edge or peak has been detected, a neighborhood of pixels must be assembled that identifies an imaged particle, which can sometimes be time-consuming. Thus, spatial-domain image analysis is not generally considered advantageous for monitoring the quantity of particles introduced into a chamber.
- particle distribution within an imaging region is as important as quantity.
- particles that are clustered together may induce measurable reflections and falsely convey a brighter intensity.
- light collected from a cluster of particles is generally difficult to differentiate on a particle-by-particle basis.
- particle clusters will often be ignored during analysis. Therefore, two imaging volumes containing an equal population of particles but different distributions will yield different amounts of useful data.
- spatial-domain image analysis as described above for particle counting is often performed. Such a technique, however, is generally not used to determine particle distribution in an imaging volume nor would it be considered a viable option, particularly as particles are being introduced into an imaging chamber, due to its time constraints.
- the configuration of the system affects the accuracy of the data obtained from an image.
- many optical analysis systems employ an automated routine for periodically optimizing the focal position of its photosensitive detection subsystem.
- characteristics and/or operation of an optical analysis system may change over time and, in some embodiments, the changes may affect a routine's ability to optimize a focal position of a photosensitive detection subsystem.
- US 2003/206302 A1 discloses an apparatus and method for determining the concentration of an analyte comprising means for detecting whether a sufficient amount of sample is present based on detection of light reflected from certain areas of the sample.
- WO 03/023571 A2 discloses counting of cells in investigational data by locating bright centers. This method includes the steps of performing convolution on the investigational data, searching for a plurality of local maxima, removing redundant local maxima from the plurality of local maxima, declaring remaining maxima to be centers of cells and counting the centers of cells.
- WO 03/034041 A1 relates to the analysis of a fluid sample to characterize particles in it whereby a time-domain signal is generated from a detector and is processed by transforming the time-domain signal to a frequency-domain signal, which frequency-domain signal provides for characterization of the particles.
- Embodiments of the methods, storage mediums, and systems include configurations for successively imaging an imaging region of an assay analysis system as particles are loaded into the imaging region, generating a frequency spectrum of each image via a discrete Fourier transform upon formation of each image, and integrating a same coordinate portion of each frequency spectrum.
- some embodiments of the methods, storage mediums, and systems include configurations for successively imaging an imaging region of an assay analysis system as particles are loaded into the imaging region, generating a convolved spatial image of each image by convolving each image with a kernel (e.g., a band pass or a high pass filter).
- a kernel e.g., a band pass or a high pass filter
- the methods, storage mediums, and systems include configurations for terminating the loading of particles into the imaging region upon computing an integral that crosses a predetermined threshold.
- the methods, storage mediums, and systems include configurations for tracking integrals calculated for the successively generated frequency spectrums and terminating the loading of particles upon detecting a change in integral magnitude less than a preset limit between two frequency spectrums generated in succession.
- the methods, storage mediums, and systems include configurations for tracking integrals calculated for the successively generated convolved spatial images and terminating the loading of particles upon detecting a change in integral magnitude less than a preset limit between two convolved spatial images generated in succession.
- inventions of the methods, storage mediums, and systems include configurations for generating, via a discrete Fourier transform, a frequency spectrum of an image generated by an assay analysis system and integrating a portion of the frequency spectrum.
- the methods, storage mediums, and systems further include configurations for sending a first signal indicating enough particles are in the imaging region for further processes by the assay analysis system upon calculating an integral greater than a predetermined threshold.
- the methods, storage mediums, and systems include configurations for sending a second signal indicating not enough particles are in the imaging region for further processes by the assay analysis system upon calculating an integral less than the predetermined threshold.
- inventions of the methods, storage mediums, and systems include configurations for generating convolved spatial image generated by an assay analysis system and integrating a portion of the convolved spatial image.
- the methods, storage mediums, and systems further include configurations for sending a first signal indicating enough particles are in the imaging region for further processes by the assay analysis system upon calculating an integral greater than a predetermined threshold.
- the methods, storage mediums, and systems include configurations for sending a second signal indicating not enough particles are in the imaging region for further processes by the assay analysis system upon calculating an integral less than the predetermined threshold.
- Yet other embodiments of the methods, storage mediums, and systems include configurations for performing an automated routine to optimize a focal position of a photosensitive detection subsystem of an assay analysis system and imaging particles arranged within an imaging region of the assay analysis system subsequent to performing the automated routine.
- the methods, storage mediums, and systems further include configurations for generating a frequency spectrum of the image via a discrete Fourier transform and comparing a width of a primary lobe of the frequency spectrum at a designated brightness value to a benchmark to evaluate the performance of the automated routine.
- the methods, storage mediums, and systems additionally include configurations for generating a convolved spatial image of the image comparing portion of the generated convolved spatial image to a threshold to evaluate the performance of the automated routine.
- exemplary methods, storage mediums, and systems for analyzing particle quantity and distribution within an imaging region of an assay analysis system are provided.
- exemplary methods, storage mediums, and systems for evaluating the performance of a focusing routine performed on an assay analysis system are provided.
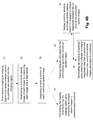
- Figs. 4 and 5 depict flowcharts for analyzing particle quantity and distribution within an imaging region of an assay analysis system.
- Fig. 6 depicts a flowchart for evaluating the performance of a focusing routine performed on an assay analysis system.
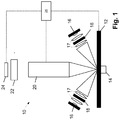
- An exemplary optical assay analysis system is depicted in Fig. 1 having a storage medium which includes program instructions configured to perform the processes outlined in the flowcharts depicted in Figs. 4-6 .
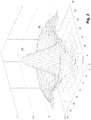
- Figs. 2 and 3 illustrate graphical representations of an exemplary frequency spectrum generated via a discrete Fourier transform for an image of particles.
- some embodiments of the methods described herein involve generating a frequency spectrum of an image via a discrete Fourier transform and analyzing the frequency spectrum to obtain information about the state of the assay analysis system used to create the image.
- Other embodiments of the methods described herein involve generating a convolved spatial image of an image by convolving the image with a filter kernel. It is noted that the methods, storage mediums, and systems described herein are not necessarily limited to the illustrations of Figs. 1-6 . In particular, the systems described herein may include additional or alternative features not shown in Fig.
- the frequency spectrums and convolved spatial images generated using the systems described herein may be of many alternative forms, including but not limited to that depicted in Figs. 2 and 3 .
- the methods described herein may, in some cases, be configured to perform processes other than those depicted in Figs. 4-6 .
- Fig. 1 illustrates a schematic of an exemplary optical assay analysis system, particularly the optic and control components of the system.
- assay analysis system 10 including an illumination subsystem comprising light sources 16, lenses 17 and filters 18 configured to illuminate an imaging region of analysis chamber 12.
- assay analysis system 10 includes a photosensitive detection subsystem comprising imaging lens 20, filter/s 22 and photosensitive detector 24 configured to image particles arranged within the imaging region of analysis chamber 12 when illuminated.
- assay analysis system 10 may include processing unit 26 operatively coupled (as denoted by the dotted lines in Fig. 1 ) to different components of the system, such as but not limited to components of analysis chamber 12, the illumination subsystem and the photosensitive subsystem.
- processing unit 26 includes a processor and a storage medium having program instructions which are executable via the processor for performing a number of operations on assay analysis system 10. It is noted that the operative coupling of processing unit 26 is not limited to the depiction of dotted lines in Fig. 1 . In particular, processing unit 26 may be operatively coupled to any component of assay analysis system 10, including those not shown in Fig. 1 such as components of a fluidic handling system.
- analysis chamber 12 is configured to provide an optically clear path to its imaging region such that the region may be illuminated and imaged by the respective illumination and photosensitive detection subsystems of assay analysis system 10 as discussed above.
- analysis chamber 12 may include any configuration suitable for transporting a fluid assay having particles into and out of its imaging region.
- the photosensitive detection subsystem of assay analysis system 10 is configured to collect light reflected from particles in the imaging region and thus, the photosensitive detection subsystem is arranged on the same side of analysis chamber 12 as the illumination subsystem.
- assay analysis system 10 may include immobilization subsystem 14 disposed on the other side of analysis chamber 12 for immobilizing particles within the imaging region of the chamber.
- particle immobilization may ensure particles are in a stationary position and within the same plane for imaging.
- immobilization subsystem 14 may be omitted from assay analysis system 10.
- analysis chamber 12 may be configured to distribute particles of a fluid assay in a single plane within its imaging region.
- the illumination subsystem of assay analysis system 10 may be configured to illuminate the imaging region of analysis chamber 12 at an acute angle relative to plane of the imaging region.
- the photosensitive detection subsystem i.e., imaging lens 20, filter/s 22 and photosensitive detector 24
- light sources 16 may include any suitable light sources known in the art, including but not limited to light emitting diodes (LEDs) and filters 18 may be bandpass filters or any other suitable spectral filters known in the art.
- the light emitted by light sources 16 may include light in any part of the visible and invisible wavelength spectrums.
- light sources 16 may be configured to emit light having different wavelengths or different wavelength bands (e.g., one of the light sources may be configured to emit red light and the other light source may be configured to emit green light).
- the system may use light sources 16, lenses 17 and filters 18 to sequentially illuminate the particles with different wavelengths or different wavelength bands of light.
- red light may be used to excite classification dyes that may be internal to the particles
- green light may be used to excite reporter molecules coupled to the surface of the particles. Since the classification illumination is dark during reporter measurements (i.e., in the above example, red light is not directed to the particles while green light is directed to the particles), the analyte measurement sensitivity of the system will not be reduced due to crosstalk from out of band light.
- assay analysis system 10 is shown in Fig. 1 having two light sources, it is to be understood that the system may include any suitable number of light sources. In some embodiments, six light sources may be positioned in a circumferential or hexagonal arrangement to direct light onto the imaging plane of analysis chamber 12. In particular, light sources 16 may be arranged such that each light source directs light to particles in analysis chamber 12 from a different direction. In this manner, the light sources may be configured to provide an illumination "ring". Furthermore, although assay analysis system 10 is shown in Fig. 1 having two lenses associated with each light source, it is to be understood that the system may include any suitable number of lenses for each light source.
- the system may include three refractive lenses for each light source to collect as much light from the light sources as possible and near-collimate it before presentation to a filter.
- three refractive lenses for each light source to collect as much light from the light sources as possible and near-collimate it before presentation to a filter.
- two or more lenses may be advantageous to increase the collection angle and provide a more efficient illumination system.
- the photosensitive detection subsystem of assay analysis system 10 includes imaging lens 20, filter/s 22 and photosensitive detector 24.
- imaging lens 140 is configured to image light scattered and/or fluoresced from particles disposed within the imaging region of analysis chamber 12 onto photosensitive detector 24 via filter/s 22.
- Imaging lens 140 may include any suitable refractive optical element known in the art and filter/s 22 may include optical bandpass filters or any other suitable spectral filter/s known in the art.
- Photosensitive detector 24 may be a CCD, CMOS, or Quantum Dot camera or any other suitable imaging device known in the art which is configured to generate images.
- assay analysis system 10 is shown in Fig. 1 having a single photosensitive detector, the system may include any suitable number of photosensitive detectors as well as any number of filters and lens to aid in the generation of images.
- assay analysis system 10 may include a device configured to alternate different filters into the optical path of light exiting imaging lens 20, such as a filter wheel assembly, for example.
- each of the detection filters may be configured to transmit light of a different wavelength or a different wavelength band.
- the wavelength or wavelength band at which an image of particles is acquired by photosensitive detector 24 may vary depending on the position of the filter wheel assembly, which corresponds to the filter in the optical path of light exiting imaging lens 20.
- a plurality of images of the particles may be formed sequentially by imaging the particles, altering the position of the filter wheel, and repeating the imaging and altering steps until images at each wavelength or waveband of interest have been acquired by photosensitive detector 144.
- the system shown in Fig. 1 may, therefore, be configured to generate a plurality or series of images representing the fluorescent emission of particles at several wavelengths of interest.
- assay analysis system 10 may, in some embodiments, include processing unit 26 operatively coupled (as denoted by the dotted lines in Fig. 1 ) to different components of the system, such as but not limited to components of analysis chamber 12, the illumination subsystem and the photosensitive subsystem. In other cases, however, assay analysis system 10 may not include a processing unit, but rather processing unit 26 may be a separate entity from assay analysis system 10. In such embodiments, assay analysis system 10 may be configured for connection to a processing unit in any suitable manner known in the art (e.g., via transmission media or one or more electronic components such as analog-to-digital converters).
- processing unit 26 may take various forms, including a personal computer system, mainframe computer system, workstation, network appliance, Internet appliance, personal digital assistant (PDA), a digital signal processor (DSP), field programmable gate array (FPGA), or other similar device.
- PDA personal digital assistant
- DSP digital signal processor
- FPGA field programmable gate array
- processing unit 26 includes a processor and a storage medium having program instructions which are executable via the processor for performing a number of operations on assay analysis system 10.
- processing unit 26 may be configured to acquire (e.g., receive) image data from photosensitive detector 24 and further process and analyze these images to determine one or more characteristics of particles such as a classification of the particles and information about a reaction taken place on the surface of the particles.
- the one or more characteristics may be output by the processing unit in any suitable format such as a data array with an entry for fluorescent magnitude for each particle for each wavelength.
- the term "storage medium,” as used herein, may refer to any electronic medium configured to hold one or more set of program instructions, such as but not limited to a read-only memory, a random access memory, a magnetic or optical disk, or magnetic tape.
- program instructions may generally refer to commands within a program which are configured to perform a particular function, such as analyzing particle quantity and distribution within an imaging region of an assay analysis system or evaluating the performance of a focusing routine performed on an assay analysis system as described in more detail below.
- Program instructions may be implemented in any of various ways, including procedure-based techniques, component-based techniques, and/or object-oriented techniques, among others.
- program instructions may be implemented using ActiveX controls, C++ objects, JavaBeans, Microsoft Foundation Classes ("MFC"), or other technologies or methodologies, as desired.
- Program instructions implementing the processes described herein may be transmitted over on a carrier medium such as a wire, cable, or wireless transmission link.
- some embodiments of the methods described herein involve generating a frequency spectrum of an image via a discrete Fourier transform and analyzing the frequency spectrum to obtain information about the state of the assay analysis system used to create the image.
- some embodiments of the invention use frequency-domain techniques to characterize particle quantity and distribution within an imaging volume as well as image focus.
- a particle may be represented by any number of pixels, specifically any number between one pixel, if the camera resolution is below the particle's size, or an infinite number of pixels, if the camera resolution is infinite.
- particle image topography looks like a cube at the low end (i.e., a single pixel) and, at the high end (i.e., an infinite number pixels) due to the point spread function effect inherent of an imaging lens, the particle image topography will resemble the shape of the particle with its edges smoothed out into the background (e.g., the image topography of a spherical particle will look like a Gaussian function at the high end).
- the concept of using frequency-domain techniques to characterize particle quantity and distribution within an imaging volume as well as image focus is described below in reference to a single pixel representing a particle and an infinite number of pixels representing a particle, but it is to be understood that the concept may be applied to any number of pixels representing a particle.
- the actual transform used e.g., a fast Fourier transform (FFT) or a discrete cosine transform (DCT)
- FFT fast Fourier transform
- DCT discrete cosine transform
- the embodiments of the invention are not limited these "frequency domain” techniques. Rather, in some embodiments, the frequency content of an image may be analyzed in the spatial domain (e.g., convolving the image with a high-pass filter kernel to isolate the higher frequency components in the spatial domain).
- a frequency domain representation of an image contains a superposition of the contributions of all particles in the image.
- an image frequency spectrum may be conceptualized with respect to a single particle such as set forth below.
- t and z are a coordinate system
- T and Z are respectively the horizontal and vertical lengths of the rectangular pixel and A is the brightness value of the pixel.
- the peaks of such a sinc function correspond to harmonics or multiples of the fundamental spatial frequency and the peak to peak spacing in the frequency domain is dependent on the edge lengths of the cuboid in the spatial domain before transformation. It is noted that the frequency spectrum of
- the frequency spectrum of any shaped particle is related to the frequency spectrum of a rectangle since any single radial slice through the particle results in a step function.
- the projection of a spherical particle on a 2-D plane can be decomposed as an infinite number of radial slices that each define a rectangle and, thus, the resultant spectrum also consists of equally spaced peaks, or harmonics.
- a high resolution image of a particle i.e., cases in which an infinite number of pixels represent a particle.
- a high resolution image of a spherical particle will generally appear as a circle without distinct edges as it just gradually fades into the background (i.e., similar to a Gaussian function). Without distinct edges, the harmonic content will be minimal and the frequency spectrum of such an image will itself be very close to a Gaussian function.
- the discrete Fourier transform is Gaussian, with the widths of the two Gaussians (spatial and spectral) being inversely related.
- a graph of an exemplary frequency spectrum of a spherical particle is shown in Fig. 2 having a primary lobe 27 and a radial harmonic 28.
- FIG. 3 A cross-sectional view or profile of the graph depicted in Fig. 2 is shown in Fig. 3 .
- Figs. 2 and 3 are used in conjunction with the descriptions of the methods outlined in Figs. 4-6 , specifically in reference to processes of analyzing a frequency spectrum of an image.
- the frequency spectrum depicted in Figs. 2 and 3 includes a single radial harmonic 28, it is noted that the frequency spectrums considered for the methods described herein are not necessarily so limited. In particular, frequency spectrums having more than one harmonic may be considered for the methods described herein. It is noted that, just as with a spectrum of a square or a circle, primary lobe 27 will contract if the sphere's diameter increases.
- any type of particle may be used for the methods described herein.
- particles serving as vehicles for molecular reactions may be particularly applicable for the methods described herein.
- Exemplary molecular reaction particles which are used in imaging systems include xMAP® microspheres, which may be obtained commercially from Luminex Corporation of Austin, Texas.
- the term "particle” is used herein to generally refer to microparticles, microspheres, polystyrene beads, quantum dots, nanodots, nanoparticles, nanoshells, beads, microbeads, latex particles, latex beads, fluorescent beads, fluorescent particles, colored particles, colored beads, tissue, cells, microorganisms, organic matter, non-organic matter, or any other discrete substrates or substances known in the art. Any of such terms may be used interchangeably herein.
- an embodiment of a method includes successively imaging an imaging region of an assay analysis system as particles are loaded into the imaging region.
- the frequency of imaging may be preset and may generally be any frequency deemed appropriate for the assay analysis system, particularly depending on the flow rate the fluid assay is introduced into the imaging region, the processing speed of the photosensitive detection subsystem of the assay analysis system, and the desired precision for identifying a point at which particles start to accumulate and/or cluster within the imaging region.
- An exemplary frequency of imaging may be between every 1 to 5 milliseconds.
- a frequency spectrum of each image is generated via a discrete Fourier transform as noted in block 32.
- the frequency spectrums are specifically generated upon formation of each image (i.e., immediately after the formation of each image) such that the routine outlined in Fig. 4A is performed in real-time (i.e., as particles are being loaded into the imaging region).
- the frequency spectrums may be generated via a fast Fourier transform (FFT) or a discrete cosine transform (DCT), both of which are categorized as discrete Fourier transforms.
- FFTs are considered a more complete frequency analysis tool than DCTs, but DCTs are much faster to compute than FFTs. Thus, there is generally a trade-off of which transform to employ.
- the method continues to block 34 in which the same coordinate portion of each frequency spectrum is integrated.
- the "same coordinate portion" generally refers to the same two-dimensional or three-dimensional portion of each frequency spectrum as addressed by the spectrums' coordinates.
- the same coordinate portion may be any portion of the frequency spectrums, but for reasons set forth below, it may be advantageous for the same coordinate portion to be within a high frequency portion of each spectrum. As further noted below, it may be advantageous for the same coordinate portion to include a portion of a harmonic within each frequency spectrum. In general, each spectrum will get brighter as more particles populate the imaging volume.
- the particles will begin to crowd around and/or cluster with other particles and, as they do, the frequency spectrums will begin to be biased towards the lower frequencies since reflections off of many of the particle edges that contribute to the higher frequencies of the spectrum will be smoothed, reduced, or removed.
- the brightness gradient at the higher frequencies of the frequency spectrums will start to decrease and the brightness gradient at the lower frequencies of the frequency spectrums will increase at some point since a higher proportion of the brightness contributed to the spectrum by incoming particles will register in the lower frequencies.
- a portion of the frequency spectrums may be monitored (i.e., by taking an integral of such a portion) to determine at which point to terminate the loading of particles within the imaging region, specifically to inhibit or minimize the crowding and/or clustering of particles within the imaging region.
- a portion of the frequency spectrums may be monitored to indicate when the imaging volume is "full” but not overcrowded. This technique is very powerful because it requires very little knowledge about the particles being loaded into the volume and it can identify the proper "load point" for an infinite number of distributions without adjustment.
- portions within either the higher frequency portion or the lower frequency portion may be monitored to terminate the loading of particles within the imaging region.
- the lower frequency portions of the spectrums may contain increases in brightness caused by rising levels of background light and, thus, decreases of the brightness gradient in the lower frequency portions of a spectrum due to particle accumulation and/or clustering in the imaging region may be slight. Since the high frequency portions of the spectrum are not indicative of levels of background light in an image, it may be advantageous, in some cases, for the same coordinate portion integrated at block 34 to be within a high frequency portion of each spectrum.
- the primary lobe of a frequency spectrum represents the low frequency portion of light within an image and the portions of the spectrum extending out from the primary lobe, particularly the harmonics, represent the high frequency portion of light within an image.
- primary lobe 27 represents the low frequency portion of the image
- harmonic 28 represents the high frequency portion of the image.
- the same coordinate portion integrated at block 34 may include a portion of a harmonic within each frequency spectrum.
- the same coordinate portion may include any portion of the spectrum outward from the primary lobe.
- the same coordinate portion may, in some embodiments, be the entire area of the spectrum outward from the primary lobe. In other cases, the same coordinate portion may be a line extending from the base of the primary lobe out to the corner of the spectrum. Other portions of the high frequency portion of the spectrum may also be considered for the integral computations.
- the same coordinate portion integrated at block 34 may be preset before the method outlined in Fig. 4A commences.
- the method may include analyzing at least the first frequency spectrum generated in the routine to select a basis point from which to establish the same specified portion of each frequency spectrum to be integrated, as shown in block 40.
- Such a process may generally include analyzing at least the first frequency spectrum to determine the extent of the primary lobe and selecting the basis point based on thereon, such as at the base of the primary lobe (i.e., the low point between the primary lobe and the harmonic) or the basis point at a point offset and outward from the base of the primary lobe.
- An exemplary analysis routine may involve computing a moving average of brightness between a center of the spectrum and a corner point of the spectrum to determine the base of the primary lobe, specifically analyzing the moving average computations and assigning the base of the primary lobe when the moving average first starts to increase. Other manners of determining the base of the primary lobe, however, may be used.
- the process of analyzing a frequency spectrum to select a basis point for establishing the portion of each frequency spectrum to be integrated may, in some embodiments, be done solely at the first generated frequency spectrum. In other cases, the process of analyzing a frequency spectrum to select a basis point for establishing the portion of each frequency spectrum to be integrated may be done at each frequency spectrum generated or, alternatively, may be done in a periodic manner relative to the generation of the frequency spectrums, such as but not limited to every other frequency spectrum which is generated. It is noted that the process of analyzing at least the first generated frequency spectrum to select a basis point for establishing the portion of each frequency spectrum to be integrated is optional and, thus, block 40 may be omitted from the method in some cases. Block 40 is outlined by a dotted line in Fig. 4A to indicate that it is an optional process.
- the method outlined in Fig. 4A includes terminating the loading of particle into the imaging region upon computing an integral which meets a criterion preset for the system.
- the termination of particle loading may include any manner known in the art, such as but not limited to closing a valve at any point in the fluid transmission lines feeding the imaging region or halting a pump feeding the fluid assay.
- particle loading may be terminated upon computing an integral which crosses a predetermined threshold as noted in block 36.
- the predetermined threshold may be a particular integral value, which may vary among applications and systems and may generally be set based on the brightness of the light to be reflected from the particles and the desired precision for identifying a point at which particles start to accumulate and/or cluster within the imaging chamber.
- the loading of particles into the imaging region may be terminated upon detecting a change in integral magnitude less than a preset limit between frequency spectrums generated in succession as noted in block 44.
- the process outlined in block 44 may include terminating the loading of particles upon detecting a change in the rate of increase of the successively computed integrals.
- the method outlined in Fig. 4A may generally include tracking the integrals calculated for the successively generated frequency spectrums prior to terminating particle loading based upon detecting a change in integral magnitude.
- the preset limit set forth in block 44 corresponding to the change in integral magnitude by which to terminate the loading of particles may be a particular value preassigned to the system or assay.
- the preset limit may be set prior to the processing of the assay.
- the preset limit may include any threshold deemed applicable for the assay and/or system, depending on the brightness of the light to be reflected from the particles and the desired precision for identifying a point at which particles start to accumulate and/or cluster within the imaging chamber.
- the preset limit set forth in block 44 by which to terminate the loading of particles may be based on changes in integral magnitude between two or more of the frequency spectrums as noted in block 46. In particular, such a process may involve measuring changes in integral magnitude between two frequency spectrums measured in succession and setting the preset limit to be the measured change or less than the measured change.
- the process outlined in block 46 may be performed on the first two generated frequency spectrums and, in some cases, for each frequency spectrum generated thereafter. Alternatively, the process may be performed in a periodic manner relative to the generation of the frequency spectrums, but not on all of the frequency spectrums. It is noted that the process of setting the limit by which to terminate particle loading based on changes in integral magnitude is optional and, thus, block 46 may be omitted from the method in some cases. Block 46 is outlined by a dotted line in Fig. 4A to indicate that it is an optional process.
- An exemplary manner for conducting the processes denoted in blocks 42, 46, and 44 includes graphing the integral magnitudes for the process of block 42 and monitoring a slope of the graph for the process of block 46. The process of monitoring the slope of the graph may generally be used to set the preset limit by which to terminate particle loading and, thus, upon detecting a change in the slope, the loading of the particles may be terminated as set forth in block 44.
- Fig. 4B denotes an alternative method for analyzing particle quantity and distribution within an imaging region of an optical assay analysis system as particles are loaded into the imaging region to determine when to terminate the loading of particles into the imaging region.
- embodiments of the method presented proceed in a similar manner to Fig. 4B .
- the method proceeds by analyzing the particle quantity and distribution within an imaging region of an optical assay analysis system by analyzing the frequency content of successive images as particles are loaded into the imaging reason. Moreover, based on the frequency content of these successive images, it may be determined when to terminate the loading of the particles.
- the embodiments of the method denoted in Fig. 4B analyze the images differently. Rather than converting the images to the frequency domain, the analysis if the frequency content of the images is performed in the spatial domain.
- embodiments of the method in Fig. 4B proceed by generating a convolved spatial image by convolving each image with a convolution kernel as denoted in block 33.
- the higher frequency components of the images may be found in the edges of the particles.
- convolving each successive image with the convolution kernel may act as a filter designed to isolate various higher frequency components.
- the convolution kernel may be configured to act as a high pass filter-filtering out the lower frequency components of the images and leaving the higher frequency components.
- the convolution kernel may be configured to act a band pass filter-filtering out both lower and higher frequency components to focus on a specific frequency band.
- the spectrum may be multiplied by a filter function.
- multiplication by a function in the frequency domain is mathematically equivalent to convolution of the inverse fourier transform in the spatial domain.
- the convolution kernel be created based on the inverse Fourier transform of the filter function that would be applied to the image spectrum to filter frequencies in the frequency domain.
- the frequency components left in the image after convolving the image with the filter kernel may correspond to the same "portions of the frequency spectrums" discussed with regard to blocks 34 and 40 above (e.g., a portion of the frequency spectrum moving outward from the primary lobe).
- portions of the frequency spectrums discussed with regard to blocks 34 and 40 above (e.g., a portion of the frequency spectrum moving outward from the primary lobe).
- the method proceeds, in some embodiments, by the "same coordinate portion" of each frequency spectrum, so that that portion may be integrated.
- filter kernel may be created based on the inverse Fourier transform of a filter function designed to keep frequency components in these coordinate portions. Effectively then, convolving the filter kernel with the image to produced the convolved spatial image will have the same effect as isolating certain frequencies in the frequency domain.
- integrating at least a portion of the convolved spatial image as denoted in block 35 will provide information regarding the frequency content of the images. As described in detail above, based on such changes to the frequency content of the successive images (as calculated by the integral of the convolved spatial image), it may be determined at which point to terminate the loading of particles within the imaging region, or specifically to inhibit or minimize the crowding and/or clustering of particles within the imaging region.
- Fig. 5 denotes a method for analyzing particle quantity and distribution within an imaging region of an optical assay analysis system to determine if enough particles are present in the imaging region for further processes by the assay analysis system.
- the method includes generating a frequency spectrum of an image via a discrete Fourier transform and integrating a portion of the frequency spectrum.
- the frequency spectrum for block 50 may be generated via a fast Fourier transform (FFT) or a discrete cosine transform (DCT). Further in reference to the description of Fig.
- FFT fast Fourier transform
- DCT discrete cosine transform
- the integration step in block 52 may be applied to any portion of the frequency spectrum, but it may be advantageous for the portion to be within a high frequency portion of the spectrum and to further include a portion of a harmonic within the frequency spectrum.
- the specifics with regard to the options for generating a frequency spectrum and integrating a portion of the spectrum described in reference to blocks 32 and 34 of Fig. 4A are referenced for blocks 50 and 52 of Fig. 5 and are not reiterated for the sake of brevity.
- the steps of generating a frequency spectrum of an image and integrating a portion of the frequency spectrum may be performed instead by generating a convolved spatial image and integrating at least a portion of the convolved spatial image.
- the predetermined threshold may be any threshold deemed applicable for the assay and/or system, depending on the brightness of the light to be reflected from the particles and the desired precision for determining whether a sufficient amount of particles are present in the imaging chamber for further processes of the assay analysis system.
- the further processes considered for the method outlined in Fig. 5 may generally include any process which is particle-dependent and, specifically, any process of which performance depends on having a certain quantity of particles present in the imaging region.
- Exemplary processes include but are not limited to analyzing particles within the imaging chamber for the detection and quantification of one or more analytes of interest within a sample and analyzing particles within the imaging chamber to perform an accurate autofocus routine.
- the method may include sending a signal indicating enough particles are in the imaging region for further processes by the assay analysis system upon calculating an integral greater than the predetermined threshold as shown in block 54.
- the method includes sending a different signal indicating not enough particles are in the imaging region for further processes by the assay analysis system upon calculating an integral less than the predetermined threshold as denoted in block 56.
- the process may terminate upon either signal being sent. In other cases, however, the method may continue after the signal referenced in block 56 is sent, specifically in an effort to increase the particle quantity in the imaging chamber for further processes of the assay analysis system.
- the method may include loading additional particles into the imaging region upon the signal referenced in block 56 is sent.
- the method may include generating an additional image of the imaging region subsequent to loading the additional particles into the imaging region as denoted in block 59. As shown in Fig. 5 , the method routes back to repeat the processes outlined in blocks 50, 52, 53, and 54 or 56.
- blocks 58, 59, 50, 52 and 53 may be reiterated until a signal is sent for block 54 or until a predetermined number of iterations is conducted. It is noted that the processes of loading additional particles into the imaging region and generating an additional image of the imaging region are optional and, thus, blocks 58 and 59 may be omitted from the method in some cases. Blocks 58 and 59 are outlined by dotted lines in Fig. 5 to indicate that they are optional processes.
- Fig. 6 denotes a method for evaluating the performance of a focusing routine performed on an assay analysis system.
- the method includes performing an automated routine to optimize a focal position of a photosensitive detection subsystem of an assay analysis system.
- a routine may generally be specific to the assay analysis system and, may be even more specific to the photosensitive detection subsystem included in the assay analysis system and, thus, may vary widely.
- the method includes imaging particles arranged within an imaging region of the assay analysis system subsequent to performing the automated routine as denoted in block 62. Thereafter, a frequency spectrum of the image may be generated via a discrete Fourier transform as shown in block 64.
- the frequency spectrum for block 64 may be generated via a fast Fourier transform (FFT) or a discrete cosine transform (DCT).
- FFT fast Fourier transform
- DCT discrete cosine transform
- the method continues to block 66 to compare a width of a primary lobe of the frequency spectrum at a designated brightness value to a benchmark to evaluate the performance of the automated routine.
- the benchmark may be derived experimentally apart from the assay analysis system.
- the benchmark may be based on a historic record of primary lobe widths at the designated brightness value stored in the assay analysis system, specifically from frequency spectrums generated from images previously obtained by the assay analysis system.
- primary lobe widths from different frequency spectrums may be stored within a database of the assay analysis system such that a historic record can be maintained. The recording of the primary lobe widths may be performed each time the method outlined in Fig.
- Fig. 6 is performed for an assay analysis system or may be performed in a periodic manner relative to the number of times the method is conducted. Further to such a concept, the method outlined in Fig. 6 (i.e., the processes referenced in blocks 60, 62, 64 and 66) may be repeated at a set frequency relative to the number of times the automated routine is performed for the assay analysis system.
- the set frequency may be any frequency deemed appropriate for the assay analysis system, particularly depending on the desired precision for evaluating the performance of a focusing routine.
- this invention is believed to provide methods, storage mediums, and systems for analyzing particle quantity and distribution within an imaging region of an assay analysis system.
- methods, storage mediums, and systems for evaluating the performance of a focusing routine performed on an assay analysis system are provided. Further modifications and alternative embodiments of various aspects of the invention will be apparent to those skilled in the art in view of this description. Accordingly, this description is to be construed as illustrative only and is for the purpose of teaching those skilled in the art the general manner of carrying out the invention. It is to be understood that the forms of the invention shown and described herein are to be taken as the presently preferred embodiments. Elements and materials may be substituted for those illustrated and described herein, parts and processes may be reversed, and certain features of the invention may be utilized independently, all as would be apparent to one skilled in the art after having the benefit of this description of the invention.
Landscapes
- Physics & Mathematics (AREA)
- Chemical & Material Sciences (AREA)
- General Physics & Mathematics (AREA)
- Health & Medical Sciences (AREA)
- Spectroscopy & Molecular Physics (AREA)
- Life Sciences & Earth Sciences (AREA)
- Biochemistry (AREA)
- General Health & Medical Sciences (AREA)
- Analytical Chemistry (AREA)
- Immunology (AREA)
- Pathology (AREA)
- Dispersion Chemistry (AREA)
- Nuclear Medicine, Radiotherapy & Molecular Imaging (AREA)
- Engineering & Computer Science (AREA)
- Signal Processing (AREA)
- Investigating Or Analysing Materials By Optical Means (AREA)
- Investigating, Analyzing Materials By Fluorescence Or Luminescence (AREA)
- Computer Vision & Pattern Recognition (AREA)
- Analysing Materials By The Use Of Radiation (AREA)
Claims (15)
- Speichermedium, aufweisend von einem Prozessor ausführbare Programmanweisungen zum:- aufeinanderfolgenden Abbilden eines Abbildungsbereich eines Assay-Analysesystems (10), wenn Partikel in den Abbildungsbereich geladen werden;- Erzeugen eines Frequenzspektrums jedes Bildes über eine diskrete Fourier-Transformation bei Formung jedes Bildes;- Integrieren eines gleichen Koordinatenabschnitts jedes Frequenzspektrums; und- Beenden des Ladens von Partikeln in den Bild nach(a) Berechnen eines Integrals, das einen vorbestimmten Schwellenwert überschreitet, und/oder(b) Verfolgen von für aufeinanderfolgend erzeugten Frequenzspektren berechneten Integralen; und Beenden des Ladens von Partikeln, wenn eine Änderung der integralen Größe detektiert wurde, die geringer ist als eine gegebene Grenze zwischen zwei Frequenzspektren, die aufeinanderfolgend generiert wurden.
- Speichermedium nach Anspruch 1, wobei der gleiche Koordinatenabschnitt jedes Frequenzspektrums innerhalb eines Hochfrequenzanteils jedes Frequenzspektrums liegt.
- Speichermedium nach Anspruch 1, wobei der gleiche Koordinatenabschnitt jedes Frequenzspektrums einen Anteil einer Harmonischen innerhalb jedes Frequenzspektrums aufweist.
- Speichermedium nach Anspruch 1 Option a), weiterhin aufweisend von einem Prozessor ausführbare Programmanweisungen zum Analysieren mindestens des ersten erzeugten Frequenzspektrums, um einen Basispunkt auszuwählen, von dem aus der gleiche spezifizierte Anteil jedes zu integrierenden Frequenzspektrums festgelegt werden soll.
- Speichermedium nach Anspruch 1 Option b), weiterhin aufweisend von einem Prozessor ausführbare Programmanweisungen zum Einstellen der gegebenen Grenze basierend auf Änderungen der integralen Größe zwischen zwei oder mehr der Frequenzspektren.
- Ein Assay-Analysesystem (10), aufweisend:- eine Analysekammer (12);- ein Beleuchtungssubsystem, das konfiguriert ist, um einen Abbildungsbereich der Analysekammer (12) beleuchten;- ein lichtempfindlichen Detektionssubsystem, das konfiguriert ist, um innerhalb des Abbildungsbereichs der Analysekammer (12) angeordnete Partikel abzubilden, wenn er beleuchtet wird; und- von einem Prozessor ausführbare Programmanweisungen zum:• Erzeugen, über eine diskrete Fourier-Transformation, eines Frequenzspektrums eines Bildes, das von dem lichtempfindlichen Detektionssubsystem erzeugt wird;• Integrieren eines Anteils des Frequenzspektrums;• nach Berechnen eines Integrals, das größer als eine vorbestimmte Schwelle ist, Senden eines ersten Signals, das anzeigt, dass sich genügend Partikel für weitere Prozesse durch das Assay-Analysesystem (10) im Abbildungsbereich befinden; und• nach Berechnen eines Integrals, das kleiner als der vorbestimmte Schwellenwert ist, Senden eines zweiten Signals, das anzeigt, dass sich nicht genügend Partikel für weitere Prozesse durch das Assay-Analysesystem (10) in dem Abbildungsbereich befinden.
- Assay-Analysesystem (10) nach Anspruch 6, wobei der Anteil des Frequenzspektrums innerhalb eines Hochfrequenzabschnitts des Frequenzspektrums liegt oder wobei der Anteil des Frequenzspektrums einen Anteil einer Harmonischen innerhalb des Frequenzspektrums aufweist.
- Assay-Analysesystem (10) nach Anspruch 6, wobei die Programmanweisungen weiterhin von einem Prozessor ausführbar sind zum:- Laden zusätzlicher Partikel in den Abbildungsbereich nach dem Senden des zweiten Signals;- Erzeugen eines zusätzlichen Bildes des Abbildungsbereichs anschließend an das Laden der zusätzlichen Partikel in den Abbildungsbereich;- Wiederholen der Schritte des Erzeugens eines Frequenzspektrums, Integrieren eines Anteils des Frequenzspektrums, und Senden eines ersten Signals oder zweiten Signals für das zusätzliche Bild; und- Reiterieren der Schritte des Ladens zusätzlicher Partikel in den Abbildungsbereich, Erzeugen eines zusätzlichen Bildes, Erzeugen eines Frequenzspektrums, Integrieren eines Anteils des Frequenzspektrums, und Senden eines ersten Signals oder zweiten Signals für jedes zusätzliche Bild, bis ein erstes Signal gesendet wird oder bis eine vorbestimmte Anzahl von Iterationen durchgeführt wird.
- Ein Verfahren, aufweisend:- Durchführen einer automatisierten Routine zum Optimieren einer Fokusposition eines lichtempfindlichen Detektionssubsystems eines Assay-Analysesystems (10);- Abbilden von Partikeln, die innerhalb eines Abbildungsbereichs des Assay-Analysesystems (10) angeordnet sind, anschließend an die Durchführung der automatisierten Routine;- Erzeugen eines Frequenzspektrums des Bildes über eine diskrete Fourier-Transformation; und- Vergleichen einer Breite eines primären Maximums des Frequenzspektrums bei einem bestimmten Helligkeitswert mit einer Benchmark, um die Leistung der automatisierten Routine zu bewerten.
- Verfahren nach Anspruch 9, wobei die Benchmark experimentell und spezifisch für das Assay-Analysesystem (10) abgeleitet wird oder wobei die Benchmark auf einer historischen Aufzeichnung von Breiten primärer Maxima bei dem bestimmten Helligkeitswert von Frequenzspektren basiert, die aus Bildern erzeugt werden, die zuvor von dem Assay-Analysesystem (10) erhalten wurden.
- Verfahren nach Anspruch 9, weiterhin aufweisend das Wiederholen, bei einer festgelegten Frequenz relativ zu der Anzahl, wie oft die automatisierte Routine für das Assay-Analysesystem (10) durchgeführt wird, der Schritte des Abbildens, des Erzeugens eines Frequenzspektrums, und des Vergleichens einer Breite einer Primärkeule des erzeugten Frequenzspektrums mit der Benchmark.
- Verfahren nach Anspruch 9 oder Assay-Analysesystem (10) nach Anspruch 6, wobei das Frequenzspektrum über eine Fourier-Transformation erzeugt wird oder wobei das Frequenzspektrum über eine diskrete Cosinus-Transformation erzeugt wird.
- Speichermedium, aufweisend von einem Prozessor ausführbare Programmanweisungen zum:- Aufeinanderfolgenden Abbilden eines Abbildungsbereichs eines Assay-Analysesystems (10), während Partikel in den Abbildungsbereich geladen werden;- Erzeugen eines gefalteten räumlichen Bildes von jedem Bild durch Falten jedes Bildes mit einem Filterkern;- Integrieren mindestens eines Anteils jedes gefalteten räumlichen Bildes; und- Beenden des Ladens von Partikeln in den Abbildungsbereich wenn ein Integral berechnet wird, das einen vorbestimmten Schwellenwert überschreitet.
- Assay-Analysesystem (10), aufweisend:- eine Analysekammer (12);- ein Beleuchtungssubsystem, das konfiguriert ist, um einen Abbildungsbereich der Analysekammer (12) beleuchten;- ein lichtempfindlichen Detektionssubsystem, das konfiguriert ist, um innerhalb des Abbildungsbereichs der Analysekammer (12) angeordnete Partikel abzubilden, wenn er beleuchtet wird; und- Programmanweisungen, die von einem Prozessor ausgeführt werden können, zum:• Erzeugen eines gefalteten räumlichen Bildes eines Bildes, das von dem lichtempfindlichen Detektionssubsystem erzeugt wird;• Integrieren mindestens eines Anteils des gefalteten räumlichen Bildes;• bei Berechnen eines Integrals, das größer als eine vorbestimmte Schwelle ist, Senden eines ersten Signals, das anzeigt, dass sich genügend Partikel für weitere Prozesse durch das Assay-Analysesystem (10) im Abbildungsbereich befinden; und• bei Berechnen eines Integrals, das kleiner als die vorbestimmte Schwelle ist, Senden eines zweiten Signals, das anzeigt, dass sich nicht genügend Partikel für weitere Prozesse durch das Assay-Analysesystem (10) im Abbildungsbereich befinden.
- Assay-Analysesystem (10) nach Anspruch 14, wobei die Programmanweisungen weiterhin von einem Prozessor ausführbar sind zum:- Laden zusätzlicher Partikel in den Abbildungsbereich nach Senden des zweiten Signals;- Erzeugen eines zusätzlichen Bildes des Abbildungsbereichs anschließend an das Laden der zusätzlichen Partikel in den Abbildungsbereich;- Wiederholen der Schritte des Erzeugens eines gefalteten räumlichen Bildes, Integrieren mindestens eines Anteils des gefalteten räumlichen Bildes und Senden eines ersten Signals oder zweiten Signals für das zusätzliche Bild; und- Reiterieren der Schritte des Ladens zusätzlicher Partikel in den Abbildungsbereich, Erzeugen eines zusätzlichen Bildes, Erzeugen eines gefalteten räumlichen Bildes, Integrieren mindestens eines Anteils des gefalteten räumlichen Bildes und Senden eines ersten Signals oder zweiten Signals für jedes zusätzliche Bild, bis ein erstes Signal gesendet wird oder bis eine vorbestimmte Anzahl von Iterationen durchgeführt worden ist.
Applications Claiming Priority (2)
| Application Number | Priority Date | Filing Date | Title |
|---|---|---|---|
| US36487910P | 2010-07-16 | 2010-07-16 | |
| PCT/US2011/044152 WO2012009617A2 (en) | 2010-07-16 | 2011-07-15 | Methods, storage mediums, and systems for analyzing particle quantity and distribution within an imaging region of an assay analysis system and for evaluating the performance of a focusing routing performed on an assay analysis system |
Publications (3)
| Publication Number | Publication Date |
|---|---|
| EP2593771A2 EP2593771A2 (de) | 2013-05-22 |
| EP2593771A4 EP2593771A4 (de) | 2018-02-21 |
| EP2593771B1 true EP2593771B1 (de) | 2019-09-04 |
Family
ID=45470094
Family Applications (1)
| Application Number | Title | Priority Date | Filing Date |
|---|---|---|---|
| EP11807558.9A Active EP2593771B1 (de) | 2010-07-16 | 2011-07-15 | Verfahren, speichermedien und systeme zur analyse einer partikelmenge und -verteilung in einem abbildungsbereich eines assay-analysesystems und zur bewertung der leistung eines in einem assay-analysesystem durchgeführten fokussierungsroutings |
Country Status (3)
| Country | Link |
|---|---|
| US (2) | US8717568B2 (de) |
| EP (1) | EP2593771B1 (de) |
| WO (1) | WO2012009617A2 (de) |
Families Citing this family (8)
| Publication number | Priority date | Publication date | Assignee | Title |
|---|---|---|---|---|
| US9223442B2 (en) * | 2013-01-10 | 2015-12-29 | Samsung Display Co., Ltd. | Proximity and touch sensing surface for integration with a display |
| US9857284B1 (en) * | 2013-07-15 | 2018-01-02 | Stratedigm, Inc. | Method and apparatus for detection and measurement of particles with a wide dynamic range of measurement |
| US9256786B2 (en) * | 2013-10-15 | 2016-02-09 | Ge Aviation Systems Llc | Method of identification from a spatial and spectral object model |
| EP3314269A4 (de) | 2015-06-26 | 2019-01-23 | Abbott Laboratories | Reaktionsgefässtauschervorrichtung für einen diagnostischen analysator |
| CN106815878B (zh) * | 2015-12-02 | 2021-02-05 | 北京航空航天大学 | 一种基于多视角多光谱层析成像的图像重建方法 |
| DE102017207648B4 (de) * | 2017-05-05 | 2019-08-22 | Skz-Kfe Ggmbh | Verfahren und Vorrichtung zur Messung einer Schichtdicke eines Objekts |
| CN113670865B (zh) * | 2020-05-13 | 2024-05-10 | 深圳华大智造科技股份有限公司 | 分辨率板、分辨率评估方法及相关设备 |
| CN113804594B (zh) * | 2021-08-03 | 2024-07-02 | 华帝股份有限公司 | 基于傅里叶变换的光电式烟感传感器免标定方法、光电式烟感系统和吸油烟机 |
Family Cites Families (14)
| Publication number | Priority date | Publication date | Assignee | Title |
|---|---|---|---|---|
| US5114350A (en) * | 1989-03-08 | 1992-05-19 | Cholestech Corporation | Controlled-volume assay apparatus |
| US5072382A (en) | 1989-10-02 | 1991-12-10 | Kamentsky Louis A | Methods and apparatus for measuring multiple optical properties of biological specimens |
| US5235428A (en) | 1990-02-21 | 1993-08-10 | Sony Corporation | Auto-focus system for video camera |
| US5556764A (en) | 1993-02-17 | 1996-09-17 | Biometric Imaging, Inc. | Method and apparatus for cell counting and cell classification |
| JP2005502369A (ja) * | 2001-09-12 | 2005-01-27 | バースタイン テクノロジーズ,インコーポレイティド | 分画細胞計数方法ならびにそれを実行するための関連する装置およびソフトウェア |
| WO2003034041A1 (en) * | 2001-10-12 | 2003-04-24 | Imperial College Innovations Limited | Particle measurement system using time-frequency transform |
| US7123750B2 (en) * | 2002-01-29 | 2006-10-17 | Pioneer Hi-Bred International, Inc. | Automated plant analysis method, apparatus, and system using imaging technologies |
| US6847451B2 (en) * | 2002-05-01 | 2005-01-25 | Lifescan, Inc. | Apparatuses and methods for analyte concentration determination |
| EP4071458B1 (de) * | 2005-09-21 | 2025-11-05 | Luminex Corporation | Verfahren und systeme für die bilddatenverarbeitung |
| CN101479603B (zh) | 2006-06-02 | 2012-11-21 | 卢米尼克斯股份有限公司 | 包括使用磁粒子和应用磁场的用于执行一种或多种分析物的测量系统和方法 |
| AU2008215155A1 (en) | 2007-02-14 | 2008-08-21 | Newcastle Innovation Limited | An edge detection method and a particle counting method |
| WO2009039165A1 (en) | 2007-09-17 | 2009-03-26 | Luminex Corporation | Systems, storage mediums, and methods for identifying particles in flow |
| CN101981446B (zh) * | 2008-02-08 | 2016-03-09 | 医疗探索公司 | 用于使用支持向量机分析流式细胞术数据的方法和系统 |
| CA2730982C (en) | 2008-07-17 | 2017-11-14 | Luminex Corporation | Methods, storage mediums, and systems for configuring classification regions within a classification matrix of an analysis system and for classifying particles of an assay |
-
2011
- 2011-07-15 EP EP11807558.9A patent/EP2593771B1/de active Active
- 2011-07-15 US US13/184,100 patent/US8717568B2/en active Active
- 2011-07-15 WO PCT/US2011/044152 patent/WO2012009617A2/en not_active Ceased
-
2014
- 2014-05-01 US US14/267,693 patent/US9719855B2/en active Active
Non-Patent Citations (1)
| Title |
|---|
| None * |
Also Published As
| Publication number | Publication date |
|---|---|
| US9719855B2 (en) | 2017-08-01 |
| US20120019536A1 (en) | 2012-01-26 |
| WO2012009617A3 (en) | 2012-05-10 |
| US8717568B2 (en) | 2014-05-06 |
| EP2593771A4 (de) | 2018-02-21 |
| EP2593771A2 (de) | 2013-05-22 |
| WO2012009617A2 (en) | 2012-01-19 |
| US20140354986A1 (en) | 2014-12-04 |
Similar Documents
| Publication | Publication Date | Title |
|---|---|---|
| US9719855B2 (en) | Evaluation of focusing performance in an assay analysis system | |
| EP3776337B1 (de) | Systeme zur schätzung der zellform | |
| US10379027B2 (en) | Method for identifying blood particles using a photodetector | |
| EP3105638B1 (de) | Schnelle merkmalsidentifizierung für holografische verfolgung und charakterisierung von kolloidalen partikeln | |
| CN104764684A (zh) | 用于通过使用光分布来提高粒子成像设备中的测量精确度的装置、系统和方法 | |
| US9063088B2 (en) | Methods and systems for image data processing | |
| EP4006524B1 (de) | Teilchenquantisierungsvorrichtung | |
| Höfener et al. | Automated density-based counting of FISH amplification signals for HER2 status assessment | |
| WO2016189522A1 (en) | System and apparatus for blind deconvolution of flow cytometer particle emission | |
| Sarder et al. | Estimating locations of quantum-dot-encoded microparticles from ultra-high density 3-D microarrays | |
| JP2023519423A (ja) | レンズレス顕微撮像システムとその方法、及び生化学物質検出システムとその方法 | |
| US20240230507A1 (en) | Feature value calculation device, feature value calculation method, and program | |
| US20240377321A1 (en) | Holographic image processing and data extraction | |
| Sarder | Statistical Design And Imaging Of Position-Encoded 3D Microarrays | |
| Sarder et al. | Statistical design of position-encoded microsphere arrays | |
| Lee et al. | Deep learning-enabled digital resolution molecular diagnostics in photonic resonator absorption microscopy | |
| Sarder | Statistical design and imaging of position-encoded three-dimensional microarrays | |
| Sarder et al. | Statistical design of a 3D microarray with position-encoded microspheres |
Legal Events
| Date | Code | Title | Description |
|---|---|---|---|
| PUAI | Public reference made under article 153(3) epc to a published international application that has entered the european phase |
Free format text: ORIGINAL CODE: 0009012 |
|
| 17P | Request for examination filed |
Effective date: 20130218 |
|
| AK | Designated contracting states |
Kind code of ref document: A2 Designated state(s): AL AT BE BG CH CY CZ DE DK EE ES FI FR GB GR HR HU IE IS IT LI LT LU LV MC MK MT NL NO PL PT RO RS SE SI SK SM TR |
|
| DAX | Request for extension of the european patent (deleted) | ||
| A4 | Supplementary search report drawn up and despatched |
Effective date: 20180118 |
|
| RIC1 | Information provided on ipc code assigned before grant |
Ipc: G01N 21/01 20060101ALI20180112BHEP Ipc: G01N 15/14 20060101AFI20180112BHEP Ipc: G06T 1/00 20060101ALI20180112BHEP |
|
| GRAP | Despatch of communication of intention to grant a patent |
Free format text: ORIGINAL CODE: EPIDOSNIGR1 |
|
| STAA | Information on the status of an ep patent application or granted ep patent |
Free format text: STATUS: GRANT OF PATENT IS INTENDED |
|
| INTG | Intention to grant announced |
Effective date: 20181220 |
|
| GRAS | Grant fee paid |
Free format text: ORIGINAL CODE: EPIDOSNIGR3 |
|
| GRAJ | Information related to disapproval of communication of intention to grant by the applicant or resumption of examination proceedings by the epo deleted |
Free format text: ORIGINAL CODE: EPIDOSDIGR1 |
|
| GRAL | Information related to payment of fee for publishing/printing deleted |
Free format text: ORIGINAL CODE: EPIDOSDIGR3 |
|
| STAA | Information on the status of an ep patent application or granted ep patent |
Free format text: STATUS: REQUEST FOR EXAMINATION WAS MADE |
|
| INTC | Intention to grant announced (deleted) | ||
| GRAR | Information related to intention to grant a patent recorded |
Free format text: ORIGINAL CODE: EPIDOSNIGR71 |
|
| STAA | Information on the status of an ep patent application or granted ep patent |
Free format text: STATUS: GRANT OF PATENT IS INTENDED |
|
| INTG | Intention to grant announced |
Effective date: 20190606 |
|
| GRAA | (expected) grant |
Free format text: ORIGINAL CODE: 0009210 |
|
| STAA | Information on the status of an ep patent application or granted ep patent |
Free format text: STATUS: THE PATENT HAS BEEN GRANTED |
|
| AK | Designated contracting states |
Kind code of ref document: B1 Designated state(s): AL AT BE BG CH CY CZ DE DK EE ES FI FR GB GR HR HU IE IS IT LI LT LU LV MC MK MT NL NO PL PT RO RS SE SI SK SM TR |
|
| REG | Reference to a national code |
Ref country code: GB Ref legal event code: FG4D |
|
| REG | Reference to a national code |
Ref country code: CH Ref legal event code: EP |
|
| REG | Reference to a national code |
Ref country code: AT Ref legal event code: REF Ref document number: 1176053 Country of ref document: AT Kind code of ref document: T Effective date: 20190915 |
|
| REG | Reference to a national code |
Ref country code: DE Ref legal event code: R096 Ref document number: 602011061838 Country of ref document: DE |
|
| REG | Reference to a national code |
Ref country code: IE Ref legal event code: FG4D |
|
| REG | Reference to a national code |
Ref country code: NL Ref legal event code: MP Effective date: 20190904 |
|
| REG | Reference to a national code |
Ref country code: LT Ref legal event code: MG4D |
|
| PG25 | Lapsed in a contracting state [announced via postgrant information from national office to epo] |
Ref country code: FI Free format text: LAPSE BECAUSE OF FAILURE TO SUBMIT A TRANSLATION OF THE DESCRIPTION OR TO PAY THE FEE WITHIN THE PRESCRIBED TIME-LIMIT Effective date: 20190904 Ref country code: HR Free format text: LAPSE BECAUSE OF FAILURE TO SUBMIT A TRANSLATION OF THE DESCRIPTION OR TO PAY THE FEE WITHIN THE PRESCRIBED TIME-LIMIT Effective date: 20190904 Ref country code: SE Free format text: LAPSE BECAUSE OF FAILURE TO SUBMIT A TRANSLATION OF THE DESCRIPTION OR TO PAY THE FEE WITHIN THE PRESCRIBED TIME-LIMIT Effective date: 20190904 Ref country code: BG Free format text: LAPSE BECAUSE OF FAILURE TO SUBMIT A TRANSLATION OF THE DESCRIPTION OR TO PAY THE FEE WITHIN THE PRESCRIBED TIME-LIMIT Effective date: 20191204 Ref country code: LT Free format text: LAPSE BECAUSE OF FAILURE TO SUBMIT A TRANSLATION OF THE DESCRIPTION OR TO PAY THE FEE WITHIN THE PRESCRIBED TIME-LIMIT Effective date: 20190904 Ref country code: NO Free format text: LAPSE BECAUSE OF FAILURE TO SUBMIT A TRANSLATION OF THE DESCRIPTION OR TO PAY THE FEE WITHIN THE PRESCRIBED TIME-LIMIT Effective date: 20191204 |
|
| PG25 | Lapsed in a contracting state [announced via postgrant information from national office to epo] |
Ref country code: ES Free format text: LAPSE BECAUSE OF FAILURE TO SUBMIT A TRANSLATION OF THE DESCRIPTION OR TO PAY THE FEE WITHIN THE PRESCRIBED TIME-LIMIT Effective date: 20190904 Ref country code: LV Free format text: LAPSE BECAUSE OF FAILURE TO SUBMIT A TRANSLATION OF THE DESCRIPTION OR TO PAY THE FEE WITHIN THE PRESCRIBED TIME-LIMIT Effective date: 20190904 Ref country code: AL Free format text: LAPSE BECAUSE OF FAILURE TO SUBMIT A TRANSLATION OF THE DESCRIPTION OR TO PAY THE FEE WITHIN THE PRESCRIBED TIME-LIMIT Effective date: 20190904 Ref country code: RS Free format text: LAPSE BECAUSE OF FAILURE TO SUBMIT A TRANSLATION OF THE DESCRIPTION OR TO PAY THE FEE WITHIN THE PRESCRIBED TIME-LIMIT Effective date: 20190904 Ref country code: GR Free format text: LAPSE BECAUSE OF FAILURE TO SUBMIT A TRANSLATION OF THE DESCRIPTION OR TO PAY THE FEE WITHIN THE PRESCRIBED TIME-LIMIT Effective date: 20191205 |
|
| REG | Reference to a national code |
Ref country code: AT Ref legal event code: MK05 Ref document number: 1176053 Country of ref document: AT Kind code of ref document: T Effective date: 20190904 |
|
| PG25 | Lapsed in a contracting state [announced via postgrant information from national office to epo] |
Ref country code: EE Free format text: LAPSE BECAUSE OF FAILURE TO SUBMIT A TRANSLATION OF THE DESCRIPTION OR TO PAY THE FEE WITHIN THE PRESCRIBED TIME-LIMIT Effective date: 20190904 Ref country code: IT Free format text: LAPSE BECAUSE OF FAILURE TO SUBMIT A TRANSLATION OF THE DESCRIPTION OR TO PAY THE FEE WITHIN THE PRESCRIBED TIME-LIMIT Effective date: 20190904 Ref country code: PL Free format text: LAPSE BECAUSE OF FAILURE TO SUBMIT A TRANSLATION OF THE DESCRIPTION OR TO PAY THE FEE WITHIN THE PRESCRIBED TIME-LIMIT Effective date: 20190904 Ref country code: PT Free format text: LAPSE BECAUSE OF FAILURE TO SUBMIT A TRANSLATION OF THE DESCRIPTION OR TO PAY THE FEE WITHIN THE PRESCRIBED TIME-LIMIT Effective date: 20200106 Ref country code: RO Free format text: LAPSE BECAUSE OF FAILURE TO SUBMIT A TRANSLATION OF THE DESCRIPTION OR TO PAY THE FEE WITHIN THE PRESCRIBED TIME-LIMIT Effective date: 20190904 Ref country code: NL Free format text: LAPSE BECAUSE OF FAILURE TO SUBMIT A TRANSLATION OF THE DESCRIPTION OR TO PAY THE FEE WITHIN THE PRESCRIBED TIME-LIMIT Effective date: 20190904 Ref country code: AT Free format text: LAPSE BECAUSE OF FAILURE TO SUBMIT A TRANSLATION OF THE DESCRIPTION OR TO PAY THE FEE WITHIN THE PRESCRIBED TIME-LIMIT Effective date: 20190904 |
|
| PG25 | Lapsed in a contracting state [announced via postgrant information from national office to epo] |
Ref country code: CZ Free format text: LAPSE BECAUSE OF FAILURE TO SUBMIT A TRANSLATION OF THE DESCRIPTION OR TO PAY THE FEE WITHIN THE PRESCRIBED TIME-LIMIT Effective date: 20190904 Ref country code: SK Free format text: LAPSE BECAUSE OF FAILURE TO SUBMIT A TRANSLATION OF THE DESCRIPTION OR TO PAY THE FEE WITHIN THE PRESCRIBED TIME-LIMIT Effective date: 20190904 Ref country code: SM Free format text: LAPSE BECAUSE OF FAILURE TO SUBMIT A TRANSLATION OF THE DESCRIPTION OR TO PAY THE FEE WITHIN THE PRESCRIBED TIME-LIMIT Effective date: 20190904 Ref country code: IS Free format text: LAPSE BECAUSE OF FAILURE TO SUBMIT A TRANSLATION OF THE DESCRIPTION OR TO PAY THE FEE WITHIN THE PRESCRIBED TIME-LIMIT Effective date: 20200224 |
|
| REG | Reference to a national code |
Ref country code: DE Ref legal event code: R097 Ref document number: 602011061838 Country of ref document: DE |
|
| PLBE | No opposition filed within time limit |
Free format text: ORIGINAL CODE: 0009261 |
|
| STAA | Information on the status of an ep patent application or granted ep patent |
Free format text: STATUS: NO OPPOSITION FILED WITHIN TIME LIMIT |
|
| PG2D | Information on lapse in contracting state deleted |
Ref country code: IS |
|
| PG25 | Lapsed in a contracting state [announced via postgrant information from national office to epo] |
Ref country code: DK Free format text: LAPSE BECAUSE OF FAILURE TO SUBMIT A TRANSLATION OF THE DESCRIPTION OR TO PAY THE FEE WITHIN THE PRESCRIBED TIME-LIMIT Effective date: 20190904 Ref country code: IS Free format text: LAPSE BECAUSE OF FAILURE TO SUBMIT A TRANSLATION OF THE DESCRIPTION OR TO PAY THE FEE WITHIN THE PRESCRIBED TIME-LIMIT Effective date: 20200105 |
|
| 26N | No opposition filed |
Effective date: 20200605 |
|
| PG25 | Lapsed in a contracting state [announced via postgrant information from national office to epo] |
Ref country code: SI Free format text: LAPSE BECAUSE OF FAILURE TO SUBMIT A TRANSLATION OF THE DESCRIPTION OR TO PAY THE FEE WITHIN THE PRESCRIBED TIME-LIMIT Effective date: 20190904 |
|
| PG25 | Lapsed in a contracting state [announced via postgrant information from national office to epo] |
Ref country code: MC Free format text: LAPSE BECAUSE OF FAILURE TO SUBMIT A TRANSLATION OF THE DESCRIPTION OR TO PAY THE FEE WITHIN THE PRESCRIBED TIME-LIMIT Effective date: 20190904 |
|
| REG | Reference to a national code |
Ref country code: CH Ref legal event code: PL |
|
| REG | Reference to a national code |
Ref country code: BE Ref legal event code: MM Effective date: 20200731 |
|
| PG25 | Lapsed in a contracting state [announced via postgrant information from national office to epo] |
Ref country code: LU Free format text: LAPSE BECAUSE OF NON-PAYMENT OF DUE FEES Effective date: 20200715 Ref country code: LI Free format text: LAPSE BECAUSE OF NON-PAYMENT OF DUE FEES Effective date: 20200731 Ref country code: CH Free format text: LAPSE BECAUSE OF NON-PAYMENT OF DUE FEES Effective date: 20200731 |
|
| PG25 | Lapsed in a contracting state [announced via postgrant information from national office to epo] |
Ref country code: BE Free format text: LAPSE BECAUSE OF NON-PAYMENT OF DUE FEES Effective date: 20200731 |
|
| PG25 | Lapsed in a contracting state [announced via postgrant information from national office to epo] |
Ref country code: IE Free format text: LAPSE BECAUSE OF NON-PAYMENT OF DUE FEES Effective date: 20200715 |
|
| PG25 | Lapsed in a contracting state [announced via postgrant information from national office to epo] |
Ref country code: TR Free format text: LAPSE BECAUSE OF FAILURE TO SUBMIT A TRANSLATION OF THE DESCRIPTION OR TO PAY THE FEE WITHIN THE PRESCRIBED TIME-LIMIT Effective date: 20190904 Ref country code: MT Free format text: LAPSE BECAUSE OF FAILURE TO SUBMIT A TRANSLATION OF THE DESCRIPTION OR TO PAY THE FEE WITHIN THE PRESCRIBED TIME-LIMIT Effective date: 20190904 Ref country code: CY Free format text: LAPSE BECAUSE OF FAILURE TO SUBMIT A TRANSLATION OF THE DESCRIPTION OR TO PAY THE FEE WITHIN THE PRESCRIBED TIME-LIMIT Effective date: 20190904 |
|
| PG25 | Lapsed in a contracting state [announced via postgrant information from national office to epo] |
Ref country code: MK Free format text: LAPSE BECAUSE OF FAILURE TO SUBMIT A TRANSLATION OF THE DESCRIPTION OR TO PAY THE FEE WITHIN THE PRESCRIBED TIME-LIMIT Effective date: 20190904 |
|
| P01 | Opt-out of the competence of the unified patent court (upc) registered |
Effective date: 20230526 |
|
| PGFP | Annual fee paid to national office [announced via postgrant information from national office to epo] |
Ref country code: DE Payment date: 20250729 Year of fee payment: 15 |
|
| PGFP | Annual fee paid to national office [announced via postgrant information from national office to epo] |
Ref country code: GB Payment date: 20250728 Year of fee payment: 15 |
|
| PGFP | Annual fee paid to national office [announced via postgrant information from national office to epo] |
Ref country code: FR Payment date: 20250725 Year of fee payment: 15 |