EP2594936A2 - Procédés et appareil pour identifier des motifs isotopiques dans des spectres de masse - Google Patents
Procédés et appareil pour identifier des motifs isotopiques dans des spectres de masse Download PDFInfo
- Publication number
- EP2594936A2 EP2594936A2 EP20120192525 EP12192525A EP2594936A2 EP 2594936 A2 EP2594936 A2 EP 2594936A2 EP 20120192525 EP20120192525 EP 20120192525 EP 12192525 A EP12192525 A EP 12192525A EP 2594936 A2 EP2594936 A2 EP 2594936A2
- Authority
- EP
- European Patent Office
- Prior art keywords
- peaks
- peak
- automatically
- mass
- data
- Prior art date
- Legal status (The legal status is an assumption and is not a legal conclusion. Google has not performed a legal analysis and makes no representation as to the accuracy of the status listed.)
- Withdrawn
Links
- 238000000034 method Methods 0.000 title claims abstract description 154
- 230000003595 spectral effect Effects 0.000 title claims abstract description 51
- 238000004364 calculation method Methods 0.000 claims abstract description 27
- 238000001819 mass spectrum Methods 0.000 claims abstract description 24
- 230000002596 correlated effect Effects 0.000 claims abstract description 18
- 238000004949 mass spectrometry Methods 0.000 claims abstract description 17
- 238000002474 experimental method Methods 0.000 claims abstract description 12
- 238000004587 chromatography analysis Methods 0.000 claims abstract description 8
- 230000009467 reduction Effects 0.000 claims abstract description 5
- 150000002500 ions Chemical class 0.000 claims description 119
- 238000009826 distribution Methods 0.000 claims description 42
- 230000000155 isotopic effect Effects 0.000 claims description 27
- 239000000126 substance Substances 0.000 claims description 19
- 239000000203 mixture Substances 0.000 claims description 18
- 239000012491 analyte Substances 0.000 claims description 16
- 238000010828 elution Methods 0.000 claims description 16
- 230000006870 function Effects 0.000 description 42
- 238000001514 detection method Methods 0.000 description 24
- 238000004458 analytical method Methods 0.000 description 20
- 238000005315 distribution function Methods 0.000 description 16
- 230000008569 process Effects 0.000 description 13
- 230000014759 maintenance of location Effects 0.000 description 12
- 239000000243 solution Substances 0.000 description 12
- 238000004895 liquid chromatography mass spectrometry Methods 0.000 description 11
- 150000001875 compounds Chemical class 0.000 description 9
- 230000000875 corresponding effect Effects 0.000 description 9
- 238000001228 spectrum Methods 0.000 description 7
- 238000004422 calculation algorithm Methods 0.000 description 6
- 230000001419 dependent effect Effects 0.000 description 6
- 230000000717 retained effect Effects 0.000 description 6
- 230000008859 change Effects 0.000 description 5
- 239000012634 fragment Substances 0.000 description 5
- 238000002546 full scan Methods 0.000 description 5
- 238000013459 approach Methods 0.000 description 4
- 239000012530 fluid Substances 0.000 description 4
- 238000013467 fragmentation Methods 0.000 description 4
- 238000006062 fragmentation reaction Methods 0.000 description 4
- 238000002347 injection Methods 0.000 description 4
- 239000007924 injection Substances 0.000 description 4
- 239000002243 precursor Substances 0.000 description 4
- 238000011002 quantification Methods 0.000 description 4
- 230000004044 response Effects 0.000 description 4
- 125000004429 atom Chemical group 0.000 description 3
- 238000006243 chemical reaction Methods 0.000 description 3
- 239000000460 chlorine Substances 0.000 description 3
- 239000000470 constituent Substances 0.000 description 3
- 238000012937 correction Methods 0.000 description 3
- 238000010219 correlation analysis Methods 0.000 description 3
- 238000010586 diagram Methods 0.000 description 3
- 239000007789 gas Substances 0.000 description 3
- 239000007788 liquid Substances 0.000 description 3
- 238000004811 liquid chromatography Methods 0.000 description 3
- 238000012545 processing Methods 0.000 description 3
- 238000003860 storage Methods 0.000 description 3
- 238000012360 testing method Methods 0.000 description 3
- 210000002700 urine Anatomy 0.000 description 3
- IJGRMHOSHXDMSA-UHFFFAOYSA-N Atomic nitrogen Chemical compound N#N IJGRMHOSHXDMSA-UHFFFAOYSA-N 0.000 description 2
- 230000005526 G1 to G0 transition Effects 0.000 description 2
- 210000000941 bile Anatomy 0.000 description 2
- QWCRAEMEVRGPNT-UHFFFAOYSA-N buspirone Chemical compound C1C(=O)N(CCCCN2CCN(CC2)C=2N=CC=CN=2)C(=O)CC21CCCC2 QWCRAEMEVRGPNT-UHFFFAOYSA-N 0.000 description 2
- 229960002495 buspirone Drugs 0.000 description 2
- 229910052801 chlorine Inorganic materials 0.000 description 2
- 125000001309 chloro group Chemical group Cl* 0.000 description 2
- 238000004590 computer program Methods 0.000 description 2
- 230000007423 decrease Effects 0.000 description 2
- 230000003247 decreasing effect Effects 0.000 description 2
- 238000013461 design Methods 0.000 description 2
- 239000003814 drug Substances 0.000 description 2
- 229940079593 drug Drugs 0.000 description 2
- 230000001747 exhibiting effect Effects 0.000 description 2
- 238000009499 grossing Methods 0.000 description 2
- 238000010884 ion-beam technique Methods 0.000 description 2
- 238000012986 modification Methods 0.000 description 2
- 230000004048 modification Effects 0.000 description 2
- 230000010355 oscillation Effects 0.000 description 2
- 238000003909 pattern recognition Methods 0.000 description 2
- 238000004366 reverse phase liquid chromatography Methods 0.000 description 2
- 238000004088 simulation Methods 0.000 description 2
- 238000000528 statistical test Methods 0.000 description 2
- 238000001195 ultra high performance liquid chromatography Methods 0.000 description 2
- OKTJSMMVPCPJKN-UHFFFAOYSA-N Carbon Chemical compound [C] OKTJSMMVPCPJKN-UHFFFAOYSA-N 0.000 description 1
- ZAMOUSCENKQFHK-UHFFFAOYSA-N Chlorine atom Chemical compound [Cl] ZAMOUSCENKQFHK-UHFFFAOYSA-N 0.000 description 1
- 238000007476 Maximum Likelihood Methods 0.000 description 1
- 238000002835 absorbance Methods 0.000 description 1
- 239000000654 additive Substances 0.000 description 1
- 230000000996 additive effect Effects 0.000 description 1
- 230000003139 buffering effect Effects 0.000 description 1
- VNWKTOKETHGBQD-OUBTZVSYSA-N carbane Chemical compound [13CH4] VNWKTOKETHGBQD-OUBTZVSYSA-N 0.000 description 1
- 229910052799 carbon Inorganic materials 0.000 description 1
- 238000012512 characterization method Methods 0.000 description 1
- 238000011208 chromatographic data Methods 0.000 description 1
- 238000013375 chromatographic separation Methods 0.000 description 1
- 230000001427 coherent effect Effects 0.000 description 1
- 239000002131 composite material Substances 0.000 description 1
- 238000010276 construction Methods 0.000 description 1
- 230000001186 cumulative effect Effects 0.000 description 1
- 238000007405 data analysis Methods 0.000 description 1
- 238000013500 data storage Methods 0.000 description 1
- 238000011161 development Methods 0.000 description 1
- 239000006185 dispersion Substances 0.000 description 1
- 230000000694 effects Effects 0.000 description 1
- 230000005684 electric field Effects 0.000 description 1
- 238000002290 gas chromatography-mass spectrometry Methods 0.000 description 1
- 238000004128 high performance liquid chromatography Methods 0.000 description 1
- 238000010237 hybrid technique Methods 0.000 description 1
- 230000006872 improvement Effects 0.000 description 1
- 238000007689 inspection Methods 0.000 description 1
- 230000003993 interaction Effects 0.000 description 1
- 230000002452 interceptive effect Effects 0.000 description 1
- 238000004255 ion exchange chromatography Methods 0.000 description 1
- 238000012804 iterative process Methods 0.000 description 1
- 230000000670 limiting effect Effects 0.000 description 1
- 238000001294 liquid chromatography-tandem mass spectrometry Methods 0.000 description 1
- 239000000463 material Substances 0.000 description 1
- 238000000816 matrix-assisted laser desorption--ionisation Methods 0.000 description 1
- 238000012821 model calculation Methods 0.000 description 1
- 230000005405 multipole Effects 0.000 description 1
- 229910052757 nitrogen Inorganic materials 0.000 description 1
- 238000010606 normalization Methods 0.000 description 1
- 230000003287 optical effect Effects 0.000 description 1
- 238000005457 optimization Methods 0.000 description 1
- 230000010399 physical interaction Effects 0.000 description 1
- 238000007781 pre-processing Methods 0.000 description 1
- 238000002541 precursor ion scan Methods 0.000 description 1
- 230000002829 reductive effect Effects 0.000 description 1
- 238000005549 size reduction Methods 0.000 description 1
- 238000000638 solvent extraction Methods 0.000 description 1
- 238000004808 supercritical fluid chromatography Methods 0.000 description 1
- 230000009897 systematic effect Effects 0.000 description 1
- 230000002123 temporal effect Effects 0.000 description 1
- 230000000007 visual effect Effects 0.000 description 1
Images








Classifications
-
- G—PHYSICS
- G01—MEASURING; TESTING
- G01N—INVESTIGATING OR ANALYSING MATERIALS BY DETERMINING THEIR CHEMICAL OR PHYSICAL PROPERTIES
- G01N30/00—Investigating or analysing materials by separation into components using adsorption, absorption or similar phenomena or using ion-exchange, e.g. chromatography or field flow fractionation
- G01N30/02—Column chromatography
- G01N30/86—Signal analysis
- G01N30/8675—Evaluation, i.e. decoding of the signal into analytical information
-
- G—PHYSICS
- G16—INFORMATION AND COMMUNICATION TECHNOLOGY [ICT] SPECIALLY ADAPTED FOR SPECIFIC APPLICATION FIELDS
- G16C—COMPUTATIONAL CHEMISTRY; CHEMOINFORMATICS; COMPUTATIONAL MATERIALS SCIENCE
- G16C20/00—Chemoinformatics, i.e. ICT specially adapted for the handling of physicochemical or structural data of chemical particles, elements, compounds or mixtures
- G16C20/20—Identification of molecular entities, parts thereof or of chemical compositions
-
- H—ELECTRICITY
- H01—ELECTRIC ELEMENTS
- H01J—ELECTRIC DISCHARGE TUBES OR DISCHARGE LAMPS
- H01J49/00—Particle spectrometers or separator tubes
- H01J49/0027—Methods for using particle spectrometers
- H01J49/0036—Step by step routines describing the handling of the data generated during a measurement
-
- G—PHYSICS
- G01—MEASURING; TESTING
- G01N—INVESTIGATING OR ANALYSING MATERIALS BY DETERMINING THEIR CHEMICAL OR PHYSICAL PROPERTIES
- G01N30/00—Investigating or analysing materials by separation into components using adsorption, absorption or similar phenomena or using ion-exchange, e.g. chromatography or field flow fractionation
- G01N30/02—Column chromatography
- G01N30/62—Detectors specially adapted therefor
- G01N30/72—Mass spectrometers
- G01N30/7233—Mass spectrometers interfaced to liquid or supercritical fluid chromatograph
Definitions
- This invention relates to methods of analyzing data obtained from instrumental analysis techniques used in analytical chemistry and, in particular, to methods of automatically discriminating peaks of a related group of peaks - such as peaks representing an isotopic distribution - from noise, without input from or intervention of a user, in mass spectral data generated in LC/MS/MS analyses.
- Mass spectrometry is an analytical technique to filter, detect, identify and/or measure compounds by the mass-to-charge ratios of ions formed from the compounds.
- the quantity of mass-to-charge ratio is commonly denoted by the symbol "m/z” in which "m” is ionic mass in units of Daltons and "z” is ionic charge in units of elementary charge, e.
- mass-to-charge ratios are appropriately measured in units of "Da/e”.
- Mass spectrometry techniques generally include (1) ionization of compounds and optional fragmentation of the resulting ions so as to form fragment ions; and (2) detection and analysis of the mass-to-charge ratios of the ions and/or fragment ions and calculation of corresponding ionic masses.
- the compound may be ionized and detected by any suitable means.
- a "mass spectrometer” generally includes an ionizer and an ion detector.
- the hybrid technique of liquid chromatography-mass spectrometry is an extremely useful technique for detection, identification and (or) quantification of components of mixtures or of analytes within mixtures.
- This technique generally provides data in the form of a mass chromatogram, in which detected ion intensity (a measure of the number of detected ions) as measured by a mass spectrometer is given as a function of time.
- detected ion intensity a measure of the number of detected ions
- various separated chemical constituents elute from a chromatographic column as a function of time. As these constituents come off the column, they are submitted for mass analysis by a mass spectrometer.
- the mass spectrometer accordingly generates, in real time, detected relative ion abundance data for ions produced from each eluting analyte, in turn.
- data is inherently three-dimensional, comprising the two independent variables of time and mass (more specifically, a mass-related variable, such as mass-to-charge ratio) and a measured dependent variable relating to ion abundance.
- liquid chromatography means a process of selective retention of one or more components of a fluid solution as the fluid uniformly percolates through a column of a finely divided substance, or through capillary passageways. The retention results from the distribution of the components of the mixture between one or more stationary phases and the bulk fluid, (i.e., mobile phase), as this fluid moves relative to the stationary phase(s).
- Liquid chromatography includes, without limitation, reverse phase liquid chromatography (RPLC), high performance liquid chromatography (HPLC), ultra high performance liquid chromatography (UHPLC), supercritical fluid chromatography (SFC) and ion chromatography.
- High-resolution mass spectrometer instruments are often required in order to correctly deduce an elemental composition for an ion or to otherwise identify an ion, especially for high-mass ions such as those observed by ionization of biochemical compounds as they elute from a chromatographic column.
- Conventional triple-quadrupole instruments generally provide unit mass resolution. However, resolution to 4-5 decimal places is often required and may be obtained utilizing high performance time-of-flight (TOF) or electrostatic trap mass spectrometers (such as Orbitrap® mass spectrometers). At such resolutions, multiplets resulting from isotope distributions are either partially or fully resolved and often must be accounted for in order to properly assign peaks to ionic species or in the determination of elemental compositions of ionic species.
- TOF time-of-flight
- electrostatic trap mass spectrometers such as Orbitrap® mass spectrometers
- the probability of occurrence of a molecule having a particular isotopic composition considered over all of its elements may be calculated as a joint probability by taking a product in which the individual factors are determined as in Eq. 1.
- the results of such model calculations are simulated mass spectra in which all possible peaks of an isotopic distribution are represented at their correct mass values and correct relative intensities.
- the inventor of the present invention has realized that the technique of Parameterless Peak Detection (PPD) is useful to identify correlations between peaks - and, in particular, isotopic peaks - related to elution of a single ion because all such peaks will exhibit the same chromatographic response and have similar lineshapes in the time domain.
- Embodiments in accordance with the present teachings may thus address the above-noted needs in the art by providing methods employing a stepwise approach.
- peaks are automatically detected by the methods of parameterless peak detection (PPD) and located within each of a plurality of extracted ion chromatograms (XICs) derived from time-based mass spectrometry data obtained during LC/MS analysis.
- this step provides a significant data size reduction.
- the result or output of this step is either a filtered data file written to computer-readable media, or a list of components found in the original data, or both.
- the automatic peak detection and location techniques do not make a priori assumptions about the particular line shape of the chromatographic or spectroscopic peak(s) and may fit any individual peak to either a Gaussian, exponentially modified Gaussian, Gamma distribution or to another form or to a composite form comprising more than one of the above peak forms.
- the remaining ions are grouped by calculating the cross correlations of relevant parameters pairwise between the various remaining peaks.
- a vector is constructed for each peak, and a correlation coefficient is computed between each vector and every other vector.
- each vector may consist of several variables including the peak width, and 9 intensity values obtained from the parametric determination of peak shape. The time points of the intensity values cover the region of the XIC where PPD has determined that a peak exists.
- the correlation analyses are performed simply on mass spectrometric "full scans" in which broad ranges of masses are monitored simultaneously. This means that this new method of isotope multiplet detection is applicable to any mass spectrometer with chromatographic input and capable of full-scan MS recording.
- a method for automatically identifying groups of related peaks generated in a chromatography - mass spectrometry experiment comprises automatically choosing a time window defining a region of interest for mass spectral data generated by the experiment; automatically constructing a plurality of extracted ion chromatograms (XICs) for mass spectral peaks observed within the region of interest; automatically detecting and characterizing chromatogram peaks within each XIC and automatically generating synthetic analytical fit peaks thereof; automatically discarding a subset of the synthetic analytical peaks which do not satisfy noise reduction rules; automatically performing a respective cross-correlation score calculation between each pair of synthetic analytical fit peaks; and automatically identifying groups of correlated peaks in at least one mass spectral scan within the region of interest.
- XICs extracted ion chromatograms
- the step of automatically identifying groups of correlated peaks in at least one mass spectrum within the region of interest may include automatically identifying at least one group of peaks that corresponds to an isotopic distribution.
- An automatic identification of a chemical composition of an ionic species may be based upon the automatic identification of the at least one group of peaks that corresponds to the isotopic distribution.
- the step of automatically identifying groups of correlated peaks in at least one mass spectrum within the region of interest may include automatically identifying a first group of peaks that corresponds to a first isotopic distribution and a second group of peaks that corresponds to a second isotopic distribution, wherein the first and second groups of peaks are associated with elution of a first and a second analyte, respectively, wherein the first and second analytes co-elute.
- an apparatus comprising: a chromatograph for providing a stream of at least partially separated chemical substances; a mass spectrometer fluidically coupled to the chromatograph for generating and analyzing a plurality of types of ions, each type of ion comprising a different mass-to-charge ( m / z ) ratio resulting from ionization of each of the chemical substances; a detector for detecting abundance data for each type of ion; and a programmable electronic processor electrically coupled to the mass spectrometer, the programmable processor comprising instructions operable to cause the programmable processor to: receive the abundance data for each of the types of ions; automatically detect and characterize chromatogram peaks as a function of time for each of a plurality of m / z ratio ranges of the abundance data; automatically generate synthetic analytical fit peaks to the detected chromatogram peaks; automatically discard a subset of the synthetic analytical fit peaks which do not satisfy noise reduction rules; automatically perform a respective cross
- the present invention provides methods and apparatus for correlating ions observed in liquid chromatography / mass spectrometry data.
- the automated methods and apparatus described herein do not require any user input or intervention.
- the following description is presented to enable any person skilled in the art to make and use the invention, and is provided in the context of a particular application and its requirements. Various modifications to the described embodiments will be readily apparent to those skilled in the art and the generic principles herein may be applied to other embodiments. Thus, the present invention is not intended to be limited to the embodiments and examples shown but is to be accorded the widest possible scope in accordance with the features and principles shown and described. The particular features and advantages of the invention will become more apparent with reference to the appended FIGS. 1-20 , taken in conjunction with the following description.
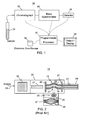
- FIG. 1 is a schematic diagram of a system for generating and automatically analyzing chromatography / mass spectrometry spectra in accordance with the present teachings.
- a chromatograph 33 such as a liquid chromatograph, high-performance liquid chromatograph or ultra high performance liquid chromatograph receives a sample 32 of an analyte mixture and at least partially separates the analyte mixture into individual chemical components, in accordance with well-known chromatographic principles. As a result, the at least partially separated chemical components are transferred to a mass spectrometer 34 at different respective times for mass analysis. As each chemical component is received by the mass spectrometer, it is ionized by an ionization source of the mass spectrometer.
- the ionization source may produce a plurality of ions comprising differing charges or masses from each chemical component.
- a plurality of ions of differing mass-to-charge ratios may be produced for each chemical component, each such component eluting from the chromatograph at its own characteristic time.
- These various ions are analyzed and detected by the mass spectrometer together with its detector 35 and, as a result, appropriately identified according to their various mass-to-charge ratios.
- a programmable processor 37 is electronically coupled to the detector of the mass spectrometer and receives the data produced by the detector during chromatographic / mass spectrometric analysis of the sample(s).
- the programmable processor may comprise a separate stand-alone computer or may simply comprise a circuit board or any other programmable logic device operated by either firmware or software.
- the programmable processor may also be electronically coupled to the chromatograph and/or the mass spectrometer in order to transmit electronic control signals to one or the other of these instruments so as to control their operation. The nature of such control signals may possibly be determined in response to the data transmitted from the detector to the programmable processor or to the analysis of that data.
- the programmable processor may also be electronically coupled to a display or other output 38, for direct output of data or data analysis results to a user, or to electronic data storage 36.
- the programmable processor shown in FIG. 1 is generally operable to: receive a chromatography / mass spectrometry spectrum from the chromatography / mass spectrometry apparatus; generate and evaluate a plurality of extracted ion chromatograms (XICs) from the spectral data; automatically subtract a baseline from each such XIC so as to generate a plurality of baseline-corrected XICs; automatically detect and characterize all spectral peaks occurring above a noise level in each baseline-corrected XIC; perform a cross-correlation calculation between each pair of detected peaks; and report or record information relating to the peaks or to the cross-correlations between the peaks.
- XICs extracted ion chromatograms
- FIG. 2 An example of a mass spectrometer system 15 comprising an electrostatic trap mass analyzer such as an Orbitrap® mass analyzer 25 is shown in FIG. 2 .
- Analyte material 29 is provided to a pulsed or continuous ion source 16 so as to generate ions.
- Ion source 16 could be a MALDI source, an electrospray source or any other type of ion source.
- multiple ion sources may be used.
- the illustrated system comprises a curved quadrupole trap 18 (also known as a "C-trap") with a slot 31 in the inner electrode 19. Ions are transferred from the ion source 16 to the curved quadrupole trap 18 by ion optics assembly 17 (e.g. an RF multipole).
- ion optics assembly 17 e.g. an RF multipole
- ions Prior to ion injection, ions may be squeezed along the axis of the curved quadrupole trap 18 by raising voltages on end electrodes 20 and 21.
- the RF voltage on the curved quadrupole trap 18 may be switched off, as is well known.
- Pulses are applied to electrodes 19 and 22 and to an electrode of curved ion optics 28 so that the transverse electric field accelerates ions into the curved ion optics 28.
- the converging ion beam that results enters the Orbitrap® mass analyzer 25 through injection slot 26.
- the ion beam is squeezed towards the axis by an increasing voltage on a central electrode 27.
- ions Due to temporal and spatial focusing at the injection slot 26, ions start coherent axial oscillations. These oscillations produce image currents that are amplified and processed. Further details of the electrostatic trap apparatus 25 are described in International Application Publication WO 02/078046 , US Pat. No. 5,886,346 , US Pat. No. 6,872,938 .
- the ion optics assembly 17, curved quadrupole trap 18 and associated ion optics are enclosed in a housing 30 which is evacuated in operation of the system.
- the system 15 may further comprise a reaction cell 23, which may comprise a collision cell (such as an octopole) that is enclosed in a gas tight shroud 24 and that is aligned to the curved quadrupole trap 141.
- the reaction cell 23, when used as a collision cell, may be supplied with an RF voltage of which the DC offset can be varied.
- a collision gas line (not shown) may be attached and the cell is pressurized with nitrogen (or any) gas.
- FIG. 3 is a perspective view of a three-dimensional graph of hypothetical LC/MS data.
- the variables time and mass (or mass-to-charge ratio, m / z ) are depicted on the "floor" of the perspective diagram and the variable representing ion abundance (for instance, detected ion current) is plotted in the "vertical" dimension of the graph.
- ion abundance is represented as a function of the other two variables, this function comprising a variably shaped surface above the "floor”.
- Each set of peaks dispersed and in line parallel to the m / z axis represents the various ions produced by the ionization of a single eluting analyte (or, possibly, of fortuitously co-eluting analytes) at a restricted range of time.
- each analyte of a mixture will elute from the column (thereby to be mass analyzed) within a particular diagnostic time range. Consequently, either a single peak or a line of mass-separated peaks, each such peak representing a particular ion produced by the eluting analyte, is expected at each elution time (or retention time) range.
- data obtained by a chromatography-mass spectrometry experiment may comprise a very large volume of data.
- a mass spectrometer may generate a complete "scan" over an entire mass range of interest in a matter of tens to hundreds of milliseconds.
- the term "scan” is used to refer generally to a mass spectrum, regardless of whether the mass spectrum is obtained by a quadrupole mass spectrometer, a time-of-flight mass spectrometer, a Fourier-transform ion-cyclotron mass spectrometer, an electrostatic trap mass spectrometer (for example, an Orbitrap® mass spectrometer as is sold by Thermo Fisher Scientific corporation of Waltham, Massachusetts USA) or any other type of mass spectrometer.
- an Orbitrap® mass spectrometer as is sold by Thermo Fisher Scientific corporation of Waltham, Massachusetts USA
- the various analytes may elute over a time range of several minutes to several tens of minutes, depending on the complexity of the mixture under analysis and the range of retention times represented.
- the data depicted in FIG. 3 may comprise an entire stored data file representing results of a prior experiment.
- the data represent a portion of a larger data set in the process of being acquired by an LC/MS instrument.
- the data depicted in FIG. 3 may comprise recently collected data held in temporary computer readable memory, such as a memory buffer, and corresponding to an analysis time window, ⁇ t , upon which calculations are being formed while, at the same time, newer data is being collected.
- Older data which has already been analyzed by methods of the present teachings and which has possibly been stored to a permanent computer readable medium, is represented by region 1036.
- methods in accordance with the present teachings may be carried out in near-real-time on an apparatus used to collect the data or using a processor (such as a computer processor) closely linked to the apparatus used to collect the data.
- mass spectra also referred to herein as "scans"
- scans each mass spectrum (scan) corresponding to a particular respective time point.
- Such mass spectra may be envisioned as residing within planes parallel to the plane indicated by the trace lines 1010 in FIG. 3 or parallel to the lines rt1 , rt2 and rt3 in FIG. 15 (discussed further below).
- the information in the data portion may be logically re-organized as extracted ion chromatograms (or, at least portions thereof).
- Each such XIC may be envisioned as a cross section through the data in a plane parallel to the plane indicated by trace lines 1020 in FIG. 3 or parallel to the lines m1-m10 in FIG. 15 . Portions of hypothetical extracted ion chromatograms are shown as dotted lines in FIG. 15 . Each XIC represents the elution profile, in time, of ions of a particular mass-to-charge range. The XIC representation of the data is useful for understanding the methods of the present teachings.
- FIGS. 15 Several schematic hypothetical XIC profiles are shown using dotted lines in FIGS. 15 . Also, portions of mass scans (i.e., mass spectra) are indicated by solid lines at times indicated by rt1, rt2 and rt3. These profiles and scans include several example peaks.
- peak p1 at coordinates ( rt 2, m 1) peak p2 at coordinates ( rt 1, m 2), peak p3 at coordinates ( rt 1, m 3), peak p4 at coordinates ( rt 1, m 4), peak p5 at coordinates ( rt 1, m 5), peak p6 at coordinates ( rt 1, m 6), peak p7 at coordinates ( rt 3, m 7), peak p8 at coordinates ( rt 3, m 8), peak p9 at coordinates ( rt 3, m 9) and peak p10 at coordinates ( rt 3, m 10).
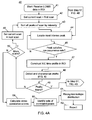
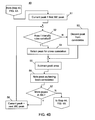
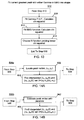
- FIGS. 4A-4B present a flowchart of a method 40 for generating automated correlations between the various mass spectral peaks of a related set of peaks in accordance with the present teachings.
- step 41 mass spectral data is generated by and received from a chromatograph-mass spectrometer apparatus.
- the LC/MS data comprises ion abundance (or relative abundance) information as a function of time and m / z.
- the calculations of method 40 are performed on a chosen time window of the data set on scans of a certain type. Scans are restricted to a certain scan type since different types of scans may be interleaved with one another. For instance a scan of precursor ions may be immediately followed by a scan of product ions, wherein the product ions are generated by fragmentation or other reaction of one or several of the precursor ions. The scan of fragment ions may then be followed by another scan of precursor ions and this sequence may be repeated such that precursor scans and product scans alternate with one another.
- the chosen time-window corresponds to a current region of interest (ROI) of recently collected data, such as region 1032 of FIG. 3 .
- ROI region of interest
- this window is 1.4 minutes wide, but other window widths will work equally well as long as the window width is greater than the expected peak width.
- Good results have been obtained by the inventor using window widths of 0.5 minutes and 0.2 minutes.
- These time windows represent a small portion of a typical chromatographic experiment which may run for several tens of minutes to on the order of an hour. For data dependent instrument control, a much smaller time window would probably be used.
- Such data dependent instrument control functions may be performed in automated fashion, wherein the results obtained by the methods herein are used to automatically control operation of the instrument at a subsequent time during the same experiment from which the data were collected.
- a voltage may be automatically adjusted in an ion source or a collision energy (that is applied to ions in order to cause fragmentation) may be adjusted with regard to collision cell operation.
- Such automatic instrument adjustments may be performed, for instance, so as to optimize the type or number of ions or ion fragments produced by fragmentation of the identified ion.
- any algorithm that systematically examines the data of the region of interest in the time window, searching for peaks to be tested by subsequent cross-correlation calculation may be employed.
- an algorithm may march through the data, scan-by-scan.
- the scan to be examined (the current scan) is set to be the initial scan of a certain type (for instance, full-MS scan type, precursor ion scan type, etc.) within the ROI.
- a certain type for instance, full-MS scan type, precursor ion scan type, etc.
- the peaks of the current scan are sorted by intensity and the ions are examined one by one, starting with the most intense (step 44).
- a threshold may be applied and only ions with intensities above threshold examined.
- step 59 (described in greater detail later in this document) is performed when all peaks within the ROI have been identified.
- Step 45 of this example the occurrence of a feature - a candidate ion-related peak - in the spectrum is noted, and its history or time-profile is compared to a rule for ions to be considered as forming a peak.
- a preferred rule that is used is that the spectral feature must occur in three successive scans (scans of the same type), but any rule based on ion appearance and scan number may be used. For example, a rule that the ion must appear in 3 of 5 successive scans of the same type might alternatively be chosen. (Ions are considered identical if they agree within the mass tolerance, and as an ion history is accumulated, any new occurrence is compared to the average value of the previous instances, not simply the previous instance.)
- step 45 the method returns to step 44 to examine the next most intense peak (corresponding to another ion) in the current scan. If the ion occurrence rule (as determined in step 45) is satisfied, then an extracted ion chromatogram corresponding to the m / z range of the ion peak under consideration is constructed in step 47.
- the terms "mass” and "mass-to-charge” ratio actually represent a small finite range of mass-to-charge ratios. The width or "window" of the mass-to-charge range is the stated precision of the mass spectrometer instrument.
- PPD Parameterless Peak Detection
- step 49 the decision step 49 as to whether any peaks occur in the XIC may include a statistical test wherein an intensity of candidate peaks are compared to an average value of a running list of the intensities of recently found peaks for ions of different mass-to-charge ratios. If peaks are found to occur in the XIC, then the method continues to step 51 ( FIG.
- step 52 in which the first of possibly several peaks in the XIC is set for initial consideration.
- step 52 for each peak found by PPD, additional rules of large relative area and high relative intensity (described in further detail in the next paragraph) are applied. Peaks that fail these tests are discarded (step 53), whereas those that pass are accepted and retained (step 54) for further processing by cross-correlation score calculations (such correlation scores are calculated in step 59). Regardless of whether or not a peak is accepted, after each peak is considered, the peak area of the peak is subtracted (step 55) from the total area used in the relative area criterion in subsequent iterations of step 52. Also (step 56) the peak is added to a list of peaks within the ROI that have been examined, to prevent possible duplicate consideration of a single peak.
- step 52 the area, A j , of the peak currently under consideration (the j th peak) is noted. Also, the total area ( ⁇ A ) under the curve of the fitted chromatogram and the average peak height ( I ave ) of any remaining peaks in the fitted chromatogram are calculated. The area ⁇ A is the area of the data remaining after any previous peaks have been detected and removed.
- the step 52 compares the area, A j , of the most recently found peak to the total area ( ⁇ A ) where the summation may be taken over the entire XIC, over a local area in the region of the found peak or according to a criterion based on both global and local areas.
- this step compares the peak maximum intensity, I j , of the most recently found peak is compared to I ave , where the average may be calculated over the entire XIC, over a local region in the vicinity of the found peak or according to a criterion based on both global and local regions. If it is found either that ( A j / ⁇ A ) ⁇ ⁇ or that ( I j / I ave ) ⁇ ⁇ , where ⁇ and ⁇ are pre-determined constants, then the execution of the method 40 branches to step 53 in which the peak is removed from a list of peaks to be considered in - and is thus eliminated from consideration in - the subsequent cross-correlation score calculation step.
- each actual peak of interest should comprise a significant peak area, relative to the total peak area and should comprise a vertex intensity that is significantly greater than an average intensity.
- the average intensity calculated according to a criterion based on both global and local values, as noted above.
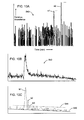
- FIGS. 10A-10C schematically illustrate this concept. For instance, after peak discrimination in step 52 ( FIG. 4B ), fitted peaks corresponding to data peaks a1 and a2 in of the XIC 540 in FIG.
- 10A may, in some embodiments, not be retained in the list of peaks to be tested by cross correlation as a result of their relatively smaller peak areas in relation to the total area above the baseline.
- the retention of peaks may be determined based on statistical considerations - such as correlation statistics between different data files - or possibly some other criteria related to relative peak areas.
- Numerous fitted peaks in FIG. 10C which represent a fit to the XIC 542 of FIG. 10B , are eliminated by a different criterion. For example, all fitted peaks in FIG. 10C that do not extend above line 544 may be eliminated because their peak heights do not meet a peak height criterion, even though the areas of several of them are not insignificant.
- line 546 is a baseline and line 544 is a line offset from the baseline such that the vertical distance between the two lines represents a minimum peak height for acceptance.
- peaks b1, b2 and b3 are retained.
- the retention of peaks may be determined based on statistical considerations or some other criteria related to relative peak heights.
- step 57 determines that more peaks exist in the XIC under consideration, then the method branches to step 58 in which the next peak is set for consideration and then back to step 52.
- the decision step 57 as to whether another XIC peak exists may include a statistical test wherein an intensity of a candidate peak is compared to an average value of a running list of the intensities of recently found peaks in the XIC or found for different mass-to-charge ratios. If it is determined that no additional peaks remain the XIC, then execution goes back to step 44 ( FIG. 4A ) so as to continue examining additional peaks (if any) in the current scan.
- Step 59 the cross correlation for each retained XIC peak is calculated with respect to every other mass that formed an XIC peak in the region of interest. The details of the calculations are presented in a subsequent section herein.
- step 60 sets or clusters of correlated peaks within the region of interest are identified, based on the cross-correlation scores calculated in step 59.
- peaks that are correlated are necessarily related to one another as components of an isotopic distribution of peaks
- certain clusters of mass spectral peaks within a set of correlated peaks may nonetheless be either positively identified as or be noted as candidates for components of an isotopic distribution (step 61).
- An isotopic distribution relating to a particular element may, in many cases, be automatically recognized by simple pattern recognition that considers both the spacing and relative intensities of peaks of a group or cluster of peaks. Such patterns may be coded into the recognition routine for automatic recognition.
- the results are reported to a user (or stored for later use).
- the results may include information regarding detected peaks of an identified isotopic distribution of peaks or of a candidate isotopic distribution.
- the candidate distributions reported in this fashion may be further analyzed by an expert user.
- the reporting step 62 may possibly include the reporting of other information.
- the reporting may be performed in numerous alternative ways-for instance via a visual display terminal, a paper printout, or, indirectly, by outputting the parameter information to a database on a storage medium for later retrieval by a user.
- the reporting step may include reporting either textual or graphical information, or both.
- Reported peak parameters may be either those parameters calculated during the peak detection step or quantities calculated from those parameters and may include, for each of one or more peaks, location of peak centroid, location of point of maximum intensity, peak half-width, peak skew, peak maximum intensity, area under the peak, a list of correlated peaks which may match an isotopic distribution pattern, etc. Other parameters related to signal to noise ratio, statistical confidence in the results, goodness of fit, etc. may also be reported in step 62.
- Such information may include chemical identification of one or more analytes (e.g., ions, molecules or chemical compounds), purity of analytes, identification of contaminating compounds, ions or molecules or, even, a simple notification that an analyte is (or is not) present in a sample at detectable levels.
- analytes e.g., ions, molecules or chemical compounds
- the method 40 diagrammed in FIGS. 4A-4B provides a high-level overview of generating automated correlations between ion mass peaks.
- the step 48 includes detecting and locating peaks in various extracted-ion-chromatogram (XIC) representations of the mass spectral data and may itself be regarded as a particular method, which is shown in flowchart form in FIG. 5 . Since each XIC includes only the single independent variable of time (e.g., Retention Time), this section is thus directed to detection of peaks in data that includes only one independent variable.
- XIC extracted-ion-chromatogram
- the various sub-procedures or sub-methods in the method 48 may be grouped into three basic stages of data processing, each stage possibly comprising several steps as illustrated in FIG. 5 .
- the first step, step 120, of the method 48 is a preprocessing stage in which baseline features may be removed from the received chromatogram and in which a level of random "noise" of the chromatogram may be estimated, this step being described in greater detail in subsequent FIG. 6 .
- the next step 150 which is described in greater detail in subsequent FIG. 9 , is the generation of an initial estimate of the parameters of synthetic peaks, each of which models a positive spectral feature of the baseline corrected chromatogram.
- the subsequent optional step 170 includes refinement of fit parameters of synthetic peaks determined in the preceding step 150 in order to improve the fit of the peaks, taken as a set, to the baseline corrected chromatogram. The need for such refinement may depend on the degree of complexity or accuracy employed in the execution of modeling in step 150.
- model and its derivatives, as used herein, may refer to either statistically finding a best fit synthetic peak or, alternatively, to calculating a synthetic peak that exactly passes through a limited number of given points.
- fit and its derivatives refer to statistical fitting so as to find a best-fit (possibly within certain restrictions) synthetic peak such as is commonly done by least squares analysis. Note that the method of least squares (minimizing the chi-squared metric) is the maximum likelihood solution for additive white Gaussian noise. More detailed discussion of individual method steps and alternative methods is provided in the following discussion and associated figures.
- a feature of a first stage of the method 48 ( FIG. 5 ) takes note of the concept that (disregarding, for the moment, any chemical or electronic noise) a spectroscopic signal generally consists of signal plus baseline. If one can subtract the baseline correctly, everything that remains must be signal, and should be fitted to some sort of data peak.
- the first step 120 comprises determining a correct baseline and removing it from the signal.
- Sub-steps may include applying a polynomial curve as the baseline curve, and measuring the residual (the difference between the chromatographic data and the computed baseline) as a function of polynomial order. For instance, FIG.
- FIG. 6 illustrates a flowchart of a method 120 for automatically removing baseline features from spectral data in accordance with some embodiments of the invention.
- the method 120 illustrated in FIG. 6 repeatedly fits a polynomial function to the baseline, subtracts the best fit polynomial function from the chromatogram so as to provide a current baseline-corrected chromatogram, evaluates the quality of the fit, as measured by a sum of squared residuals (SSR), and proceeds until SSR changes, from iteration to iteration, by less than some pre-defined percentage of its original value for a pre-defined number of iterations.
- SSR sum of squared residuals
- FIG. 7 is an exemplary graph 300 of the variation of the calculated area underneath a baseline-corrected spectral curve as a function of increasing order of the polynomial used in fitting the baseline.
- FIG. 7 shows that the area initially decreases rapidly as the order of the best fit polynomial increases. This function will go from some positive value at order zero, to a value of zero at some high polynomial order. However, as may be observed from FIG. 7 , after most of the baseline curvature has been fit, the area function attains a plateau region 302 for which the change in the function between polynomial orders is some relatively small amount (for instance 5% of its initial value). At this point, the polynomial-fitting portion of the baseline determination routine may be terminated.
- methods according to the present teachings may repeatedly compute the sum of squared residuals (SSR) for sequential values of polynomial order, each time computing the difference of the SSR ( ⁇ SSR) determined between consecutive polynomial orders. This process is continued until a region is found in which the change ( ⁇ SSR) is less than the pre-defined percentage (for instance, 5%) of a certain reference value determined from the chromatogram for a certain number c (for instance, four) of sequential iterations.
- the reference value may comprise, for instance, the maximum intensity of the original raw chromatogram or extracted ion chromatogram.
- the reference value may comprise the sum of squared values (SSV 0 ) of the chromatogram or some other quantity calculated from the spectral values.
- the first step 122 comprises a loop initialization step of setting the order, n , of the baseline fitting polynomial to an initial value of zero and determining a reference value to be used, in a later step 132, for determining when the fitting polynomial provides an adequate fit to the baseline.
- the reference value may simply be the maximum intensity of the extracted ion chromatogram.
- the reference value may be some other measure determined from the chromatogram, such as the sum of the squared values (SSV) of the chromatogram.
- step 124 is the first step in a loop.
- the step 124 comprises fitting a polynomial of the current order (that is, determining the best fit polynomial of the current order) to the chromatogram by the well-known technique of minimization of a sum of squared residuals (SSR).
- SSR as a function of n , SSR( n ) is stored at each iteration for comparison with the results of other iterations.
- step 124 the method 120 proceeds to a decision step 126 in which, if the current polynomial order n is greater than zero, then execution of the method is directed to step 128 in order to calculate and store the difference of SSR, ⁇ SSR( n ), relative to its value in the iteration just prior.
- ⁇ SSR( n ) SSR( n )-SSR( n -1).
- the value of ⁇ SSR( n ) may be taken a measure of the improvement in baseline fit as the order of the baseline fitting polynomial is incremented to n .
- the number of completed iterations, integer n is compared to c in step 130. If n ⁇ c , then the method branches to step 132, in which the last c values of ⁇ SSR( n ) are compared to the reference value.
- step 132 is bypassed, with execution being directed to step 134, in which the integer n is incremented by one.
- step 132 The sequence of steps from step 124 up to step 132 (going through step 128, as appropriate) is repeated until it is determined, in step 132, that the there have been c consecutive iterations in which the SSR value has changed by less than t % of the reference value.
- step 136 the method branches to step 136, in which the final polynomial order is set and a polynomial of such order is subtracted from the extracted ion chromatogram to yield a preliminary baseline-corrected chromatogram.
- the polynomial baseline correction is referred to as "preliminary" since edge effects may cause the polynomial baseline fit to be inadequate at the ends of the data, even though the central region of the data may be well fit.
- FIG. 8 shows an example of such a preliminary baseline corrected chromatogram 400.
- the residual baseline curvature within the end regions (for instance, the leftmost and rightmost 20% of the chromatogram) of the chromatogram 400 are well fit by a sum of exponential functions (one for each end region), the sum of which is shown in FIG. 8 as curve 402.
- Either a normal or an inverted (negated) exponential function may be employed, depending on whether the data deviates from zero in the positive or negative direction. This correction may be attempted at one or both ends of the chromatogram.
- step 138 which comprises least squares fitting of the end region baselines to exponential functions
- step 140 which comprises subtraction of these functions from the preliminary baseline-corrected chromatogram to yield the final baseline corrected chromatogram.
- the pre-defined value, s may be chosen so as to limit the number of false positive peaks. For instance, if the RMS level of Rayleigh-distributed noise is sigma, then a peak detection threshold, s , of 3 sigma leads to a false detection rate of about 1%.
- the method 150 is an iterative process comprising initialization steps 502 and 506 and loop steps 508-530 (including loop exit decision step 526) and termination step 527.
- a new respective peak is located and modeled during each iteration of the loop defined by the sequence of steps 508-530.
- the first step 502 of method 150 comprises locating the most intense peak in the final baseline-corrected chromatogram (of an extracted ion chromatogram) and setting a program variable, current greatest peak, to the peak so located. It is to be kept in mind that, as used in this discussion, the acts of locating a peak or chromatogram, setting or defining a peak or chromatogram, performing algebraic operations on a peak or chromatogram, etc. implicitly involve either point-wise operations on sets of data points or involve operations on functional representations of sets of data points.
- the operation of locating the most intense peak in step 502 involves locating all points in the vicinity of the most intense point that are above a presumed noise level, under the proviso that the total number of points defining a peak must be greater than or equal to four.
- the operation of "setting" a program variable, current greatest peak comprises storing the data of the most intense peak as an array of data points.
- the method 150 proceeds to second initialization step 506 in which another program variable, "difference chromatogram" is set to be equal to the final baseline-corrected chromatogram (see step 140 of method 120, FIG. 6 ).
- the difference chromatogram is a program variable that is updated during each iteration of the loop steps in method 150 so as to keep track of the chromatogram resulting from subtraction of all prior-fitted peaks from the final baseline-corrected chromatogram.
- the difference chromatogram is used to determine when the loop is exited under the assumption that, once all peaks have been located and modeled, the difference chromatogram will consist only of "noise".
- the method 150 enters a loop at step 508, in which initial estimates are made of the coordinates of the peak maximum point and of the left and right half-height points for the current greatest peak and in which peak skew, S is calculated.
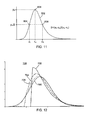
- the method of estimating these co-ordinates is schematically illustrated in FIG. 11 and is discussed in greater detail later with respect to FIGS. 14A-14B .
- Letting curve 602 of FIG. 11 represent the current greatest peak, then the co-ordinates of the peak maximum point 606, left half-height point 606 and right half-height point 608 are, respectively, ( x m , y m ), ( x L , y m /2) and ( x R , y m /2).
- the peak skew, S may be used to determine a particular form (or shape) of synthetic curve (in particular, a distribution function) that will be subsequently used to model the current greatest peak.
- the method 150 branches to step 515 in which the current greatest peak is modeled as a sum of two or more Gaussian distribution functions (in other words, two Gaussian lines).
- step 510 if S ⁇ (1+ ⁇ ), then the method 150 branches to step 511 in which a (single) Gaussian distribution function is used as the model peak form with regard to the current greatest peak.
- the method 150 branches to step 512, in which either a gamma distribution function or an exponentially modified Gaussian (EMG) or some other form of distribution function is used as the model peak form.
- EMG exponentially modified Gaussian
- the current greatest peak could be modeled as a sum of two or more Gaussian distribution functions in step 512.
- a non-linear optimization method such as the Marquardt-Levenberg Algorithm (MLA) or, alternatively, the Newton-Raphson algorithm may be used to determine the best fit using any particular line shape.
- step 511 the synthetic peak resulting from the modeling of the current greatest peak is removed from the chromatogram data (that is, subtracted from the current version of the "difference chromatogram") so as to yield a "trial difference chromatogram" in step 516. Additional details of the gamma and EMG distribution functions and a method of choosing between them are discussed in greater detail, partially with reference to FIG. 13 , later in this document.
- step 518 an optional adjustment step is provided as step 518 in which the synthetic peak parameters are adjusted so as to minimize or eliminate such artifacts.
- step 518 the solution space may be explored for other fitted peaks that have comparable squared differences but result in residual positive data.
- a solution of this type is selected over a solution that gives negative residual data.
- the solution space may be incrementally walked so as to systematically adjust and constrain the width of the synthetic peak at each of a set of values between 50% and 150% of the width determined in the original unconstrained least squares fit. After each such incremental change in width, the width is constrained at the new value and a new least squared fit is executed under the width constraint.
- the positive residual (the average difference between the current difference chromatogram and the synthetic peak function) and chi-squared are calculated and temporarily stored during or after each such constrained fit.
- step 520 information about the most recently adjusted synthetic peak, such as parameters related to peak form, center, width, shape, skew, height and/or area are stored.
- step 523 the root-of-the-mean squared values (root-mean-square or RMS) of the difference chromatogram is calculated.
- the ratio of this RMS value to the intensity of the most recently synthesized peak may be taken as a measure of the signal-to-noise (SNR) ratio of any possibly remaining peaks.
- SNR signal-to-noise
- Step 526 is entered from step 523.
- step 526 as each tentative peak is found, its maximum intensity, I , is compared to the current RMS value, and if I ⁇ (RMS x ⁇ ) where ⁇ is a certain pre-defined noise threshold value, greater than or equal to unity, then further peak detection is terminated.
- the loop termination decision step 526 utilizes such a comparison to determine if any peaks of significant intensity remain distinguishable above the system noise. If there are no remaining significant peaks present in the difference chromatogram, then the method 150 branches to the final termination step 527.
- the method 150 branches to step 528 in which the most intense peak in the current difference chromatogram is located and then to step 530 in which the program variable, current greatest peak, is set to the most intense peak located in step 528. The method then loops back to step 508, as indicated in FIG. 9 .
- spectral peak fitting routines generally model spectral features using either a Gaussian or Lorentzian forms (commonly referred to as peak shapes or line shapes) and tend to either use one preferred line shape throughout the fitting procedure or to query a user as to which line shape to use.
- peak shapes any arbitrary peak shape can be modeled with a sum of Gaussians (perhaps requiring some Gaussians with negative intensities), the inventors have observed that commonly occurring natural peak shapes (especially in chromatographic spectral data) include Gaussians or even Gamma-distribution-like functions with tailing or leading edges.
- methods in accordance with the present teachings may employ a library of peak shapes containing at least four curves (and possibly others) to model observed peaks: a Gaussian for peaks that are nearly symmetric; a sum of two Gaussians for peaks that have a leading edge (negative skewness); and either an exponentially modified Gaussian or a Gamma distribution function for peaks that have a tailing edge (positive skewness).
- x is the variable of spectral dispersion (generally the independent variable or abscissa of an experiment or spectral plot) such as wavelength, frequency, or time and I is the spectral ordinate or measured or dependent variable, possibly dimensionless, such as intensity, counts, absorbance, detector current, voltage, etc.
- a normalized Gaussian distribution (having a cumulative area of unity and only two parameters-mean and variance) would model, for instance, the probability density of the elution time of a single molecule.
- the scale factor A may be taken as the number of analyte molecules contributing to a peak multiplied by a response factor.
- step 511 in the method 150 utilizes a Gaussian line shape when the estimated peak skew is in the vicinity of unity, that is when (1- ⁇ ) ⁇ S ⁇ (1+ ⁇ ) for some positive quantity ⁇ .
- the quantity ⁇ is taken as 0.05, but it could be any other pre-defined positive quantity.
- a statistical fit may performed within a range of data points established by a pre-defined criterion.
- the number of data points to be used in the fit may be calculated by starting with a pre-set number of points, such as 12 points and then adjusting, either increasing or decreasing, the total number of data points based on an initial estimated peak width.
- a pre-set number of points such as 12 points
- adjusting, either increasing or decreasing, the total number of data points based on an initial estimated peak width Preferably, downward adjustment of the number of points to be used in the fit does not proceed to less than a certain minimum number of points, such as, for instance, five points.
- the fit may be mathematically anchored to the three points shown in FIG. 11 .
- the range of the fit may be defined as all points of the peak occurring above the noise threshold.
- the range may be defined via some criterion based on the intensities of the points or their intensities relative to the maximum point 606, or even on criterion based wholly or in part on calculation time. Such choices will depend on the particular implementation of the method, the relative requirements for calculation speed versus accuracy, etc.
- the data peak is skewed so as to have an elongated tail on the righthand side.
- This type of peak may be well modeled using either a line shape based on either the Gamma distribution function or on an exponentially modified Gaussian (EMG) distribution function. Examples of peaks that are skewed in this fashion (all of which are synthetically derived Gamma distributions) are shown in FIG. 12 . If the peaks in FIG. 12 are taken to be chromatograms, then the abscissa in each case is in the units of time, increasing towards the right.
- EMG exponentially modified Gaussian
- references often provide this in a "normalized" form i.e., a probability density function
- the peak area parameter A may be taken as corresponding to the number of analyte molecules contributing to the peak multiplied by a response factor.
- a chromatographic peak of a single analyte exhibiting peak tailing may be modeled by a four-parameter Gamma distribution function, wherein the parameters may be inferred to have relevance with regard to physical interaction between the analyte and the chromatographic column.
- FIG. 12 illustrates four different Gamma distribution functions for which the only difference is a change in the value of the mixing parameter, M .
- the Gamma function approaches the form of a Gaussian function.
- the EMG distribution used herein is defined as the convolution of an exponential distribution with a Gaussian distribution.
- the independent and dependent variables are x and I, as previously defined and the parameters are A, t0, ⁇ 2, and ⁇ .
- the parameter A is the area under the curve and is proportional to analyte concentration and the parameters t0 and ⁇ 2 are the centroid and variance of the Gaussian function that modifies an exponential decay function.
- An exponentially-modified Gaussian distribution function of the form of Eq. 4 may be used to model some chromatographic peaks exhibiting peak tailing. In this situation, the general variable x is replaced by the specific variable time t and the parameter x0 is replaced by t0.
- FIG. 13 illustrates, in greater detail, various sub-steps that may be included in the step 512 of the method 150 (see FIG. 5 and FIG. 9 ) within embodiments in accordance with the present teachings. More generally, FIG. 13 outlines an exemplary method for choosing between line shape forms in the modeling and fitting of an asymmetric spectral peak. The method 512 illustrated in FIG. 13 may be entered from step 510 of the method 150 (see FIG. 9 ).
- the skew, S is greater than (1+ ⁇ ), because the respective "No" branch has previously been executed in each of steps 509 and 510 (see FIG. 9 ). For instance, if ⁇ is set to 0.05, then the skew is greater than 1.05.
- both the EMG distribution (in the form of Eq. 4) and the Gamma distribution may be fit to the data and one of the two distributions may be selected as a model of better fit on the basis of the squared difference (chi-squared statistic).
- step 810 the method 512 ( FIG. 13 ) proceeds to step 810.
- first one line shape and then an alternative line shape is fitted to the data and a chi-squared statistic is calculated for each.
- the fit is performed within a range of data points established by a pre-defined criterion.
- the number of data points to be used in the fit may be calculated by starting with a pre-set number of points, such as 12 points and then adjusting, either increasing or decreasing, the total number of data points based on an initial estimated peak width.
- downward adjustment of the number of points to be used in the fit does not proceed to less than a certain minimum number of points, such as, for instance, five points.
- the fit may be mathematically anchored to the three points shown in FIG. 11 .
- the range may be defined as all points of the peak occurring above the noise threshold.
- the range may be defined via some criterion based on the intensities of the points or their intensities relative to the maximum point 606, or even on criterion based wholly or in part on calculation time. Such choices will depend on the particular implementation of the method, the relative requirements for calculation speed versus accuracy, etc.
- the fit function is chosen as that which yields the lesser chi-squared. The method 512 then outputs the results or exits to step 516 of method 150 (see FIG. 9 ).
- FIGS. 14A-14B are flowcharts that respectively illustrate, in greater detail, alternative sets of sub-steps that may be included in the step 508 of the method 150 (see FIG. 5 and FIG. 9 ) within embodiments in accordance with the present teachings. More generally, FIGS. 14A and 14B illustrate steps for estimating coordinates of points at a peak maximum and along flanks of the peak at half-height, according to a first exemplary method, method 508a ( FIG. 14A ) as well as according to an alternative exemplary method, method 508b ( FIG. 14B ) in accordance with the present teachings. Each of the two methods 508a ( FIG. 14A ) and 508b ( FIG. 14B ) may be entered from step 506 of method 150 ( FIG.
- the point of maximum intensity (e.g., point 606 of FIG. 11 ) may be taken as an initial estimate of the peak vertex ( x m , y m ) as in step 902 of method 508a.
- the sample of maximum intensity and its two nearest neighbors may be fit to a parabola as in step 906 of method 508b, and then the vertex of the parabola used to provide an estimate of the interpolated peak vertex (which in general does not exactly coincide with a data point of a chromatogram).
- the left and right half maxima of the detected peak are estimated by examining the sample values to the left and right (respectively), scanning outward from the peak vertex until encountering a value that is less than one-half the interpolated maximum value.
- Interpolated values of the left and right half-maxima are determined by fitting a line to sample points whose intensities lie above and below one-half the maximum intensity and finding the x -axis coordinate (either x L or x R -see FIG. 11 ) of the point on the line that passes through the half-maximum intensity.
- step 170 comprises refinement of the initial parameter estimates for multiple detected chromatographic peaks.
- refinement comprises exploring the space of N parameters (the total number of parameters across all peaks, i.e. 4 for each Gamma/EMG and 3 for each Gaussian) to find the set of values that minimizes the sum of squared differences between the observed and model chromatogram.
- the squared difference may be calculated with respect to the portion of the chromatogram comprising multiple or overlapped peaks. It may also be calculated with respect to the entire chromatogram.
- the model chromatogram is calculated by summing the contribution of all peaks estimated in the previous stage.
- the overall complexity of the refinement can be greatly reduced by partitioning the chromatogram into regions that are defined by overlaps between the detected peaks. In the simplest case, none of the peaks overlap, and the parameters for each individual peak can be estimated separately.
- the refinement process continues until a halting condition is reached.
- the halting condition can be specified in terms of a fixed number of iterations, a computational time limit, a threshold on the magnitude of the first-derivative vector (which is ideally zero at convergence), and/or a threshold on the magnitude of the change in the magnitude of the parameter vector.
- a "safety valve" limit on the number of iterations to guard against non-convergence to a solution.
- this halting condition is chosen during algorithm design and development and not exposed to the user, in order to preserve the automatic nature of the processing.
- the set of values of each peak area along with a time identifier is returned. The entire process is fully automated with no user intervention required.
- each such XIC is defined by the set of synthetic peaks calculated by those methods.
- the hypothetical synthetic extracted ion chromatograms schematically shown in FIG. 15 illustrate elution of various ionized chemical constituents at or near various retention times rt1, rt2 and rt3.
- the set of extracted ion chromatograms indicated by sections m1-m10 in FIG. 15 could be algebraically summed so as to yield a reconstructed total ion chromatogram (not shown).
- the synthetic peak intensities provided by the peak detection and fitting routines described above could be projected onto the time sections shown at times rt1, rt2 and rt3 in order to generate reconstructed mass spectra (reconstructed "scans").
- Reconstructed mass spectra are illustrated by the solid-line curves in FIG. 15 .
- the reconstructed scans are generated by including all masses that produce a chromatographic peak at the time corresponding to the scan, lie within the linewidth of said peak, and were collected under identical scan filters. Thus, every ion present in a reconstructed scan is known to contribute to a chromatographic peak, whose apex is nearby but not necessarily at the time of the scan.
- Comparison of the illustrated XIC peak profiles in FIG. 15 illustrates how mass spectral peak profiles relating to elution of different isotopes of a single type of molecule (a molecule with a particular atomic composition and structure) may be expected to all have similar elution profiles. Since the chemistry and physics that determine the chromatographic peak shape are unique for each molecule and cease when the molecule exits the column, one can expect that XICs having similar shapes may be related. In a similar manner, profiles relating to elution of different types of molecules may be expected to have different respective shapes, these shape differences resulting from differing interaction of each respective eluate with a particular chromatographic column.
- the various eluate peak shapes may be specific to a particular instrument, these time-profiles are expected to carry over to all of the mass spectral peaks - including those peaks resulting from various isotopes - that result from ionization of a particular eluate.
- peaks p2, p3 and p4 of FIG. 15 each exhibit an XIC time profile similar to profile s1 of FIG. 16 and all such profiles occur simultaneously.
- these peaks will have strong correlation scores in a subsequent analysis (discussed below) and may be noted as candidates for isotope distribution analysis or modeling.
- a stronger statement can be made that peaks that exhibit different shapes in their respective XICs are not related as different isotope compositions of the same chemical molecule.
- the XICs including peaks p5 and p6 of FIG. 15 exhibit a different time profile that, although highly correlated between peaks p5 and p6 , is dis-similar to the profiles of peaks p2, p3 and p4.
- peaks p5 and p6 may result from co-elution of an eluate together with the eluate that gives rise to p2, p3 and p4.
- Peak p1 does not correlate well with any of peaks, p2-p6, having a different time-profile than any of the peaks p2-p6 and also offset in time to time rt2.
- An isolated peak, such as peak p1 may result from background "noise" which is not related to any of the analytes of interest.
- a different compound may elute in the same LC/MS analysis.
- peaks p8, p9 and p10 all correlate well with one another as each of them exhibits a peak shape profile that is similar to profile s2 of FIG. 16 and whose center of mass is centered at time rt3. Thus, these peaks may be noted as candidates for isotope distribution analysis or modeling. Peak p7, by comparison, has a low correlation score with respect to any of peaks p8, p9 and p10 and may be assigned to co-elution of a different compound.
- PPD Parameterless Peak Detection
- Step 59 of method 40 is the cross-correlation step which is described in more detail in the following section.
- Each cross-correlation score may be calculated as a weighted average of a peak shape correlation score (calculated in terms of a time-versus-intensity for each mass that forms a recognized peak) and an optional peak width correlation score as described below. If a calculated overall correlation score is such that a match between different peaks of an isotopic distribution is recognized, then these peaks are assigned as having been ionized from the same molecule. According to a slightly different strategy, a calculated overall correlation score might be used to recognize a set of peaks that result from ionization of a same molecule. Then, the spacing and intensity distribution of these peaks may be used to identify related peaks belonging to an isotopic distribution. Peaks having low correlation are not assigned as belonging to an isotopic distribution relating to ionization of a single type of molecule.
- Methods in accordance with the present teachings use a trailing retention time window to calculate peak-shape cross correlations.
- the methods make use of a numerical array including mass, intensity, and scan number values for every mass that forms a chromatographic peak.
- PPD Parameterless Peak Detection
- This shape may be a simple Gaussian or Gamma function peak, or it may be a sum of many Gaussian or Gamma function shapes, the details of which are stored in a peak parameter list.
- the quantity PSC can theoretically have a range of 1 (perfect correlation) to -1 (perfect anti-correlation), but since negative going chromatographic peaks are not detected by PPD (by design) the lower limit is effectively zero.
- the lower and upper time bounds, t j min , and, t j max may be set in relation to each peak that may represent one ion of an isotopic distribution of ions produced by ionization of a single type of molecule.
- the time values are chosen so as to sample intensities a fixed number of times (for instance, between roughly seven and fifteen times, such as eleven times) across the width of a peak.
- the mass peaks to be tested for correlation with the chosen mass peak then use the same time points. This means that if these masses form a peak at markedly different times, the intensities will be essentially zero. Partially overlapped peaks will have some zero terms.
- FIG. 17 graphically illustrates calculation of a dot product cross-correlation score in this fashion.
- two hypothetical XIC peak profiles q1 and q2 are shown.
- Peak q1 has appreciable intensity above baseline only between time points ⁇ 1 and ⁇ 3
- peak q2 has appreciable intensity only between time points ⁇ 2 and ⁇ 4.
- the retention time axis may be considered as being divided into several equal segments between time points ⁇ 1 and ⁇ 3, thereby defining, in this example, indexed time points t j where (0 ⁇ j ⁇ 13).
- the two peak profiles are shown separately in the lowermost two graphs of FIG.
- peak q2 only has appreciable intensity between the points t 6 and t (13) .
- the cross-correlation score, as calculated above, for the peaks q1 and q2 illustrated in FIG. 17 would be a positive number because the peaks partially overlap, but would be below a threshold score for recognizing a peak match, since the peaks have different shapes.
- the cross-correlation score for a peak with itself or with a scaled version of itself is unity, as would be expected for ions resulting from ionization of the same type of molecule. Note from FIG. 15 that, by this measure, any pair of peaks chosen from the peaks p2, p3 and p4 would yield a high cross-correlation score even though these peaks have different magnitudes.
- the cross-correlation score between the peaks p7 and p9 illustrated in FIG. 15 would be lower, even though these latter two peaks are of roughly equal magnitude, because the time profiles of these peaks have different shapes.
- the cross-correlation score is calculated using the peak-shape correlation score, PSC, and optionally combining it together with the peak width correlation score, PWC, as a weighted average.
- the overall score, CCS ranges from 1.0 (perfect match) down to 0.0 (no match). Peak matches are recognized when a correlation exceeds a certain pre-defined threshold value. Experimentally, it is observed that limiting recognized matches to scores to those above 0.90 provides excellent results.
- FIGS. 18-20 provide examples of the practice of methods in accordance with the present teachings.
- FIG. 18A and FIG. 19A are mass spectral scans of two different eluates acquired during an LC/MS analysis of a single diluted urine sample.
- FIG. 18B and FIG. 19B are, respectively, calculated subsets of the mass spectral peaks shown FIG. 18A and FIG. 18B determined by performing correlation analyses in accordance with the present teachings.
- FIGS. 18B and 19B show peaks of ions whose time-profiles are correlated with one another according to the above described methods. It should be noted that these correlation analyses were performed after removal of peaks obviously related to 13 C isotope distributions.
- FIG. 18B the triplet at 277/279/281 is consistent with a fragment containing 2 chlorine atoms.
- the doublet at 346/348 is consistent with a different fragment containing a single chlorine atom.
- FIGS. 20A-20B is a mass spectral scan of an eluate from a diluted bile sample. In these spectra, a somewhat less-intense spectral profile exhibits a chlorine isotope pattern at masses 184/186. Comparing the experimental data with a simulation, the data of FIG. 20B are very well fit by a simulation of C 9 H 11 ONCl.
- the novel methods taught herein are able to identify m / z values in a full-MS scan that are related by elution lineshape. In many cases, these related m / z values come from isotope multiplets.
- the novel methods according to the present teachings assign discovered multiplets to elemental isotopes and enable determinations of element abundances, using high correlation scores to give confidence that the assignments are real and not associations of chance. These methods are useable on any LS/MS or GC/MS instrument. High mass accuracy, while helpful, is not a requirement.
- the use of extracted ion chromatograms (XICs) yields virtually-noise-free spectral data which may be reliably and reproducibly employed for automated peak identification and peak cross correlation calculations. The XICs may also be used for automated isotope pattern recognition, thereby yielding calculated results with a high degree of confidence.
- the newly invented methods described herein have no user-adjustable parameters, and can be run automatically in a post-acquisition step, or implemented in firmware and the new, simplified output files created at acquisition time.
- fitted parametric functions to describe the data, problems of normalization and time shifting of data points are totally eliminated, and all peaks may easily be characterized by an array of N values. This greatly simplifies the calculations of vector dot products between various peak shapes as used in the methods.
- the described methods are somewhat computationally intensive, they are nonetheless able to process data faster than it is acquired, and so can be done in real time, so as to make automated real-time decisions about the course of subsequent mass spectral scans on a single sample or during a single chromatographic separation.
- Such real-time (or near-real-time) decision making processes require data buffering since chromatographic peaks are searched for in a moving window of time.
- Computer instructions according to any of the methods described above may be supplied as a computer program or as a computer readable medium, such as disk storage (fixed magnetic disk, floppy disk drive, optical disk drive, magneto-optical disk drive), magnetic tape, or non-volatile memory device containing program instructions readable by an electronic processor, such computer program product or products and storage devices themselves being aspects of the present teachings.
- a computer program or as a computer readable medium, such as disk storage (fixed magnetic disk, floppy disk drive, optical disk drive, magneto-optical disk drive), magnetic tape, or non-volatile memory device containing program instructions readable by an electronic processor, such computer program product or products and storage devices themselves being aspects of the present teachings.
Landscapes
- Chemical & Material Sciences (AREA)
- Engineering & Computer Science (AREA)
- Physics & Mathematics (AREA)
- Analytical Chemistry (AREA)
- Life Sciences & Earth Sciences (AREA)
- General Health & Medical Sciences (AREA)
- Spectroscopy & Molecular Physics (AREA)
- Biochemistry (AREA)
- Library & Information Science (AREA)
- General Physics & Mathematics (AREA)
- Immunology (AREA)
- Pathology (AREA)
- Health & Medical Sciences (AREA)
- Crystallography & Structural Chemistry (AREA)
- Bioinformatics & Cheminformatics (AREA)
- Bioinformatics & Computational Biology (AREA)
- Computing Systems (AREA)
- Theoretical Computer Science (AREA)
- Other Investigation Or Analysis Of Materials By Electrical Means (AREA)
Applications Claiming Priority (1)
| Application Number | Priority Date | Filing Date | Title |
|---|---|---|---|
| US13/300,287 US20130131998A1 (en) | 2011-11-18 | 2011-11-18 | Methods and Apparatus for Identifying Mass Spectral Isotope Patterns |
Publications (2)
| Publication Number | Publication Date |
|---|---|
| EP2594936A2 true EP2594936A2 (fr) | 2013-05-22 |
| EP2594936A3 EP2594936A3 (fr) | 2014-10-15 |
Family
ID=47263098
Family Applications (1)
| Application Number | Title | Priority Date | Filing Date |
|---|---|---|---|
| EP12192525.9A Withdrawn EP2594936A3 (fr) | 2011-11-18 | 2012-11-14 | Procédés et appareil pour identifier des motifs isotopiques dans des spectres de masse |
Country Status (2)
| Country | Link |
|---|---|
| US (1) | US20130131998A1 (fr) |
| EP (1) | EP2594936A3 (fr) |
Cited By (5)
| Publication number | Priority date | Publication date | Assignee | Title |
|---|---|---|---|---|
| EP3167471A1 (fr) * | 2014-07-09 | 2017-05-17 | Tofwerk AG | Dispositif de spectrométrie de masse |
| US10607822B2 (en) | 2017-02-07 | 2020-03-31 | Thermo Fisher Scientific (Bremen) Gmbh | Method and apparatus for isotope ratio mass spectrometry |
| US11211237B2 (en) * | 2019-01-30 | 2021-12-28 | Bruker Daltonik Gmbh | Mass spectrometric method for determining the presence or absence of a chemical element in an analyte |
| WO2022144584A1 (fr) * | 2020-12-28 | 2022-07-07 | Dh Technologies Development Pte. Ltd. | Procédé et système d'évaluation de qualité de signal de spectrometre de masse |
| US11404259B2 (en) * | 2018-02-19 | 2022-08-02 | Cerno Bioscience Llc | Reliable and automatic mass spectral analysis |
Families Citing this family (16)
| Publication number | Priority date | Publication date | Assignee | Title |
|---|---|---|---|---|
| US8935101B2 (en) * | 2010-12-16 | 2015-01-13 | Thermo Finnigan Llc | Method and apparatus for correlating precursor and product ions in all-ions fragmentation experiments |
| JP5947567B2 (ja) * | 2012-03-02 | 2016-07-06 | 株式会社日立ハイテクノロジーズ | 質量分析システム |
| US10840073B2 (en) * | 2012-05-18 | 2020-11-17 | Thermo Fisher Scientific (Bremen) Gmbh | Methods and apparatus for obtaining enhanced mass spectrometric data |
| EP2973646A1 (fr) * | 2013-03-15 | 2016-01-20 | Micromass UK Limited | Mémoire guidée par les données spectrales de masse d'imagerie |
| WO2016002047A1 (fr) * | 2014-07-03 | 2016-01-07 | 株式会社島津製作所 | Dispositif de traitement de données de spectrométrie de masse |
| GB2532430B (en) * | 2014-11-18 | 2019-03-20 | Thermo Fisher Scient Bremen Gmbh | Method for time-alignment of chromatography-mass spectrometry data sets |
| CN107209156B (zh) * | 2015-02-05 | 2020-06-09 | Dh科技发展私人贸易有限公司 | 经由曲线减法检测基于质谱的相似性 |
| US11187685B2 (en) * | 2015-02-16 | 2021-11-30 | Shimadzu Corporation | Noise level estimation method, measurement data processing device, and program for processing measurement data |
| JP7386234B2 (ja) * | 2018-08-31 | 2023-11-24 | ディーエイチ テクノロジーズ デベロップメント プライベート リミテッド | 複合試料内の関連化合物の同定およびスコア化 |
| EP3620765B1 (fr) * | 2018-09-10 | 2020-11-04 | Axis AB | Procédé et système de filtrage de données d'images thermiques |
| EP3983793A4 (fr) * | 2019-06-12 | 2023-07-05 | DH Technologies Development Pte. Ltd. | Correction d'intégration de pic sans ajustement de paramètre |
| CN111141809B (zh) * | 2020-01-20 | 2022-04-29 | 中国科学院合肥物质科学研究院 | 一种基于非接触式电导信号的土壤养分离子含量检测方法 |
| CN111141808B (zh) * | 2020-01-20 | 2022-04-29 | 中国科学院合肥物质科学研究院 | 一种基于电泳分析技术的土壤有效态分析方法及其土壤养分等级评定方法 |
| ES2767375B2 (es) * | 2020-01-24 | 2020-12-17 | Consorcio Centro De Investig Biomedica En Red M P | Metodo , sistema y producto de programa para la identificacion de compuestos en muestras biologicas o ambientales complejas |
| CN116256452B (zh) * | 2023-03-15 | 2025-03-14 | 安图实验仪器(郑州)有限公司 | 一种色谱图处理方法、装置、设备及存储介质 |
| CN118213011B (zh) * | 2024-05-22 | 2024-08-13 | 之江实验室 | 星云光谱分子证认方法、电子装置和存储介质 |
Citations (3)
| Publication number | Priority date | Publication date | Assignee | Title |
|---|---|---|---|---|
| US5886346A (en) | 1995-03-31 | 1999-03-23 | Hd Technologies Limited | Mass spectrometer |
| WO2002078046A2 (fr) | 2001-03-23 | 2002-10-03 | Thermo Finnigan Llc | Procede et appareil pour realiser une spectrometrie de masse |
| US20100100336A1 (en) | 2008-10-21 | 2010-04-22 | Wright David A | Methods of automated spectral peak detection and quantification without user input |
Family Cites Families (3)
| Publication number | Priority date | Publication date | Assignee | Title |
|---|---|---|---|---|
| SE0000754D0 (sv) * | 2000-03-07 | 2000-03-07 | Amersham Pharm Biotech Ab | Mass spectral peak identification |
| US7297941B2 (en) * | 2005-06-02 | 2007-11-20 | Thermo Finnigan Llc | Methods for improved data dependent acquisition |
| US8105838B2 (en) * | 2005-06-03 | 2012-01-31 | Waters Technologies Corporation | Generation and use of a catalog of polypeptide-related information for chemical analyses |
-
2011
- 2011-11-18 US US13/300,287 patent/US20130131998A1/en not_active Abandoned
-
2012
- 2012-11-14 EP EP12192525.9A patent/EP2594936A3/fr not_active Withdrawn
Patent Citations (4)
| Publication number | Priority date | Publication date | Assignee | Title |
|---|---|---|---|---|
| US5886346A (en) | 1995-03-31 | 1999-03-23 | Hd Technologies Limited | Mass spectrometer |
| WO2002078046A2 (fr) | 2001-03-23 | 2002-10-03 | Thermo Finnigan Llc | Procede et appareil pour realiser une spectrometrie de masse |
| US6872938B2 (en) | 2001-03-23 | 2005-03-29 | Thermo Finnigan Llc | Mass spectrometry method and apparatus |
| US20100100336A1 (en) | 2008-10-21 | 2010-04-22 | Wright David A | Methods of automated spectral peak detection and quantification without user input |
Non-Patent Citations (1)
| Title |
|---|
| MATTIAS J. FREDRIKSSON ET AL: "An automatic peak finding method for LC-MS data using Gaussian second derivative filtering", JOURNAL OF SEPARATION SCIENCE, vol. 32, no. 22, 1 November 2009 (2009-11-01), pages 3906 - 3918, XP055138908, ISSN: 1615-9306, DOI: 10.1002/jssc.200900395 * |
Cited By (6)
| Publication number | Priority date | Publication date | Assignee | Title |
|---|---|---|---|---|
| EP3167471A1 (fr) * | 2014-07-09 | 2017-05-17 | Tofwerk AG | Dispositif de spectrométrie de masse |
| US10607822B2 (en) | 2017-02-07 | 2020-03-31 | Thermo Fisher Scientific (Bremen) Gmbh | Method and apparatus for isotope ratio mass spectrometry |
| US11404259B2 (en) * | 2018-02-19 | 2022-08-02 | Cerno Bioscience Llc | Reliable and automatic mass spectral analysis |
| US11211237B2 (en) * | 2019-01-30 | 2021-12-28 | Bruker Daltonik Gmbh | Mass spectrometric method for determining the presence or absence of a chemical element in an analyte |
| DE102020101408B4 (de) | 2019-01-30 | 2024-06-27 | Bruker Daltonics GmbH & Co. KG | Verfahren für die massenspektrometrische bestimmung der anwesenheit oder des fehlens eines chemischen elements in einem analyten |
| WO2022144584A1 (fr) * | 2020-12-28 | 2022-07-07 | Dh Technologies Development Pte. Ltd. | Procédé et système d'évaluation de qualité de signal de spectrometre de masse |
Also Published As
| Publication number | Publication date |
|---|---|
| EP2594936A3 (fr) | 2014-10-15 |
| US20130131998A1 (en) | 2013-05-23 |
Similar Documents
| Publication | Publication Date | Title |
|---|---|---|
| EP2594936A2 (fr) | Procédés et appareil pour identifier des motifs isotopiques dans des spectres de masse | |
| EP2652493B1 (fr) | Mise en corrélation d'ions de précurseur et de produit dans fragmentation tous ions | |
| EP2775509B1 (fr) | Procédés et appareil pour décomposer des spectres de masse en tandem générés par fragmentation d'ions | |
| CN111902719B (zh) | 自动的质谱分析方法和仪器 | |
| US7493225B2 (en) | Method for calibrating mass spectrometry (MS) and other instrument systems and for processing MS and other data | |
| US8346487B2 (en) | Methods of automated spectral peak detection and quantification without user input | |
| US20140179020A1 (en) | Methods and Apparatus for Identifying Ion Species Formed during Gas-Phase Reactions | |
| EP2741225A2 (fr) | Reconstruction automatique de spectres MS-2 à partir de la fragmentation de tous les ions pour reconnaître des composés précédemment détectés | |
| EP2438436B1 (fr) | Procédés de détection et de quantification de pic spectral automatisées sans entrée utilisateur | |
| US20050255606A1 (en) | Methods for accurate component intensity extraction from separations-mass spectrometry data | |
| US20130206979A1 (en) | Data Independent Acquisition of Product Ion Spectra and Reference Spectra Library Matching | |
| EP2741223A1 (fr) | Utilisation de masse de perte neutre afin de reconstruire les spectres de MS-2 lors de fragmentation de tous les ions | |
| CN107209151B (zh) | 干扰检测及所关注峰值解卷积 | |
| US20200232956A1 (en) | Accurate mass spectral library for analysis | |
| US20150162175A1 (en) | Methods for Isolation and Decomposition of Mass Spectrometric Protein Signatures | |
| EP4099362A2 (fr) | Spectromètre de masse utilisant une recherche de base de données spectrale de masse pour l'identification des composés | |
| US7529630B2 (en) | Method of analyzing mass analysis data and apparatus for the method | |
| US11688595B2 (en) | Operating a mass spectrometer for sample quantification | |
| Yu et al. | A chemometric-assisted method based on gas chromatography–mass spectrometry for metabolic profiling analysis | |
| CN111257401B (zh) | 用于测定离子种类的质量的系统和方法 | |
| US20240302337A1 (en) | Accurate spectral library search |
Legal Events
| Date | Code | Title | Description |
|---|---|---|---|
| PUAI | Public reference made under article 153(3) epc to a published international application that has entered the european phase |
Free format text: ORIGINAL CODE: 0009012 |
|
| AK | Designated contracting states |
Kind code of ref document: A2 Designated state(s): AL AT BE BG CH CY CZ DE DK EE ES FI FR GB GR HR HU IE IS IT LI LT LU LV MC MK MT NL NO PL PT RO RS SE SI SK SM TR |
|
| AX | Request for extension of the european patent |
Extension state: BA ME |
|
| PUAL | Search report despatched |
Free format text: ORIGINAL CODE: 0009013 |
|
| AK | Designated contracting states |
Kind code of ref document: A3 Designated state(s): AL AT BE BG CH CY CZ DE DK EE ES FI FR GB GR HR HU IE IS IT LI LT LU LV MC MK MT NL NO PL PT RO RS SE SI SK SM TR |
|
| AX | Request for extension of the european patent |
Extension state: BA ME |
|
| RIC1 | Information provided on ipc code assigned before grant |
Ipc: G01N 30/72 20060101ALN20140910BHEP Ipc: G01N 30/86 20060101AFI20140910BHEP Ipc: H01J 49/00 20060101ALI20140910BHEP |
|
| 17P | Request for examination filed |
Effective date: 20150415 |
|
| RBV | Designated contracting states (corrected) |
Designated state(s): AL AT BE BG CH CY CZ DE DK EE ES FI FR GB GR HR HU IE IS IT LI LT LU LV MC MK MT NL NO PL PT RO RS SE SI SK SM TR |
|
| 17Q | First examination report despatched |
Effective date: 20190305 |
|
| STAA | Information on the status of an ep patent application or granted ep patent |
Free format text: STATUS: THE APPLICATION IS DEEMED TO BE WITHDRAWN |
|
| 18D | Application deemed to be withdrawn |
Effective date: 20190716 |