EP2597601A1 - Verfahren und System zur Funktionsüberwachung in einem Reservierungssystem mit mehreren Servern - Google Patents
Verfahren und System zur Funktionsüberwachung in einem Reservierungssystem mit mehreren Servern Download PDFInfo
- Publication number
- EP2597601A1 EP2597601A1 EP11306553.6A EP11306553A EP2597601A1 EP 2597601 A1 EP2597601 A1 EP 2597601A1 EP 11306553 A EP11306553 A EP 11306553A EP 2597601 A1 EP2597601 A1 EP 2597601A1
- Authority
- EP
- European Patent Office
- Prior art keywords
- service
- node
- peripheral
- health parameter
- monitoring
- Prior art date
- Legal status (The legal status is an assumption and is not a legal conclusion. Google has not performed a legal analysis and makes no representation as to the accuracy of the status listed.)
- Withdrawn
Links
Images



Classifications
-
- H—ELECTRICITY
- H04—ELECTRIC COMMUNICATION TECHNIQUE
- H04L—TRANSMISSION OF DIGITAL INFORMATION, e.g. TELEGRAPHIC COMMUNICATION
- H04L43/00—Arrangements for monitoring or testing data switching networks
- H04L43/08—Monitoring or testing based on specific metrics, e.g. QoS, energy consumption or environmental parameters
- H04L43/0805—Monitoring or testing based on specific metrics, e.g. QoS, energy consumption or environmental parameters by checking availability
- H04L43/0817—Monitoring or testing based on specific metrics, e.g. QoS, energy consumption or environmental parameters by checking availability by checking functioning
-
- G—PHYSICS
- G06—COMPUTING OR CALCULATING; COUNTING
- G06F—ELECTRIC DIGITAL DATA PROCESSING
- G06F11/00—Error detection; Error correction; Monitoring
- G06F11/30—Monitoring
- G06F11/34—Recording or statistical evaluation of computer activity, e.g. of down time, of input/output operation ; Recording or statistical evaluation of user activity, e.g. usability assessment
- G06F11/3466—Performance evaluation by tracing or monitoring
-
- G—PHYSICS
- G06—COMPUTING OR CALCULATING; COUNTING
- G06Q—INFORMATION AND COMMUNICATION TECHNOLOGY [ICT] SPECIALLY ADAPTED FOR ADMINISTRATIVE, COMMERCIAL, FINANCIAL, MANAGERIAL OR SUPERVISORY PURPOSES; SYSTEMS OR METHODS SPECIALLY ADAPTED FOR ADMINISTRATIVE, COMMERCIAL, FINANCIAL, MANAGERIAL OR SUPERVISORY PURPOSES, NOT OTHERWISE PROVIDED FOR
- G06Q10/00—Administration; Management
- G06Q10/02—Reservations, e.g. for tickets, services or events
-
- G—PHYSICS
- G06—COMPUTING OR CALCULATING; COUNTING
- G06Q—INFORMATION AND COMMUNICATION TECHNOLOGY [ICT] SPECIALLY ADAPTED FOR ADMINISTRATIVE, COMMERCIAL, FINANCIAL, MANAGERIAL OR SUPERVISORY PURPOSES; SYSTEMS OR METHODS SPECIALLY ADAPTED FOR ADMINISTRATIVE, COMMERCIAL, FINANCIAL, MANAGERIAL OR SUPERVISORY PURPOSES, NOT OTHERWISE PROVIDED FOR
- G06Q10/00—Administration; Management
- G06Q10/02—Reservations, e.g. for tickets, services or events
- G06Q10/028—Reservations, e.g. for tickets, services or events for seating or spaces in a venue
- G06Q10/0283—Reservations, e.g. for tickets, services or events for seating or spaces in a venue for travel seating
-
- G—PHYSICS
- G06—COMPUTING OR CALCULATING; COUNTING
- G06F—ELECTRIC DIGITAL DATA PROCESSING
- G06F2201/00—Indexing scheme relating to error detection, to error correction, and to monitoring
- G06F2201/81—Threshold
-
- G—PHYSICS
- G06—COMPUTING OR CALCULATING; COUNTING
- G06F—ELECTRIC DIGITAL DATA PROCESSING
- G06F2201/00—Indexing scheme relating to error detection, to error correction, and to monitoring
- G06F2201/865—Monitoring of software
-
- H—ELECTRICITY
- H04—ELECTRIC COMMUNICATION TECHNIQUE
- H04L—TRANSMISSION OF DIGITAL INFORMATION, e.g. TELEGRAPHIC COMMUNICATION
- H04L41/00—Arrangements for maintenance, administration or management of data switching networks, e.g. of packet switching networks
- H04L41/06—Management of faults, events, alarms or notifications
- H04L41/0654—Management of faults, events, alarms or notifications using network fault recovery
-
- H—ELECTRICITY
- H04—ELECTRIC COMMUNICATION TECHNIQUE
- H04L—TRANSMISSION OF DIGITAL INFORMATION, e.g. TELEGRAPHIC COMMUNICATION
- H04L43/00—Arrangements for monitoring or testing data switching networks
- H04L43/16—Threshold monitoring
Definitions
- the present invention relates to the field of travel reservation systems, more particularly to a method and system for monitoring system performances in multi-server reservation system.
- Modern travel companies e.g. airlines usually employ sophisticated applications for handling reservation requests by customers. It is more and more frequent the case where more than one architecture is used throughout the company system. In such cases compatibility and synchronization issues should be taken into account when designing and planning the reservation system.
- An example is when part of the reservation management is performed on Internet based applications or communication infrastructures.
- Another example is when a system (not necessarily a reservation system) must be migrated from a legacy mainframe system (e.g. TPF) to a new system (e.g. an open system).
- a booking service is implemented among several applications.
- An application is focused on a particular use case; for instance check flight availability or pricing.
- An application depends on several resources such as databases, machines or network links.
- US2002/0156884 discloses a method and system for providing performance analysis of a group of computers arranged with several nodes to determine any possible improvement in the performance of the computers. The analysis can be displayed on a graph to monitor the performance of the group of computers.
- the method and system relates to a monitoring of hardware components such as the monitoring of memory consumption, disk consumption and CPU consumption.
- US6,055,492 discloses a method and system for providing improved monitoring of performance of a system.
- the method discloses monitoring performance of a system by using a specific tree structure to improve the response to performance queries and to monitor long running programs.
- the method and system relate to monitoring of a hardware component such as monitoring a memory allocation.
- a complex multi-server architecture e.g. a client/server architecture
- a travel related reservation system can include several functional components, e.g.
- a service is a functionality that is implemented as a transactional conversation between a client and the reservation system.
- a service is split into several stages.
- An application hosts the functional software that implements a stage of service. Application is deployed on machines. As a result a service depends on several software and several machines.
- An object of the present invention is to alleviate at least some of the problems associated with the prior art systems.
- the method according to a preferred embodiment of the present invention allows handling very different cases; also it is possible to separate monitoring from alert management and mix low level and high level entities.
- Cascade health interpretation allows refining data from bottom to top levels. Low level data can be analysed to determine a health of those hardware level. In an embodiment of the present invention, this information is cascaded in higher gauges that represent services or applications. Therefore High level data can be analysed to determine a health of functional components and service at higher level.
- a system comprising one or more components adapted to perform the method described above.
- a computer program comprising instructions for carrying out the method described above when said computer program is executed on a computer system.
- the example on which the present description is based is a reservation system distributed among mainframe, e.g. TPF or MVS systems of International Business Corporation and open platform, e.g. UNIX or Linux systems.
- the reservation system could be implemented e.g. on an Amadeus infrastructure.
- the reservation system is implemented as an Open Back-end system which can process a huge volume of transactions from many terminals located at different places in the world.
- the Open back-end system uses several nodes to process all the transactions.
- the Open back-end system also uses indicators to determine the correct processing of each node. Each indicator refers to specific checking functions of hardware components: e.g. checking memory consumption, disk consumption and CPU consumption.
- a global indicator gathers all the indicators to give a global checking indicator of the processing through the nodes.
- the global indicator provides failure detection of hardware components.
- the method according to a preferred embodiment of the present invention is based on new indicators.
- the method uses a specific architecture which reproduces the system of terminals to monitor.
- the architecture is made of gauges which are connected in a specific manner to take into account the rules already set between the terminals.
- the architecture is produced in order to monitor a specific part of the system of terminals as requested by the user.
- New indicators are defined with specific rules and calculated with corresponding formulae based on above mentioned existing indicators.
- a rule can be a request for receiving an indication of when a specific level of occupied seats in a plane is reached in order to allow the flight to occur.
- the answer to the request refers to a specific calculation based on current data coming from a real situation of checking the number of occupied seat on a regular basis.
- a resulting graph of the monitoring method can be displayed to visualize the evolution of the monitoring based on the new indicators and on up-to-date data.
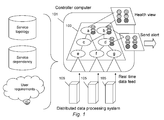
- FIG. 1 represents an example of a possible implementation of the system and method according to a preferred embodiment of the present invention.
- a controller computer 101 maintains a tree representation of a graph 103 representing the activity stages of a service(s) performed by a distributed data processing system.
- the distributed data processing system includes e.g. three data sources 105 (e.g. check-in terminals, boarding gate terminals, CPUs, storage servers) which provide input to the tree data structure, each one being associated to at least one peripheral node of the tree data structure.
- the graph 103 has been previously built taking into account the Service Topology, the Service Dependencies and the User Requirements.
- the indicators can provide a response which is not limited to a binary value, but it can include a plurality of output values (in the present example, based on colours, three possible values are available, corresponding to red, amber and green).
- all indicators are included in a single data structure.
- the structure itself maintains a static hierarchy between indicators.
- the data structure of the present example is a graph, which nodes are indicators (also called gauges).
- the gauge node will have a health that is changed either by real time value or other gauge health.
- the basic element is the gauge. Its primary attributes are an integer value and a cap. From the comparison of current value and cap we can determine dynamically the gauge health.
- the first rank gauges are influenced by hardware indicators: like memory consumption, disk usage or trap frequency. Gauge from higher level refined the below information: they represent services, applications, client service level.
- the gauge is taken as the node type of our graph. As a result we can represent relations between gauges with graph edges. This is useful for second rank gauges and above. Indeed gauges can read and refine others gauges health to compute their own health. The value change that comes in real time from first rank gauge will be propagated in the graph. The information will impact every level of interpretation as it goes up in the graph.
- the graph structure is a prerequisite of the system. It can be built offline. It represents a full system and can monitor both low level indicators and high level use cases for clients. This can be done by the system administrator and customized by the client according to own requirements and system topology.
- the term topology is to be interpreted in a broad sense, it can include hardware topology (e.g. "Machine009" health depends on CPU level and its free memory), but also services distribution over machines and also services inter dependencies. This will be illustrated in a service example later on.
- the graph itself is not functional-specific. Here are a couple of examples showing how graph can depict different use cases.
- FIG. 2 One example, as represented in Figures 2 is that of Flight management. This use case is centred on customer management process in airport. Airlines have a minimum boarding ratio over time before boarding is closed. This is represented by several key points, represented in the table below. Minimum boarded percentage Time before take-off 10 2 hours 50 1 hour 90 30 minute
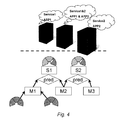
- FIG 4 represents another example using a monitoring method according to a preferred embodiment of the present invention.
- Operations of the system is based on two Applications (APP1, providing Service1 and APP2, providing Service2) supported by three physical machines (M1, M2 and M3). They can run applications distributed on these machines.
- This relation is stored in a "machine topology" database.
- Service Virtualization services can run on several machines at a time. Of course we can also have several services running on the same machine concurrently.
- the case represent in Figure 4 is an example of such potential distribution. Services deployment is maintained up to date by Operations. This is the "machine topology" database. As an example if M1 and M2 are down, our system must predict that APP1 is down and APP2 is impacted.
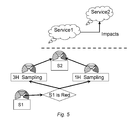
- Figure 5 represents an additional constraint, according to which Service2 (S2) requires Service1 (S1) to be up and running.
- This dependency relation is stored in a service topology data base.
- a customer request use case is realised among several services. They can be cascaded, meaning that they must be done in sequence order. If one is failing the subsequent services are impacted or unable to process.
- the case represented in Figure 5 shows that S1 is impacted if S2 is down for more than one hour. S1 is down if S2 is down for more than three hours.
- the critical component is represented by the gauge when the following two predicates are met:
- PNR Store it is meant the process of copy and protection of traveller and itinerary data.
- PNR Publication which is meant to be the process of distributing information of PNR modification to subscribers.
- PNR Publication depends on PNR Store. This will be handled in the monitoring graph so that every problem occurring in PNR Store will degrade PNR Publication.
- the data structure has been realised with C++ language and several third party libraries.
- the node classes are one of the key features of the method and system according to a preferred embodiment of the present invention. They are presented from basic class to the most specific ones. Each node class implements a basic monitoring type, e.g. watch an event frequency or watch for an absolute event occurrence.
- the basic gauge contains an integer value that is updated dynamically by events or other gauges. Events are SNMP traps coming from application or machines.
- the gauge has static health cap that indicates the gauge colour from its value.
- the inner value causes health evaluation each time it is updated.
- the gauge has 3 different colours depicting its health. Attributes Gauge colour above Gauge colour below Red upper limit Red Orange Orange upper limit Orange Green Orange lower limit Green Orange Red lower limit Orange Red
- This basic gauge has also a latency property. This prevents the gauge to actually blink due to irregular real time value. This ensures the monitoring engine to be consistent over time.
- This gauge is commonly used for operational monitoring: disk usage or edifact traffic.
- Frequency gauge inherits from Threshold gauge and focus on event occurrence only not its integer value.
- Functional gauge inherits from Threshold gauge The monitoring needs also data computation or calculation. This is achieved by the functional gauge. It allows calculation between gauge inner values. This new value becomes the value of the functional gauge itself.
- a third gauge is implemented as a functional gauge to compute the percentage between G1 and G2.
- the default colour is determined by the types of predicates that are given when gauge is constructed. For instance a greenPredicate implementation will result a red default colour. redPredicate orangePredicate greenPredicate Default colour implemented Green implemented Green implemented Red implemented implemented Green implemented Red implemented implemented Orange
- a generic computer of the system (e.g. any computer, Reservation server, TPF mainframe, Open System server, data base management subsystem, router, network server) is denoted with 650.
- the computer 650 is formed by several units that are connected in parallel to a system bus 653.
- one or more microprocessors 656 control operation of the computer 650;
- a RAM 659 is directly used as a working memory by the microprocessors 656, and
- a ROM 662 stores basic code for a bootstrap of the computer 650.
- Peripheral units are clustered around a local bus 665 (by means of respective interfaces).
- a mass memory consists of a hard-disk 668 and a drive 671 for reading CD-ROMs 674.
- the computer 650 includes input devices 677 (for example, a keyboard and a mouse), and output devices 680 (for example, a monitor and a printer).
- a Network Interface Card 683 is used to connect the computer 650 to the network.
- a bridge unit 686 interfaces the system bus 653 with the local bus 665. Each microprocessor 656 and the bridge unit 686 can operate as master agents requesting an access to the system bus 653 for transmitting information.
- An arbiter 689 manages the granting of the access with mutual exclusion to the system bus 653. Similar considerations apply if the system has a different topology, or it is based on other networks. Alternatively, the computers have a different structure, include equivalent units, or consist of other data processing entities (such as PDAs, mobile phones, and the like).
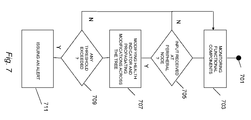
- the method described above is also represented in the diagram shown in figure 7 .
- the method realizes a monitoring method for monitoring performances of a service performed by a distributed data processing system including a plurality of functional components, wherein the service includes a plurality of computer implemented activity stages, each stage being associated to at least one health indicator (or parameter) indicative of the service performance, the at least one indicator having at least one predetermined threshold value representing the successfulness of the associated service, the plurality of stages being represented by a tree data structure including nodes interconnected one each other, each node being associated to one of the plurality of activity stages, wherein each of the peripheral nodes is associated to at least one of the plurality of functional components and wherein non-peripheral nodes are receiving input from at least another node.
- the method begins at black circle 701 and then goes to box 703 where the system monitors a plurality of associated functional components.
- Functional components normally depend on physical inputs and, when new inputs are received, associated values are modified accordingly.
- input values received from functional component can be:
- the program (which may be used to implement each embodiment of the disclosure) is structured in a different way, or if additional modules or functions are provided; likewise, the memory structures may be of other types, or may be replaced with equivalent entities (not necessarily consisting of physical storage media). Moreover, the proposed solution lends itself to be implemented with an equivalent method (having similar or additional steps, even in a different order).
- the program may take any form suitable to be used by or in connection with any data processing system, such as external or resident software, firmware, or microcode (either in object code or in source code).
- the program may be provided on any computer-usable medium; the medium can be any element suitable to contain, store, communicate, propagate, or transfer the program.
- Examples of such medium are fixed disks (where the program can be pre-loaded), removable disks, tapes, cards, wires, fibres, wireless connections, networks, broadcast waves, and the like; for example, the medium may be of the electronic, magnetic, optical, electromagnetic, infrared, or semiconductor type.
- the solution according to the present disclosure lends itself to be carried out with a hardware structure (for example, integrated in a chip of semiconductor material), or with a combination of software and hardware.
Landscapes
- Engineering & Computer Science (AREA)
- Theoretical Computer Science (AREA)
- Business, Economics & Management (AREA)
- Quality & Reliability (AREA)
- General Engineering & Computer Science (AREA)
- Tourism & Hospitality (AREA)
- General Physics & Mathematics (AREA)
- Physics & Mathematics (AREA)
- Strategic Management (AREA)
- Operations Research (AREA)
- Marketing (AREA)
- Human Resources & Organizations (AREA)
- General Business, Economics & Management (AREA)
- Entrepreneurship & Innovation (AREA)
- Economics (AREA)
- Computer Hardware Design (AREA)
- Development Economics (AREA)
- Environmental & Geological Engineering (AREA)
- Computer Networks & Wireless Communication (AREA)
- Signal Processing (AREA)
- Debugging And Monitoring (AREA)
Priority Applications (4)
| Application Number | Priority Date | Filing Date | Title |
|---|---|---|---|
| EP11306553.6A EP2597601A1 (de) | 2011-11-24 | 2011-11-24 | Verfahren und System zur Funktionsüberwachung in einem Reservierungssystem mit mehreren Servern |
| US13/352,051 US20130138802A1 (en) | 2011-11-24 | 2012-01-17 | Method and system for functional monitoring in multi-server reservation system |
| PCT/EP2012/070256 WO2013075885A1 (en) | 2011-11-24 | 2012-10-12 | Method and system for functional monitoring in multi-sever reservation system |
| AU2013202202A AU2013202202A1 (en) | 2011-11-24 | 2012-10-12 | Method and system for functional monitoring in multi-sever reservation system |
Applications Claiming Priority (1)
| Application Number | Priority Date | Filing Date | Title |
|---|---|---|---|
| EP11306553.6A EP2597601A1 (de) | 2011-11-24 | 2011-11-24 | Verfahren und System zur Funktionsüberwachung in einem Reservierungssystem mit mehreren Servern |
Publications (1)
| Publication Number | Publication Date |
|---|---|
| EP2597601A1 true EP2597601A1 (de) | 2013-05-29 |
Family
ID=47046588
Family Applications (1)
| Application Number | Title | Priority Date | Filing Date |
|---|---|---|---|
| EP11306553.6A Withdrawn EP2597601A1 (de) | 2011-11-24 | 2011-11-24 | Verfahren und System zur Funktionsüberwachung in einem Reservierungssystem mit mehreren Servern |
Country Status (4)
| Country | Link |
|---|---|
| US (1) | US20130138802A1 (de) |
| EP (1) | EP2597601A1 (de) |
| AU (1) | AU2013202202A1 (de) |
| WO (1) | WO2013075885A1 (de) |
Cited By (3)
| Publication number | Priority date | Publication date | Assignee | Title |
|---|---|---|---|---|
| EP2908468A1 (de) * | 2014-02-13 | 2015-08-19 | Spatineo Oy | Dienstebenenüberwachung für geospatiale Webdienste |
| WO2016053685A1 (en) * | 2014-09-29 | 2016-04-07 | Pivotal Software, Inc. | Determining and localizing anomalous network behavior |
| CN115292120A (zh) * | 2022-07-26 | 2022-11-04 | 中国工程物理研究院计算机应用研究所 | 一种基于产品结构分解的分布式系统自动巡检方法 |
Families Citing this family (1)
| Publication number | Priority date | Publication date | Assignee | Title |
|---|---|---|---|---|
| US9450882B2 (en) * | 2012-04-23 | 2016-09-20 | Cisco Technology, Inc. | Method and apparatus for supporting call admission control using graph assembly and fate-share identifiers |
Citations (3)
| Publication number | Priority date | Publication date | Assignee | Title |
|---|---|---|---|---|
| US6055492A (en) | 1997-12-12 | 2000-04-25 | International Business Machines Corporation | System and method for providing trace information data reduction |
| US20020156884A1 (en) | 2001-04-23 | 2002-10-24 | International Business Machines Corporation | Method and system for providing and viewing performance analysis of resource groups |
| WO2006015441A1 (en) * | 2004-08-13 | 2006-02-16 | Remasys Pty Ltd | Monitoring and management of distributed information systems |
Family Cites Families (4)
| Publication number | Priority date | Publication date | Assignee | Title |
|---|---|---|---|---|
| US7962589B1 (en) * | 2002-11-07 | 2011-06-14 | Cisco Technology, Inc. | Method and apparatus for providing notification of network alarms using a plurality of distributed layers |
| US8045977B2 (en) * | 2007-11-01 | 2011-10-25 | Honeywell International Inc. | Method for maintaining datalink network throughput by delaying lower priority messages |
| US7991881B2 (en) * | 2008-02-29 | 2011-08-02 | Microsoft Corporation | Monitoring network performance to identify sources of network performance degradation |
| US20120173713A1 (en) * | 2010-12-30 | 2012-07-05 | Brocade Communication Systems, Inc. | Resources monitoring and recovery |
-
2011
- 2011-11-24 EP EP11306553.6A patent/EP2597601A1/de not_active Withdrawn
-
2012
- 2012-01-17 US US13/352,051 patent/US20130138802A1/en not_active Abandoned
- 2012-10-12 WO PCT/EP2012/070256 patent/WO2013075885A1/en not_active Ceased
- 2012-10-12 AU AU2013202202A patent/AU2013202202A1/en not_active Abandoned
Patent Citations (3)
| Publication number | Priority date | Publication date | Assignee | Title |
|---|---|---|---|---|
| US6055492A (en) | 1997-12-12 | 2000-04-25 | International Business Machines Corporation | System and method for providing trace information data reduction |
| US20020156884A1 (en) | 2001-04-23 | 2002-10-24 | International Business Machines Corporation | Method and system for providing and viewing performance analysis of resource groups |
| WO2006015441A1 (en) * | 2004-08-13 | 2006-02-16 | Remasys Pty Ltd | Monitoring and management of distributed information systems |
Cited By (4)
| Publication number | Priority date | Publication date | Assignee | Title |
|---|---|---|---|---|
| EP2908468A1 (de) * | 2014-02-13 | 2015-08-19 | Spatineo Oy | Dienstebenenüberwachung für geospatiale Webdienste |
| WO2016053685A1 (en) * | 2014-09-29 | 2016-04-07 | Pivotal Software, Inc. | Determining and localizing anomalous network behavior |
| US9747551B2 (en) | 2014-09-29 | 2017-08-29 | Pivotal Software, Inc. | Determining and localizing anomalous network behavior |
| CN115292120A (zh) * | 2022-07-26 | 2022-11-04 | 中国工程物理研究院计算机应用研究所 | 一种基于产品结构分解的分布式系统自动巡检方法 |
Also Published As
| Publication number | Publication date |
|---|---|
| US20130138802A1 (en) | 2013-05-30 |
| WO2013075885A1 (en) | 2013-05-30 |
| AU2013202202A1 (en) | 2013-06-13 |
Similar Documents
| Publication | Publication Date | Title |
|---|---|---|
| US11188791B2 (en) | Anonymizing data for preserving privacy during use for federated machine learning | |
| US11513930B2 (en) | Log-based status modeling and problem diagnosis for distributed applications | |
| US20100070981A1 (en) | System and Method for Performing Complex Event Processing | |
| US20230018975A1 (en) | Monolith database to distributed database transformation | |
| US10896237B2 (en) | Reducing database stress using cognitive data caching | |
| US11409897B2 (en) | Constraint querying for collaborative intelligence and constraint computing | |
| US9189543B2 (en) | Predicting service request breaches | |
| US10885127B2 (en) | Machine-learning to alarm or pre-empt query execution | |
| EP3956776A1 (de) | Datenschutz-pipeline mit gemeinschaftlicher intelligenz und zwangsberechnung | |
| WO2020214313A1 (en) | Constraint manager for collaborative intelligence and constraint computing | |
| US11212162B2 (en) | Bayesian-based event grouping | |
| CN110807016B (zh) | 一种应用于金融业务的数据仓库构建方法、装置和电子设备 | |
| US20230273958A1 (en) | Computer-implemented methods, systems comprising computer-readable media, and electronic devices for narrative representation of a network computing environment | |
| US20140137075A1 (en) | Development of business applications | |
| US20180012181A1 (en) | Method of collaborative software development | |
| CN117971799A (zh) | 一种数据开发平台和数据开发方法 | |
| US9009735B2 (en) | Method for processing data, computing node, and system | |
| EP2597601A1 (de) | Verfahren und System zur Funktionsüberwachung in einem Reservierungssystem mit mehreren Servern | |
| US11593511B2 (en) | Dynamically identifying and redacting data from diagnostic operations via runtime monitoring of data sources | |
| US20230252024A1 (en) | Machine-learning-based, adaptive updating of quantitative data in database system | |
| US20240340288A1 (en) | Cloud security platform with contextual hot-spot permissions analytics | |
| US20220179764A1 (en) | Multi-source data correlation extraction for anomaly detection | |
| US11093636B2 (en) | Maintaining data protection compliance and data inference from data degradation in cross-boundary data transmission using containers | |
| Prabhakaran | Cloud-Native Data Analytics Platform with Integrated Governance: A Modern Approach to Real-Time Stream Processing and Feature Engineering | |
| Khedimi et al. | A cloud weather forecasting service and its relationship with anomaly detection |
Legal Events
| Date | Code | Title | Description |
|---|---|---|---|
| PUAI | Public reference made under article 153(3) epc to a published international application that has entered the european phase |
Free format text: ORIGINAL CODE: 0009012 |
|
| AK | Designated contracting states |
Kind code of ref document: A1 Designated state(s): AL AT BE BG CH CY CZ DE DK EE ES FI FR GB GR HR HU IE IS IT LI LT LU LV MC MK MT NL NO PL PT RO RS SE SI SK SM TR |
|
| AX | Request for extension of the european patent |
Extension state: BA ME |
|
| STAA | Information on the status of an ep patent application or granted ep patent |
Free format text: STATUS: THE APPLICATION IS DEEMED TO BE WITHDRAWN |
|
| 18D | Application deemed to be withdrawn |
Effective date: 20131130 |