EP2599441B1 - Dispositif d'observation à ultrasons, procédé de fonctionnement de dispositif d'observation à ultrasons, et programme de fonctionnement de dispositif d'observation à ultrasons - Google Patents
Dispositif d'observation à ultrasons, procédé de fonctionnement de dispositif d'observation à ultrasons, et programme de fonctionnement de dispositif d'observation à ultrasons Download PDFInfo
- Publication number
- EP2599441B1 EP2599441B1 EP11840305.4A EP11840305A EP2599441B1 EP 2599441 B1 EP2599441 B1 EP 2599441B1 EP 11840305 A EP11840305 A EP 11840305A EP 2599441 B1 EP2599441 B1 EP 2599441B1
- Authority
- EP
- European Patent Office
- Prior art keywords
- feature data
- attenuation
- observation apparatus
- correction
- ultrasonic
- Prior art date
- Legal status (The legal status is an assumption and is not a legal conclusion. Google has not performed a legal analysis and makes no representation as to the accuracy of the status listed.)
- Active
Links
Images


Classifications
-
- G—PHYSICS
- G01—MEASURING; TESTING
- G01S—RADIO DIRECTION-FINDING; RADIO NAVIGATION; DETERMINING DISTANCE OR VELOCITY BY USE OF RADIO WAVES; LOCATING OR PRESENCE-DETECTING BY USE OF THE REFLECTION OR RERADIATION OF RADIO WAVES; ANALOGOUS ARRANGEMENTS USING OTHER WAVES
- G01S7/00—Details of systems according to groups G01S13/00, G01S15/00, G01S17/00
- G01S7/52—Details of systems according to groups G01S13/00, G01S15/00, G01S17/00 of systems according to group G01S15/00
- G01S7/52017—Details of systems according to groups G01S13/00, G01S15/00, G01S17/00 of systems according to group G01S15/00 particularly adapted to short-range imaging
- G01S7/52098—Details of systems according to groups G01S13/00, G01S15/00, G01S17/00 of systems according to group G01S15/00 particularly adapted to short-range imaging related to workflow protocols
-
- A—HUMAN NECESSITIES
- A61—MEDICAL OR VETERINARY SCIENCE; HYGIENE
- A61B—DIAGNOSIS; SURGERY; IDENTIFICATION
- A61B8/00—Diagnosis using ultrasonic, sonic or infrasonic waves
- A61B8/52—Devices using data or image processing specially adapted for diagnosis using ultrasonic, sonic or infrasonic waves
- A61B8/5207—Devices using data or image processing specially adapted for diagnosis using ultrasonic, sonic or infrasonic waves involving processing of raw data to produce diagnostic data, e.g. for generating an image
-
- A—HUMAN NECESSITIES
- A61—MEDICAL OR VETERINARY SCIENCE; HYGIENE
- A61B—DIAGNOSIS; SURGERY; IDENTIFICATION
- A61B8/00—Diagnosis using ultrasonic, sonic or infrasonic waves
- A61B8/52—Devices using data or image processing specially adapted for diagnosis using ultrasonic, sonic or infrasonic waves
- A61B8/5215—Devices using data or image processing specially adapted for diagnosis using ultrasonic, sonic or infrasonic waves involving processing of medical diagnostic data
- A61B8/5223—Devices using data or image processing specially adapted for diagnosis using ultrasonic, sonic or infrasonic waves involving processing of medical diagnostic data for extracting a diagnostic or physiological parameter from medical diagnostic data
-
- A—HUMAN NECESSITIES
- A61—MEDICAL OR VETERINARY SCIENCE; HYGIENE
- A61B—DIAGNOSIS; SURGERY; IDENTIFICATION
- A61B8/00—Diagnosis using ultrasonic, sonic or infrasonic waves
- A61B8/52—Devices using data or image processing specially adapted for diagnosis using ultrasonic, sonic or infrasonic waves
- A61B8/5292—Devices using data or image processing specially adapted for diagnosis using ultrasonic, sonic or infrasonic waves using additional data, e.g. patient information, image labeling, acquisition parameters
-
- G—PHYSICS
- G01—MEASURING; TESTING
- G01S—RADIO DIRECTION-FINDING; RADIO NAVIGATION; DETERMINING DISTANCE OR VELOCITY BY USE OF RADIO WAVES; LOCATING OR PRESENCE-DETECTING BY USE OF THE REFLECTION OR RERADIATION OF RADIO WAVES; ANALOGOUS ARRANGEMENTS USING OTHER WAVES
- G01S7/00—Details of systems according to groups G01S13/00, G01S15/00, G01S17/00
- G01S7/52—Details of systems according to groups G01S13/00, G01S15/00, G01S17/00 of systems according to group G01S15/00
- G01S7/52017—Details of systems according to groups G01S13/00, G01S15/00, G01S17/00 of systems according to group G01S15/00 particularly adapted to short-range imaging
- G01S7/52023—Details of receivers
- G01S7/52033—Gain control of receivers
-
- G—PHYSICS
- G01—MEASURING; TESTING
- G01S—RADIO DIRECTION-FINDING; RADIO NAVIGATION; DETERMINING DISTANCE OR VELOCITY BY USE OF RADIO WAVES; LOCATING OR PRESENCE-DETECTING BY USE OF THE REFLECTION OR RERADIATION OF RADIO WAVES; ANALOGOUS ARRANGEMENTS USING OTHER WAVES
- G01S7/00—Details of systems according to groups G01S13/00, G01S15/00, G01S17/00
- G01S7/52—Details of systems according to groups G01S13/00, G01S15/00, G01S17/00 of systems according to group G01S15/00
- G01S7/52017—Details of systems according to groups G01S13/00, G01S15/00, G01S17/00 of systems according to group G01S15/00 particularly adapted to short-range imaging
- G01S7/52023—Details of receivers
- G01S7/52036—Details of receivers using analysis of echo signal for target characterisation
-
- G—PHYSICS
- G16—INFORMATION AND COMMUNICATION TECHNOLOGY [ICT] SPECIALLY ADAPTED FOR SPECIFIC APPLICATION FIELDS
- G16H—HEALTHCARE INFORMATICS, i.e. INFORMATION AND COMMUNICATION TECHNOLOGY [ICT] SPECIALLY ADAPTED FOR THE HANDLING OR PROCESSING OF MEDICAL OR HEALTHCARE DATA
- G16H50/00—ICT specially adapted for medical diagnosis, medical simulation or medical data mining; ICT specially adapted for detecting, monitoring or modelling epidemics or pandemics
- G16H50/30—ICT specially adapted for medical diagnosis, medical simulation or medical data mining; ICT specially adapted for detecting, monitoring or modelling epidemics or pandemics for calculating health indices; for individual health risk assessment
-
- A—HUMAN NECESSITIES
- A61—MEDICAL OR VETERINARY SCIENCE; HYGIENE
- A61B—DIAGNOSIS; SURGERY; IDENTIFICATION
- A61B8/00—Diagnosis using ultrasonic, sonic or infrasonic waves
- A61B8/08—Clinical applications
-
- A—HUMAN NECESSITIES
- A61—MEDICAL OR VETERINARY SCIENCE; HYGIENE
- A61B—DIAGNOSIS; SURGERY; IDENTIFICATION
- A61B8/00—Diagnosis using ultrasonic, sonic or infrasonic waves
- A61B8/48—Diagnostic techniques
- A61B8/485—Diagnostic techniques involving measuring strain or elastic properties
Definitions
- the present invention relates to an ultrasonic observation apparatus which observes the tissue of a sample using ultrasonic waves, an operation method of the ultrasonic observation apparatus, and an operation program of the ultrasonic observation apparatus.
- Ultrasonic elastography is a technique using the fact that the hardness of cancer or tumor tissue in vivo varies depending on the progress of a disease or a living body.
- the distortion amount or elastic modulus of a living tissue in the examination site is measured using ultrasonic waves, and the result of the measurement is displayed as a tomographic image.
- Sensitivity Time Control (STC) correction is usually performed on received data (analog signal) for generating a B-mode image to add a higher amplification factor to the received data at a deep position (for example, see Patent Literature 2).
- a parametric ultrasonic system comprises an ultrasonic transducer assembly adaptable to provide ultrasonic signals at different angles from a plurality of voxels in a region of interest and a processor receiving the echo signals and extracting a parametric measurement for each of the voxels based on multiple frequency spectra from ultrasonic signals at different angles.
- A.KATOUZIAN ET AL. "Challenges in atherosclerotic plaque characterization with intravascular ultrasound (IVUS): from data collection to classification.”
- IVUS intravascular ultrasound
- IEEE TRANS. INF.TECHNOL.BIOMED. (200805), vol. 12, no. 3, pages 315 - 327 , concerns a technique for atherosclerotic plaque characterization with intravascular ultrasound.
- the amplitude of an analog signal waveform is amplified evenly over the entire frequency band only and an effect of correcting the attenuation dependent on the frequency is not achieved. Therefore, when the B-mode image using the amplitude of the ultrasonic wave is generated, a sufficient effect is obtainable by performing the STC correction, but, there is problem that when tissue characteristics of a sample are identified based on a frequency spectrum, influence of the attenuation accompanying the transmission of the ultrasonic wave is not able to be correctly eliminated and accuracy of the identification is reduced.
- a received signal subjected to the STC correction may be output, while when generating an image based on the frequency spectrum, a new transmission different from a transmission for generating the B-mode image may be performed and a received signal not subjected to the STC correction may be output.
- a frame rate of image data generated based on the received signal is reduced.
- the present invention has been made in view of the above and it is an object of the present invention to provide an ultrasonic observation apparatus, a method of operating the ultrasonic observation apparatus, and an operation program of the ultrasonic observation apparatus that are able to correctly eliminate influence of attenuation accompanying transmission of an ultrasonic wave and prevent a reduction in a frame rate of image data generated based on a received ultrasonic wave.
- an ultrasonic observation apparatus comprises the features of claim 1.
- the ultrasonic observation apparatus is characterized in that the amplification factor in performing the amplification using the signal amplifier monotonically increases at a receiving depth of up to a predetermined receiving depth.
- the ultrasonic observation apparatus is characterized in that the feature data extractor has: an approximation unit which extracts pre-correction feature data before performing the attenuation correction process by subjecting the frequency spectrum calculated by the frequency analyzer to the approximation process; and an attenuation corrector which extracts feature data of the frequency spectrum by subjecting the pre-correction feature data extracted by the approximation unit to the attenuation correction process.
- the ultrasonic observation apparatus is characterized in that the feature data extractor has: an attenuation corrector which subjects the frequency spectrum to the attenuation correction process; and an approximation unit which extracts feature data of the frequency spectrum by subjecting the frequency spectrum corrected by the attenuation corrector to the approximation process.
- the ultrasonic observation apparatus is characterized in that the greater the receiving depth of the ultrasonic wave, the greater the correction amount the attenuation corrector performs correction with.
- the ultrasonic observation apparatus further includes a controller which allows the correction of the amplification corrector and the correction of the attenuation corrector to be collectively performed.
- the ultrasonic observation apparatus is characterized in that the approximation unit approximates the frequency spectrum with a polynomial through regression analysis.
- the ultrasonic observation apparatus is characterized in that the approximation unit approximates the frequency spectrum with a linear expression, and extracts a plurality of pieces of feature data including at least two of a gradient of the linear expression, an intercept of the linear expression, and a strength which is determined using the gradient, the intercept, and a specific frequency included in the frequency band of the frequency spectrum.
- the ultrasonic observation apparatus further includes: a storage unit which stores the feature data of the frequency spectrum extracted on the basis of ultrasonic waves reflected by a plurality of known samples in association with tissue characteristics of the plurality of known samples; and a tissue characteristic determination unit which determines a tissue characteristic of a predetermined area of the sample by using the feature data stored in association with the plurality of known samples in the storage unit and the feature data extracted by the feature data extractor.
- the ultrasonic observation apparatus is characterized in that the feature data extractor extracts a plurality of pieces of feature data, the storage unit stores averages of the respective pieces of feature data in groups classified in accordance with the tissue characteristics with respect to the plurality of known samples, and the tissue characteristic determination unit sets a feature data space having at least one of the plurality of pieces of feature data as a component, and determines a tissue characteristic of the sample on the basis of a distance on the feature data space between a sample point which has, as a coordinate of the feature data space, feature data which is a component of the feature data space from among the pieces of feature data of the frequency spectrum of the sample and a known sample average point which has, as a coordinate of the feature data space, an average of feature data which is a component of the feature data space from among the respective pieces of feature data in the groups of the plurality of known samples.
- the ultrasonic observation apparatus is characterized in that the tissue characteristic determination unit calculates a standard deviation of the feature data in a population in which the feature data of the sample is added to the groups classified in accordance with the tissue characteristics of the plurality of known samples, and determines, as a tissue characteristic of the sample, a tissue characteristic corresponding to a group having feature data which is minimum in terms of a difference between the standard deviation and a standard deviation of feature data in the groups.
- the ultrasonic observation apparatus is characterized in that the visual information is a variable constituting a color space.
- a method of operating an ultrasonic observation apparatus comprises the features of claim 11.
- an operation program of an ultrasonic observation apparatus comprises the features of claim 12.
- the present invention by generating B-mode image data on the basis of a signal which is subjected to STC correction for amplification with an amplification factor according to a receiving depth, and after performing amplification correction for offsetting the influence of the STC correction and making the amplification factor spectrum-constant, performing an approximation process and an attenuation correction process with respect to the frequency spectrum to reduce the contribution of the attenuation occurring in accordance with the receiving depth of the ultrasonic wave and the frequency in transmitting the ultrasonic wave, feature data of a sample is extracted and feature data image data is generated to display visual information corresponding to the extracted feature data, and therefore, not only the influence of the attenuation accompanying the transmission of the ultrasonic wave is properly eliminated in the feature data image data but also it is unnecessary to distinguish between the signal for the B-mode image and the signal for the feature data image in sending them. Therefore, it is possible to properly eliminate the influence of the attenuation accompanying the transmission of the ultrasonic wave, and also prevent reduction in the frame rate
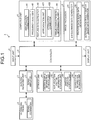
- FIG. 1 is a block diagram illustrating the configuration of an ultrasonic observation apparatus according to a first embodiment of the invention.
- the ultrasonic observation apparatus 1 illustrated in FIG. 1 is an apparatus which observes a sample using ultrasonic waves.
- the ultrasonic observation apparatus 1 is provided with an ultrasonic probe 2 which outputs an ultrasonic pulse to the outside and receives an externally-reflected ultrasonic echo, a sending/receiving unit 3 which sends and receives an electric signal to and from the ultrasonic probe 2, a computing unit 4 which subjects an electric echo signal obtained by converting an ultrasonic echo to predetermined computing, an image processor 5 which generates image data corresponding to an electric echo signal obtained by converting an ultrasonic echo, an input unit 6 which is realized using an interface such as a keyboard, a mouse, and a touch panel and receives input of various information, a display unit 7 which is realized using a display panel formed of liquid crystal, organic EL, or the like and displays various information including an image generated by the image processor 5, a storage unit 8 which stores various information including information related to the tissue characteristics of known samples, and a controller 9 which controls the operation of the ultrasonic observation apparatus 1.
- an ultrasonic probe 2 which outputs an ultrasonic pulse to the outside and receives an externally-reflected
- the ultrasonic probe 2 has a signal converter 21 which converts an electric pulse signal received from the sending/receiving unit 3 into an ultrasonic pulse (acoustic pulse signal) and converts an ultrasonic echo reflected from an exterior sample into an electric echo signal.
- the ultrasonic probe 2 may mechanically scan an ultrasonic transducer, or may electronically scan a plurality of ultrasonic transducers.
- the sending/receiving unit 3 is electrically connected to the ultrasonic probe 2 to send a pulse signal to the ultrasonic probe 2 and to receive an echo signal as a received signal from the ultrasonic probe 2. Specifically, the sending/receiving unit 3 generates a pulse signal on the basis of a waveform and sending timing which are set in advance, and sends the generated pulse signal to the ultrasonic probe 2.
- the sending/receiving unit 3 has a signal amplifier 31 which amplifies an echo signal. Specifically, the signal amplifier 31 performs STC correction so that the higher the receiving depth of an echo signal, the higher the amplification factor the signal is amplified with.
- FIG. 2 is a diagram illustrating the relationship between a receiving depth of an echo signal and an amplification factor. A receiving depth z shown in FIG. 2 is an amount which is calculated on the basis of an elapsed time from a time point at which reception of an ultrasonic wave is started. As shown in FIG.
- an amplification factor ⁇ linearly increases from ⁇ 0 to ⁇ th (> ⁇ 0 ) with an increase of the receiving depth z when the receiving depth z is less than a threshold z th .
- the amplification factor ⁇ takes a certain value ⁇ th when the receiving depth z is equal to or greater than the threshold z th .
- the value of the threshold z th is a value at which the ultrasonic signal received from a sample is almost attenuated and noise is thus dominant. More generally, the amplification factor ⁇ may monotonically increase with an increase of the receiving depth z when the receiving depth z is less than the threshold z th .
- the sending/receiving unit 3 subjects the echo signal amplified by the signal amplifier 31 to a process such as filtering, and then A/D converts the processed signal to generate and output a digital RF signal.
- the sending/receiving unit 3 has a multichannel circuit for beam synthesis corresponding to the plurality of ultrasonic transducers.
- the computing unit 4 has an amplification corrector 41 which performs amplification correction to make the amplification factor constant with respect to the digital RF signal output from the sending/receiving unit 3 regardless of the receiving depth, a frequency analyzer 42 which subjects the digital RF signal subjected to the amplification correction to fast Fourier transform (FFT) to analyze the frequency, a feature data extractor 43 which subjects the frequency spectrum (power spectrum) calculated by the frequency analyzer 42 to an approximation process and a correction process for reducing the contribution of the attenuation of the ultrasonic wave depending on the receiving depth and the frequency of the ultrasonic wave to extract the feature data of the frequency spectrum, and a tissue characteristic determination unit 44 which determines the tissue characteristic of a predetermined area of a sample by using the feature data extracted by the feature data extractor 43.
- FFT fast Fourier transform
- FIG. 3 is a diagram illustrating the relationship between a receiving depth and an amplification factor in the amplification process which is performed by the amplification corrector 41.
- the amplification factor of the amplification process which is performed by the amplification corrector 41 is a maximum value ⁇ th - ⁇ 0 at a receiving depth of zero, is linearly reduced at a receiving depth of up to a receiving depth z th , and is zero at the receiving depth z th or greater.
- the influence of the STC correction in the signal amplifier 31 can be offset, and a signal of the certain amplification factor ⁇ th can be output.
- the relationship between the receiving depth z and the amplification factor ⁇ achieved in the amplification corrector 41 varies in accordance with the relationship between the receiving depth and the amplification factor in the signal amplifier 31.
- the frequency analyzer 42 subjects an FFT data group formed of a predetermined data amount to a fast Fourier transform to calculate a frequency spectrum.
- the frequency spectrum tends to vary depending on the tissue characteristic of a sample. The reason for this is that the frequency spectrum is correlated with the size, density, acoustic impedance, and the like of a sample as a scatterer which scatters an ultrasonic wave.
- the feature data extractor 43 has an approximation unit 431 which approximates the frequency spectrum calculated by the frequency analyzer 42 to calculate pre-correction feature data before performing an attenuation correction process, and an attenuation corrector 432 which subjects the pre-correction feature data approximated by the approximation unit 431 to an attenuation correction process to extract the feature data.
- the approximation unit 431 approximates the frequency spectrum with a linear expression through regression analysis to extract pre-correction feature data characterizing the linear expression. Specifically, the approximation unit 431 calculates a gradient a 0 and an intercept b 0 of the linear expression through regression analysis, and calculates, as pre-correction feature data, a strength at a specific frequency in the frequency band in the frequency spectrum.
- the "strength" is any of parameters such as voltage, electric power, sound pressure, acoustic energy, and the like.
- the gradient a 0 is correlated with the size of an ultrasonic scatterer, and generally, the greater the size of the scatterer, the less the value of the gradient.
- the intercept b 0 is correlated with the size of a scatterer, the difference in the acoustic impedance, the density (concentration) of a scatterer, and the like. Specifically, it is thought that the greater the size of the scatterer, the greater the value of the intercept b 0 , the greater the size of the acoustic impedance, the greater the value of the intercept b 0 , and the greater the density (concentration) of the scatterer, the greater the value of the intercept b 0 .
- the strength c 0 at the center frequency f MID (hereinafter, simply referred to as "strength") is an indirect parameter derived from the gradient a 0 and the intercept b 0 , and gives a spectrum strength at the center in an effective frequency band. Therefore, it is thought that the strength c 0 is correlated to some degree with the brightness of a B-mode image in addition to the size of a scatterer, the difference in the acoustic impedance, and the density of a scatterer.
- the approximate polynomial which is calculated by the feature data extractor 43 is not limited to the linear expression, and a quadratic or higher-order approximate polynomial can also be used.
- ⁇ is an attenuation rate
- z is the receiving depth of an ultrasonic wave
- f is a frequency.
- the attenuation amount A is proportional to the frequency f.
- the specific value of the attenuation rate ⁇ is, in the case of a living body, in the range of 0 to 1.0 (dB/cm/MHz), and preferably 0.3 to 0.7 (dB/cm/MHz), and it is determined in accordance with the type of an observation target organ.
- ⁇ 0.6 (dB/cm/MHz) is determined.
- a configuration can also be employed in which the value of the attenuation rate ⁇ can be changed by an input from the input unit 6.
- the greater the receiving depth z of the ultrasonic wave the greater the correction amount the attenuation corrector 432 performs correction with.
- the correction related to the intercept is an identical transformation. The reason for this is that the intercept is a frequency component corresponding to 0 frequency (Hz) and is not subjected to attenuation.
- the tissue characteristic determination unit 44 calculates, for each feature data, an average and a standard deviation of the feature data of the frequency spectrum extracted by the feature data extractor 43 and corrected by the attenuation corrector 432.
- the tissue characteristic determination unit 44 determines the tissue characteristic of a predetermined area of a sample by using the calculated average and standard deviation and by using averages and standard deviations of the feature data of frequency spectrums of known samples which are stored in the storage unit 8.
- the "predetermined area” is an area in an image which is designated by an operator of the ultrasonic observation apparatus 1, who has seen the image generated by the image processor 5, using the input unit 6 (hereinafter, referred to as "area of interest").
- tissue characteristic is any of cancer, endocrine tumor, mucinous tumor, normal tissue, normal blood vessel, and the like.
- sample is a pancreas, chronic pancreatitis, autoimmune pancreatitis, and the like are also included as tissue characteristics.
- the average and the standard deviation of the feature data which are calculated by the tissue characteristic determination unit 44 reflect a change at a cell level such as enlargement of a nucleus and variants and a change in the tissue such as hyperplasia of fibers and substitution with fibers of a parenchymal tissue in an interstitium, and shows unique values in accordance with the tissue characteristic. Accordingly, the tissue characteristic of a predetermined area of a sample can be accurately determined by using the average and the standard deviation of the feature data.
- the image processor 5 has a B-mode image data generator 51 which generates B-mode image data from an echo signal, a feature data image data generator 52 which generates feature data image data to display visual information corresponding to the feature data of a sample, and a determination result display image data generator 53 which generates determination result display image data to display a determination result of the tissue characteristic of the area of interest and information related to the determination result by using the data output by the B-mode image data generator 51 and the computing unit 4.
- the B-mode image data generator 51 subjects a digital signal to a signal process using a known technique such as a band-pass filter, logarithmic transformation, gain processing, or contrast processing, and performs data culling according to a data step width determined in accordance with the display range of an image in the display unit 7 to generate B-mode image data.
- a known technique such as a band-pass filter, logarithmic transformation, gain processing, or contrast processing
- the visual information to be used in generating the feature data image data by the feature data image data generator 52 is a variable constituting a color space such as a RGB color system having R (red), G (green), and B (blue) as variables.
- the determination result display image data generator 53 generates determination result display image data including the B-mode image data generated by the B-mode image data generator 51, the feature data image data generated by the feature data image data generator 52, the feature data extracted by the feature data extractor 43, and the determination result obtained by determination of the tissue characteristic determination unit 44.
- the storage unit 8 is provided with a known sample information storage unit 81 which stores information of known samples, an amplification factor information storage unit 82 which stores information of the amplification factor referred to when the signal amplifier 31 and the amplification corrector 41 perform an amplification process, a window function storage unit 83 which stores a window function to be used in the frequency analysis process which is performed by the frequency analyzer 42, and a correction information storage unit 84 which stores correction information referred to when the attenuation corrector 432 performs a process.
- a known sample information storage unit 81 which stores information of known samples
- an amplification factor information storage unit 82 which stores information of the amplification factor referred to when the signal amplifier 31 and the amplification corrector 41 perform an amplification process
- a window function storage unit 83 which stores a window function to be used in the frequency analysis process which is performed by the frequency analyzer 42
- a correction information storage unit 84 which stores correction information referred to when the attenuation corrector 432 performs a process
- the known sample information storage unit 81 stores feature data of the frequency spectrums extracted with respect to known samples in association with the tissue characteristics of the known samples.
- the known sample information storage unit 81 stores, with respect to the feature data of the frequency spectrum related to the known samples, an average and a standard deviation calculated for each of the groups classified on the basis of the tissue characteristics of the known samples in addition to all pieces of feature data of the known samples.
- the feature data of the known samples is extracted in the same manner as in the first embodiment. However, there is no need that the ultrasonic observation apparatus 1 should perform the process of extracting the feature data of the known samples. It is desirable that the information of the known samples stored in the known sample information storage unit 81 has high reliability in terms of the tissue characteristics.
- the amplification factor information storage unit 82 stores the relationships between the amplification factor and the receiving depth, which are shown in FIGS. 2 and 3 .
- the window function storage unit 83 stores at least one of the window functions such as Hamming, Hanning, and Blackman.
- the correction information storage unit 84 stores information related to the conversion of Expressions (2) to (4).
- the storage unit 8 is realized using a ROM which stores an operating program of the ultrasonic observation apparatus according to the first embodiment, a program for operating a predetermined OS, and the like in advance, a RAM which stores computing parameters and data of the respective processes, or the like.
- the constituent elements other than the ultrasonic probe 2 of the ultrasonic observation apparatus 1 having the above-described functions and configurations are realized using a computer provided with a CPU having a computing function and a control function.
- the CPU of the ultrasonic observation apparatus 1 reads out the information stored in the storage unit 8 and various programs including the above-described operating program of the ultrasonic observation apparatus from the storage unit 8 to execute a computing process related to a method of operating the ultrasonic observation apparatus according to the first embodiment.
- the operating program of the ultrasonic observation apparatus can also be stored on a computer readable recording medium such as a hard disk, a flash memory, a CD-ROM, a DVD-ROM, or a flexible disk to be widely distributed.
- a computer readable recording medium such as a hard disk, a flash memory, a CD-ROM, a DVD-ROM, or a flexible disk to be widely distributed.
- FIG. 4 is a flowchart illustrating the outline of a process of the ultrasonic observation apparatus 1 having the above-described configurations.
- the ultrasonic observation apparatus 1 measures a new sample using the ultrasonic probe 2 (Step S1).
- the signal amplifier 31 receiving an echo signal from the ultrasonic probe 2 amplifies the echo signal (Step S2).
- the signal amplifier 31 performs amplification on the basis of the relationship between the amplification factor and the receiving depth shown in FIG. 2 .
- the B-mode image data generator 51 generates B-mode image data using an echo signal for a B-mode image which is output from the sending/receiving unit 3 (Step S3).
- FIG. 5 is a diagram illustrating a display example of a B-mode image in the display unit 7.
- a B-mode image 100 shown in FIG. 5 is a gray scale image in which values of R (red), G (green), and B (blue), which are variables when a RGB color system is employed as a color space, are matched.
- Step S5 when an area of interest is set through the input unit 6 (Step S5: Yes), the amplification corrector 41 performs correction to make the amplification factor constant with respect to the signal output from the sending/receiving unit 3 regardless of the receiving depth (Step S6).
- the amplification corrector 41 performs an amplification process on the basis of the relationship between the amplification factor and the receiving depth shown in FIG. 3 .
- Step S5: No when no area of interest is set (Step S5: No), the ultrasonic observation apparatus 1 terminates the process when an instruction for terminating the process is input by the input unit 6 (Step S7: Yes). On the contrary, when no area of interest is set (Step S5: No), the ultrasonic observation apparatus 1 returns to Step S5 when an instruction for terminating the process is not input by the input unit 6 (Step S7: No).
- Step S6 the frequency analyzer 42 calculates a frequency spectrum by analyzing the frequency through FFT computing (Step S8).
- the entire image area can also be set as an area of interest.
- the frequency analyzer 42 sets an acoustic ray number L of an acoustic ray which is an analysis target as an initial value L 0 (Step S21).
- the initial value L 0 may be imparted to, for example, an acoustic ray which is initially received by the sending/receiving unit 3, or an acoustic ray corresponding to a boundary position on one of the right and left sides of the area of interest set by the input unit 6.
- the frequency analyzer 42 calculates frequency spectrums of all of a plurality of data positions set on one acoustic ray.
- the frequency analyzer 42 sets an initial value Z 0 of a data position Z (corresponding to the receiving depth) representing a series of data groups (FFT data groups) acquired for FFT computing (Step S22).
- FIG. 7 is a diagram schematically illustrating data arrangement of one acoustic ray.
- the white or black rectangle means one data.
- the acoustic ray LD is made discrete at time intervals corresponding to a sampling frequency (for example, 50 MHz) in A/D conversion which is performed by the sending/receiving unit 3.
- FIG. 7 shows the case in which the first data of the acoustic ray LD is set as the initial value Z 0 of the data position Z.
- FIG. 7 is a just an example, and the position of the initial value Z 0 can be arbitrarily set.
- a data position Z corresponding to an upper end position of the area of interest may be set as the initial value Z 0 .
- the frequency analyzer 42 acquires an FFT data group at the data position Z (Step S23) and allows a window function stored in the window function storage unit 83 to act on the acquired FFT data group (Step S24).
- the window function acts on the FFT data group in this manner, discontinuity of the FFT data groups at the boundary can be avoided, and an artifact can be prevented from occurring.
- the frequency analyzer 42 determines whether or not the FFT data group at the data position Z is a normal data group (Step S25).
- the FFT data group has 2 n (n is a positive integer) pieces of data.
- the normal FFT data group means that the data position Z is a 2 n-1 -th position from the front in the FFT data group.
- the FFT data groups F 2 , F 3 , and F K-1 are normal, and the FFT data groups F 1 and F K are abnormal.
- Step S25 when the FFT data group at the data position Z is normal (Step S25: Yes), the frequency analyzer 42 proceeds to Step S27 to be described later.
- Step S25 when the FFT data group at the data position Z is not normal (Step S25: No), the frequency analyzer 42 generates a normal FFT data group by inserting zero data by a shortfall (Step S26).
- a window function acts before the addition of zero data. Therefore, data discontinuity does not occur even when zero data is inserted into the FFT data group.
- Step S26 the frequency analyzer 42 proceeds to Step S27 to be described later.
- Step S27 the frequency analyzer 42 obtains a frequency spectrum by performing FFT computing using the FFT data group (Step S27).
- FIGS. 8 and 9 are diagrams illustrating an example of the frequency spectrum calculated by the frequency analyzer 42.
- a horizontal axis f represents a frequency
- a vertical axis I represents a strength.
- frequency spectrum curves C 1 and C 2 shown in FIGS. 8 and 9 respectively, a minimum frequency f LOW and a maximum frequency f HIGH of the frequency spectrum are parameters which are determined on the basis of the frequency band of the ultrasonic probe 2, the frequency band of the pulse signal sent from the sending/receiving unit 3, and the like.
- f LOW 3 MHz
- f HIGH 10 MHz.
- a straight line L 1 shown in FIG. 8 and a straight line L 2 shown in FIG. 9 will be described in a description about a feature data extraction process.
- the curve and the straight line are formed of a set of discrete points. The same is true of embodiments to be described later.
- the frequency analyzer 42 adds a predetermined data step width D to the data position Z to calculate a data position Z of a FFT data group which is a next analysis target (Step S28).
- the data step width D is made equal to a data step width which is used in generating B-mode image data by the B-mode image data generator 51.
- the data step width D may be set to be greater than the data step width which is used by the B-mode image data generator 51.
- the frequency analyzer 42 determines whether or not the data position Z is greater than a final data position Z max (Step S29).
- the final data position Z max may be a data length of the acoustic ray LD, or may be a data position corresponding to a lower end of the area of interest.
- the frequency analyzer 42 increases an acoustic ray number L by 1 (Step S30).
- the frequency analyzer 42 returns to Step S23.
- [X] represents a maximum integer not exceeding X.
- Step S31: Yes When the acoustic lay number L increased in Step S30 is greater than a final acoustic ray number L max (Step S31: Yes), the frequency analyzer 42 returns to the main routine shown in FIG. 4 . On the other hand, when the acoustic lay number L increased in Step S30 is equal to or less than the final acoustic ray number L max (Step S31: No), the frequency analyzer 42 returns to Step S22.
- the frequency analyzer 42 performs FFT computing K times for each of (L max - L 0 + 1) acoustic rays.
- the final acoustic ray number L max may be imparted to, for example, an acoustic ray which is finally received by the sending/receiving unit 3, or an acoustic ray corresponding to a boundary on one of the right and left sides of the area of interest.
- the total number (L max - L 0 + 1) ⁇ K of FFT computing operations performed for all of the acoustic rays by the frequency analyzer 42 is represented by P.
- the approximation unit 431 subjects the P frequency spectrums calculated by the frequency analyzer 42 to regression analysis as an approximation process to extract pre-correction feature data (Step S9). Specifically, the approximation unit 431 calculates a linear expression for approximating the frequency spectrum of the frequency band f LOW ⁇ f ⁇ f HIGH through regression analysis, and thus extracts a gradient a 0 , an intercept b 0 , and a strength c 0 characterizing the linear expression as pre-correction feature data.
- the straight line L 1 shown in FIG. 8 and the straight line L 2 shown in FIG. 9 are regression lines which are obtained by subjecting the frequency spectrum curves C 1 and C 2 to a feature data extraction process in Step S9.
- the attenuation corrector 432 subjects the pre-correction feature data extracted by the approximation unit 431 to an attenuation correction process (Step S10).
- a sampling frequency of the data is 50 MHz
- the time interval of data sampling is 20 (nsec).
- the speed of sound is 1,530 (m/sec)
- the data position Z is 0.0153k (mm).
- the attenuation corrector 432 substitutes the value of the data position Z obtained as above for the receiving depths z of the above-described Expressions (2) to (4) to calculate a gradient a, an intercept b, and a strength c which are feature data of the frequency spectrum.
- FIG. 10 is a diagram illustrating a straight line which is determined by feature data, related to the straight line L 1 shown in FIG. 8 , subjected to attenuation correction.
- the tissue characteristic determination unit 44 determines a tissue characteristic in the area of interest of the sample on the basis of the feature data extracted by the feature data extractor 43 and corrected by the attenuation corrector 432 and the known sample information stored in the known sample information storage unit 81 (Step S11).
- the tissue characteristic determination unit 44 sets a feature data space to be used in determining the tissue characteristic (Step S41).
- two of the three pieces of feature data that is, a gradient a, an intercept b, and a strength c, are independent parameters. Accordingly, a two-dimensional space with optional two of the three pieces of feature data as components can be set as a feature data space. In addition, a one-dimensional space with optional one of the three pieces of feature data as a component can also be set as the feature data space.
- the feature data space to be set is determined in advance, the operator may select a desired feature data space through the input unit 6.
- FIG. 12 is a diagram illustrating an example of the feature data space set by the tissue characteristic determination unit 44.
- the horizontal axis represents the intercept b
- the vertical axis represents the strength c.
- the point Sp shown in FIG. 12 represents a point having the intercept b and the strength c as coordinates of the feature data space, which have been calculated with respect to a sample as a determination target (hereinafter, this point is referred to as "sample point").
- the areas G ⁇ , G ⁇ , and G ⁇ shown in FIG. 12 represent groups in which the tissue characteristics of known samples stored in the known sample information storage unit 81 are ⁇ , ⁇ , and ⁇ , respectively. In the case shown in FIG. 12 , each of the three groups G ⁇ , G ⁇ , and G ⁇ is present in an area which does not intersect with other groups on the feature data space.
- tissue characteristics are classified and determined using the feature data as an index, obtained by subjecting the pre-correction feature data of the frequency spectrum obtained by frequency analysis to attenuation correction. Accordingly, the tissue characteristics different from each other can be sharply distinguished.
- the areas of the respective tissue characteristics in the feature data space can be separated more clearly than in the case in which feature data extracted without performing attenuation correction is used.
- the tissue characteristic determination unit 44 calculates distances d ⁇ , d ⁇ , and d ⁇ on the feature data space between the sample point Sp and points ⁇ 0 , ⁇ 0 , and ⁇ 0 (hereinafter, these points are referred to as "known sample average points") which have, as coordinates in the feature data space, an average of the intercept b and an average of the strength c of the frequency spectrum of the FFT data group included in the groups G ⁇ , G ⁇ , and G ⁇ , respectively (Step S42).
- the scales of the b-axis component and the c-axis component in the feature data space are significantly different from each other, it is desirable to appropriately perform weighting for approximately equalizing the contribution of each distance.
- the tissue characteristic determination unit 44 determines tissue characteristics of all of sample points including the sample point Sp on the basis of the distances calculated in Step S42 (Step S43). For example, in the case shown in FIG. 12 , the distance d ⁇ is the minimum, and thus the tissue characteristic determination unit 44 determines that the tissue characteristic of the sample is ⁇ .
- the sample point Sp is extremely distant from the known sample average points ⁇ 0 , ⁇ 0 , and ⁇ 0 , the result of the tissue characteristic determination has low reliability even when minimum values of the distances d ⁇ , d ⁇ , and d ⁇ are obtained.
- the tissue characteristic determination unit 44 may output an error signal.
- the tissue characteristic determination unit 44 may select all of the tissue characteristics corresponding to the minimum values as candidates, or may select any one tissue characteristic in accordance with a predetermined rule. Examples of the latter case include a method in which the priority of a highly malignant tissue characteristic such as cancer is set to be high.
- the tissue characteristic determination unit 44 may output an error signal.
- the tissue characteristic determination unit 44 outputs the distance calculation result in Step S42 and the determination result in Step S43 (Step S44). Accordingly, the tissue characteristic determination process in Step S11 is terminated.
- the feature data image data generator 52 After the above-described Step S11, the feature data image data generator 52 generates feature data image data to display visual information corresponding to the feature data extracted by the feature data extractor 43 (Step S12).
- the determination result display image data generator 53 generates determination result display image data using the B-mode image data generated by the B-mode image data generator 51, the feature data calculated by the feature data extractor 43, the feature data image data generated by the feature data image data generator 52, and the determination result obtained by the tissue characteristic determination unit 44 (Step S13).
- FIG. 13 is a diagram illustrating a display example of the determination result display image which is displayed by the display unit 7.
- a determination result display image 200 shown in FIG. 13 has an information display unit 201 which displays various related information including the result of the tissue characteristic determination and an image display unit 202 which displays a feature data image to display the feature data on the basis of the B-mode image.
- the information display unit 201 displays identification information (ID number, name, sex, and the like) of a sample, the tissue characteristic determination result calculated by the tissue characteristic determination unit 44, information related to the feature data in determining the tissue characteristic, and ultrasonic image quality information such as gain and contrast.
- identification information ID number, name, sex, and the like
- information related to the feature data it is possible to perform a display using averages and standard deviations of the feature data of the frequency spectrums of FFT data of Q groups positioned inside the area of interest.
- a feature data image 300 which is displayed on the image display unit 202 is a gray scale image in which regarding the B-mode image 100 shown in FIG. 5 , the intercept b is uniformly assigned to R (red), G (green), and B (blue).
- the display unit 7 displays the determination result display image 200 having the above-described configuration, the operator can more accurately grasp the tissue characteristic of the area of interest.
- the determination result display image is not limited to the above-described configuration.
- the feature data image and the B-mode image may be displayed next to each other as the determination result display image. Accordingly, the difference between both of the images can be recognized on the one screen.
- FIG. 14 is a diagram explaining an effect of the attenuation correction process which is performed by the ultrasonic observation apparatus 1.
- An image 400 shown in FIG. 14 is a feature data image when attenuation correction is not performed.
- the signal strength is reduced due to the influence of attenuation in an area with a high receiving depth (lower area in FIG. 14 ), whereby the image becomes dark.
- the feature data images 300 shown in FIGS. 13 and 14 are just an example.
- three feature data items a', b', and c' can be assigned to R, G, and B, respectively, to display a feature data image by a color image.
- the tissue characteristic is expressed with a unique color
- the operator can grasp the tissue characteristic of the area of interest on the basis of the color distribution of the image.
- the color space may be formed of, in place of the RGB color system, variables which are complementary colors such as cyan, magenta, and yellow, and feature data may be assigned to the respective variables.
- the B-mode image data and the color image data may be mixed at a predetermined ratio to generate the feature data image data.
- only the area of interest may be substituted with color image data to generate the feature data image data.
- B-mode image data is generated on the basis of a signal which is subjected to STC correction for amplification with an amplification factor according to the receiving depth.
- pre-correction feature data is extracted by performing amplification correction for offsetting the influence of the STC correction and for thereby making the amplification factor spectrum-constant, and by then calculating the frequency spectrum, feature data of a sample is extracted by subjecting the extracted pre-correction feature data to attenuation correction, and feature data image data is generated to display visual information corresponding to the extracted feature data.
- the influence of the attenuation accompanying the transmission of an ultrasonic wave is eliminated in the feature data image data, and it is not necessary to separately send a signal for a B-mode image and a signal for a feature data image. Accordingly, it is possible to properly eliminate the influence of the attenuation accompanying the transmission of an ultrasonic wave, and also possible to prevent a reduction in the frame rate of image data generated on the basis of the received ultrasonic wave.
- the tissue characteristic of a predetermined area of a sample is determined by using the feature data of the frequency spectrum properly subjected to attenuation correction, the difference between tissues can be sharply distinguished without using the distortion amount or elastic modulus of a living tissue. Accordingly, the tissue characteristic can be accurately distinguished and the reliability of the observation result can be improved.
- the controller 9 may allow the amplification correction process using the amplification corrector 41 and the attenuation correction process using the attenuation corrector 432 to be collectively performed.
- the amplification process in Step S6 of FIG. 4 is deleted and the definition of the attenuation amount of the attenuation correction process in Step S10 of FIG.
- a second embodiment of the invention is different from the first embodiment in terms of the feature data extraction which is performed by the feature data extractor.
- the configuration of an ultrasonic observation apparatus according to the second embodiment is the same as that of the ultrasonic observation apparatus 1 described in the first embodiment. Accordingly, in the following description, constituent elements corresponding to the constituent elements of the ultrasonic observation apparatus 1 will be denoted by the same signs.
- an attenuation corrector 432 subjects a frequency spectrum calculated by a frequency analyzer 42 to an attenuation correction process. Then, an approximation unit 431 subjects the frequency spectrum subjected to the attenuation correction using the attenuation corrector 432 to an approximation process to extract feature data of the frequency spectrum.
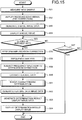
- FIG. 15 is a flowchart illustrating the outline of a process of the ultrasonic observation apparatus according to the second embodiment.
- processes in Steps S51 to S58 sequentially correspond to the processes in Steps S1 to S8 of FIG. 4 .
- Step S59 the attenuation corrector 432 subjects the frequency spectrum calculated by the frequency analyzer 42 through FFT computing to attenuation correction (Step S59).
- FIG. 16 is a diagram schematically illustrating the outline of the attenuation correction process in Step S59.
- the attenuation corrector 432 corrects a frequency spectrum curve C 3 at all of frequencies f so that the attenuation amount A of the above-described Expression (1) is added to a strength I, thereby obtaining a new frequency spectrum curve C 3 '. Accordingly, a frequency spectrum can be obtained in which the contribution of attenuation accompanying the transmission of an ultrasonic wave is reduced.
- the approximation unit 431 subjects all of the frequency spectrums subjected to the attenuation correction using the attenuation corrector 432 to regression analysis to extract feature data of the frequency spectrum (Step S60). Specifically, the approximation unit 431 performs regression analysis, thereby calculating a gradient a and an intercept b of a linear expression and a strength c at a center frequency f MID .
- a straight line L 3 shown in FIG. 16 is a regression line (intercept b 3 ) which is obtained by subjecting the frequency spectrum curve C 3 to a feature data extraction process in Step S60.
- Steps S61 to S64 sequentially correspond to the processes in Steps S11 to S14 of FIG. 4 .
- B-mode image data is generated on the basis of a signal which is subjected to STC correction for amplification with an amplification factor according to the receiving depth.
- amplification correction for offsetting the influence of the STC correction and for thereby making the amplification factor spectrum-constant is performed, a frequency spectrum is calculated and subjected to attenuation correction, and then feature data is extracted and feature data image data is generated to display visual information corresponding to the extracted feature data. Accordingly, the influence of the attenuation accompanying the transmission of an ultrasonic wave is eliminated in the feature data image data, and it is not necessary to separately send a signal for a B-mode image and a signal for a feature data image.
- the first embodiment it is possible to properly eliminate the influence of the attenuation accompanying the transmission of an ultrasonic wave, and also possible to prevent a reduction in the frame rate of image data generated on the basis of the received ultrasonic waves.
- the tissue characteristic of a predetermined area of a sample is determined by using the feature data of the frequency spectrum properly subjected to attenuation correction, the difference between tissues can be sharply distinguished without using the distortion amount or elastic modulus of a living tissue. Accordingly, the tissue characteristic can be accurately distinguished and the reliability of the observation result can be improved.
- the amplification correction process in Step S56 of FIG. 15 can be deleted and the attenuation amount in performing the attenuation correction of the frequency spectrum in Step S59 of FIG. 15 can be processed as A' of Expression (6).
- a third embodiment of the invention is different from the first embodiment in terms of the tissue characteristic determination process in the tissue characteristic determination unit.
- the configuration of an ultrasonic observation apparatus according to the third embodiment is the same as that of the ultrasonic observation apparatus 1 described in the first embodiment. Accordingly, in the following description, constituent elements corresponding to the constituent elements of the ultrasonic observation apparatus 1 will be denoted by the same signs.
- a tissue characteristic determination unit 44 adds feature data (a, b, c) to groups G ⁇ , G ⁇ , and G ⁇ (see FIG. 12 ) which constitute tissue characteristics ⁇ , ⁇ , and ⁇ , respectively, to constitute a new population, and then obtains a standard deviation for each feature data of data constituting each tissue characteristic.
- the tissue characteristic determination unit 44 calculates a difference (hereinafter, simply referred to as "standard deviation difference") between the standard deviation of each feature data of the groups G ⁇ , G ⁇ , and G ⁇ in the original population formed of known samples and the standard deviation of each feature data of the groups G ⁇ , G ⁇ , and G ⁇ in the new population having new samples added thereto, and determines the tissue characteristic corresponding to the group including the feature data which is minimum in the standard deviation difference as a tissue characteristic of the sample.
- standard deviation difference a difference
- the tissue characteristic determination unit 44 may calculate the standard deviation difference only with respect to the standard deviation of feature data selected in advance from a plurality of pieces of feature data.
- the feature data may be arbitrarily selected by an operator, or may be automatically selected by the ultrasonic observation apparatus 1.
- the tissue characteristic determination unit 44 may calculate a value for each group, by performing appropriate weighting to the standard deviation differences of all pieces of feature data and adding the weighted values, and may determine the tissue characteristic corresponding to the group which is minimum in terms of the value as a tissue characteristic of the sample.
- the tissue characteristic determination unit 44 calculates w a ⁇ (standard deviation difference of a) + w b ⁇ (standard deviation difference of b) + w c ⁇ (standard deviation difference of c) (where w a , w b , and w c are weights corresponding to the gradient a, the intercept b, and the strength c, respectively), and determines the tissue characteristic of the sample on the basis of the calculated value.
- the values of the weights w a , w b , and w c may be arbitrarily set by an operator, or may be automatically set by the ultrasonic observation apparatus 1.
- the tissue characteristic determination unit 44 may calculate a square root of a value which is calculated for each group by performing appropriate weighting to the squares of the standard deviation differences of all pieces of feature data and adding the weighted values, and may determine the tissue characteristic corresponding to the group which is minimum in terms of the square root as a tissue characteristic of the sample.
- the tissue characteristic determination unit 44 calculates ⁇ w' a ⁇ (standard deviation difference of a) 2 + w' b ⁇ (standard deviation difference of b) 2 + w' c ⁇ (standard deviation difference of c) 2 ⁇ 1/2 (where w' a , w' b , and w' c are weights corresponding to the gradient a, the intercept b, and the strength c, respectively), and determines the tissue characteristic on the basis of the calculated value.
- the values of the weights w' a , w' b , and w' c may be arbitrarily set by an operator, or may be automatically set by the ultrasonic observation apparatus 1.
- the third embodiment of the invention as in the above-described the first embodiment, it is possible to properly eliminate the influence of the attenuation accompanying the transmission of an ultrasonic wave, and also possible to prevent a reduction in the frame rate of image data generated on the basis of the received ultrasonic wave.
- the tissue characteristic can be accurately distinguished, and the reliability of the observation result can be improved.
- the influence of the attenuation accompanying the transmission of an ultrasonic wave is eliminated and thus the tissue characteristic can be determined with higher accuracy.
- the tissue characteristic determination unit 44 determines the tissue characteristic on the basis of a change in the standard deviations of the respective pieces of feature data between the original population and the population having new samples added thereto, this is just an example.
- the tissue characteristic determination unit 44 may determine the tissue characteristic on the basis of a change in the averages of the respective pieces of feature data between the original population and the population having new samples added thereto.
Landscapes
- Engineering & Computer Science (AREA)
- Health & Medical Sciences (AREA)
- Life Sciences & Earth Sciences (AREA)
- Physics & Mathematics (AREA)
- Public Health (AREA)
- Medical Informatics (AREA)
- Biomedical Technology (AREA)
- General Health & Medical Sciences (AREA)
- Pathology (AREA)
- Animal Behavior & Ethology (AREA)
- Remote Sensing (AREA)
- Radiology & Medical Imaging (AREA)
- Molecular Biology (AREA)
- Surgery (AREA)
- Nuclear Medicine, Radiotherapy & Molecular Imaging (AREA)
- Biophysics (AREA)
- Computer Vision & Pattern Recognition (AREA)
- Veterinary Medicine (AREA)
- Heart & Thoracic Surgery (AREA)
- Computer Networks & Wireless Communication (AREA)
- General Physics & Mathematics (AREA)
- Radar, Positioning & Navigation (AREA)
- Physiology (AREA)
- Data Mining & Analysis (AREA)
- Databases & Information Systems (AREA)
- Epidemiology (AREA)
- Primary Health Care (AREA)
- Ultra Sonic Daignosis Equipment (AREA)
- Investigating Or Analyzing Materials By The Use Of Ultrasonic Waves (AREA)
Claims (12)
- Appareil d'observation ultrasonore (1) qui envoie une onde ultrasonore vers un échantillon et reçoit l'onde ultrasonore réfléchie par l'échantillon, l'appareil (1) comprenant :un amplificateur de signal (31) qui amplifie un signal de l'onde ultrasonore reçue en provenance de l'échantillon avec un facteur d'amplification selon une profondeur de réception ;un générateur de données d'image de mode B (51) qui génère des données d'image de mode B dans lesquelles l'amplitude du signal de l'onde ultrasonore amplifiée par l'amplificateur de signal (31) est convertie en brillance et affichée ;un correcteur d'amplification (41) qui réalise une correction d'amplification pour rendre le facteur d'amplification constant par rapport au signal de l'onde ultrasonore amplifiée par l'amplificateur de signal (31) indépendamment de la profondeur de réception ;un analyseur de fréquence (42) qui calcule un spectre fréquentiel par analyse de la fréquence du signal de l'onde ultrasonore corrigée par le correcteur d'amplification (41) ; etun extracteur de données caractéristiques (43) comprenant :une unité d'approximation (431) qui réalise un traitement d'approximation sur le spectre fréquentiel calculé par l'analyseur de fréquence (42), pour ainsi extraire des données caractéristiques de précorrection à partir de celui-ci ; etun correcteur d'atténuation (432) qui réalise un traitement de correction d'atténuation sur les données caractéristiques de précorrection extraites par l'unité d'approximation (431), pour ainsi extraire des données caractéristiques ; ouun correcteur d'atténuation (432) qui réalise un traitement de correction d'atténuation sur le spectre fréquentiel calculé par l'analyseur de fréquence (42) ; etune unité d'approximation (431) qui réalise un traitement d'approximation sur le spectre fréquentiel sur lequel le traitement de correction d'atténuation a été réalisé par le correcteur d'atténuation (432), pour ainsi extraire des données caractéristiques ;l'appareil d'observation ultrasonore comprenant en outreun générateur de données d'image de données caractéristiques (52) qui génère des données d'image de données caractéristiques pour afficher des informations visuelles correspondant aux données caractéristiques extraites par l'extracteur de données caractéristiques (43).
- Appareil d'observation ultrasonore (1) selon la revendication 1,
dans lequel le facteur d'amplification dans la réalisation de l'amplification à l'aide de l'amplificateur de signal augmente de façon monotone à une profondeur de réception allant jusqu'à une profondeur de réception prédéterminée. - Appareil d'observation ultrasonore (1) selon la revendication 1,
dans lequel plus la profondeur de réception de l'onde ultrasonore est grande, plus la quantité de correction avec laquelle le correcteur d'atténuation (432) réalise la correction est grande. - Appareil d'observation ultrasonore (1) selon la revendication 1, comprenant en outre :
un dispositif de commande (9) qui permet à la correction d'amplification du correcteur d'amplification (41) et au traitement de correction d'atténuation du correcteur d'atténuation (432) d'être réalisés collectivement. - Appareil d'observation ultrasonore (1) selon la revendication 1,
dans lequel l'unité d'approximation (431) réalise le traitement d'approximation avec une analyse par régression polynomiale. - Appareil d'observation ultrasonore (1) selon la revendication 5,
dans lequel l'unité d'approximation (431) réalise le traitement d'approximation avec une expression linéaire, et extrait une pluralité d'éléments de données caractéristiques comprenant au moins deux parmi un gradient de l'expression linéaire, un point d'intersection de l'expression linéaire et une intensité qui est déterminée à l'aide du gradient, du point d'intersection et d'une fréquence spécifique incluse dans la bande de fréquences du spectre fréquentiel. - Appareil d'observation ultrasonore (1) selon l'une quelconque des revendications 1 à 6, comprenant en outre :une unité de stockage (8) qui stocke les données caractéristiques du spectre fréquentiel extraites sur la base d'ondes ultrasonores réfléchies par une pluralité d'échantillons connus en association avec des caractéristiques de tissu de la pluralité d'échantillons connus ; etune unité de détermination de caractéristique de tissu (44) qui détermine une caractéristique de tissu d'une zone prédéterminée de l'échantillon à l'aide des données caractéristiques stockées en association avec la pluralité d'échantillons connus dans l'unité de stockage (8) et des données caractéristiques extraites par l'extracteur de données caractéristiques (43).
- Appareil d'observation ultrasonore (1) selon la revendication 1,
dans lequel les informations visuelles sont une variable constituant un espace couleur. - Appareil d'observation ultrasonore (1) selon la revendication 1,
dans lequel le correcteur d'atténuation (432) réalise le traitement de correction d'atténuation à l'aide d'un taux d'atténuation prédéterminé qui est déterminé selon un type d'un organe cible d'observation. - Appareil d'observation ultrasonore (1) selon la revendication 9, comprenant en outre une unité d'entrée (6) qui est réalisée à l'aide d'une interface et reçoit une entrée d'informations, le taux d'atténuation étant modifié par une entrée provenant de l'unité d'entrée (6).
- Procédé de fonctionnement d'un appareil d'observation ultrasonore (1) qui envoie une onde ultrasonore vers un échantillon et reçoit l'onde ultrasonore réfléchie par l'échantillon, le procédé comprenant :une étape d'amplification de signal pour amplifier, à l'aide d'un amplificateur de signal (31), un signal de l'onde ultrasonore reçue en provenance de l'échantillon avec un facteur d'amplification selon une profondeur de réception ;une étape de génération de données d'image de mode B pour générer des données d'image de mode B dans lesquelles l'amplitude du signal de l'onde ultrasonore amplifiée par l'amplificateur de signal (31) est convertie en brillance et affichée ;une étape de correction d'amplification pour réaliser une correction d'amplification afin de rendre le facteur d'amplification constant par rapport au signal de l'onde ultrasonore amplifiée par l'amplificateur de signal (31) indépendamment de la profondeur de réception ;une étape d'analyse de fréquence pour calculer un spectre fréquentiel par analyse de la fréquence du signal de l'onde ultrasonore corrigée à l'étape de correction d'amplification ; etune étape d'extraction de données caractéristiques comprenant :une étape d'approximation pour réaliser un traitement d'approximation sur le spectre fréquentiel calculé à l'étape d'analyse de fréquence, pour ainsi extraire des données caractéristiques de précorrection à partir de celui-ci ; etune étape d'atténuation pour réaliser un traitement de correction d'atténuation sur les données caractéristiques de précorrection extraites à l'étape d'approximation, pour ainsi extraire des données caractéristiques ; ouune étape d'atténuation pour réaliser un traitement de correction d'atténuation sur le spectre fréquentiel calculé à l'étape d'analyse de fréquence ; etune étape d'approximation pour réaliser un traitement d'approximation sur le spectre fréquentiel sur lequel le traitement de correction d'atténuation a été réalisé à l'étape d'atténuation, pour ainsi extraire des données caractéristiques ; etle procédé comprenant en outre :
une étape de génération de données d'image de données caractéristiques pour générer des données d'image de données caractéristiques afin d'afficher des informations visuelles correspondant aux données caractéristiques extraites à l'étape d'extraction de données caractéristiques. - Produit de programme de fonctionnement d'un appareil d'observation ultrasonore (1) selon la revendication 1, conçu pour réaliser le procédé selon la revendication 11.
Applications Claiming Priority (2)
| Application Number | Priority Date | Filing Date | Title |
|---|---|---|---|
| JP2010253290 | 2010-11-11 | ||
| PCT/JP2011/076027 WO2012063929A1 (fr) | 2010-11-11 | 2011-11-11 | Dispositif d'observation à ultrasons, procédé de fonctionnement de dispositif d'observation à ultrasons, et programme de fonctionnement de dispositif d'observation à ultrasons |
Publications (3)
| Publication Number | Publication Date |
|---|---|
| EP2599441A1 EP2599441A1 (fr) | 2013-06-05 |
| EP2599441A4 EP2599441A4 (fr) | 2018-01-03 |
| EP2599441B1 true EP2599441B1 (fr) | 2019-04-17 |
Family
ID=46051066
Family Applications (1)
| Application Number | Title | Priority Date | Filing Date |
|---|---|---|---|
| EP11840305.4A Active EP2599441B1 (fr) | 2010-11-11 | 2011-11-11 | Dispositif d'observation à ultrasons, procédé de fonctionnement de dispositif d'observation à ultrasons, et programme de fonctionnement de dispositif d'observation à ultrasons |
Country Status (5)
| Country | Link |
|---|---|
| US (1) | US9028414B2 (fr) |
| EP (1) | EP2599441B1 (fr) |
| JP (1) | JP5307939B2 (fr) |
| CN (1) | CN103153195B (fr) |
| WO (1) | WO2012063929A1 (fr) |
Families Citing this family (38)
| Publication number | Priority date | Publication date | Assignee | Title |
|---|---|---|---|---|
| US10226234B2 (en) | 2011-12-01 | 2019-03-12 | Maui Imaging, Inc. | Motion detection using ping-based and multiple aperture doppler ultrasound |
| KR102322776B1 (ko) | 2010-02-18 | 2021-11-04 | 마우이 이미징, 인코포레이티드 | 초음파 이미지를 구성하는 방법 및 이를 위한 다중-개구 초음파 이미징 시스템 |
| KR102134763B1 (ko) | 2012-02-21 | 2020-07-16 | 마우이 이미징, 인코포레이티드 | 다중의 어퍼처 초음파를 사용한 물질 강성의 결정 |
| EP2833791B1 (fr) * | 2012-03-26 | 2022-12-21 | Maui Imaging, Inc. | Procédés pour l'amélioration de la qualité d'images ultrasonores par l'application de facteurs de pondération |
| CN103717146B (zh) * | 2012-05-30 | 2016-01-13 | 奥林巴斯株式会社 | 超声波观测装置、超声波观测装置的动作方法 |
| EP2883079B1 (fr) | 2012-08-10 | 2017-09-27 | Maui Imaging, Inc. | Étalonnage de sondes à ultrasons à ouvertures multiples |
| CN103676827A (zh) | 2012-09-06 | 2014-03-26 | Ip音乐集团有限公司 | 用于远程控制音频设备的系统和方法 |
| WO2014109879A1 (fr) * | 2013-01-08 | 2014-07-17 | Volcano Corporation | Procédé pour tomographie assistée par ordinateur acoustique focalisée (fact) |
| CN104411250B (zh) | 2013-01-23 | 2017-06-23 | 奥林巴斯株式会社 | 超声波观测装置、超声波观测装置的动作方法 |
| KR102218308B1 (ko) | 2013-05-21 | 2021-02-23 | 삼성전자주식회사 | 초음파 영상 처리 장치 및 방법 |
| CN104582584B (zh) * | 2013-05-29 | 2016-09-14 | 奥林巴斯株式会社 | 超声波观测装置以及超声波观测装置的动作方法 |
| CN105392427B (zh) | 2013-07-18 | 2018-02-13 | 奥林巴斯株式会社 | 超声波观测装置以及超声波观测装置的动作方法 |
| US9883848B2 (en) | 2013-09-13 | 2018-02-06 | Maui Imaging, Inc. | Ultrasound imaging using apparent point-source transmit transducer |
| JP5797364B1 (ja) * | 2013-12-05 | 2015-10-21 | オリンパス株式会社 | 超音波観測装置、超音波観測装置の作動方法、及び超音波観測装置の作動プログラム |
| CN105828726B (zh) * | 2014-06-11 | 2019-06-18 | 奥林巴斯株式会社 | 医用诊断装置以及医用诊断装置的工作方法 |
| WO2016006288A1 (fr) * | 2014-07-11 | 2016-01-14 | オリンパス株式会社 | Dispositif d'observation ultrasonore, procédé de fonctionnement de dispositif d'observation ultrasonore, et programme de fonctionnement de dispositif d'observation ultrasonore |
| EP3182900B1 (fr) | 2014-08-18 | 2019-09-25 | Maui Imaging, Inc. | Système d'imagerie par ultrasons basée sur un réseau |
| JP6175569B2 (ja) * | 2014-09-10 | 2017-08-02 | 富士フイルム株式会社 | 音響波画像生成装置およびその制御方法 |
| WO2016103847A1 (fr) * | 2014-12-22 | 2016-06-30 | オリンパス株式会社 | Appareil d'observation échographique, procédé et programme de fonctionnement de dispositif d'observation échographique |
| CN105939672B (zh) * | 2014-12-22 | 2018-10-23 | 奥林巴斯株式会社 | 超声波观测装置以及超声波观测装置的工作方法 |
| JP6253572B2 (ja) * | 2014-12-22 | 2017-12-27 | オリンパス株式会社 | 超音波観測装置、超音波観測装置の作動方法および超音波観測装置の作動プログラム |
| CN106572843B (zh) * | 2014-12-25 | 2020-03-10 | 奥林巴斯株式会社 | 超声波观测装置以及超声波观测装置的工作方法 |
| EP3275376A4 (fr) * | 2015-03-23 | 2019-01-16 | Olympus Corporation | Dispositif d'observation à ultrasons, procédé de fonctionnement de dispositif d'observation à ultrasons, et programme de fonctionnement de dispositif d'observation à ultrasons |
| JP5953457B1 (ja) * | 2015-03-23 | 2016-07-20 | オリンパス株式会社 | 超音波観測装置、超音波観測装置の作動方法および超音波観測装置の作動プログラム |
| WO2016160981A1 (fr) | 2015-03-30 | 2016-10-06 | Maui Imaging, Inc. | Systèmes d'imagerie par ultrasons et procédés de détection du mouvement d'un objet |
| JP6138402B2 (ja) * | 2015-03-31 | 2017-05-31 | オリンパス株式会社 | 超音波観測装置、超音波観測装置の作動方法および超音波観測装置の作動プログラム |
| JP6010274B1 (ja) * | 2015-05-13 | 2016-10-19 | オリンパス株式会社 | 超音波観測装置、超音波観測装置の作動方法および超音波観測装置の作動プログラム |
| WO2016181856A1 (fr) * | 2015-05-13 | 2016-11-17 | オリンパス株式会社 | Dispositif de diagnostic à ultrasons, procédé d'exploitation du dispositif de diagnostic à ultrasons, et programme d'exploitation du dispositif de diagnostic à ultrasons |
| CN106659478B (zh) * | 2015-05-13 | 2020-01-10 | 奥林巴斯株式会社 | 超声波观测装置以及超声波观测装置的工作方法 |
| WO2017069068A1 (fr) * | 2015-10-23 | 2017-04-27 | オリンパス株式会社 | Appareil d'observation ultrasonore, procédé de fonctionnement de l'appareil d'observation ultrasonore et programme de fonctionnement pour l'appareil d'observation ultrasonore |
| WO2017098931A1 (fr) * | 2015-12-08 | 2017-06-15 | オリンパス株式会社 | Appareil de diagnostic à ultrasons, procédé de fonctionnement de l'appareil de diagnostic à ultrasons et programme de fonctionnement pour l'appareil de diagnostic à ultrasons |
| CN108472018B (zh) * | 2015-12-24 | 2021-01-05 | 奥林巴斯株式会社 | 超声波观测装置、超声波观测装置的工作方法以及超声波观测装置的工作程序 |
| US10856846B2 (en) | 2016-01-27 | 2020-12-08 | Maui Imaging, Inc. | Ultrasound imaging with sparse array probes |
| KR102737502B1 (ko) | 2019-01-28 | 2024-12-05 | 삼성전자주식회사 | 정보 저장 패턴을 포함하는 반도체 소자 및 그 제조 방법 |
| JP7100160B2 (ja) * | 2019-01-30 | 2022-07-12 | オリンパス株式会社 | 超音波観測装置、超音波観測装置の作動方法および超音波観測装置の作動プログラム |
| JP7724853B2 (ja) | 2020-10-21 | 2025-08-18 | マウイ イマギング,インコーポレーテッド | 多数開口超音波を用いた組織の特徴付けのためのシステム及び方法 |
| EP4236811A4 (fr) | 2020-11-02 | 2024-10-09 | Maui Imaging, Inc. | Systèmes et procédés d'amélioration de la qualité d'image ultrasonore |
| JP7556643B2 (ja) * | 2021-06-28 | 2024-09-26 | 富士フイルム株式会社 | 超音波撮像装置、信号処理装置、および、信号処理方法 |
Family Cites Families (12)
| Publication number | Priority date | Publication date | Assignee | Title |
|---|---|---|---|---|
| US4016750B1 (en) | 1975-11-06 | 1994-04-05 | Stanford Research Inst | Ultrasonic imaging method and apparatus |
| US4092867A (en) * | 1977-02-10 | 1978-06-06 | Terrance Matzuk | Ultrasonic scanning apparatus |
| FR2554238B1 (fr) | 1983-10-28 | 1986-02-28 | Labo Electronique Physique | Appareil d'exploration de milieux par echographie ultrasonore |
| JP3779410B2 (ja) | 1997-02-03 | 2006-05-31 | 株式会社東芝 | 超音波照射装置 |
| JP4336516B2 (ja) * | 2003-04-10 | 2009-09-30 | 株式会社リコー | 特徴量次元圧縮装置、マッチング装置、プログラム及び記憶媒体 |
| US7601122B2 (en) | 2003-04-22 | 2009-10-13 | Wisconsin Alumni Research Foundation | Ultrasonic elastography with angular compounding |
| US7275439B2 (en) * | 2003-04-22 | 2007-10-02 | Wisconsin Alumni Research Foundation | Parametric ultrasound imaging using angular compounding |
| JP4431354B2 (ja) * | 2003-10-06 | 2010-03-10 | アロカ株式会社 | 超音波診断装置 |
| US20080051659A1 (en) | 2004-06-18 | 2008-02-28 | Koji Waki | Ultrasonic Diagnostic Apparatus |
| DE602005027617D1 (de) | 2004-09-20 | 2011-06-01 | Resonant Medical Inc | Radiotherapiebehandlungsüberwachung unter einsatz von ultraschall |
| JP2009082624A (ja) * | 2007-10-02 | 2009-04-23 | Olympus Medical Systems Corp | 超音波観測装置及びこの超音波観測装置を用いた超音波診断装置 |
| US20100130860A1 (en) * | 2008-11-21 | 2010-05-27 | Kabushiki Kaisha Toshiba | Medical image-processing device, medical image-processing method, medical image-processing system, and medical image-acquiring device |
-
2011
- 2011-11-11 WO PCT/JP2011/076027 patent/WO2012063929A1/fr not_active Ceased
- 2011-11-11 CN CN201180048796.2A patent/CN103153195B/zh active Active
- 2011-11-11 JP JP2012533410A patent/JP5307939B2/ja active Active
- 2011-11-11 EP EP11840305.4A patent/EP2599441B1/fr active Active
-
2012
- 2012-07-30 US US13/561,443 patent/US9028414B2/en active Active
Non-Patent Citations (1)
| Title |
|---|
| None * |
Also Published As
| Publication number | Publication date |
|---|---|
| CN103153195A (zh) | 2013-06-12 |
| JP5307939B2 (ja) | 2013-10-02 |
| WO2012063929A1 (fr) | 2012-05-18 |
| US9028414B2 (en) | 2015-05-12 |
| US20130030296A1 (en) | 2013-01-31 |
| EP2599441A1 (fr) | 2013-06-05 |
| JPWO2012063929A1 (ja) | 2014-05-12 |
| EP2599441A4 (fr) | 2018-01-03 |
| CN103153195B (zh) | 2016-08-03 |
Similar Documents
| Publication | Publication Date | Title |
|---|---|---|
| EP2599441B1 (fr) | Dispositif d'observation à ultrasons, procédé de fonctionnement de dispositif d'observation à ultrasons, et programme de fonctionnement de dispositif d'observation à ultrasons | |
| CN102802536B (zh) | 超声波诊断装置、超声波诊断装置的动作方法以及超声波诊断装置的动作程序 | |
| EP2599440B1 (fr) | Dispositif d'observation échographique, procédé de fonctionnement d'un dispositif d'observation échographique, et programme de fonctionnement pour dispositif d'observation échographique | |
| JP5114609B2 (ja) | 超音波観測装置および超音波観測装置の作動方法および超音波観測装置の作動プログラム | |
| CN104125804B (zh) | 超声波观测装置与超声波观测装置的动作方法 | |
| CN104582584B (zh) | 超声波观测装置以及超声波观测装置的动作方法 | |
| EP2554124B1 (fr) | Dispositif d'observation échografique ainsi que les procédé et programme associés | |
| JP5430809B1 (ja) | 超音波観測装置、超音波観測装置の作動方法および超音波観測装置の作動プログラム | |
| CN102834059B (zh) | 超声波观测装置、超声波观测装置的动作方法以及超声波观测装置的动作程序 | |
| CN102858251A (zh) | 超声波观测装置、超声波观测装置的动作方法以及超声波观测装置的动作程序 |
Legal Events
| Date | Code | Title | Description |
|---|---|---|---|
| PUAI | Public reference made under article 153(3) epc to a published international application that has entered the european phase |
Free format text: ORIGINAL CODE: 0009012 |
|
| 17P | Request for examination filed |
Effective date: 20130228 |
|
| AK | Designated contracting states |
Kind code of ref document: A1 Designated state(s): AL AT BE BG CH CY CZ DE DK EE ES FI FR GB GR HR HU IE IS IT LI LT LU LV MC MK MT NL NO PL PT RO RS SE SI SK SM TR |
|
| DAX | Request for extension of the european patent (deleted) | ||
| RAP1 | Party data changed (applicant data changed or rights of an application transferred) |
Owner name: OLYMPUS CORPORATION |
|
| RAP1 | Party data changed (applicant data changed or rights of an application transferred) |
Owner name: OLYMPUS CORPORATION |
|
| RAP1 | Party data changed (applicant data changed or rights of an application transferred) |
Owner name: OLYMPUS CORPORATION |
|
| RAP1 | Party data changed (applicant data changed or rights of an application transferred) |
Owner name: OLYMPUS CORPORATION |
|
| RIN1 | Information on inventor provided before grant (corrected) |
Inventor name: MIYAKI,HIRONAKA |
|
| RIN1 | Information on inventor provided before grant (corrected) |
Inventor name: MIYAKI,HIRONAKA |
|
| RA4 | Supplementary search report drawn up and despatched (corrected) |
Effective date: 20171205 |
|
| RIC1 | Information provided on ipc code assigned before grant |
Ipc: G01S 7/52 20060101ALI20171129BHEP Ipc: A61B 8/08 20060101ALI20171129BHEP Ipc: A61B 8/00 20060101AFI20171129BHEP |
|
| GRAP | Despatch of communication of intention to grant a patent |
Free format text: ORIGINAL CODE: EPIDOSNIGR1 |
|
| STAA | Information on the status of an ep patent application or granted ep patent |
Free format text: STATUS: GRANT OF PATENT IS INTENDED |
|
| INTG | Intention to grant announced |
Effective date: 20181123 |
|
| RIN1 | Information on inventor provided before grant (corrected) |
Inventor name: MIYAKI, HIRONAKA |
|
| GRAS | Grant fee paid |
Free format text: ORIGINAL CODE: EPIDOSNIGR3 |
|
| GRAA | (expected) grant |
Free format text: ORIGINAL CODE: 0009210 |
|
| STAA | Information on the status of an ep patent application or granted ep patent |
Free format text: STATUS: THE PATENT HAS BEEN GRANTED |
|
| AK | Designated contracting states |
Kind code of ref document: B1 Designated state(s): AL AT BE BG CH CY CZ DE DK EE ES FI FR GB GR HR HU IE IS IT LI LT LU LV MC MK MT NL NO PL PT RO RS SE SI SK SM TR |
|
| REG | Reference to a national code |
Ref country code: GB Ref legal event code: FG4D |
|
| REG | Reference to a national code |
Ref country code: CH Ref legal event code: EP |
|
| REG | Reference to a national code |
Ref country code: DE Ref legal event code: R096 Ref document number: 602011058204 Country of ref document: DE |
|
| REG | Reference to a national code |
Ref country code: AT Ref legal event code: REF Ref document number: 1120675 Country of ref document: AT Kind code of ref document: T Effective date: 20190515 Ref country code: IE Ref legal event code: FG4D |
|
| REG | Reference to a national code |
Ref country code: NL Ref legal event code: MP Effective date: 20190417 |
|
| REG | Reference to a national code |
Ref country code: LT Ref legal event code: MG4D |
|
| PG25 | Lapsed in a contracting state [announced via postgrant information from national office to epo] |
Ref country code: NL Free format text: LAPSE BECAUSE OF FAILURE TO SUBMIT A TRANSLATION OF THE DESCRIPTION OR TO PAY THE FEE WITHIN THE PRESCRIBED TIME-LIMIT Effective date: 20190417 |
|
| PG25 | Lapsed in a contracting state [announced via postgrant information from national office to epo] |
Ref country code: ES Free format text: LAPSE BECAUSE OF FAILURE TO SUBMIT A TRANSLATION OF THE DESCRIPTION OR TO PAY THE FEE WITHIN THE PRESCRIBED TIME-LIMIT Effective date: 20190417 Ref country code: PT Free format text: LAPSE BECAUSE OF FAILURE TO SUBMIT A TRANSLATION OF THE DESCRIPTION OR TO PAY THE FEE WITHIN THE PRESCRIBED TIME-LIMIT Effective date: 20190817 Ref country code: AL Free format text: LAPSE BECAUSE OF FAILURE TO SUBMIT A TRANSLATION OF THE DESCRIPTION OR TO PAY THE FEE WITHIN THE PRESCRIBED TIME-LIMIT Effective date: 20190417 Ref country code: SE Free format text: LAPSE BECAUSE OF FAILURE TO SUBMIT A TRANSLATION OF THE DESCRIPTION OR TO PAY THE FEE WITHIN THE PRESCRIBED TIME-LIMIT Effective date: 20190417 Ref country code: HR Free format text: LAPSE BECAUSE OF FAILURE TO SUBMIT A TRANSLATION OF THE DESCRIPTION OR TO PAY THE FEE WITHIN THE PRESCRIBED TIME-LIMIT Effective date: 20190417 Ref country code: LT Free format text: LAPSE BECAUSE OF FAILURE TO SUBMIT A TRANSLATION OF THE DESCRIPTION OR TO PAY THE FEE WITHIN THE PRESCRIBED TIME-LIMIT Effective date: 20190417 Ref country code: FI Free format text: LAPSE BECAUSE OF FAILURE TO SUBMIT A TRANSLATION OF THE DESCRIPTION OR TO PAY THE FEE WITHIN THE PRESCRIBED TIME-LIMIT Effective date: 20190417 Ref country code: NO Free format text: LAPSE BECAUSE OF FAILURE TO SUBMIT A TRANSLATION OF THE DESCRIPTION OR TO PAY THE FEE WITHIN THE PRESCRIBED TIME-LIMIT Effective date: 20190717 |
|
| PG25 | Lapsed in a contracting state [announced via postgrant information from national office to epo] |
Ref country code: RS Free format text: LAPSE BECAUSE OF FAILURE TO SUBMIT A TRANSLATION OF THE DESCRIPTION OR TO PAY THE FEE WITHIN THE PRESCRIBED TIME-LIMIT Effective date: 20190417 Ref country code: LV Free format text: LAPSE BECAUSE OF FAILURE TO SUBMIT A TRANSLATION OF THE DESCRIPTION OR TO PAY THE FEE WITHIN THE PRESCRIBED TIME-LIMIT Effective date: 20190417 Ref country code: PL Free format text: LAPSE BECAUSE OF FAILURE TO SUBMIT A TRANSLATION OF THE DESCRIPTION OR TO PAY THE FEE WITHIN THE PRESCRIBED TIME-LIMIT Effective date: 20190417 Ref country code: GR Free format text: LAPSE BECAUSE OF FAILURE TO SUBMIT A TRANSLATION OF THE DESCRIPTION OR TO PAY THE FEE WITHIN THE PRESCRIBED TIME-LIMIT Effective date: 20190718 Ref country code: BG Free format text: LAPSE BECAUSE OF FAILURE TO SUBMIT A TRANSLATION OF THE DESCRIPTION OR TO PAY THE FEE WITHIN THE PRESCRIBED TIME-LIMIT Effective date: 20190717 |
|
| REG | Reference to a national code |
Ref country code: AT Ref legal event code: MK05 Ref document number: 1120675 Country of ref document: AT Kind code of ref document: T Effective date: 20190417 |
|
| PG25 | Lapsed in a contracting state [announced via postgrant information from national office to epo] |
Ref country code: IS Free format text: LAPSE BECAUSE OF FAILURE TO SUBMIT A TRANSLATION OF THE DESCRIPTION OR TO PAY THE FEE WITHIN THE PRESCRIBED TIME-LIMIT Effective date: 20190817 |
|
| REG | Reference to a national code |
Ref country code: DE Ref legal event code: R097 Ref document number: 602011058204 Country of ref document: DE |
|
| PG25 | Lapsed in a contracting state [announced via postgrant information from national office to epo] |
Ref country code: DK Free format text: LAPSE BECAUSE OF FAILURE TO SUBMIT A TRANSLATION OF THE DESCRIPTION OR TO PAY THE FEE WITHIN THE PRESCRIBED TIME-LIMIT Effective date: 20190417 Ref country code: SK Free format text: LAPSE BECAUSE OF FAILURE TO SUBMIT A TRANSLATION OF THE DESCRIPTION OR TO PAY THE FEE WITHIN THE PRESCRIBED TIME-LIMIT Effective date: 20190417 Ref country code: AT Free format text: LAPSE BECAUSE OF FAILURE TO SUBMIT A TRANSLATION OF THE DESCRIPTION OR TO PAY THE FEE WITHIN THE PRESCRIBED TIME-LIMIT Effective date: 20190417 Ref country code: EE Free format text: LAPSE BECAUSE OF FAILURE TO SUBMIT A TRANSLATION OF THE DESCRIPTION OR TO PAY THE FEE WITHIN THE PRESCRIBED TIME-LIMIT Effective date: 20190417 Ref country code: CZ Free format text: LAPSE BECAUSE OF FAILURE TO SUBMIT A TRANSLATION OF THE DESCRIPTION OR TO PAY THE FEE WITHIN THE PRESCRIBED TIME-LIMIT Effective date: 20190417 Ref country code: RO Free format text: LAPSE BECAUSE OF FAILURE TO SUBMIT A TRANSLATION OF THE DESCRIPTION OR TO PAY THE FEE WITHIN THE PRESCRIBED TIME-LIMIT Effective date: 20190417 |
|
| PLBE | No opposition filed within time limit |
Free format text: ORIGINAL CODE: 0009261 |
|
| STAA | Information on the status of an ep patent application or granted ep patent |
Free format text: STATUS: NO OPPOSITION FILED WITHIN TIME LIMIT |
|
| PG25 | Lapsed in a contracting state [announced via postgrant information from national office to epo] |
Ref country code: SM Free format text: LAPSE BECAUSE OF FAILURE TO SUBMIT A TRANSLATION OF THE DESCRIPTION OR TO PAY THE FEE WITHIN THE PRESCRIBED TIME-LIMIT Effective date: 20190417 Ref country code: IT Free format text: LAPSE BECAUSE OF FAILURE TO SUBMIT A TRANSLATION OF THE DESCRIPTION OR TO PAY THE FEE WITHIN THE PRESCRIBED TIME-LIMIT Effective date: 20190417 |
|
| 26N | No opposition filed |
Effective date: 20200120 |
|
| PG25 | Lapsed in a contracting state [announced via postgrant information from national office to epo] |
Ref country code: TR Free format text: LAPSE BECAUSE OF FAILURE TO SUBMIT A TRANSLATION OF THE DESCRIPTION OR TO PAY THE FEE WITHIN THE PRESCRIBED TIME-LIMIT Effective date: 20190417 |
|
| PG25 | Lapsed in a contracting state [announced via postgrant information from national office to epo] |
Ref country code: SI Free format text: LAPSE BECAUSE OF FAILURE TO SUBMIT A TRANSLATION OF THE DESCRIPTION OR TO PAY THE FEE WITHIN THE PRESCRIBED TIME-LIMIT Effective date: 20190417 |
|
| REG | Reference to a national code |
Ref country code: CH Ref legal event code: PL |
|
| PG25 | Lapsed in a contracting state [announced via postgrant information from national office to epo] |
Ref country code: LU Free format text: LAPSE BECAUSE OF NON-PAYMENT OF DUE FEES Effective date: 20191111 Ref country code: MC Free format text: LAPSE BECAUSE OF FAILURE TO SUBMIT A TRANSLATION OF THE DESCRIPTION OR TO PAY THE FEE WITHIN THE PRESCRIBED TIME-LIMIT Effective date: 20190417 Ref country code: CH Free format text: LAPSE BECAUSE OF NON-PAYMENT OF DUE FEES Effective date: 20191130 Ref country code: LI Free format text: LAPSE BECAUSE OF NON-PAYMENT OF DUE FEES Effective date: 20191130 |
|
| REG | Reference to a national code |
Ref country code: BE Ref legal event code: MM Effective date: 20191130 |
|
| GBPC | Gb: european patent ceased through non-payment of renewal fee |
Effective date: 20191111 |
|
| PG25 | Lapsed in a contracting state [announced via postgrant information from national office to epo] |
Ref country code: IE Free format text: LAPSE BECAUSE OF NON-PAYMENT OF DUE FEES Effective date: 20191111 Ref country code: GB Free format text: LAPSE BECAUSE OF NON-PAYMENT OF DUE FEES Effective date: 20191111 Ref country code: FR Free format text: LAPSE BECAUSE OF NON-PAYMENT OF DUE FEES Effective date: 20191130 |
|
| PG25 | Lapsed in a contracting state [announced via postgrant information from national office to epo] |
Ref country code: BE Free format text: LAPSE BECAUSE OF NON-PAYMENT OF DUE FEES Effective date: 20191130 |
|
| PG25 | Lapsed in a contracting state [announced via postgrant information from national office to epo] |
Ref country code: CY Free format text: LAPSE BECAUSE OF FAILURE TO SUBMIT A TRANSLATION OF THE DESCRIPTION OR TO PAY THE FEE WITHIN THE PRESCRIBED TIME-LIMIT Effective date: 20190417 |
|
| PG25 | Lapsed in a contracting state [announced via postgrant information from national office to epo] |
Ref country code: HU Free format text: LAPSE BECAUSE OF FAILURE TO SUBMIT A TRANSLATION OF THE DESCRIPTION OR TO PAY THE FEE WITHIN THE PRESCRIBED TIME-LIMIT; INVALID AB INITIO Effective date: 20111111 Ref country code: MT Free format text: LAPSE BECAUSE OF FAILURE TO SUBMIT A TRANSLATION OF THE DESCRIPTION OR TO PAY THE FEE WITHIN THE PRESCRIBED TIME-LIMIT Effective date: 20190417 |
|
| PG25 | Lapsed in a contracting state [announced via postgrant information from national office to epo] |
Ref country code: MK Free format text: LAPSE BECAUSE OF FAILURE TO SUBMIT A TRANSLATION OF THE DESCRIPTION OR TO PAY THE FEE WITHIN THE PRESCRIBED TIME-LIMIT Effective date: 20190417 |
|
| P01 | Opt-out of the competence of the unified patent court (upc) registered |
Effective date: 20230528 |
|
| PGFP | Annual fee paid to national office [announced via postgrant information from national office to epo] |
Ref country code: DE Payment date: 20251119 Year of fee payment: 15 |