EP2636366A1 - Dispositif d'imagerie par résonance magnétique et procédé de mesure du champ magnétique d'irradiation - Google Patents
Dispositif d'imagerie par résonance magnétique et procédé de mesure du champ magnétique d'irradiation Download PDFInfo
- Publication number
- EP2636366A1 EP2636366A1 EP11837843.9A EP11837843A EP2636366A1 EP 2636366 A1 EP2636366 A1 EP 2636366A1 EP 11837843 A EP11837843 A EP 11837843A EP 2636366 A1 EP2636366 A1 EP 2636366A1
- Authority
- EP
- European Patent Office
- Prior art keywords
- magnetic field
- pulse
- distribution
- sequence
- magnetic resonance
- Prior art date
- Legal status (The legal status is an assumption and is not a legal conclusion. Google has not performed a legal analysis and makes no representation as to the accuracy of the status listed.)
- Withdrawn
Links
Images







Classifications
-
- G—PHYSICS
- G01—MEASURING; TESTING
- G01R—MEASURING ELECTRIC VARIABLES; MEASURING MAGNETIC VARIABLES
- G01R33/00—Arrangements or instruments for measuring magnetic variables
- G01R33/20—Arrangements or instruments for measuring magnetic variables involving magnetic resonance
- G01R33/44—Arrangements or instruments for measuring magnetic variables involving magnetic resonance using nuclear magnetic resonance [NMR]
- G01R33/48—NMR imaging systems
- G01R33/54—Signal processing systems, e.g. using pulse sequences ; Generation or control of pulse sequences; Operator console
- G01R33/56—Image enhancement or correction, e.g. subtraction or averaging techniques, e.g. improvement of signal-to-noise ratio and resolution
-
- A—HUMAN NECESSITIES
- A61—MEDICAL OR VETERINARY SCIENCE; HYGIENE
- A61B—DIAGNOSIS; SURGERY; IDENTIFICATION
- A61B5/00—Measuring for diagnostic purposes; Identification of persons
- A61B5/05—Detecting, measuring or recording for diagnosis by means of electric currents or magnetic fields; Measuring using microwaves or radio waves
- A61B5/055—Detecting, measuring or recording for diagnosis by means of electric currents or magnetic fields; Measuring using microwaves or radio waves involving electronic [EMR] or nuclear [NMR] magnetic resonance, e.g. magnetic resonance imaging
-
- G—PHYSICS
- G01—MEASURING; TESTING
- G01R—MEASURING ELECTRIC VARIABLES; MEASURING MAGNETIC VARIABLES
- G01R33/00—Arrangements or instruments for measuring magnetic variables
- G01R33/20—Arrangements or instruments for measuring magnetic variables involving magnetic resonance
- G01R33/24—Arrangements or instruments for measuring magnetic variables involving magnetic resonance for measuring direction or magnitude of magnetic fields or magnetic flux
- G01R33/246—Spatial mapping of the RF magnetic field B1
-
- G—PHYSICS
- G01—MEASURING; TESTING
- G01R—MEASURING ELECTRIC VARIABLES; MEASURING MAGNETIC VARIABLES
- G01R33/00—Arrangements or instruments for measuring magnetic variables
- G01R33/20—Arrangements or instruments for measuring magnetic variables involving magnetic resonance
- G01R33/44—Arrangements or instruments for measuring magnetic variables involving magnetic resonance using nuclear magnetic resonance [NMR]
- G01R33/443—Assessment of an electric or a magnetic field, e.g. spatial mapping, determination of a B0 drift or dosimetry
-
- G—PHYSICS
- G01—MEASURING; TESTING
- G01R—MEASURING ELECTRIC VARIABLES; MEASURING MAGNETIC VARIABLES
- G01R33/00—Arrangements or instruments for measuring magnetic variables
- G01R33/20—Arrangements or instruments for measuring magnetic variables involving magnetic resonance
- G01R33/44—Arrangements or instruments for measuring magnetic variables involving magnetic resonance using nuclear magnetic resonance [NMR]
- G01R33/48—NMR imaging systems
- G01R33/54—Signal processing systems, e.g. using pulse sequences ; Generation or control of pulse sequences; Operator console
- G01R33/56—Image enhancement or correction, e.g. subtraction or averaging techniques, e.g. improvement of signal-to-noise ratio and resolution
- G01R33/565—Correction of image distortions, e.g. due to magnetic field inhomogeneities
- G01R33/5659—Correction of image distortions, e.g. due to magnetic field inhomogeneities caused by a distortion of the RF magnetic field, e.g. spatial inhomogeneities of the RF magnetic field
Definitions
- the present invention relates to a magnetic resonance imaging apparatus (hereinafter, referred to as an MRI apparatus) and in particular, to an MRI apparatus having a function of measuring the distribution of the irradiation magnetic field of a radiation coil that radiates a high-frequency magnetic field to an object.
- an MRI apparatus having a function of measuring the distribution of the irradiation magnetic field of a radiation coil that radiates a high-frequency magnetic field to an object.
- the MRI apparatus is an apparatus that measures a nuclear magnetic resonance (NMR) signal, which is generated by applying a high-frequency magnetic field pulse to an object to be tested in a state where the object to be tested is placed in a uniform static magnetic field, and reconstructs an image of the object to be tested by calculation of the NMR signal.
- NMR nuclear magnetic resonance
- An image with a high SN can be obtained by using a high magnetic field generator as a static magnetic field in which the object to be tested is placed.
- a high magnetic field MRI apparatus capable of realizing a high magnetic field of 3T or more has become widespread with the development of superconducting magnets.
- a high SN is obtained, but there is a problem in that brightness unevenness occurs in an image in abdominal imaging or the like.
- RF pulses high-frequency magnetic field pulses
- the resonance frequency of the high-frequency magnetic field for excitation is proportional to the static magnetic field strength.
- the high magnetic field MRI it is necessary to radiate a magnetic field of a frequency higher than that in the high-frequency magnetic field in the related art.
- the wavelength of the high-frequency magnetic field in the body becomes the same scale as the size of the body (particularly, abdomen). For this reason, the phase of the high-frequency magnetic field changes depending on the position in the body, and this change appears as image unevenness.
- RF shimming as a technique for solving the spatial non-uniformity of the irradiation magnetic field distribution (B1 distribution).
- the non-uniformity of the B1 distribution is reduced by controlling independently the intensity and phase of the RF pulse given to each channel using an RF coil for transmission with a plurality of channels.
- the B1 distribution of each channel is required for each object and each imaging part, and various methods for measuring the B1 distribution have been proposed.
- a typical method for measuring (B1 measurement) the B1 distribution is a method called a Double Angle Method (DAM), and the B1 is measured by calculation of an image captured using an RF pulse with an arbitrary flip angle and an image captured using an RF pulse with a flip angle which is twice the arbitrary flip angle.
- DAM Double Angle Method
- NPL 1 a method for calculating the B1 distribution by acquiring a plurality of images using a plurality of RF pulses with different flip angles and performing the fitting of the signal intensities (pixel values) of the plurality of images according to the signal intensity expression determined by the pulse sequence
- NPL 1 a method for a plurality of images acquired similarly, a method for calculating the B1 distribution from the period of signal intensity change has also been proposed (PTL 1).
- a method for repeating the pulse sequence which is for acquiring an image by applying a high-frequency magnetic field pre-pulse (hereinafter, simply referred to as a pre-pulse), while changing the intensity of the pre-pulse and calculating the B1 distribution from the acquired image (NPL 2) or a method for calculating the B1 distribution by taking the ratio between an image acquired immediately after pre-pulse application and an image acquired without applying the pre-pulse has also been proposed (NPL 3).
- repetition time TR RF pulse application interval
- the imaging time may be about 10 minutes or more.
- the imaging time can be shorter than that in the Double Angle Method.
- the B1 distribution can be calculated at high speed by setting the time (TI) from the application of the pre-pulse to the acquisition of an echo signal (NMR signal) as short as possible.
- TI time
- NMR signal echo signal
- the present invention is intended to propose a new method in which, for B1 distribution measurement, the application of a pre-pulse and a signal acquisition pulse sequence are combined and a plurality of signal acquisition pulse sequences with different elapsed time (TI) from the pre-pulse application are executed, and the B1 is calculated by calculation of several images (data for images) with different TI.
- TI elapsed time
- an MRI apparatus of the present invention includes: an RF radiation unit that radiates a high-frequency magnetic field (B1) to cause nuclear magnetic resonance in an object; an imaging unit that images the object using a B1 distribution measurement sequence that includes a signal acquisition sequence to acquire an echo signal by setting elapsed time (TI) from application of a pre-pulse; and a calculation unit that reconstructs an image of the object using the echo signal and is characterized in that the calculation unit calculates an irradiation magnetic field distribution of the RF radiation unit using the image and the calculation unit calculates the irradiation magnetic field distribution using a plurality of images with the different elapsed time.
- B1 high-frequency magnetic field
- TI elapsed time
- An irradiation magnetic field measuring method of the present invention includes: a measurement step of executing a signal acquisition sequence to acquire an echo signal by setting elapsed time (TI) from application of a pre-pulse by an RF radiation unit; an image reconstruction step of reconstructing an image of the object using an echo signal; and an irradiation magnetic field distribution calculation step of calculating the irradiation magnetic field distribution of the RF radiation unit using the image and is characterized in that, in the irradiation magnetic field distribution calculation step, the irradiation magnetic field distribution is calculated using a plurality of images with the different elapsed time.
- TI elapsed time
- the present invention by the combination of the pre-pulse and the plurality of signal acquisition sequences with different elapsed time from the pre-pulse application, it is possible to measure (B1 measurement) the magnetic field distribution of the RF pulse in a very short time with high accuracy.
- High-accuracy RF shimming can be realized by controlling the RF radiation means using the measured magnetic field distribution.
- the calculation means solves the determinant using the ratio between the signal intensity of the image with no pre-pulse and the signal intensity of the image with a pre-pulse, it is possible to calculate not only the B1 distribution but also the T1 distribution when calculating the irradiation magnetic field distribution.
- Fig. 1 is a block diagram showing an embodiment of the MRI apparatus to which the present invention is applied.
- This MRI apparatus is configured to include a static magnetic field generation system 2, a gradient magnetic field generation system 3, a signal transmission system 5, a signal receiving system 6, a signal processing system 7, a sequencer 4, and a central processing unit (CPU) 8.
- a static magnetic field generation system 2 a gradient magnetic field generation system 3
- a signal transmission system 5 a signal receiving system 6
- signal processing system 7, a sequencer 4 and a central processing unit (CPU) 8.
- CPU central processing unit
- the static magnetic field generation system 2 generates a uniform static magnetic field in space where an object 1 is placed, and is configured to include a permanent magnet type, a normal conducting type, or a superconducting type static magnetic field generator (not shown).
- the static magnetic field generator is disposed so as to generate a uniform static magnetic field in a direction perpendicular to the body axis of the object 1 in the case of a vertical magnetic field method and in the body axis direction in the case of a horizontal magnetic field method.
- the gradient magnetic field generation system 3 is configured to include a gradient magnetic field coil 9 that applies a gradient magnetic field in three orthogonal axial directions of X, Y, and Z, which are the coordinate system (stationary coordinate system) of the MRI apparatus, and a gradient magnetic field power supply 10 to drive each gradient magnetic field coil. Desired gradient magnetic fields Gx, Gy, and Gz can be applied in the three axial directions of X, Y, and Z by driving the gradient magnetic field power supply 10 of each coil according to the command from the sequencer 4 to be described later. According to the method for applying the gradient magnetic field, an imaging slice of the object can be selectively excited, and positional information can be added to the echo signal (NMR signal) generated from the excitation region.
- NMR signal echo signal
- the sequencer 4 is control means for repeatedly applying RF pulses and gradient magnetic field pulses according to the predetermined pulse sequence, and operates under the control of the CPU 8 and transmits various commands, which are required to collect the data of a tomographic image of the object 1, to the signal transmission system 5, the gradient magnetic field generation system 3, and the signal receiving system 6.
- the signal transmission system 5 emits RF pulses to the object 1 in order to cause nuclear magnetic resonance in the nuclear spins of atoms which form the body tissue of the object 1, and is configured to include a high-frequency oscillator 11, a modulator 12, a high-frequency amplifier 13, and a transmission-side high-frequency coil (transmission coil) 14a.
- the transmission coil is configured to have a plurality of feeding points and to be able to adjust the intensity and the phase of the supplied high-frequency wave.
- a plurality of high-frequency oscillators 11, a plurality of modulators 12, and a plurality of high-frequency amplifiers 13 are provided corresponding to respective channels. Although the case where there are two feeding points is shown in the drawing, the number of feeding points is not limited to 2.
- RF pulses output from the high-frequency oscillator 11 are amplitude-modulated by the modulator 12 at the timing according to the command from the sequencer 4, and the amplitude-modulated RF pulses are amplified by the high-frequency amplifier 13 and are then supplied to the high-frequency coil 14a disposed adjacent to the object 1. As a result, RF pulses are emitted to the object 1.
- the timing from the sequencer 4 and the modulation of the modulator 12 are controlled reflecting the measurement result of the B1 distribution to be described later.
- the signal receiving system 6 detects an echo signal emitted by nuclear magnetic resonance of the nuclear spins, which form the body tissue of the object 1, and is configured to include a receiving-side high-frequency coil (receiving coil) 14b, a signal amplifier 15, a quadrature phase detector 16, and an A/D converter 17.
- the NMR signal of the response of the object 1 induced by the electromagnetic waves emitted from the transmission coil 14a is detected by the signal receiving coil 14b disposed adjacent to the object 1 and is amplified by the signal amplifier 15.
- the amplified signals are divided into signals of two systems perpendicular to each other by the quadrature phase detector 16, and each signal is converted into a digital amount by the A/D converter 17 and is transmitted to the signal processing system 7.
- Fig. 1 the configuration where the high-frequency coil for transmission and the high-frequency coil for reception are separately provided is shown in Fig. 1 , it is also possible to adopt a configuration where one high-frequency coil (including multiple coils) is used as a high-frequency coil for transmission and a high-frequency coil for reception.
- the signal processing system 7 performs display, storage, and the like of various kinds of data processing and processing results, and includes an external storage device, such as an optical disc 19 or a magnetic disk 18, and a display 20, such as a CRT.
- an external storage device such as an optical disc 19 or a magnetic disk 18, and a display 20, such as a CRT.
- the CPU 8 executes processing, such as signal processing and image reconstruction, and displays a tomographic image of the object 1, which is the result, on the display 20 and also records the tomographic image on the magnetic disk 18 or the like of the external storage device.
- the CPU 8 has not only a function as a calculation unit of the signal processing system 7 but also a function as a control unit that controls each component of the apparatus, and allows various pulse sequences to be executed through the sequencer 4.
- the pulse sequence is included as a program in advance.
- a B1 distribution measurement sequence for measuring the irradiation magnetic field distribution (B1 distribution) by the transmission coil is included.
- the signal processing system 7 calculates the B1 distribution or calculates the phase or amplitude of the high-frequency pulse applied to the transmission coil using the measurement result of the B1 distribution measurement sequence, and controls the phase or amplitude of the high-frequency pulse applied to the transmission coil on the basis of this calculation result.
- An operating unit 25 inputs various kinds of control information regarding the MRI apparatus or control information regarding the processing performed in the signal processing system 7, and is configured to include a track ball or mouse 23 and a keyboard 24.
- This operating unit 25 is disposed adjacent to the display 20, so that the operator controls various kinds of processing of the MRI apparatus interactively through the operating unit 25 while observing the display 20.
- the transmission-side high-frequency coil 14a and the gradient magnetic field coil 9 are provided in the static magnetic field space of the static magnetic field generation system 2, into which the object 1 is inserted, such that they face the object 1 in the case of a vertical magnetic field method and they surround the object 1 in the case of a horizontal magnetic field method.
- the receiving-side high-frequency coil 14b is provided so as to face or surround the object 1.
- Fig. 2 shows the procedure.
- an object is placed in static magnetic field space, and is positioned such that a target imaging part is positioned approximately in the center of the static magnetic field space (step 201).
- the B1 distribution measurement sequence is executed to acquire an image (step 202).
- the B1 distribution measurement sequence will be described later.
- the B1 distribution for each channel is calculated using the image acquired in step 202 (step 203).
- the amplitude and phase of a high-frequency pulse applied to the channel are set using the calculated B1 distribution (steps 204 and 205).
- desired measurement (imaging) is performed in the conditions set in step 204 (step 206).
- a typical embodiment of B1 distribution measurement will be described in detail. Since step 201 and steps from step 204 are common in embodiments described below, steps 202 and 203 will be described for each embodiment.
- the B1 distribution measurement sequence is a combination of a pre-pulse, which is an RF pulse having a relatively large flip angle, and a signal acquisition sequence using an RF pulse having a small flip angle.
- a pre-pulse which is an RF pulse having a relatively large flip angle
- a signal acquisition sequence using an RF pulse having a small flip angle.
- TI elapsed time
- different embodiments are possible.
- the calculation of the B1 distribution changes (step 203).
- the present embodiment is characterized in that at least three signal acquisition sequences are executed subsequent to the application of the pre-pulse and the B1 distribution is calculated from the image acquired in each signal acquisition sequence.
- Fig. 3 is a diagram showing the relationship between a pre-pulse 301 and signal acquisition sequences 303, 305, and 307.
- a change in the signal intensity depending on the elapsed time (TI) from the application of the pre-pulse 301 is shown as a graph.
- the horizontal axis indicates elapsed time after the application of pre-pulse
- the vertical axis indicates signal intensity.
- the pre-pulse 301 is a non-selective RF pulse.
- the pre-pulse 301 is a 90° pulse having a large flip angle.
- At least three signal acquisition sequences 303, 305, and 307 are executed while the nuclear spins excited by the pre-pulse 301 relax longitudinally, thereby obtaining three pieces of k-space data (or image data) of different TI.
- it is important to obtain data having different longitudinal relaxation from the pre-pulse and the TI is set such that all signal acquisition sequences are completed while the influence of the pre-pulse remains sufficiently. In this manner, it is possible to calculate the B1 distribution with high accuracy.
- Each signal acquisition sequence is not particularly limited as long as it is a pulse sequence capable of collecting k-space data in a short time.
- a gradient echo (GrE) based pulse sequence shown in Fig. 4 can be adopted.
- an RF pulse 401 having a small flip angle is applied together with a slice gradient magnetic field pulse 402, and then a phase encoding gradient magnetic field 403 is applied.
- a readout gradient magnetic field 404 is applied, and an echo signal 405 is measured during the application of the readout gradient magnetic field with reversed polarity.
- a gradient magnetic field 406 for rephase is applied in a phase encoding direction.
- a small flip angle pulse of preferably 10° or less, and more preferably 5° or less is used as the RF pulse 401.
- a small flip angle pulse is used as the RF pulse 401, and a rephase pulse 406 in the phase encoding direction is used. Accordingly, repetition time TR can be set to about several milliseconds.
- the RF pulse 401 to the rephase gradient magnetic field 406 are repeated while changing the intensity of the phase encoding gradient magnetic field pulse 403, thereby obtaining the data (k-space data) of the slice selected by the slice gradient magnetic field 402.
- the k-space data is used for the calculation of the B1 distribution, which will be described later, and the matrix size is preferably about 64 ⁇ 64. Then, it is possible to acquire all pieces of k-space data in a very short time, specifically, in the measurement time of about 200 ms.
- each signal acquisition sequence is a so-called centric-order pulse sequence in which the measurement starts from the echo in the center of k-space, and start points of the signal acquisition sequence are T11, TI2, and TI3.
- the signal intensity S (B1, TI) of a certain observed pixel of image data which is obtained by performing an inverse Fourier transform of the k-space data obtained by the first signal acquisition sequence, is given by Expression (1).
- S B ⁇ 1 , TI S seq ⁇ 1 - 1 - cos B ⁇ 1 ⁇ ⁇ ⁇ exp - TI / T ⁇ 1
- Sseq indicates the signal intensity determined by the signal acquisition sequence after pre-pulse
- ⁇ indicates the flip angle of the set pre-pulse
- TI indicates time until signals in the center of k-space are collected from the pre-pulse application
- T1 indicates longitudinal relaxation time depending on the tissue.
- the signal intensity of the observed pixel of the image data obtained from the second and third signal acquisition sequences can be expressed as in Expressions (2) and (3).
- S B ⁇ 1 , 2 ⁇ TI S seq ⁇ 1 - 1 - cos B ⁇ 1 ⁇ ⁇ ⁇ exp - 2 ⁇ TI / T ⁇ 1
- S B ⁇ 1 , 3 ⁇ TI S seq ⁇ 1 - 1 - cos B ⁇ 1 ⁇ ⁇ ⁇ exp - 3 ⁇ TI / T ⁇ 1
- Expressions (1) to (3) can be written as Expressions (4) to (6).
- B ⁇ 1 arccos 1 - X ⁇
- the B1 distribution can be calculated by solving the simultaneous equations from the images, which are obtained by performing at least three signal acquisition sequences with different TI, the B1 distribution can be measured in a very short time, such as several seconds.
- the B1 distribution can be accurately calculated by solving the simultaneous equations from multiple measurement results (signal intensities) of different TI, it is also preferable in terms of the ease of operation.
- the B1 distribution may also be calculated by fitting the multiple measurement results.
- the TI ratio of the plurality of signal acquisition sequences is set as the integer ratio in the example described above, the TI ratio of the plurality of signal acquisition sequences may be a non-integer ratio as long as the plurality of signal acquisition sequences has different TI.
- the signal acquisition sequence is not limited to the sequence shown in Fig. 4 as long as the image data is acquired in a short time, and various changes may be made.
- a plurality of signal acquisition sequences may be continuously executed without setting the interval, instead of executing the three signal acquisition sequences with different TI shown in Fig. 3 at fixed intervals.
- an RF pulse (301 in Fig. 3 ) may be continuously applied during the same TR as the signal acquisition sequence without measuring the echo.
- the occurrence of the contrast difference within the signal acquisition sequence can be suppressed by applying RF pulses continuously to maintain the spin in a steady state.
- GrE based pulse sequence using a phase encoding pulse in one direction is shown in Fig. 4
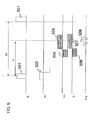
- Fig. 5 shows an example of the pulse sequence of the radial method.
- an RF pulse 501 is applied together with a slice gradient magnetic field pulse 502.
- gradient magnetic field pulses 504 and 506 and gradient magnetic field pulses 505 and 507 having reversed polarity are applied in two axial directions (Gp and Gr directions), and a gradient echo signal 508 that reaches its peak when the absolute value of the amount of application of each of the gradient magnetic field pulses 504 and 506 becomes equal to the absolute value of the amount of application of each of the gradient magnetic field pulses 505 and 507 is measured.
- Time until the echo signal is generated from excitation, that is, the echo time TE is a parameter to determine the image contrast, and may be arbitrarily set according to the purpose of imaging.
- Data obtained by arranging one measured echo signal 508 in k-space becomes a column of data (spoke) which passes through the origin of k-space and in which the angle of k-space with respect to the coordinate axes is determined by the amount of application of the gradient magnetic field pulses in the two axial directions.
- this pulse sequence it is possible to obtain a piece of k-space data in the order of 0.1 seconds even if the number of repetitions is set to 200 (the number of spokes is set to 200) by setting the flip angle of the RF pulse 501 to be equal to or less than 10° and setting TR to about several milliseconds.
- the signal intensity expressed as in Expression (1) is an average value of the influence of the longitudinal relaxation until the acquisition of the last spoke from the acquisition of the first spoke of all pieces of data.
- the B1 distribution can be calculated by the calculation of (1) to (9) in the same manner as when the signal acquisition sequence shown in Fig. 4 is used.
- the present embodiment is characterized in that the B1 distribution is calculated from at least three images acquired by executing the signal acquisition sequence for images (first B1 distribution measurement sequence) at least twice with different elapsed time from the pre-pulse application and also executing the signal acquisition sequence (second B1 distribution measurement sequence) of different pre-pulse application conditions from the first B1 distribution measurement sequence.
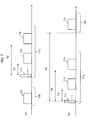
- Fig. 7(a) is a diagram showing the relationship between a first B1 distribution measurement sequence 710 and a second B1 distribution measurement sequence 720.
- the first B1 distribution measurement sequence 710 is configured to include a pre-pulse 711, which is an RF pulse having a flip angle of 90° or more, and at least two signal acquisition sequences 713 and 715 subsequent to the pre-pulse 711, as in the first embodiment shown in Fig. 3 .
- two or more signal acquisition sequences 713 and 715 are sufficient in the present embodiment while at least three signal acquisition sequences have been executed within the longitudinal relaxation time of the spin after the application of the pre-pulse 711 in the first embodiment.
- the second B1 distribution measurement sequence 720 is configured to include a single signal acquisition sequence 721 that does not use a pre-pulse.
- the second B1 distribution measurement sequence 720 is arranged before the first B1 distribution measurement sequence 710.
- the second B1 distribution measurement sequence 720 may be arranged after the passage of longitudinal relaxation time TD after the first B1 distribution measurement sequence 710.
- any kind of signal acquisition sequences 713, 715, and 721 can be used if they are pulse sequences capable of collecting k-space data in a short time.
- the GrE based pulse sequence shown in Fig. 4 or 5 may be adopted.
- the signal intensity of an observed pixel is given by Expressions (11) and (12).
- the second B1 distribution measurement sequence is configured to include a signal acquisition sequence that does not use a pre-pulse.
- the pre-pulse application conditions (flip angles) in the first and second B1 distribution measurement sequences are different, and at least three signal acquisition sequences may be executed.
- a first B1 distribution measurement sequence 810 may be configured to include the application of a pre-pulse 811 of the first flip angle and two signal acquisition sequences 813 and 815
- a second B1 distribution measurement sequence 820 may be configured to include the application of a pre-pulse 821 of the second flip angle, which is different from the first flip angle, and one signal acquisition sequence 823.
- the relationship between the first and second flip angles is not particularly limited, for example, combinations of 90° and 0°, 90° and 180°, and the like may be adopted.
- the order of the first B1 distribution measurement sequence 810 and the second B1 distribution measurement sequence 820 may be changed.
- the imaging time can be reduced to [2 ⁇ (number of times of flip angle change in NPL 2) ] since a flip angle changes once.
- the B1 distribution can be measured more accurately since the flip angle data is also used.
- the next pre-pulse may be applied in an insufficiently relaxed state if the interval (pre-pulse application interval TD) is shortened.
- TD pre-pulse application interval
- Expressions (10) to (15) will be increased.
- This problem can be solved by setting TD to be equal to or greater than the longitudinal relaxation time as described above.
- the RF pulse that is forced to relax longitudinally it is possible to use an RF pulse having the same intensity as a pre-pulse and a reverse phase of the phase of the pre-pulse.
- the B1 distribution can be calculated with high accuracy even if the imaging time is reduced.
- the present embodiment is characterized in that a reference image acquisition sequence, in which a signal is acquired without applying a pre-pulse, is executed and a plurality of signal acquisition sequences having different time TI until the signal in the center of k-space is acquired from pre-pulse application are executed after the pre-pulse application and that the B1 distribution is calculated by the matrix operation using a reference image and a plurality of images of different TI.
- Fig. 9 shows the relationship between the pre-pulse and the signal acquisition sequence in the present embodiment.
- Fig. 9 is similar to Fig. 7 showing the relationship between the pre-pulse and the signal acquisition sequence.
- the signal acquisition sequence is a sequence of short TI to acquire a signal while the influence of a pre-pulse is large, and the ratio between TI of the first signal acquisition sequence and TI of the subsequent signal acquisition sequence is not limited to the integer ratio while the ratio between TI of the first signal acquisition sequence and TI of the subsequent signal acquisition sequence is the integer ratio.
- the signal acquisition sequences 903, 905, 907, ... can be regarded as a gradient echo based pulse sequence of short TR as shown in Fig. 4 . Accordingly, it is preferable that the signal acquisition sequences 903, 905, 907, ... be centric-order sequences and the flip angle be set to be small.
- a pre-pulse 901 is a non-selective RF pulse having a large flip angle.
- a reference image acquisition sequence 900 is the same pulse sequence as the signal acquisition sequence 903 and the like, and it is preferable to execute the reference image acquisition sequence 900 immediately before the application of the pre-pulse 901 in order to reduce the imaging time.
- S is a matrix of 1 x n
- A is a matrix of 2 x n
- X is a matrix of 1 x 2.
- Expression (19) By multiplying the pseudo-inverse matrix pinvA of the matrix A from the left, Expression (19) can be solved.
- B1 and T1 can be calculated as shown in the following Expressions (20) and (21).
- the solution (B1) is calculated by solving Expressions (4) to (6) or the simultaneous equations of Expressions (13) and (14). Accordingly, in order for the solution not to diverge, the TI ratio of the signal acquisition sequences after pre-pulse is set as the integer ratio. In the present embodiment, however, since it is possible to find a solution without requiring such TI limitation, the effect of pre-pulse is high.
- the calculated T1 distribution is used for clinical diagnosis of osteoarthritis and the like.
- the reference image acquisition sequence 900 is executed immediately before the pre-pulse 901 to acquire the reference image
- Fig. 10 shows this modification.
- images of different TI are acquired by executing the signal acquisition sequences 903, 905, and 907 with different TI after the application of the pre-pulse 901, and sufficiently long TI is finally set and the reference image acquisition sequence 900 is executed to acquire the reference image.
- the B1 distribution and the T1 distribution can be calculated by Expressions (18) to (21) in the same manner as in the case shown in Fig. 9 .
- the present embodiment is characterized in that the B1 distribution of a plurality of cross-sections is measured using a multi-slice method. Since others are the same as those in the first to third embodiments, explanation will be focused on the differences.
- Fig. 11 shows an example of the B1 distribution measurement sequence according to the present embodiment.
- the B1 distribution measurement sequence 910 is configured to include a pre-pulse 911 and signal acquisition sequences 913, 915, and 917 subsequent to the pre-pulse 911.
- the B1 distribution measurement sequence 910 is similar to the B1 distribution measurement sequence shown in Fig. 3 , each of the signal acquisition sequences 913, 915, and 917 is executed on a cross-section selected from three cross-sections perpendicular to each other.
- the slice selection gradient magnetic field 402 applied simultaneously with the RF pulse 401 is a slice gradient magnetic field having a different axis for each signal acquisition sequence, and different cross-sections are excited. Accordingly, the image of each cross-section has different elapsed time TI from the application of the pre-pulse 911.
- the same B1 distribution measurement sequences 920 and 930 are repeated at predetermined intervals (TD). In this case, the order of slices (cross-sections) selected in the signal acquisition sequence included in each B1 distribution measurement sequence is cyclically changed.
- the order in the first B1 distribution measurement sequence 910 is axial plane (AX), sagittal plane (SG), and coronal plane (COR)
- the order in the next B1 distribution measurement sequence 920 is SG -> COR -> AX
- the order in the next B1 distribution measurement sequence 830 is COR -> AX -> SG.
- three pieces of image data k-space data of TI1, TI2, and TI3 of different TI can be obtained for each of the axial plane (AX), the sagittal plane (SG), and the coronal plane (COR).
- Fig. 9 has shown the case where a plurality of cross-sections are three cross-sections perpendicular to each other. However, also when the plurality of cross-sections are parallel cross-sections, three or more sets of image data can be obtained for the plurality of parallel cross-sections by changing the slice selection conditions in each signal acquisition sequence, in the same manner as the case of three cross-sections perpendicular to each other.
- the B1 distribution measurement sequence shown in Fig. 9 is also possible. Also in this case, similar to the second embodiment, it is possible to calculate the B1 distribution for each cross-section using Expressions (10) to (15).
- the present embodiment is effective for RF shimming for which the B1 distribution of a plurality of cross-sections is required.
- the measurement time increases in proportion to the number of cross-sections.
- the measurement time of one B1 distribution measurement sequence is only about several seconds, it is possible to calculate the B1 distribution in a short time of about 10 to 30 seconds for three cross-sections.
- k-space data used for the calculation of the B1 distribution is measured multiple times. That is, the present embodiment is characterized in that multi-shot measurement is performed. Since others are the same as those in the first to third embodiments, explanation will be focused on the differences.
- a B1 distribution measurement sequence 100 configured to include a pre-pulse 101 and a plurality of signal acquisition sequences 103, 105, and 107 is performed multiple times.
- the pre-pulse 101 of the same flip angle is used in each sequence, a part of k-space data is acquired in one signal acquisition sequence and all pieces of the k-space data are acquired in multiple sequences.
- the method for dividing k-space is not particularly limited, and k-space may be simply divided into a plurality of regions as shown in the drawing, or it is also possible to perform measurement by making the phase encoding step loose in each of the signal acquisition sequence 110, 120, 130, ... and to measure the data closest to the center of k-space always in predetermined TI.
- the timing to acquire the central data when acquiring all pieces of k-space data in one sequence is set to predetermined TI (elapsed time from pre-pulse application).
- predetermined TI elapsed time from pre-pulse application
- data of different TI is included in the k-space data.
- the rate of data which is included in the k-space data and whose TI is different from predetermined TI can be reduced. As a result, the signal acquisition time is increased several times the number of shots, but it is possible to improve the accuracy of B1 distribution measurement.
- the present embodiment is particularly effective when the radial sequence shown in Fig. 5 or the 3D pulse sequence shown in Fig. 6 is adopted as a signal acquisition sequence.
- the present embodiment is characterized in that a plurality of pieces of image data of different TI are obtained by performing one signal acquisition sequence after one pre-pulse and repeating the B1 distribution measurement sequence, which is configured to include the one pre-pulse and one signal acquisition sequence, while changing the TI of the signal acquisition sequence.
- Fig. 13 shows the B1 distribution measurement sequence of the present embodiment.
- Fig. 13 (a) shows a case where the B1 distribution measurement sequence of the first embodiment is changed according to the present embodiment
- Fig. 13(b) shows a case where the B1 distribution measurement sequence of the second embodiment is changed according to the present embodiment.
- a pre-pulse 111 and signal acquisition sequences 113, 115, and 117 used in three B1 distribution measurement sequences 1110, 1120, and 1130 are the same in all of the three sequences, but only TI is different.
- Fig. 13 shows the B1 distribution measurement sequence of the present embodiment.
- Fig. 13 (a) shows a case where the B1 distribution measurement sequence of the first embodiment is changed according to the present embodiment
- Fig. 13(b) shows a case where the B1 distribution measurement sequence of the second embodiment is changed according to the present embodiment.
- signal acquisition sequences 114, 116, and 118 used in three B1 distribution measurement sequences 1140, 1150, and 1160 are the same, but no pre-pulse is used in the first B1 distribution measurement sequence 1140 (equivalent to the flip angle 0). In addition, only TI is different between the second B1 distribution measurement sequence 1150 and the third B1 distribution measurement sequence 1160.
- the RF pulse used in the signal acquisition sequence is a small flip angle pulse having a flip angle of 10° or less.
- subsequent signal acquisition sequences are influenced by the RF pulse applied in the preceding signal acquisition sequence.
- image data that accurately reflects the TI can be obtained without being influenced by respective RF pulses.
- the number of repetitions of the B1 distribution measurement sequence is about 3, an increase in measurement time due to repetition is small. Accordingly, in both cases of Figs. 13 (a) and 13(b) , the collection of data required for the B1 distribution can be completed in about 15 seconds.
- RF pulse adjustment (steps 204 and 205 in Fig. 2 ) using the B1 distribution calculated in step 203 will be described.
- the RF coil is a multiple array coil formed by a plurality of small RF coils and a feeding point (channel), which can be independently controlled, is set for each of the small RF coils.
- the magnetic field distribution B1 total (r) as a whole can be expressed as in Expression (22).
- B ⁇ 1 total r ⁇ A n exp i ⁇ ⁇ n ⁇ B ⁇ 1 n r
- a set of amplitude and phase to give a uniform magnetic field distribution B1 (r) is calculated as the magnetic field distribution B1 total (r) (r is the position of the real space coordinate).
- the set (An, ⁇ n) of amplitude and phase can be calculated using an optimization algorithm that minimizes the square root of the mean square error of B1 total (r) calculated in Expression (22) and the target magnetic field distribution.
- the calculated set of amplitude and phase is set for each small RF coil. Specifically, the amplitude and timing of the high-frequency pulse supplied to each channel of the RF coil are adjusted by the sequencer 4 and the modulator 12.
- Desired imaging is performed using the amplitude and the phase set in steps 204 and 205 (step 206).
- the B1 distribution measured in step 202 depends on a measured part of the object. Therefore, when an object or an imaging part changes, it is preferable to perform re-measurement of the B1 distribution.
- Fig. 14 shows the procedure including a change of an object or an imaging part. In Fig. 14 , the same steps as in Fig. 2 are denoted by the same reference numerals.
- the process returns to step 201 to perform the measurement of the B1 distribution and the setting of the amplitude and phase of each small RF coil reflecting the measurement result.
- the present invention may also be similarly applied to a case where a plurality of independent RF coils are used as an RF coil.
- B ⁇ 11 B ⁇ 1 ⁇ a + B ⁇ 1 ⁇ b + B ⁇ 1 ⁇ c
- B ⁇ 12 B ⁇ 1 ⁇ b + B ⁇ 1 ⁇ c + B ⁇ 1 ⁇ d
- B ⁇ 13 B ⁇ 1 ⁇ a + B ⁇ 1 ⁇ c + B ⁇ 1 ⁇ d
- B ⁇ 14 B ⁇ 1 ⁇ a + B ⁇ 1 ⁇ b + B ⁇ 1 ⁇ d Therefore, from these Expressions, B1a to B1d of the respective channels can be calculated by the following Expressions (27) to (30).
- B ⁇ 1 ⁇ a B ⁇ 11 + B ⁇ 13 + B ⁇ 14 - 2 ⁇ B ⁇ 12 / 3
- B ⁇ 1 ⁇ b B ⁇ 11 + B ⁇ 12 + B ⁇ 14 - 2 ⁇ B ⁇ 13 / 3
- B ⁇ 1 ⁇ c B ⁇ 11 + B ⁇ 12 + B ⁇ 13 - 2 ⁇ B ⁇ 14 / 3
- B ⁇ 1 ⁇ d B ⁇ 12 + B ⁇ 13 + B ⁇ 14 - 2 ⁇ B ⁇ 11 / 3
- two channels to be used may be combined to acquire an image.
- one of the features of the present invention is that it is an MRI apparatus having a method of B1 distribution measurement, that is, a specific B1 distribution measurement sequence, and it is also possible to correct the data collected by the imaging sequence using the B1 distribution instead of adjusting the phase and amplitude of the RF coil using the measured B1 distribution.
- the present invention may also be applied to a single RF coil.
- the calculated B1 distribution may also be used to correct error of T2 values due to non-uniform B1, as post-processing when acquiring the T2 distribution, instead of being used for RF shimming.
- T2 value correction using the B1 distribution is disclosed in NPL 5, for example.
- an MRI apparatus of the present invention includes: an RF radiation unit that radiates a high-frequency magnetic field (B1) to cause nuclear magnetic resonance in an object; an imaging unit that images the object using a B1 distribution measurement sequence that includes a signal acquisition sequence to acquire a nuclear magnetic resonance signal by setting elapsed time (TI) from application of a high-frequency magnetic field pre-pulse; and a calculation unit that reconstructs an image of the object using the nuclear magnetic resonance signal and is characterized in that the calculation unit calculates an irradiation magnetic field distribution of the RF radiation unit using the image and the calculation unit calculates the irradiation magnetic field distribution using a plurality of images with the different elapsed time.
- B1 high-frequency magnetic field
- TI elapsed time
- the B1 distribution measurement sequence includes a plurality of signal acquisition sequences with the different elapsed time
- the calculation unit reconstructs the plurality of images with the different elapsed time using nuclear magnetic resonance signals acquired in the plurality of signal acquisition sequences with the different elapsed time.
- the imaging unit acquires images by executing a plurality of B1 distribution measurement sequences in which application conditions of the high-frequency magnetic field pre-pulse are different, and the calculation unit calculates the irradiation magnetic field distribution using images acquired in the plurality of B1 distribution measurement sequences in which the application conditions of the high-frequency magnetic field pre-pulse are different.
- a first B1 distribution measurement sequence is a signal acquisition sequence executed without using the high-frequency magnetic field pre-pulse
- a second B1 distribution measurement sequence includes an application of the high-frequency magnetic field pre-pulse and at least two signal acquisition sequences subsequent to the application of the high-frequency magnetic field pre-pulse.
- the calculation unit calculates the irradiation magnetic field distribution by solving a determinant using a ratio between a signal intensity of an image, which is obtained by reconstructing a nuclear magnetic resonance signal acquired in a signal acquisition sequence of the first B1 distribution measurement sequence, and each signal intensity of a plurality of images, which are obtained by reconstructing nuclear magnetic resonance signals acquired in a plurality of signal acquisition sequences of the second B1 distribution measurement sequence.
- the imaging unit executes the B1 distribution measurement sequence for each of a plurality of cross-sections, and the calculation unit calculates the irradiation magnetic field distribution for each of the plurality of cross-sections.
- the signal acquisition sequence is a multi-slice imaging sequence or a three-dimensional imaging sequence.
- the imaging unit includes a plurality of the B1 distribution measurement sequences in which application conditions of the high-frequency magnetic field pre-pulse are the same, and separately acquires all pieces of data required to reconstruct the images in the plurality of B1 distribution measurement sequences.
- the imaging unit executes the B1 distribution measurement sequence multiple times while changing the elapsed time, and the calculation unit reconstructs the plurality of images with the different elapsed time using nuclear magnetic resonance signals acquired in the respective B1 distribution measurement sequences.
- the high-frequency magnetic field pre-pulse is a high-frequency magnetic field pulse having a flip angle of 90° or more.
- a high-frequency magnetic field pulse having a flip angle of 10° or less is repeatedly applied to acquire the nuclear magnetic resonance signal.
- the plurality of signal acquisition sequences are continuous, and the high-frequency magnetic field pulse is applied at a fixed repetition time.
- the signal acquisition sequence includes an application of a high-frequency magnetic field pulse without acquisition of a nuclear magnetic resonance signal.
- the calculation unit calculates the irradiation magnetic field distribution by solving simultaneous equations using signal intensities of the plurality of images with the different elapsed time.
- the signal acquisition sequence is a pulse sequence to acquire the nuclear magnetic resonance signal by scanning k-space radially.
- the calculation unit adjusts at least one of phase and amplitude of a high-frequency magnetic field, which is supplied to the RF radiation unit, on the basis of the calculated irradiation magnetic field distribution.
- the RF radiation unit has a plurality of channels
- the imaging unit images the object by executing the B1 distribution measurement sequence for each of the channels
- the calculation unit calculates the irradiation magnetic field distribution for each of the channels.
- an irradiation magnetic field measuring method of the present invention is a method for measuring the irradiation magnetic field distribution of an RF radiation unit in a magnetic resonance imaging apparatus including the RF radiation unit, and includes: a measurement step of executing a signal acquisition sequence to acquire a nuclear magnetic resonance signal by setting elapsed time (TI) from application of a high-frequency magnetic field pre-pulse by the RF radiation unit; an image reconstruction step of reconstructing an image of the object using the nuclear magnetic resonance signal; and an irradiation magnetic field distribution calculation step of calculating the irradiation magnetic field distribution of the RF radiation unit using the image and is characterized in that, in the irradiation magnetic field distribution calculation step, the irradiation magnetic field distribution is calculated using a plurality of images with the different elapsed time.
- TI elapsed time
- a plurality of signal acquisition sequences with the different elapsed time from application of the high-frequency magnetic field pre-pulse are executed.
- the image reconstruction step the plurality of images with the different elapsed time are reconstructed using nuclear magnetic resonance signals acquired in the plurality of signal acquisition sequences with the different elapsed time.
- the measurement step includes a step of executing only a signal acquisition sequence without using the high-frequency magnetic field pre-pulse and a step of executing an application of the high-frequency magnetic field pre-pulse and at least two signal acquisition sequences subsequent to the application of the high-frequency magnetic field pre-pulse.
- the irradiation magnetic field distribution calculation step the irradiation magnetic field distribution is calculated by solving a determinant using a ratio of signal intensities of a plurality of images that are obtained by reconstructing nuclear magnetic resonance signals acquired in the signal acquisition sequences.
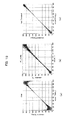
- Fig. 19 The comparison result of the calculation accuracy of the method of the present invention and the calculation accuracy of the conventional method (DAM) is shown in Fig. 19 .
- Fig. 19 shows the DAM
- (b) shows the first example
- (c) shows the third example.
- the horizontal axis indicates an actual flip angle set for the transmission coil
- the imaging time was 10.8 minutes in the DAM, but the imaging time could be significantly reduced to 15 seconds in the first and second examples and could be further reduced to 500 ms in the third example.
- conventional RF pulse magnetic field distribution measurement (B1 measurement) can be performed in a very short time. Therefore, since the B1 measurement and RF pulse control based on the measurement result can be performed in real time according to a change of an imaging part, the burden on the object due to an increase in imaging time can be reduced.
- an image of high diagnostic performance can be provided by eliminating the influence.
Landscapes
- Physics & Mathematics (AREA)
- Health & Medical Sciences (AREA)
- Life Sciences & Earth Sciences (AREA)
- Nuclear Medicine, Radiotherapy & Molecular Imaging (AREA)
- High Energy & Nuclear Physics (AREA)
- General Physics & Mathematics (AREA)
- Condensed Matter Physics & Semiconductors (AREA)
- General Health & Medical Sciences (AREA)
- Engineering & Computer Science (AREA)
- Radiology & Medical Imaging (AREA)
- Animal Behavior & Ethology (AREA)
- Medical Informatics (AREA)
- Molecular Biology (AREA)
- Surgery (AREA)
- Heart & Thoracic Surgery (AREA)
- Pathology (AREA)
- Public Health (AREA)
- Veterinary Medicine (AREA)
- Biophysics (AREA)
- Biomedical Technology (AREA)
- Signal Processing (AREA)
- Magnetic Resonance Imaging Apparatus (AREA)
Applications Claiming Priority (3)
| Application Number | Priority Date | Filing Date | Title |
|---|---|---|---|
| JP2010248652 | 2010-11-05 | ||
| JP2011147311 | 2011-07-01 | ||
| PCT/JP2011/073474 WO2012060192A1 (fr) | 2010-11-05 | 2011-10-13 | Dispositif d'imagerie par résonance magnétique et procédé de mesure du champ magnétique d'irradiation |
Publications (2)
| Publication Number | Publication Date |
|---|---|
| EP2636366A1 true EP2636366A1 (fr) | 2013-09-11 |
| EP2636366A4 EP2636366A4 (fr) | 2015-04-22 |
Family
ID=46024311
Family Applications (1)
| Application Number | Title | Priority Date | Filing Date |
|---|---|---|---|
| EP11837843.9A Withdrawn EP2636366A4 (fr) | 2010-11-05 | 2011-10-13 | Dispositif d'imagerie par résonance magnétique et procédé de mesure du champ magnétique d'irradiation |
Country Status (5)
| Country | Link |
|---|---|
| US (1) | US9400319B2 (fr) |
| EP (1) | EP2636366A4 (fr) |
| JP (1) | JP5726203B2 (fr) |
| CN (1) | CN103200868B (fr) |
| WO (1) | WO2012060192A1 (fr) |
Families Citing this family (12)
| Publication number | Priority date | Publication date | Assignee | Title |
|---|---|---|---|---|
| WO2013069513A1 (fr) * | 2011-11-08 | 2013-05-16 | 株式会社 日立メディコ | Dispositif d'imagerie par résonance magnétique et procédé de mesure de la répartition du champ magnétique auquel le patient est exposé |
| DE102012209295B4 (de) | 2012-06-01 | 2014-02-13 | Siemens Aktiengesellschaft | Bestimmung einer objektspezifischen B1-Verteilung eines Untersuchungsobjekts im Messvolumen in der Magnetresonanztechnik |
| US9700230B2 (en) * | 2012-08-29 | 2017-07-11 | Toshiba Medical Systems Corporation | Enhanced fat saturation in myocardial infarction MRI |
| KR101458557B1 (ko) * | 2013-02-20 | 2014-11-07 | 삼성전자주식회사 | 상이한 숙임각을 갖는 자기 공명 영상 시스템에서 주자장 정보 및 라디오 펄스 관련 정보를 획득하기 위한 방법 및 장치 |
| JP6552789B2 (ja) * | 2013-04-04 | 2019-07-31 | キヤノンメディカルシステムズ株式会社 | 磁気共鳴イメージング装置 |
| JP6233965B2 (ja) * | 2013-12-20 | 2017-11-22 | 株式会社日立製作所 | 磁気共鳴イメージング装置及びrfシミング方法 |
| TWI491903B (zh) * | 2013-12-31 | 2015-07-11 | Univ Nat Taiwan | 一種產生核磁共振影像傾倒角空間分佈的方法及裝置 |
| JP6615184B2 (ja) * | 2015-04-07 | 2019-12-04 | 株式会社日立製作所 | 磁気共鳴イメージング装置 |
| US10598753B2 (en) * | 2016-06-22 | 2020-03-24 | Comsats Institute Of Information Technology | GPU based implementation of sense (a parallel MRI algorithm) using left inverse method |
| US10451697B2 (en) | 2017-07-25 | 2019-10-22 | Spintech, Inc. | Systems and methods for strategically acquired gradient echo imaging |
| JP7357516B2 (ja) * | 2019-11-21 | 2023-10-06 | 富士フイルムヘルスケア株式会社 | 磁気共鳴撮像装置、及び、その制御方法 |
| US12510616B2 (en) * | 2023-06-30 | 2025-12-30 | Canon Medical Systems Corporation | Magnetic resonance imaging method, system, and computer program product utilizing B1 amplitude-based corrections |
Family Cites Families (7)
| Publication number | Priority date | Publication date | Assignee | Title |
|---|---|---|---|---|
| JP2008068830A (ja) | 2006-09-15 | 2008-03-27 | Mitsubishi Agricult Mach Co Ltd | 作業車輌 |
| EP2230531B1 (fr) * | 2009-03-18 | 2012-08-22 | Bruker BioSpin MRI GmbH | Procédé de cartographie de l'amplitude de champ de fréquence radio dans un système d'imagerie à résonance magnétique utilisant des impulsions adiabatique |
| US8077955B2 (en) * | 2009-03-19 | 2011-12-13 | Kabushiki Kaisha Toshiba | B1 mapping in MRI system using k-space spatial frequency domain filtering |
| US8198891B2 (en) * | 2009-06-15 | 2012-06-12 | General Electric Company | System, method, and apparatus for magnetic resonance RF-field measurement |
| US8558547B2 (en) * | 2011-05-05 | 2013-10-15 | General Electric Company | System and method for magnetic resonance radio-frequency field mapping |
| US8890527B1 (en) * | 2012-02-10 | 2014-11-18 | University Of New Brunswick | Methods of radio frequency magnetic field mapping |
| US10156625B2 (en) * | 2013-08-12 | 2018-12-18 | Koninklijke Philips N.V. | MR imaging with B1 mapping |
-
2011
- 2011-10-13 WO PCT/JP2011/073474 patent/WO2012060192A1/fr not_active Ceased
- 2011-10-13 US US13/880,634 patent/US9400319B2/en active Active
- 2011-10-13 JP JP2012541796A patent/JP5726203B2/ja active Active
- 2011-10-13 CN CN201180053090.5A patent/CN103200868B/zh active Active
- 2011-10-13 EP EP11837843.9A patent/EP2636366A4/fr not_active Withdrawn
Non-Patent Citations (4)
| Title |
|---|
| AKOKA S ET AL: "Radiofrequency map of an NMR coil by imaging", MAGNETIC RESONANCE IMAGING, ELSEVIER SCIENCE, TARRYTOWN, NY, US, vol. 11, no. 3, 1 January 1993 (1993-01-01), pages 437-441, XP002466125, ISSN: 0730-725X, DOI: 10.1016/0730-725X(93)90078-R * |
| JUNG-JIIN HSU ET AL: "Rapid methods for concurrent measurement of the RF-pulse flip angle and the longitudinal relaxation time", MAGNETIC RESONANCE IN MEDICINE, vol. 61, no. 6, 1 June 2009 (2009-06-01), pages 1319-1325, XP055174449, ISSN: 0740-3194, DOI: 10.1002/mrm.21900 * |
| See also references of WO2012060192A1 * |
| WARNTJES J B M ET AL: "Novel method for rapid, simultaneous T1, T2* and proton density quantification", MAGNETIC RESONANCE IN MEDICINE, JOHN WILEY & SONS, INC, US, vol. 57, 1 March 2007 (2007-03-01), pages 528-537, XP002639788, ISSN: 0740-3194, DOI: 10.1002/MRM.21165 [retrieved on 2007-02-26] * |
Also Published As
| Publication number | Publication date |
|---|---|
| CN103200868B (zh) | 2015-07-29 |
| CN103200868A (zh) | 2013-07-10 |
| EP2636366A4 (fr) | 2015-04-22 |
| JP5726203B2 (ja) | 2015-05-27 |
| JPWO2012060192A1 (ja) | 2014-05-12 |
| US9400319B2 (en) | 2016-07-26 |
| US20130207653A1 (en) | 2013-08-15 |
| WO2012060192A1 (fr) | 2012-05-10 |
Similar Documents
| Publication | Publication Date | Title |
|---|---|---|
| US9400319B2 (en) | Magnetic resonance imaging apparatus and method for measuring irradiation magnetic field | |
| US9194923B2 (en) | Magnetic resonance imaging device and transmitting sensitivity distribution calculation method | |
| US9097778B2 (en) | Magnetic resonance device with diffusion gradient phase variation positionally corrected | |
| US10012713B2 (en) | Method and device for determination of a magnetic resonance control sequence | |
| US8594766B2 (en) | Magnetic resonance imaging apparatus and method | |
| US9064303B2 (en) | Magnetic resonance imaging apparatus and magnetic resonance imaging method configured to correct specific region data based on benchmark slice | |
| US9594140B2 (en) | Magnetic resonance imaging apparatus and method for calculating correction value as application amount of refocusing pulse for UTE sequence | |
| CN102713658B (zh) | 磁化率梯度绘图 | |
| US9081075B2 (en) | Magnetic resonance imaging apparatus and magnetic resonance imaging method | |
| EP3060116B1 (fr) | Imagerie par rm avec cartographie de température | |
| US20160170001A1 (en) | Magnetic resonance imaging apparatus and magnetic resonance imaging method | |
| EP3403112A1 (fr) | Système et procédé permettant une meilleure imagerie par résonance magnétique à transfert de magnétisation homogène et non homogène | |
| US8542016B2 (en) | Magnetic resonance imaging apparatus and method | |
| US10162027B2 (en) | Magnetic resonance imaging apparatus and irradiation magnetic field distribution measurement method | |
| JP5808659B2 (ja) | 磁気共鳴イメージング装置及びT1ρイメージング法 | |
| JP5650044B2 (ja) | 磁気共鳴イメージング装置 | |
| JP6487554B2 (ja) | 磁気共鳴イメージング装置 | |
| JP5508165B2 (ja) | 磁気共鳴イメージング装置及びt2マップ取得方法 | |
| JP5283213B2 (ja) | 磁気共鳴イメージング装置 | |
| JP4079399B2 (ja) | 磁気共鳴イメージング装置 | |
| JP6233965B2 (ja) | 磁気共鳴イメージング装置及びrfシミング方法 | |
| JP2016131847A (ja) | 磁気共鳴イメージング装置および磁気共鳴イメージング方法 | |
| JP2015020037A (ja) | 磁気共鳴イメージング装置及び傾斜磁場印加制御方法 |
Legal Events
| Date | Code | Title | Description |
|---|---|---|---|
| PUAI | Public reference made under article 153(3) epc to a published international application that has entered the european phase |
Free format text: ORIGINAL CODE: 0009012 |
|
| 17P | Request for examination filed |
Effective date: 20130605 |
|
| AK | Designated contracting states |
Kind code of ref document: A1 Designated state(s): AL AT BE BG CH CY CZ DE DK EE ES FI FR GB GR HR HU IE IS IT LI LT LU LV MC MK MT NL NO PL PT RO RS SE SI SK SM TR |
|
| DAX | Request for extension of the european patent (deleted) | ||
| RA4 | Supplementary search report drawn up and despatched (corrected) |
Effective date: 20150319 |
|
| RIC1 | Information provided on ipc code assigned before grant |
Ipc: A61B 5/055 20060101AFI20150313BHEP Ipc: G01R 33/44 20060101ALI20150313BHEP Ipc: G01R 33/24 20060101ALN20150313BHEP Ipc: G01R 33/56 20060101ALN20150313BHEP Ipc: G01R 33/565 20060101ALN20150313BHEP |
|
| RAP1 | Party data changed (applicant data changed or rights of an application transferred) |
Owner name: HITACHI, LTD. |
|
| STAA | Information on the status of an ep patent application or granted ep patent |
Free format text: STATUS: REQUEST FOR EXAMINATION WAS MADE |
|
| STAA | Information on the status of an ep patent application or granted ep patent |
Free format text: STATUS: THE APPLICATION IS DEEMED TO BE WITHDRAWN |
|
| 18D | Application deemed to be withdrawn |
Effective date: 20180501 |