EP2660573A2 - Systèmes et procédés permettant d'identifier une pluralité de composés dans un mélange - Google Patents
Systèmes et procédés permettant d'identifier une pluralité de composés dans un mélange Download PDFInfo
- Publication number
- EP2660573A2 EP2660573A2 EP13002381.5A EP13002381A EP2660573A2 EP 2660573 A2 EP2660573 A2 EP 2660573A2 EP 13002381 A EP13002381 A EP 13002381A EP 2660573 A2 EP2660573 A2 EP 2660573A2
- Authority
- EP
- European Patent Office
- Prior art keywords
- spectrum
- mixture
- correlation
- compound
- library
- Prior art date
- Legal status (The legal status is an assumption and is not a legal conclusion. Google has not performed a legal analysis and makes no representation as to the accuracy of the status listed.)
- Withdrawn
Links
- 239000000203 mixture Substances 0.000 title claims abstract description 130
- 150000001875 compounds Chemical class 0.000 title claims abstract description 74
- 238000000034 method Methods 0.000 title claims description 39
- 238000001228 spectrum Methods 0.000 claims abstract description 195
- 239000011159 matrix material Substances 0.000 claims abstract description 91
- 239000013598 vector Substances 0.000 claims abstract description 47
- 230000003993 interaction Effects 0.000 claims abstract description 3
- 230000002596 correlated effect Effects 0.000 claims description 4
- 230000015654 memory Effects 0.000 description 17
- 238000010586 diagram Methods 0.000 description 13
- 238000004458 analytical method Methods 0.000 description 9
- 230000003287 optical effect Effects 0.000 description 9
- 239000000463 material Substances 0.000 description 8
- 239000000126 substance Substances 0.000 description 7
- 238000004364 calculation method Methods 0.000 description 5
- 238000001069 Raman spectroscopy Methods 0.000 description 4
- 238000004611 spectroscopical analysis Methods 0.000 description 4
- 238000001237 Raman spectrum Methods 0.000 description 3
- 230000000875 corresponding effect Effects 0.000 description 3
- 238000007667 floating Methods 0.000 description 3
- 230000004044 response Effects 0.000 description 3
- 230000003595 spectral effect Effects 0.000 description 3
- XKRFYHLGVUSROY-UHFFFAOYSA-N Argon Chemical compound [Ar] XKRFYHLGVUSROY-UHFFFAOYSA-N 0.000 description 2
- 230000005540 biological transmission Effects 0.000 description 2
- 238000004891 communication Methods 0.000 description 2
- 230000000694 effects Effects 0.000 description 2
- 230000006870 function Effects 0.000 description 2
- 239000007789 gas Substances 0.000 description 2
- 239000000383 hazardous chemical Substances 0.000 description 2
- 239000002994 raw material Substances 0.000 description 2
- 229940126062 Compound A Drugs 0.000 description 1
- NLDMNSXOCDLTTB-UHFFFAOYSA-N Heterophylliin A Natural products O1C2COC(=O)C3=CC(O)=C(O)C(O)=C3C3=C(O)C(O)=C(O)C=C3C(=O)OC2C(OC(=O)C=2C=C(O)C(O)=C(O)C=2)C(O)C1OC(=O)C1=CC(O)=C(O)C(O)=C1 NLDMNSXOCDLTTB-UHFFFAOYSA-N 0.000 description 1
- OMOVVBIIQSXZSZ-UHFFFAOYSA-N [6-(4-acetyloxy-5,9a-dimethyl-2,7-dioxo-4,5a,6,9-tetrahydro-3h-pyrano[3,4-b]oxepin-5-yl)-5-formyloxy-3-(furan-3-yl)-3a-methyl-7-methylidene-1a,2,3,4,5,6-hexahydroindeno[1,7a-b]oxiren-4-yl] 2-hydroxy-3-methylpentanoate Chemical compound CC12C(OC(=O)C(O)C(C)CC)C(OC=O)C(C3(C)C(CC(=O)OC4(C)COC(=O)CC43)OC(C)=O)C(=C)C32OC3CC1C=1C=COC=1 OMOVVBIIQSXZSZ-UHFFFAOYSA-N 0.000 description 1
- 229910052786 argon Inorganic materials 0.000 description 1
- 238000003556 assay Methods 0.000 description 1
- 230000003190 augmentative effect Effects 0.000 description 1
- -1 but not limited to Substances 0.000 description 1
- 230000008859 change Effects 0.000 description 1
- 230000005465 channeling Effects 0.000 description 1
- 231100000481 chemical toxicant Toxicity 0.000 description 1
- 239000000356 contaminant Substances 0.000 description 1
- 238000011109 contamination Methods 0.000 description 1
- 230000001419 dependent effect Effects 0.000 description 1
- 230000001627 detrimental effect Effects 0.000 description 1
- 239000003814 drug Substances 0.000 description 1
- 229940079593 drug Drugs 0.000 description 1
- 230000008030 elimination Effects 0.000 description 1
- 238000003379 elimination reaction Methods 0.000 description 1
- 238000005516 engineering process Methods 0.000 description 1
- 239000002360 explosive Substances 0.000 description 1
- 230000002068 genetic effect Effects 0.000 description 1
- 231100001261 hazardous Toxicity 0.000 description 1
- 239000007788 liquid Substances 0.000 description 1
- 239000004081 narcotic agent Substances 0.000 description 1
- 239000013307 optical fiber Substances 0.000 description 1
- 230000001151 other effect Effects 0.000 description 1
- 239000002574 poison Substances 0.000 description 1
- 231100000614 poison Toxicity 0.000 description 1
- 239000000843 powder Substances 0.000 description 1
- 238000007781 pre-processing Methods 0.000 description 1
- 230000008569 process Effects 0.000 description 1
- 238000003908 quality control method Methods 0.000 description 1
- 238000010845 search algorithm Methods 0.000 description 1
- 239000004065 semiconductor Substances 0.000 description 1
- 239000007787 solid Substances 0.000 description 1
- 238000011410 subtraction method Methods 0.000 description 1
- 239000003440 toxic substance Substances 0.000 description 1
- 230000007723 transport mechanism Effects 0.000 description 1
Images


Classifications
-
- G—PHYSICS
- G01—MEASURING; TESTING
- G01J—MEASUREMENT OF INTENSITY, VELOCITY, SPECTRAL CONTENT, POLARISATION, PHASE OR PULSE CHARACTERISTICS OF INFRARED, VISIBLE OR ULTRAVIOLET LIGHT; COLORIMETRY; RADIATION PYROMETRY
- G01J3/00—Spectrometry; Spectrophotometry; Monochromators; Measuring colours
- G01J3/28—Investigating the spectrum
- G01J3/457—Correlation spectrometry, e.g. of the intensity
-
- G—PHYSICS
- G01—MEASURING; TESTING
- G01N—INVESTIGATING OR ANALYSING MATERIALS BY DETERMINING THEIR CHEMICAL OR PHYSICAL PROPERTIES
- G01N21/00—Investigating or analysing materials by the use of optical means, i.e. using sub-millimetre waves, infrared, visible or ultraviolet light
- G01N21/62—Systems in which the material investigated is excited whereby it emits light or causes a change in wavelength of the incident light
- G01N21/63—Systems in which the material investigated is excited whereby it emits light or causes a change in wavelength of the incident light optically excited
- G01N21/65—Raman scattering
-
- G—PHYSICS
- G16—INFORMATION AND COMMUNICATION TECHNOLOGY [ICT] SPECIALLY ADAPTED FOR SPECIFIC APPLICATION FIELDS
- G16C—COMPUTATIONAL CHEMISTRY; CHEMOINFORMATICS; COMPUTATIONAL MATERIALS SCIENCE
- G16C20/00—Chemoinformatics, i.e. ICT specially adapted for the handling of physicochemical or structural data of chemical particles, elements, compounds or mixtures
- G16C20/20—Identification of molecular entities, parts thereof or of chemical compositions
-
- F—MECHANICAL ENGINEERING; LIGHTING; HEATING; WEAPONS; BLASTING
- F04—POSITIVE - DISPLACEMENT MACHINES FOR LIQUIDS; PUMPS FOR LIQUIDS OR ELASTIC FLUIDS
- F04C—ROTARY-PISTON, OR OSCILLATING-PISTON, POSITIVE-DISPLACEMENT MACHINES FOR LIQUIDS; ROTARY-PISTON, OR OSCILLATING-PISTON, POSITIVE-DISPLACEMENT PUMPS
- F04C2270/00—Control; Monitoring or safety arrangements
- F04C2270/04—Force
- F04C2270/041—Controlled or regulated
-
- G—PHYSICS
- G01—MEASURING; TESTING
- G01J—MEASUREMENT OF INTENSITY, VELOCITY, SPECTRAL CONTENT, POLARISATION, PHASE OR PULSE CHARACTERISTICS OF INFRARED, VISIBLE OR ULTRAVIOLET LIGHT; COLORIMETRY; RADIATION PYROMETRY
- G01J3/00—Spectrometry; Spectrophotometry; Monochromators; Measuring colours
- G01J3/28—Investigating the spectrum
- G01J2003/283—Investigating the spectrum computer-interfaced
- G01J2003/2833—Investigating the spectrum computer-interfaced and memorised spectra collection
-
- G—PHYSICS
- G01—MEASURING; TESTING
- G01N—INVESTIGATING OR ANALYSING MATERIALS BY DETERMINING THEIR CHEMICAL OR PHYSICAL PROPERTIES
- G01N21/00—Investigating or analysing materials by the use of optical means, i.e. using sub-millimetre waves, infrared, visible or ultraviolet light
- G01N21/01—Arrangements or apparatus for facilitating the optical investigation
- G01N2021/0106—General arrangement of respective parts
- G01N2021/0118—Apparatus with remote processing
-
- G—PHYSICS
- G01—MEASURING; TESTING
- G01N—INVESTIGATING OR ANALYSING MATERIALS BY DETERMINING THEIR CHEMICAL OR PHYSICAL PROPERTIES
- G01N2201/00—Features of devices classified in G01N21/00
- G01N2201/02—Mechanical
- G01N2201/022—Casings
- G01N2201/0221—Portable; cableless; compact; hand-held
-
- G—PHYSICS
- G01—MEASURING; TESTING
- G01N—INVESTIGATING OR ANALYSING MATERIALS BY DETERMINING THEIR CHEMICAL OR PHYSICAL PROPERTIES
- G01N2201/00—Features of devices classified in G01N21/00
- G01N2201/12—Circuits of general importance; Signal processing
- G01N2201/129—Using chemometrical methods
- G01N2201/1293—Using chemometrical methods resolving multicomponent spectra
Definitions
- the embodiments described herein relate generally to spectroscopy systems and, more particularly, to identifying a plurality of compounds in a mixture.
- At least some known spectrometry instruments include a search engine that returns a list of chemicals or compounds of a sample and, for example, a Euclidean distance, correlation, and the like.
- at least some known spectrometers identify compounds of a mixture by comparing a spectrum of the mixture to a plurality of spectra that are each associated with a different compound.
- at least some known spectrometers use linear models, mathematical analyses such as an augmented least squares analysis, and/or a state matrix to identify compounds of a mixture.
- at least some known spectrometers use scaling factors and threshold values to facilitate identifying compounds of a mixture.
- At least some known spectroscopy methods analyze samples using algorithms that may be relatively computationally intensive.
- the more accurate the identification algorithm the more computational resources and/or time the algorithm may require to identify the material.
- at least some known spectrometers employ less accurate algorithms to reduce the processing power and/or time required to analyze a sample.
- a spectrometer for identifying a mixture.
- the spectrometer includes a detector configured to generate a signal based on an interaction of light with a sample of the mixture, and a memory device having a library and a correlation matrix stored therein, wherein the library includes a plurality of spectra, each spectrum associated with a respective compound, and wherein the correlation matrix includes a correlation between each possible pair of spectra in the library.
- the spectrometer further includes a processor coupled to the memory device and configured to determine a spectrum of the mixture based on the signal generated by the detector, calculate a correlation vector that includes a correlation between the mixture spectrum and each spectrum in the library, and identify the mixture based on the correlation matrix and the correlation vector.
- a processing device configured to acquire a spectrum of a mixture, calculate a correlation vector that includes a correlation between the mixture spectrum and each of a plurality of spectra stored in a library, and identify the mixture based on the correlation vector and a correlation matrix that includes a correlation between each possible pair of spectra in the library.
- a method for identifying a mixture includes acquiring, using a spectrometer, a spectrum of the mixture, calculating, using a processing device, a correlation vector that includes a correlation between the mixture spectrum and each of a plurality of spectra stored in a library, each library spectrum associated with a respective compound, and identifying, using the processing device, the mixture based on the correlation vector and a correlation matrix that includes a correlation between each possible pair of spectra in the library.
- Fig. 1 is a schematic diagram of an exemplary spectrometer.
- Fig. 2 is a schematic block diagram of an exemplary optical architecture that may be used with the spectrometer shown in Fig. 1 .
- Fig. 3 is a schematic block diagram of an exemplary electrical architecture that may be used with the spectrometer shown in Fig. 1 .
- Fig. 4 is a flowchart of an exemplary method for identifying a plurality of compounds in a mixture using a subtraction algorithm.
- Fig. 5 is a schematic diagram illustrating operation of the subtraction algorithm shown in Fig. 4 .
- Fig. 6 is a flowchart of an exemplary method for identifying an unknown mixture using a mean squared error algorithm.
- Fig. 7 is a flowchart of a method for calculating the mean squared error of each fit for a plurality of multi-compound models.
- Fig. 8 is a flowchart of an exemplary method for calculating the mean squared error of each fit utilizing a correlation matrix.
- the systems and methods described herein enable identification of a mixture using a correlation matrix.
- the number of calculations required by a mixture identification algorithm may be significantly reduced, enabling identification of mixtures in less time and with fewer computational resources. That is, floating point and/or intermediary computations required by at least some known mixture identification algorithms can be eliminated by using the correlation matrix. Accordingly, the embodiments described herein provide relatively efficient and fast analysis of mixtures.
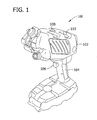
- Fig. 1 is a schematic diagram of an exemplary portable, handheld spectrometer 100 for use in analyzing a mixture to determine one or more possible compounds in the mixture.
- Fig. 1 describes a portable spectrometer, it should be understood that the systems and methods described herein are not limited to use on portable or handheld spectrometers or devices. Rather, the methods described herein may be practiced using stationary devices or using portable devices that are not handheld.
- Spectrometer 100 may be used to analyze and identify a wide variety of materials, including, but not limited to, narcotics, explosives, poisons, toxic chemicals, and/or hazardous materials.
- spectrometer 100 may be utilized by first responders at an accident and/or incident site to identify unknown materials.
- Spectrometer 100 may also be used in security environments such as airports, prisons, or border crossings to identify unknown materials.
- spectrometer 100 includes a main body 102 and a handle 104 that is coupled to the main body 102.
- Handle 104 includes an input device 106 that initiates operation of spectrometer 100 as described in greater detail below.
- input device 106 is a trigger.
- input device 106 may be any suitable means for receiving a user input such as, but not limited to, a sliding switch, a toggle switch, or a button.
- main body 102 includes one or more user control devices 108 such as, but not limited to, a joystick.
- Main body 102 also includes a display device 110 that displays, for example, a spectrum acquired from the mixture and/or a list that includes the plurality of possible compounds within the mixture.
- Fig. 2 is a schematic block diagram of an exemplary optical architecture 200 of spectrometer 100 (shown in Fig. 1 ).
- optical architecture 200 is positioned within main body 102 (shown in Fig. 1 ).
- optical architecture 200 includes an optical source 202, such as a laser that emits a monochromatic light beam in a visible light range, a near infrared light range, an infrared light range, a fluorescent light range, and/or an ultraviolet light range.
- optical source 202 directs incident photons at a sample 204 of the mixture to be identified.
- sample 204 emits Raman scattered light in response to the photons at an angle with respect to a path of the incident photons.
- the scattered light is collected using a lens 206, which is positioned to adjust a focal spot and to enhance a signal strength of the scattered light.
- Lens 206 is coupled to a Fiber Bragg grating (FBG) 208 via an optical fiber (not shown) to facilitate channeling the scattered light to FBG 208.
- FBG 208 has a fixed transmission wavelength that is based on a pitch of FBG 208.
- the scattered light is channeled through a tunable Fabry-Perot cavity 210 towards a sample detector 212.
- Optical architecture 200 may be calibrated using, for example, an argon lamp.
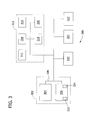
- Fig. 3 is a schematic block diagram of an exemplary electrical architecture 300 of spectrometer 100 (shown in Fig. 1 ).
- spectrometer 100 includes a controller 302 that includes a processor 304 and a memory 306 that is coupled to processor 304 via an address/data bus 308.
- controller 302 may include more than one processor 304, memory modules 306, and/or different types of memory modules 306.
- memory 306 may be implemented as, for example, semiconductor memories, magnetically readable memories, optically readable memories, or some combination thereof.
- controller 302 is coupled to a network (not shown) via a network interface 310.
- electrical architecture 300 includes optical source 202 and sample detector 212.
- Sample detector 212 includes an avalanche photodiode (APD) 312, a discriminator 314, a digitizer 316, and one or more amplifiers, such as a preamplifier 318 and a high-gain amplifier 320.
- APD avalanche photodiode
- APD 312 receives the NIM pulse, and converts the NIM pulse into a voltage signal.
- Discriminator 314 receives the amplified voltage signal from amplifier 320, and isolates single photon signals that correspond to voltage pulses within a specified range. Discriminator 314 outputs an analog signal based on the isolated single photon signals. Digitizer 316 converts the analog signal into a digital signal. Processor 304 determines a spectrum for sample 204 based on the digital signal. In some embodiments, processor 304 causes display device 110 to display the spectrum to a user. The spectrum may also be stored in memory 306 for retrieval by processor 304.
- the spectrum may be corrected and/or pre-processed to remove extraneous signals and/or artifacts in the spectrum.
- signals and/or artifacts may be present due to various instrumental effects, such as, but not limited to, the transmission of optical elements, the variability of detector response, and/or other effects.
- Raman spectroscopy fluorescence and baseline artifacts may be present in the initial spectrum.
- the spectrum may be pre-processed using, for example, a Savitzky-Golay filter.
- memory 306 includes a library 322 that stores a plurality of spectra, such as Raman spectra, of a plurality of compounds.
- Library 322 may be a complete collection of spectra, or only a subset of a larger collection of spectra.
- Spectra in library may also be preprocessed to remove extraneous signals and/or artifacts.
- Compounds may be liquid, gas, powder, and/or solid compounds.
- a correlation matrix 324 is calculated from the spectra in library 322, and stored in memory 306. Correlation matrix 324 is utilized in algorithms for identifying sample 204, as described in detail below.
- One or more of the steps of the algorithms described herein may be performed using a processing device, such as processor 304.
- a processing device such as processor 304.
- one or more of the steps of the algorithms described herein are performed by a remote processing device not located within spectrometer 100 (shown in Fig. 1 ).
- spectrometer 100 may transmit a spectrum to a remote computing device, and a processing device onboard the remote computing device may identify compounds in the spectrum using the algorithms described herein.
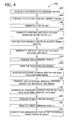
- Fig. 4 is a flowchart of an exemplary method 400 for identifying one or more compounds in a mixture, such as sample 204 (shown in Fig. 2 ), using a three-pass subtraction algorithm.
- the mixture may include and/or may be identified as a plurality of compounds, or only one compound (i.e., a pure substance).
- Fig. 5 is a schematic diagram 500 illustrating the operation of the subtraction algorithm.
- the subtraction algorithm performs three passes, identifying a plurality of three-compound models for sample 204, as described in detail below.
- any suitable number of passes may be performed by the subtraction algorithm.
- processor 304 shown in Fig. 3
- processor 304 performs the steps of method 400.
- spectrometer 100 acquires 402 a spectrum, such as a Raman spectrum, of the unknown mixture.
- a spectrum such as a Raman spectrum
- the spectrum is compared 404 against the spectra of compounds in library 322 (shown in Fig. 3 )
- a top hit set, t that includes the list of compounds in library 322 that have the highest correlation with the spectrum is generated 406.
- top hit set t includes the ten most closely correlated compounds in library 322.
- top hit set t may include any number of compounds that enables spectrometer 100 to function as described herein.
- top hit set t may include a specific number of compounds or all compounds having a mean absolute error below a threshold value.
- diagram 500 three of the ten compounds in top hit set t are shown (i.e., o12, o58, and o189).
- a residual spectrum is generated 408 by subtracting the spectrum of the compound from the acquired spectrum.
- each residual spectrum is then compared 410 against the spectra in library 322 to generate 412 a residual top hit set t' for each residual spectrum.
- the residual top hit set t' for the residual spectrum obtained by subtracting the spectrum of o12 from the acquired mixture spectrum includes o214, o435, and o657.
- a plurality of two-compound models (e.g., o12-o214, o12-o435, ... o58-067, ... o189-o567) are produced 414 from combinations of the compounds in top hit set t and residual top hit set t'.
- These two-compound models are ranked 416 according to predetermined criteria. In the exemplary embodiment, the two-compound models are ranked by their respective mean absolute error. Alternatively, the models may be ranked using any suitable measure.
- a two-pass subtraction algorithm is complete, and the two-compound model at the top of the rankings is the most likely two-compound combination in the mixture.
- the top ranked two-compound models are used to generate 418 additional residual spectra by subtracting the spectrum of each two-compound model from the original mixture spectrum.
- the spectrum of the two-compound model of o12 and o435 is subtracted from the acquired mixture spectrum to generate one additional residual spectrum
- the spectrum of the two-compound model of o58 and o67 is subtracted from the original mixture spectrum to generate another additional residual spectrum
- the spectrum of the two-compound model of o189 and o41 is subtracted from the original mixture spectrum to generate another additional residual spectrum.
- each additional residual spectrum is compared 420 against the spectra in library 322 to generate 422 an additional residual top hit set t" for each additional residual spectrum.
- the additional residual top hit set t" for the residual spectrum obtained by subtracting the spectrum of the two-compound model including o12 and o435 from the acquired mixture spectrum includes o267, o1, and o324.
- a plurality of three-compound models are produced 424 from the two-compound models from the second pass, and the additional residual top hit set t" for each additional residual spectrum.
- These three-compound models are ranked 426 according to predetermined criteria, and the three-compound model at the top of the rankings is the most likely three-compound combination in the mixture. For example, in diagram 500, the most likely three-compound combination in the mixture is determined to be o58, 067, and o11. Accordingly, the mixture is identified 428 as the top ranked three-compound combination.
- method 400 is a three-pass subtraction method.
- method may include additional passes or fewer passes (i.e., k passes to identify the mixture as a k-compound mixture).
- comparing 404 the spectrum against the spectra in library 322, comparing 410 each residual spectrum against the spectra in library 322, and comparing 420 each additional residual spectrum against spectra in library 322 may involve a relatively high number of correlation computations.
- a residual top hits set t' for ten residual spectra by comparing 410 each residual spectrum against a library with spectra for 1000 compounds would require 10,000 correlation computations.
- correlation matrix 324 shown in Fig. 3
- each library vector X i that contains that particular compound's spectral intensity (i.e., its spectrum).
- each library vector X i is normalized to unit energy.
- y be the normalized vector of the spectral intensity of the unidentified mixture (i.e., the mixture in sample 204 (shown in Fig. 2 )).
- the spectrum of each compound in library 322 is normalized to unit energy in a pre-processing step.
- each library spectrum may be normalized during processing based on a standard deviation of each library spectrum.
- the correlation operator between two vectors can be expressed using Equation 1:
- ⁇ x , y > ⁇ i x i y i ⁇ i x i 2 ⁇ i y i 2
- correlation matrix 324 is an NxN correlation matrix R that contains all of the computed correlations between the spectra of any two compounds in library 322. For example, for a library containing four compounds:
- R 1 ⁇ X 1 , X 2 > ⁇ X 1 , X 3 > ⁇ X 1 , X 4 > ⁇ X 2 , X 1 > 1 ⁇ X 2 , X 3 > ⁇ X 2 , X 4 > ⁇ X 3 , X 1 > ⁇ X 3 , X 2 > 1 ⁇ X 3 , X 4 > ⁇ X 4 , X 1 > ⁇ X 4 , X 2 > ⁇ X 4 , X 3 > 1
- R is a symmetric matrix with entries along the diagonal equal to one, and each entry in R is given by Equation 4:
- the entries in the correlation matrix R can be computed before any mixture spectra are acquired, and the correlation matrix R is the same, regardless of the mixture analyzed. Accordingly, in the exemplary embodiment, when spectrometer 100 (shown in Fig. 1 ) acquires 402 a spectrum of an unknown mixture, the correlation matrix R may already be computed and stored in memory 306. Alternatively, correlation matrix R may be computed at any time that enables spectrometer 100 to function as described herein, including on the fly during execution of the algorithms described herein. Further, correlation matrix R may be stored in memory 306 and/or stored in a memory device remote from spectrometer 100.
- correlation matrix R itself may not be stored, but may be calculated from other stored values, such as, but not limited to, a transformed correlation matrix, a covariance matrix, standard deviation of each spectrum in library 322, and/or an inverse of correlation matrix R.
- the correlation matrix R may be recomputed on-line (i.e., by processor 304) or recomputed off-line (i.e., by an external processing device) and then loaded onto spectrometer 100.
- matrices other than correlation matrix R be utilized. For example, a matrix containing weighted correlations between library spectra or a matrix containing the covariance between library spectra may be utilized.
- the correlation vector r is calculated during the first pass of the subtraction algorithm, when the spectrum of the unknown mixture is compared against the spectra of all of the compounds in library 322.
- processing device 304 compares 420 an additional residual spectrum AddRsid against every compound in library 322 by computing the correlation between the additional residual spectrum AddRsid and every spectra in library 322. If the additional residual spectrum AddRsid is generated 418 using a two-compound model including compound A and compound B (determined from the first and second pass of the subtraction algorithm), AddRsid can be expressed as:
- AddRsid y - ⁇ A ⁇ X A - ⁇ B ⁇ X B where ⁇ A and ⁇ B are regression coefficients.
- the regression coefficients can be calculated using:
- R AB is the correlation between library spectra corresponding to substances A and B
- r Ay is the correlation between the unknown spectrum and the library spectrum corresponding to substance A
- r By is the correlation between the unknown spectrum and the library spectrum corresponding to substance B
- inv( ) is the inverse of a matrix which may be calculated using Gaussian Elimination.
- R AB may either be read from a stored instance of correlation matrix R or computed on the fly as the algorithm is performed.
- Equation 1 Because the correlation operator of Equation 1 is linear, the correlation between AddRsid and every compound in the library can be expressed in terms of entries in the correlation matrix R and the correlation vector r of the unidentified mixture by mathematical manipulation. Specifically:
- the correlation between the additional residual spectrum AddRsid and the spectrum of any compound in library 322 can be calculated using the previously calculated correlations in correlation matrix R and the correlation vector r that is calculated during the first pass of the subtraction algorithm.
- memory 306 may include only one of the upper and lower half of the correlation matrix R. This significantly reduces the number of calculations required to perform the subtraction algorithm.
- Equation 9 applies to the third pass of the subtraction algorithm, similar equations (i.e., a correlation in terms of correlation matrix R and correlation vector r) can be used to calculate the correlation between each residual spectrum and the spectra in library 322 for the second pass, and to calculate correlations in subsequent passes.
- Table 1 includes the number of computations performed with and without the correlation matrix R for the subtraction algorithm illustrated in Fig. 5 .
- TABLE 1 # of Compounds in Library # of Computations without using Correlation Matrix # of Computations using Correlation Matrix 1,000 88,431,100 5,731,100 2,000 172,661,100 11,061,100 5,000 425,351,100 27,051,100 10,000 846,501,100 53,701,100
- using the correlation matrix R significantly reduces the number of computations required to perform the subtraction algorithm. Specifically, using the correlation matrix R enables processor 304 to execute the subtraction algorithm without performing numerous intermediary correlation computations in each pass.
- X is the normalized spectra of all compounds in library 322
- Y is the normalized spectrum of the unknown mixture.
- * M j k is a set of T*T models from which the M j k are selected for passes subsequent to the first pass (i.e., k>1).
- e j k is the residual spectra obtained by subtracting M j k - 1 from Y during pass k
- H j k is the list of T top hits, obtained by comparing e j k to the spectra in library 322.
- the non-normalized spectrum of the unknown mixture acquired 402 by spectrometer 100 (shown in Fig. 1 ) can be expressed as:
- the energy of S can be calculated by:
- spectrum S can be normalized to obtain the normalized spectrum Y of the unidentified mixture using:
- a dot product r y of Y with every compound in the library is computed using:
- r y X ⁇ * Y where X is the normalized spectra of all compounds in library 322.
- r is sorted in descending order.
- the T compounds with the highest values in r i.e., the closest to 1 constitute the T top hits.
- the T top hits are H j 1 . . Further, H j 1 are the same as M j 1 , , the top T one-compound candidate models.
- the correlation r j k between the residual spectrum obtained by the subtraction of model M j k - 1 from the unidentified spectrum and the ith compound in library 322 is computed using:
- r j k r - ⁇ i ⁇ M l k - 1 b i ⁇ R : i
- b i are the regression coefficients
- R(:,i) is the ith column of the pre-stored correlation matrix R.
- r j k is sorted in descending order.
- the temporary list of model candidates (i.e., * M j k ) ) is generated using:
- the T*T models are sorted by mean absolute error, and the T models with the lowest mean absolute error constitute M j k for pass k. If the current pass is the final pass of the subtraction algorithm, the mixture is identified as the model with the lowest mean absolute error. For subsequent passes, k is incremented and the process is repeated.
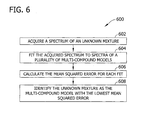
- Fig. 6 is a flowchart of an exemplary method 600 for identifying an unknown mixture, such as sample 204 (shown in Fig. 2 ), using a mean squared error algorithm.
- Spectrometer 100 (shown in Fig. 1 ) acquires 602 a spectrum, such as a Raman spectrum, of the unknown mixture.
- the acquired spectrum is fit 604 to spectra of a plurality of multi-compound models, and the mean squared error is calculated 606 for each fit.
- the unknown mixture is identified 608 as the multi-compound model with the lowest mean squared error.
- Multi-compound models may be binary (i.e., two-compound) models, ternary (i.e., three-compound) models, quaternary (i.e., four-compound) models, etc.
- processor 304 shown in Fig. 3 ) performs the steps of method 600.
- the multi-compound models are generated from combinations of the N compounds in library 322 (shown in Fig. 3 ). For example, a library of 700 compounds would generate roughly 250,000 binary models (i.e., roughly 250,000 possible combinations of two different compounds).
- Fig. 7 is a flowchart of a known method 700 for calculating the mean squared error of each fit for a plurality of multi-compound models.
- a least squares estimate of the concentration indices of each compound in the model is calculated 702.
- the least squares estimates are used to calculate 704 a residual vector for the fit.
- the mean squared error is calculated 706 as the mean of the squared terms of the residual vector.
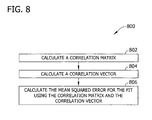
- Fig. 8 is a flowchart of an exemplary method 800 for calculating the mean squared error of each fit.
- method 800 utilizes a correlation matrix R and a correlation vector r to significantly reduce the number of computations needed to calculate the mean squared error of each fit.
- processor 304 shown in Fig. 3 ) performs the steps of method 800.
- the correlation matrix R is calculated 802 from the spectra in library 322 (shown in Fig. 3 ).
- the correlation matrix R is the same correlation matrix described above in reference to the subtraction algorithm (see Equation 4).
- the correlation vector r is calculated 804, where r i is the correlation between the spectrum of the unknown mixture and the spectrum of the ith compound in library 322.
- the correlation vector r is the same correlation vector described above in reference to the subtraction algorithm (see Equation 5).
- the mean squared error of a particular fit can be expressed as:
- MSE sd ⁇ 1 - R ⁇ 2
- MSE is the mean squared error
- sd is the standard deviation of the unknown mixture spectrum y
- R2 is the multivariate correlation between the unknown spectrum y and the particular compounds in the multi-compound model being fit to the unknown mixture spectrum.
- R2 can be expressed in terms of the correlation vector r and the correlation matrix R as:
- R ⁇ 2 r Model T * inv R Model * r Model
- R Model is the correlation matrix for every pair of substances in the multi-compound model under consideration and r Model T is the transpose of the correlation vector r Model that is the correlation vector between the unknown spectrum and the substances in the model under consideration.
- R Model may be read from the stored correlation matrix R, or computed on the fly during execution of the algorithm. Similarly r Model can be read from correlation vector R or computed on the fly during execution of the algorithm.
- the MSE of fitting a multi-compound model to the unknown mixture spectrum y can be derived in terms of the correlation vector r and the correlation matrix R.
- the mean squared error of the fit to the unknown mixture spectrum can be expressed as:
- MSE sd ⁇ 1 - r u 2 + r v 2 - 2 ⁇ r u ⁇ r v ⁇ R uv 1 - R uv 2
- Equations 20 and 21 formulas for the mean squared error for ternary (i.e., three-component) models and quaternary (i.e., four-component) models can be similarly derived.
- the mean squared error of the fit for each multi-compound model can be calculated 806 in relatively few computations. Specifically, by using the correlation matrix R and the correlation vector r, several of the floating point computations required in method 700 are avoided. Once the mean squared error for each multi-compound model is calculated 806, the unknown mixture is identified 608. Further, while in the exemplary embodiment, the mean squared error is calculated, alternatively, the multivariate correlation R2 by itself may be used to evaluate the multi-compound models (i.e., without calculating MSE from R2).
- the correlation matrix R is the same, regardless of the mixture being analyzed. Accordingly, the correlation matrix R may be calculated a single time and stored in memory 306 (shown in Fig. 3 ). This pre-calculated correlation matrix R may then be utilized in any number of mixture analyses.
- processor 304 calculates the correlation matrix R during a start-up (i.e. boot sequence) of processor 304.
- the correlation matrix R may be loaded into memory 306 from another device.
- only a pertinent portion of correlation matrix R is calculated by processor 304 and/or loaded into memory 306 at one time.
- the correlation matrix R may be updated as compounds are added and/or removed from library 322 (shown in Fig. 3 ).
- the above-described embodiments utilize a correlation matrix to identify a mixture.
- a correlation matrix By utilizing a correlation matrix, the number of calculations required by a mixture identification algorithm may be significantly reduced, enabling identification of mixtures in less time and with fewer computational resources. That is, floating point and/or intermediary computations required by at least some known mixture identification algorithms can be eliminated by using the correlation matrix.
- the embodiments described herein may enable a processor to analyze an unknown mixture spectrum fifty to one-hundred times faster than at least some known algorithms. Accordingly, the embodiments described herein provide relatively efficient and fast analysis of mixtures.
- a technical effect of the systems and methods described herein includes at least one of: (a) receiving a spectrum of a mixture; (b) calculating a correlation vector that includes a correlation between the mixture spectrum and each of a plurality of spectra stored in a library, each library spectrum associated with a respective compound; and (c) identifying the mixture based on the correlation vector and a correlation matrix that includes a correlation between each possible pair of spectra in the library.
- a computer such as those described herein, includes at least one processor or processing unit and a system memory.
- the computer typically has at least some form of computer readable media.
- computer readable media include computer storage media and communication media.
- Computer storage media include volatile and nonvolatile, removable and nonremovable media implemented in any method or technology for storage of information such as computer readable instructions, data structures, program modules, or other data.
- Communication media typically embody computer readable instructions, data structures, program modules, or other data in a modulated data signal such as a carrier wave or other transport mechanism and include any information delivery media.
- modulated data signal such as a carrier wave or other transport mechanism and include any information delivery media.
- Exemplary embodiments of methods and systems for identifying a mixture are described above in detail.
- the methods and systems are not limited to the specific embodiments described herein, but rather, components of systems and/or steps of the methods may be utilized independently and separately from other components and/or steps described herein.
- the use of a correlation matrix to reduce the calculations required for a given algorithm is not limited to applications involving spectral identification.
- a correlation matrix could be similarly implemented in, for example, genetic search algorithms. Accordingly, the exemplary embodiment can be implemented and utilized in connection with many other applications not specifically described herein.
Landscapes
- Physics & Mathematics (AREA)
- Spectroscopy & Molecular Physics (AREA)
- General Physics & Mathematics (AREA)
- Chemical & Material Sciences (AREA)
- Health & Medical Sciences (AREA)
- Life Sciences & Earth Sciences (AREA)
- Engineering & Computer Science (AREA)
- Analytical Chemistry (AREA)
- Computing Systems (AREA)
- Theoretical Computer Science (AREA)
- Bioinformatics & Cheminformatics (AREA)
- Crystallography & Structural Chemistry (AREA)
- Nuclear Medicine, Radiotherapy & Molecular Imaging (AREA)
- Bioinformatics & Computational Biology (AREA)
- Biochemistry (AREA)
- General Health & Medical Sciences (AREA)
- Immunology (AREA)
- Pathology (AREA)
- Other Investigation Or Analysis Of Materials By Electrical Means (AREA)
- Investigating, Analyzing Materials By Fluorescence Or Luminescence (AREA)
- Investigating Or Analysing Materials By Optical Means (AREA)
- Spectrometry And Color Measurement (AREA)
Applications Claiming Priority (1)
| Application Number | Priority Date | Filing Date | Title |
|---|---|---|---|
| US13/464,278 US20130297254A1 (en) | 2012-05-04 | 2012-05-04 | Systems and methods for identifying a mixture |
Publications (2)
| Publication Number | Publication Date |
|---|---|
| EP2660573A2 true EP2660573A2 (fr) | 2013-11-06 |
| EP2660573A3 EP2660573A3 (fr) | 2013-12-25 |
Family
ID=48366094
Family Applications (1)
| Application Number | Title | Priority Date | Filing Date |
|---|---|---|---|
| EP13002381.5A Withdrawn EP2660573A3 (fr) | 2012-05-04 | 2013-05-03 | Systèmes et procédés permettant d'identifier une pluralité de composés dans un mélange |
Country Status (3)
| Country | Link |
|---|---|
| US (1) | US20130297254A1 (fr) |
| EP (1) | EP2660573A3 (fr) |
| CA (1) | CA2814166A1 (fr) |
Families Citing this family (9)
| Publication number | Priority date | Publication date | Assignee | Title |
|---|---|---|---|---|
| CN104749158B (zh) | 2013-12-27 | 2020-12-11 | 同方威视技术股份有限公司 | 珠宝玉石鉴定方法及装置 |
| US10274440B2 (en) * | 2016-06-22 | 2019-04-30 | International Business Machines Corporation | Method to facilitate investigation of chemical constituents in chemical analysis data |
| EP3385703B1 (fr) * | 2017-04-07 | 2024-09-04 | Greentropism | Dispositif de spectroscopie amélioré et procédé de caractérisation d'échantillons |
| KR102600150B1 (ko) * | 2018-10-10 | 2023-11-08 | 삼성전자주식회사 | 분광 정보를 분석하는 장치 및 방법 |
| TWI709732B (zh) * | 2019-05-22 | 2020-11-11 | 佐信科技有限公司 | 光譜量測系統 |
| GB2614853B (en) * | 2020-10-06 | 2024-11-13 | Baker Hughes Oilfield Operations Llc | Data-driven solution for inverse elemental modeling |
| CN116734999A (zh) * | 2023-06-13 | 2023-09-12 | 清华大学 | 基准光谱组合的生成方法、信息存储及读取系统 |
| US20250044245A1 (en) * | 2023-07-31 | 2025-02-06 | Fei Company | Energy dispersive x-ray spectroscopy phase spectrum synthesis |
| CN119810575B (zh) * | 2025-03-12 | 2025-06-24 | 中国计量科学研究院 | 基于光谱相关性升维的毒品识别方法、装置、设备及介质 |
Family Cites Families (7)
| Publication number | Priority date | Publication date | Assignee | Title |
|---|---|---|---|---|
| US5710713A (en) * | 1995-03-20 | 1998-01-20 | The Dow Chemical Company | Method of creating standardized spectral libraries for enhanced library searching |
| US7138156B1 (en) * | 2000-09-26 | 2006-11-21 | Myrick Michael L | Filter design algorithm for multi-variate optical computing |
| US7679740B2 (en) * | 2005-07-14 | 2010-03-16 | Chemimage Corporation | Method and apparatus for multimodal detection |
| GB2443715A (en) * | 2005-12-14 | 2008-05-14 | Zinir Ltd | A portable spectrophotometer suitable for harsh environments |
| US20070211248A1 (en) * | 2006-01-17 | 2007-09-13 | Innovative American Technology, Inc. | Advanced pattern recognition systems for spectral analysis |
| US7835872B2 (en) * | 2007-02-16 | 2010-11-16 | Florida State University Research Foundation | Robust deconvolution of complex mixtures by covariance spectroscopy |
| US8271209B2 (en) * | 2009-12-18 | 2012-09-18 | General Electric Company | Spectral searching method for substance identification |
-
2012
- 2012-05-04 US US13/464,278 patent/US20130297254A1/en not_active Abandoned
-
2013
- 2013-04-26 CA CA2814166A patent/CA2814166A1/fr not_active Abandoned
- 2013-05-03 EP EP13002381.5A patent/EP2660573A3/fr not_active Withdrawn
Non-Patent Citations (1)
| Title |
|---|
| None |
Also Published As
| Publication number | Publication date |
|---|---|
| CA2814166A1 (fr) | 2013-11-04 |
| EP2660573A3 (fr) | 2013-12-25 |
| US20130297254A1 (en) | 2013-11-07 |
Similar Documents
| Publication | Publication Date | Title |
|---|---|---|
| EP2660573A2 (fr) | Systèmes et procédés permettant d'identifier une pluralité de composés dans un mélange | |
| CN105829869B (zh) | 现场使用光谱法设备的适配 | |
| EP2976620B1 (fr) | Système pour investigations par spectroscopie par claquage induit par éclairs laser (libs) et spectroscopie d'absorption infrarouge (ir) combinées, et méthode l'utilisant | |
| US8655807B2 (en) | Methods for forming recognition algorithms for laser-induced breakdown spectroscopy | |
| Feng et al. | Optimized noise reduction scheme for heterodyne spectroscopy using array detectors | |
| US20140267684A1 (en) | System and method for detecting contamination in food using hyperspectral imaging | |
| EP1955122A2 (fr) | Systeme d'analyse optique et ensemble optique | |
| Brown et al. | The Absorption Spectrum of H2S Between 2150 and 4260 cm− 1: Analysis of the Positions and Intensities in the First (2ν2, ν1, and ν3) and Second (3ν2, ν1+ ν2, and ν2+ ν3) Triad Regions | |
| US20050002029A1 (en) | Material identification employing a grating spectrometer | |
| US5826214A (en) | Hand-held probe for real-time analysis of trace pollutants in atmosphere and on surfaces | |
| EP2366991A1 (fr) | Score probabilistique pour des composants d'un mélange | |
| Maggio et al. | Unfolded partial least-squares with residual quadrilinearization: A new multivariate algorithm for processing five-way data achieving the second-order advantage. Application to fourth-order excitation-emission-kinetic-pH fluorescence analytical data | |
| El Rakwe et al. | Analysis of time‐resolved laser‐induced breakdown spectra by mean field‐independent components analysis (MFICA) and multivariate curve resolution–alternating least squares (MCR‐ALS) | |
| Gondhalekar et al. | Multiplexed detection of lanthanides using laser-induced breakdown spectroscopy: a survey of data analysis techniques | |
| Dai et al. | Molecular factor computing for predictive spectroscopy | |
| Perez-Guaita et al. | Improving the performance of hollow waveguide-based infrared gas sensors via tailored chemometrics | |
| Stordrange et al. | Multiway methods to explore and model NIR data from a batch process | |
| CN114364971B (zh) | 用于确定样品中存在的组分的光谱装置和方法 | |
| Keenan et al. | Algorithms for constrained linear unmixing with application to the hyperspectral analysis of fluorophore mixtures | |
| US20230408447A1 (en) | Multi-dimensional rydberg fingerprint spectroscopy | |
| Kraus et al. | Classification of Substances Combining Standoff Laser Induced Fluorescence and Machine Learning | |
| Zolfonoun | Determination of 6 Li and 7 Li abundances by inductively coupled plasma-optical emission spectrometry combined with derivative spectroscopy, multivariate curve resolution and multivariate calibration methods | |
| Öztürk | Monitoring the Esterification Reactions of Carboxylic Acids With Alcohols Using Near-Infrared Spectrocopy and Multivariate Calibration Methods | |
| Connelly et al. | NMF regularization techniques for unmixing frequency comb data | |
| Fritz et al. | Optical evaluation of the Tiny Remote-sensing Instrument for Thermospheric Oxygen and Nitrogen (TRITON) CubeSat payload |
Legal Events
| Date | Code | Title | Description |
|---|---|---|---|
| PUAI | Public reference made under article 153(3) epc to a published international application that has entered the european phase |
Free format text: ORIGINAL CODE: 0009012 |
|
| AK | Designated contracting states |
Kind code of ref document: A2 Designated state(s): AL AT BE BG CH CY CZ DE DK EE ES FI FR GB GR HR HU IE IS IT LI LT LU LV MC MK MT NL NO PL PT RO RS SE SI SK SM TR |
|
| AX | Request for extension of the european patent |
Extension state: BA ME |
|
| PUAL | Search report despatched |
Free format text: ORIGINAL CODE: 0009013 |
|
| AK | Designated contracting states |
Kind code of ref document: A3 Designated state(s): AL AT BE BG CH CY CZ DE DK EE ES FI FR GB GR HR HU IE IS IT LI LT LU LV MC MK MT NL NO PL PT RO RS SE SI SK SM TR |
|
| AX | Request for extension of the european patent |
Extension state: BA ME |
|
| RIC1 | Information provided on ipc code assigned before grant |
Ipc: G01J 3/457 20060101ALI20131119BHEP Ipc: G06F 19/00 20110101ALI20131119BHEP Ipc: G01J 3/28 20060101AFI20131119BHEP |
|
| STAA | Information on the status of an ep patent application or granted ep patent |
Free format text: STATUS: THE APPLICATION IS DEEMED TO BE WITHDRAWN |
|
| 18D | Application deemed to be withdrawn |
Effective date: 20140626 |