EP2665995B1 - Verfahren und systeme zur durchführung digitaler messungen - Google Patents
Verfahren und systeme zur durchführung digitaler messungen Download PDFInfo
- Publication number
- EP2665995B1 EP2665995B1 EP12736553.4A EP12736553A EP2665995B1 EP 2665995 B1 EP2665995 B1 EP 2665995B1 EP 12736553 A EP12736553 A EP 12736553A EP 2665995 B1 EP2665995 B1 EP 2665995B1
- Authority
- EP
- European Patent Office
- Prior art keywords
- droplets
- sample
- droplet
- volumes
- concentration
- Prior art date
- Legal status (The legal status is an assumption and is not a legal conclusion. Google has not performed a legal analysis and makes no representation as to the accuracy of the status listed.)
- Active
Links
Images






Classifications
-
- C—CHEMISTRY; METALLURGY
- C12—BIOCHEMISTRY; BEER; SPIRITS; WINE; VINEGAR; MICROBIOLOGY; ENZYMOLOGY; MUTATION OR GENETIC ENGINEERING
- C12Q—MEASURING OR TESTING PROCESSES INVOLVING ENZYMES, NUCLEIC ACIDS OR MICROORGANISMS; COMPOSITIONS OR TEST PAPERS THEREFOR; PROCESSES OF PREPARING SUCH COMPOSITIONS; CONDITION-RESPONSIVE CONTROL IN MICROBIOLOGICAL OR ENZYMOLOGICAL PROCESSES
- C12Q1/00—Measuring or testing processes involving enzymes, nucleic acids or microorganisms; Compositions therefor; Processes of preparing such compositions
- C12Q1/68—Measuring or testing processes involving enzymes, nucleic acids or microorganisms; Compositions therefor; Processes of preparing such compositions involving nucleic acids
- C12Q1/6806—Preparing nucleic acids for analysis, e.g. for polymerase chain reaction [PCR] assay
-
- C—CHEMISTRY; METALLURGY
- C12—BIOCHEMISTRY; BEER; SPIRITS; WINE; VINEGAR; MICROBIOLOGY; ENZYMOLOGY; MUTATION OR GENETIC ENGINEERING
- C12Q—MEASURING OR TESTING PROCESSES INVOLVING ENZYMES, NUCLEIC ACIDS OR MICROORGANISMS; COMPOSITIONS OR TEST PAPERS THEREFOR; PROCESSES OF PREPARING SUCH COMPOSITIONS; CONDITION-RESPONSIVE CONTROL IN MICROBIOLOGICAL OR ENZYMOLOGICAL PROCESSES
- C12Q1/00—Measuring or testing processes involving enzymes, nucleic acids or microorganisms; Compositions therefor; Processes of preparing such compositions
- C12Q1/68—Measuring or testing processes involving enzymes, nucleic acids or microorganisms; Compositions therefor; Processes of preparing such compositions involving nucleic acids
- C12Q1/6844—Nucleic acid amplification reactions
- C12Q1/6851—Quantitative amplification
Definitions
- the present invention relates to methods, devices and systems for performing digital measurements. More specifically, the present invention relates to methods, devices and systems for performing digital measurements in varying volumes.
- Digital measurements are becoming increasingly more important in biology, owing to their robustness, higher sensitivity and higher accuracy that they offer.
- digital measurements based on counting of binary yes or no responses, do not require calibration and thus save user time, enhance robustness and ease of the assay.
- PCR polymerase chain reaction
- qPCR quantitative PCR
- real-time PCR the absolute concentration of a sample is inferred from the time evolution of the amplification process, which is monitored with a fluorescent probe, such as a molecular beacon or Taqman® probe, that specifically recognizes the amplification product.
- a fluorescent probe such as a molecular beacon or Taqman® probe
- Real-time PCR is susceptible to various errors, including the formation of unwanted primer dimers, where primer molecules attach to each other because of complementary stretches in their sequence. As a result, a by-product is generated which competes with the target element for available PCR reagents, thus potentially inhibiting amplification of the target sequence and interfering with accurate quantification.
- the quantification of target also requires the precise knowledge of the amplification efficiency for each cycle, and because the growth is exponential, tiny uncertainties in amplification efficiency (e.g. below the threshold detection level) will result in very large errors in the determination of target copy numbers. This error can become very large when the initial concentration of nucleic acid is low or when the fluorescent detection is not sufficiently sensitive.
- real time PCR suffers from the inability to quantify low sample concentrations with sufficient precision, as required for example in the detection of pathogens or clinical diagnostics.
- DNA amplification has been developed, which can quantify the absolute number of template copies in the sample more accurately.
- dPCR the total sample is divided into an array of small volumes, such that, based on Poisson statistics, only few volumes contain one or more target molecules, while the majority of volumes contains no DNA.
- DNA amplification is then carried out in all volumes simultaneously and results in an increase of fluorescence in only those few volumes that contain target molecules.
- the DNA copy number is easily and accurately determined by counting the number of fluorescent volumes (i.e. those that contain a copy of DNA).
- RCA rolling circle amplification
- NASBA nucleic acid sequence based amplification
- LAMP loop-mediated amplification
- LAMP is an isothermal process for amplifying DNA or RNA with very high specificity at a fixed temperature between 60-65 degrees Celsius. Due to its high specificity it is able to discriminate single nucleotide differences during amplification. As a result, LAMP has been applied for SNP (single nucleotide polymorphism) typing. LAMP has also been shown to detect viral RNA with about ten-fold higher sensitivity than RT-PCR. Another feature, that differentiates LAMP from other isothermal methods, is the ability to directly correlate the amplification of DNA with the production of magnesium pyrophosphate, which increases the turbidity of the solution. The progress of the LAMP solution can thus be followed with a simple turbidimeter.
- a non-homogeneous assay can be used for detecting the amplification products that result from LAMP.
- the production of magnesium pyrophosphate can also be used in form of a fluorescent indicator, which is particularly useful for digital assay readout.
- a small amount of Calcein is added to the reaction mix.
- the increased production of pyrophosphate leads to a sharp increase in Calcein fluorescence in those volumes that contain one or more target molecules.
- WO2010/112265 discloses methods of using multivolume stochastic confinement for the quantification of a target analyte, which also utilizes DNA amplification techniques.
- the present invention provides methods, and systems for performing digital measurements in accordance with the claims. More specifically, the present invention relates to methods, devices and systems for performing digital measurements in varying volumes. In some aspects, the present invention provides methods and apparatus for increasing the dynamic range of digital measurements, including but not limited to digital PCR, digital isothermal nucleic acid amplifications (e.g. digital NASBA and digital LAMP), digital protein amplification (e.g. digital ELISA), digital single-molecule measurements, and other forms of digital measurements.
- digital PCR digital isothermal nucleic acid amplifications
- digital protein amplification e.g. digital ELISA
- digital single-molecule measurements e.g. digital single-molecule measurements
- the disclosure provides a method for increasing the dynamic range of digital measurements of a sample comprising:
- the dynamic range is increased by integrating digital measurement and readout with methods and apparatus for the formation of a concentration gradient.
- concentration gradient of analyte molecules is preferably logarithmic or exponential in shape, although a number of other shapes are possible, including but not limited to linear, polynomial, error, Gaussian, exponential, logarithmic, and any combinations thereof.
- the dynamic range is increased by using digitized volumes of varying sizes.
- the dynamic range may be increased by having on the same chip or substrate one set of array of digitized volumes that are 100 nL in volume, a second set of array that is 10 nL, a third set of array that is InL, a fourth set of array that is 100 pL, a fifth set of array that is 10 pL, a sixth set of array that is 1 pL, a seventh set of array that 100 fL, an eighth set of array that is 10 fL, and finally a ninth set of array that 1 fL. It may not be necessary to have all these sets of array on the same chip, depending on the final application.
- arrays that span 1fL to 1nL may be sufficient; for other applications, arrays that span 100nL to 1pL may be more appropriate. Yet for other applications, only two sets of arrays with two sets of differing volumes may be sufficient. The number of sets of arrays that contain different volumes will vary, and will depend on the size of each array. For example if a set of array contains one million digitized volumes, then it may not be necessary to have arrays of InL, 100pL, 10pL and 1pL to span the concentration range of pL to nL, and simply two sets of arrays of 100pL and 1pL may be sufficient.
- the use of concentration gradients and varying sizes of digitized volumes can be combined to further increase the dynamic range of the digital measurement.
- the disclosure is a method for increasing the dynamic range of digital single-molecule measurements of a sample using a concentration gradient or discrete volumes of different sizes.
- the disclosure is a process of preparing a patterned surface with hydrophobic and hydrophilic patches, wherein said patches cause the formation of wetted droplets of different size sample volumes.
- the dislcosure is non-transitory computer-readable medium having computer executable instructions stored thereon, the instructions for a machine to carry out any of the methods described herein.
- the disclosure is an array comprising a patterned surface with hydrophobic and hydrophilic patches, wherein said patches cause the formation of wetted droplets of different size sample volumes.
- the disclosure is used to increase the dynamic range of digital measurements of a sample in a non-homogeneous assay. It is important to note that there are a number of methods for forming concentration gradients as well as for digitizing sample volumes. The examples provided herein should not be considered limiting.
- This invention also describes methods and apparatus for carrying out the following: (1) digital NASBA, (2) digital LAMP, (3) Performing PCR or other nucleic acid amplification using surface-attached droplet formed using a surface patterned with hydrophobic and hydrophilic patches, and (4) Performing readout of digital nucleic acid amplification using a non-homogeneous assay.
- the present invention provides a method for using digital measurements to determine a concentration of an analyte in a sample.
- the method comprises producing a plurality of droplets having a volume distribution, wherein the volume distribution is a continuous volume distribution and wherein at least one of the droplets of the plurality contains contents from the sample; analyzing some or all of the plurality of droplets to determine individual volumes of the droplets in the some or all of the plurality and a number of droplets in the some or all of the plurality that contain a detectable agent; and using individual volumes of the droplets in the some or all of the plurality and the number of droplets in the some or all of the plurality that contain the detectable agent to determine the concentration of the sample.
- the present invention provides a system for conducting digital measurements of a sample.
- the system comprises a sample holder containing a plurality of droplets having a volume distribution, wherein the volume distribution is a continuous distribution; a detector for detecting a detectable agent contained in at least one droplet of some or all of the plurality of droplets; a detector for determining individual volumes of the some or all of the plurality of droplets; and a computer comprising a memory device with executable instructions stored thereon, the instructions, when executed by a processor, cause the processor to: analyze some or all of the plurality of droplets to determine individual volumes of the droplets in the some or all of the plurality of droplets and a number of droplets in the some or all of the plurality of droplets that contain a detectable agent; and use individual volumes of the droplets in the some or all of the plurality of droplets and the number of droplets in the some or all of the plurality of droplets that contain the detectable agent to determine the concentration of the sample.
- the method of the present invention further comprises performing digital loop-mediated amplification of a sample by producing a plurality of droplets of the sample on a microfluidic device, wherein at least one droplet in the plurality comprises a nucleic acid molecule; and performing loop-mediated amplification in the at least one droplet to produce amplified product of the nucleic acid molecule.
- the present invention relates to methods and systems for performing digital measurements. More specifically, the present invention relates to methods and systems for performing digital measurements in varying volumes.
- the present invention is based in-part on increasing the dynamic range of a digital assay by generating volumes with variable size.
- the size of the volumes can define the probability of being occupied by one or more molecules (e.g., template molecules) of interest.
- variation of volume size can be used to alter this occupational probability and thus the number of wells or sample volumes (e.g., droplets) that show amplification.
- the present invention is better than existing techniques that simply increase the number of volumes with constant size so as to increase the dynamic range.
- the present invention provides methods, and systems for performing digital assays with increased dynamic range, where a large number of volumes of varying size is generated.
- the present invention can include use of a distribution of sizes (e.g., volumes) that is continuous rather than discrete.
- droplets of variable size can be created in various ways, either randomly or through controlled application of microfluidics.
- microfluidic generation of constant volume droplets is well known in the art by using a T-junction or flow-focusing device.
- the size of the droplet can be controlled by the shear rate and channel dimensions. If for a given T-junction geometry the shear rate is continuously varied, droplets of different volumes can be generated.
- These methods can be realized, e.g., by computer-controlled syringe pumps or modulated air pressure, which adjusts the relative flow speeds of the aqueous phase and the oil carrier fluid.
- droplets of various size can be generated randomly, by emulsification in a sample holder (e.g., a test tube). Droplet randomness can simplify the experiment because, e.g., no efforts need be made to control the size of droplets. During emulsification, droplets of different volume can be stabilized with the use of different surfactants.
- the emulsification approach is particularly useful for several reasons: (1) the method is compatible with basic instrumentation found in every biomedical laboratory, (2) droplet generation is simple; it does not require complex chip design or sophisticated equipment for flow control, (3) the droplets are not confined in individual wells, which minimizes the space required to accommodate a large number of droplets and (4) the assay is simple because the same container can be used for droplet generation and droplet storage during amplification. No sample transfer is needed between droplet generation and the amplification reaction.
- dynamic range is defined as the ratio between the largest and smallest possible values of a changeable quantity.
- digitized volumes refers to the volumes produced after obtaining an initial sample and separating it into physically distinct smaller volumes in preparation for an assay.
- homogeneous assay is defined where all assay components exist in solution phase at the time of detection. In a homogeneous assay, no component of the assay scatters detectable light.
- non-homogeneous assay is defined where one or more assay components are present in solid phase at the time of detection. Formation of a precipitate or particulate, such as in LAMP or rolling circle amplification, is a common form of a heterogeneous assay. In this type of assay, the solid phase components may scatter detectable light.
- a continuous volume distribution is intended to describe a distribution of volumes that vary continuously, rather than by pre-defined discrete steps, across the volume distribution.
- chip-based platforms can include well or droplet volumes that over a volume distribution defined by pre-defined, discrete steps fabricated as part of the chip. That is, a chip can be made to have volumes present at 100 nL, 10 nL, and 1 nL, with no other volumes present in between those discrete steps.
- a continuous volume distribution in not pre-defined i.e., the volume distribution is undefined prior to producing or forming droplet volumes).
- the continuous volume distributions can, for example, be produced via emulsification, as described further herein.
- the volumes e.g., droplet volumes
- the droplet volumes in the distribution are undefined prior to producing the droplets (i.e., not pre-defined by fabrication techniques) and the volumes are randomly distributed along the continuous volume distribution.
- An upper and lower boundary for droplet volumes can be modified by the forces imparted on the emulsion (e.g., by the speed of vortexing or the intensity of shaking).
- the droplet volumes generated by such techniques continuously vary along the volume distribution produced.
- continuous volume distributions can also be characterized such that for any set (or plurality) of droplet volumes, its distribution function can be denoted f(x), where f(x)dx is the probability that a given droplet in the set will have a volume between x and x+dx. (dx is an infinitesimally small number.)
- a continuous distribution is one where the volumes of the droplets in the droplet set are (1) not prespecified and (2) that for some range x lower ⁇ x ⁇ x upper , f(x) is always greater than zero (x lower cannot be equal to x upper , and nothing more needs to be known about f(x)).
- the present invention can in some embodiments include using a droplet set drawn from a continuous distribution, measuring the volume of each droplet in the set and using the measured droplet volumes in analysis.
- the present disclosure provides a method for creating concentration gradients that are integrated with digital measurement and readout.
- a method for creating concentration gradients For example, one might integrate microfluidic gradient generation with a sample digitization chip.
- Figure 1 shows an example of concentration gradients formed using microchannel inlets. For increasing the dynamic range, a logarithmic or exponential concentration gradient is preferred, but a number of methods are now available for forming various types and shapes of concentration gradients on chip, including nonlinear gradients such as power, exponential, error, Gaussian, and cubic root functions.
- Figure 1 depicts the generation of digitized volumes containing a gradient concentration of analytes.
- inlet reservoirs or channels there needs to be only 2 inlet reservoirs or channels, but more would also be suitable for use of the disclosure.
- One inlet is used for the sample and one for buffer (or PCR reagent in the case of digital PCR).
- buffer or PCR reagent in the case of digital PCR.
- the sample solution becomes diluted by the buffer (water or PCR reagent) solution in a pre-defined fashion such that at each of the outlet channels, a different concentration of the sample is present.
- Linear, polynomial, and logarithmic gradients spanning 6 orders of magnitude have all been generated using variations of this design.
- a logarithmic or exponential gradient spanning 6 orders of magnitude in concentration is used.
- the sample and PCR solution is pipetted into the two inlet reservoirs, after which they will pass over the array of wells.
- the wells in this example are of the same volume.
- the scheme depicted in Figure 1 is used with wells of varying volumes.
- sample and PCR solution is pipetted into the two inlet reservoirs, after which they will pass over an array of hydrophilic and hydrophobic patches. As the sample flows over the hydrophilic patches, they cause the formation of wetted droplets of different size sample volumes.
- the sample can be digitized as shown using the pattered surface shown in Figure 2 .
- the gradients are used in conjunction with digitized volumes created using valves, wells, or droplets.
- the droplets can be formed in a continuous-flow fashion either in the T-channel geometry or in the flow focusing geometry, both of which are well known in the art.
- the digitization scheme described in Figure 1 can be used.
- the sample solution containing different concentrations of target molecule are flown over the topographically patterned surface to form digitized and discrete volumes for subsequent digital measurements and readout.
- the sample can be digitized using microfluidic channels and immiscible fluid phases.
- the sample phase is introduced into the channel, followed by an immiscible phase which forms discrete sample volumes that are defined by the geometric dimensions of the side cavities ( D.E. Cohen, T. Schneider, M. Wang, D.T. Chiu Anal. Chem. 82, 5707-5717 ).
- Another aspect of the disclosure comprises a device for carrying out the methods of the invention.
- Such devices may create concentration gradients that are integrated with digital measurement and readout.
- the device carries out the method for increasing the dynamic range of digital measurements of a sample, comprising creating a sample concentration gradient; and/or creating sample volumes of different sizes.
- the present disclosure includes methods to increase the dynamic range of digital measurements that are based on creating arrays of digitized and discrete volumes of different sizes.
- This method is better than simply increasing the number of digitized volume so as to increase dynamic range. This is because simply increasing the number of digitized volumes increase the area the volumes occupy as well as increase the likelihood of having defects on the chip where some digitized volumes do not form properly or have other defects. Simply increasing the number of digitized volumes also increase the time required to analyze all the digitized volume.
- a better approach to increase the dynamic range is by creating arrays of digitized volumes of different sizes rather than simply increasing the number of digitized volumes.
- the arrays of digitized volumes of different sizes can be a random array (e.g. droplets of different diameters all present and distributed randomly in a container) or can be a regular array (e.g. those shown in Figure 2 ).
- Figure 2 shows one example of creating arrays of digitized volumes of different sizes, where patterned surfaces are used to create arrays of volumes of different sizes.
- 7 sets of arrays are created, where each array contains 900 digitized volumes (30 ⁇ 30).
- the array is formed by creating hydrophilic circular patches in a background of a hydrophobic surface. As a result, when the surface is exposed to aqueous solution and oil, the hydrophilic patches will be covered by an aqueous drop surrounded by oil. The side view of the aqueous drop is shown at the bottom of the figure.
- This side view depicts a hemi-spherical drop, but the shape can change (either more pancaked or more rounded) depending on the exact surfaces we use and the oil and aqueous solution used. In one embodiment, a heavy oil is used, and the drop will be more pancaked because the oil will push on the drop.
- each set of the 900 hydrophilic patches have different sizes, ranging from 1 ⁇ m in diameter to 5 ⁇ m to 10 ⁇ m to 50 ⁇ m to 100 ⁇ m to 500 ⁇ m and finally to 1mm in diameter. Because the volume of the drop scales roughly as cubic to the diameter of the drop, increasing the diameter of the patch by 10 times increases the volume by about 1,000 times. As a result, using digitized volumes of varying sizes is more efficient in terms of space and readout than simply using more digitized volumes of the same size. In one embodiment, 900 digitized volumes for each set of the array is used because this number is suitable for arriving at a statistically robust digital readout. However, depending on the particular application and the needed robustness of the readout, either more digitized volumes within each set of array or less digitized volumes can be designed.
- the present disclosure provides methods for using digital measurements to determine a concentration of a sample.
- the methods can include producing a first plurality of droplets having a first volume distribution, wherein at least one of the droplets of the first plurality contains contents from the sample; analyzing a second plurality of droplets having a second volume distribution to determine volumes of the droplets in the second plurality and a number of droplets in the second plurality that contain a detectable agent, wherein the first volume distribution is the same or different than the second volume distribution; and using volumes of the droplets in the second plurality and the number of droplets in the second plurality that contain the detectable agent to determine the concentration of the sample.
- the volumes can be created using valves, wells, or droplets.
- the embodiments that involve droplets may be particularly useful.
- droplets of different volumes can be generated using a wide range of methods.
- droplets of a defined volume are generated using microfluidics (e.g. with T-channel or flow focusing as well known in the art); by varying the shear rate or channel dimension, droplets of different sizes are easily formed.
- the droplets of different volumes are generated by emulsification with the aid of different surfactants; here the droplets of different volumes are stabilized and are controlled with the use of different surfactants.
- amplification of analyte e.g.
- digital PCR can be carried out simultaneously in all droplets of different volumes (sizes), after which the droplets can be flowed in a single-file format through a flow cytometer or other similar device where the size of the droplet can be determined and the fluorescence from the droplet can be interrogated.
- the presence of amplification product in each droplet is determined based on fluorescence and the size (volume) of each droplet is determined based on the scattering signal from the droplet.
- the size of each droplet and the presence or absence of amplification product in each droplet of a given size it is possible to back-calculate the original concentration of the analyte present in the sample after interrogating a sufficient number of droplets of different sizes. Because the droplets are of different sizes, for a given dynamic range, the analysis is much faster than if the droplets are all of a similar size for reasons discussed previously.
- the volumes can be produced having a variety of volume distributions, which can be analyzed using a variety of different methods.
- a sample can contain a molecule or molecules of interest that can be analyzed.
- Discrete volumes of the sample can be generated for analysis via digital measurements.
- the methods herein can include producing a plurality of droplets having a volume distribution.
- the plurality of droplets of the sample can be produced in an emulsion that includes combining immiscible fluids, as further described herein.
- a sample can include an aqueous solution that includes a molecule of interest (e.g., a nucleic acid molecule).
- the sample can be mixed with an oil to form droplets of the sample suspended in the oil.
- the volumes of the plurality of droplets in the emulsion can be randomly distributed along a continuous volume distribution.
- the ranges of volumes can be controlled by the method used to form the emulsions. For example, intensity of vortexing, shaking, and/or sonicating can be controlled to produce a desired volume distribution.
- the volume distributions of the plurality of droplets can include a volume range from about 100 nanoliters (nL) to about 1 femtoliter (fL), from about 10 nL to about 10 fL, from about 1 nL to about 100 fL, from about 100 nL to about 1 picoliter (pL), from about 10 nL to about 10 pL, from about 1 nL to about 1 pL.
- volume in the distributions can range by more than a factor of 2, by more than a factor of 10, or by more than a factor of 100 and by other factors.
- the lower boundary of the volume distribution can be, e.g., 10 nL with an upper boundary of 20 nL.
- the lower boundary of the volume distribution can be, e.g., 10 nL with an upper boundary of 100 nL.
- the present disclosure further includes analyzing a second plurality of droplets having a second volume distribution.
- Analyzing the second plurality of droplets can include, e.g.., determining volumes of the droplets in the second plurality. This volume determination can be done using a variety of methods (e.g., using scattering and/or microscopy). In some embodiments, individual volumes of all of the droplets in the plurality may be determined. In some embodiments, only individual volumes of some of the droplets may be determined. Analyzing the droplets can also include determining the number of droplets that include a detectable agent (i.e., one or more detectable agents) further described herein.
- a detectable agent i.e., one or more detectable agents
- the second plurality of droplets is based on the same droplets produced as the first plurality of droplets.
- the first volume distribution can be the same or different (e.g., narrower) than the second volume distribution. If the distributions are the same, then each droplet in the first plurality will be included in the second plurality.
- the second volume distribution is narrower than the first volume distribution.
- droplets can be produced in an emulsion having a volume distribution ranging from about 1 fL to about 100 nL.
- analysis for digital measurements may be conducted for a volume distribution ranging from 1 fL to about 1 nL, in which the second volume distribution is narrower than the first volume distribution.
- Reactions can be carried out in volumes with different sizes, before or during analysis of the volumes to determine in which volumes have undergone reaction (e.g., have amplified product).
- the volumes e.g., droplets
- the number of occupied droplets e.g., droplets containing a detectable agent
- All or just some of the droplets can be analyzed. Analysis can, for example, be achieved by flowing the droplets in a single file through a flow cytometer or similar device, where the size of the droplet can be determined and the presence of amplification can be detected.
- the size of the droplet can, for example, determined based on the scattering signal from the droplet and the presence of amplification can be indicated by a fluorescence signal from the droplet. Alternatively, the diameter of droplets can be determined by microscopy.
- Droplets can be extracted (before, during, or after completion of a reaction, e.g., amplification) from a sample holder and imaged in widefield with a CCD camera. The droplets, e.g., can be spread out on a surface or embedded between two glass slides and placed under a widefield microscope. By using appropriate excitation and emission filters the fluorescence within the droplet can be quantified to reveal the presence or absence of amplification.
- the methods herein further include using a number of droplets in a plurality and the individual volumes of the droplets in the plurality to conduct digital measurements.
- a sample concentration of a molecule of interest can be determined using the number of droplets in the plurality, the number of droplets in the plurality with one or more molecules of interest, and by measuring the volume of some or all of the droplets in the plurality.
- Example methods for determining sample concentrations can be found in the Examples section.
- the present invention can be used for any technique in which digital measurements provide useful information about a sample.
- the methods, systems and devices provided herein can include a volume containing a detectable agent.
- the volume can be a well or chamber in a microfluidic chip or a droplet (e.g., a water droplet formed in an emulsion or on the surface of a chip) that contains the detectable agent.
- the detectable agent can include a single detectable molecule or a plurality of detectable molecules.
- Other types of detectable agents can be used, e.g., beads, quantum dots, nanoparticles, and the like.
- the detectable agent may, for example, be a molecule of interest present in a sample to be analyzed (e.g., a nucleic acid molecule in blood, serum, saliva or other solutions).
- a detectable agent can be a molecule that associates with a molecule of interest (e.g., the nucleic acid molecule) in the sample, thereby allowing the molecule to be detected.
- the methods and systems of the present invention can be used for amplification-related techniques (e.g., digital PCR) involving digital measurements.
- a volume e.g., a droplet
- the detectable agent is fluorescent and, thus, can be detected by fluorescence-based detection methods known in the art.
- other detection methods e.g., absorbance, chemiluminescence, turbidity, and/or scattering
- detectable agents suitable for the present invention are generally well known in the art and can, for example, be found in The Molecular Probes® Handbook, 11th Edition (2010 ).
- the detectable agent can be associated with a molecule of interest for detection.
- the detectable agent can be associated with a nucleic acid molecule (e.g., DNA or RNA), a peptide, a protein, a lipid, or other molecule (e.g., biomolecule) present in a sample.
- "associated" in the context of the detectable agent includes interaction with the molecule via covalent and/or non-covalent interactions.
- the detectable agent can be covalently attached to the molecule of interest.
- the detectable agent can, for example, be an intercalation agent or a Taqman® probe that can be used to detect a nucleic acid molecule (e.g. a DNA and/or RNA molecule).
- Other detectable agents can be used, such as reference dyes that may not associate with molecules in a volume of interest.
- Some embodiments of the present invention include producing droplets in immiscible fluids.
- immiscible fluids can be combined to produce droplets of varying volumes.
- the fluids can be combined through a variety of ways, such as by emulsification.
- aqueous solution e.g., water
- non-aqueous fluid e.g., oil
- Aqueous solutions suitable for use in the present invention can include a water-based solution that can further include buffers, salts, and other components generally known to be used in detection assays, such as PCR.
- aqueous solutions described herein can include, e.g., primers, nucleotides, and probes.
- Suitable non-aqueous fluids can include, but are not limited to, an organic phase fluid such as a mineral oil (e.g., light mineral oil), a silicone oil, a fluorinated oil or fluid (e.g., a fluorinated alcohol or Fluorinert), other commercially available materials (e.g., Tegosoft®), or a combination thereof.
- an organic phase fluid such as a mineral oil (e.g., light mineral oil), a silicone oil, a fluorinated oil or fluid (e.g., a fluorinated alcohol or Fluorinert), other commercially available materials (e.g., Tegosoft®), or a combination thereof.
- surfactants can also be included to, e.g., improve stability of the droplets and/or to facilitate droplet formation.
- Suitable surfactants can include, but are not limited to, non-ionic surfactants, ionic surfactants, silicone-based surfactants, fluorinated surfactants or a combination thereof.
- Non-ionic surfactants can include, for example, sorbitan monostearate (Span 60), octylphenoxyethoxyethanol (Triton X-100), polyoxyethylenesorbitan monooleate (Tween 80) and sorbitan monooleate (Span 80).
- Silicone-based surfactants can include, for example, ABIL WE 09 surfactant. Other types of surfactants generally well known in the art can similarly be used.
- the surfactant can be present at a variety of concentrations or ranges of concentrations, such as approximately 0.01%, 0.1%, 0.25%, 0.5%, 1%, 5%, or 10% by weight.
- the present disclosure further includes determining a concentration of a sample.
- the methods and systems can be used to determine (1) volumes of droplets and (2) a number of droplets that contain a detectable agent, which can be used to determine the concentration of a sample.
- This information can be used in a variety of ways to determine sample concentrations.
- target molecules are present in the sample at a concentration in units of molecules/volume.
- the sample can be distributed into droplets of variable volumes that can be analyzed.
- the individual volumes of the droplets (all or just some) can be determined by methods provided herein.
- droplets can be analyzed for containing a detectable agent or not. For a given sample concentration, some of the variable volume droplets may contain a detectable agent and some may not.
- the probabilities of occupancy by a detectable agent in a particular volume distribution can be defined for a wide range of sample concentrations, which can then be compared to real data to determine the concentration of an unknown sample. Additional disclosure for determining sample concentrations can be found in Examples 1 and 2 below.
- the method illustrated in the examples involves making an initial estimate for the sample concentration and then calculating the number of droplets, which would be predicted to contain one or more detectable agents (occupied droplets). The estimate for the sample concentration is then adjusted using a well-known numerical method until the predicted number of occupied droplets equals the actual number of occupied droplets in the plurality to within the desired degree of accuracy.
- the present invention provides various aspects for digital measurements that cannot be achieved by some existing methods and systems.
- the present invention can provide the ability to measure sample concentration over a wide dynamic range.
- the dynamic range can be at least three orders of magnitude, at least four orders of magnitude, at least five orders of magnitude, or at least six orders of magnitude.
- the dynamic range can be between about 10 -1 to about 10 -9 molecules/fL, about 10 -2 to about 10 -8 molecules/fL, about 10 -3 to about 10 -7 molecules/fL, or about 10 -4 to about 10 -6 molecules/fL.
- determining sample concentration within a dynamic range can be performed by detecting a detectable agent that is associated with a molecule of interest in the sample.
- Dynamic range can be dependent on a variety of factors, such as the range of volumes that are produced in an emulsion and/or the range of volumes that are analyzed and detected. For example, a first plurality of droplets having a first volume distribution can produce a dynamic range of detectable concentrations.
- the dynamic range may be decreased by analyzing a narrower volume distribution in a second plurality of droplets having a second volume distribution.
- the volume distributions include continuously varying droplet volumes.
- the invention effectively increases the dynamic range of our dPCR chip from 1 order to 6 orders magnitude, which is comparable to the dynamic range offered by RT-PCR.
- the dynamic range can be increased even further if desired.
- This new method for carrying out quantitative PCR offers several key advantages: (1) It is more accurate as discussed previously, (2) It obviates the need for running the type of calibration samples that is needed for RT-PCR and thus saves time, and (3) It removes the need for real-time sensitive fluorescence detection, which is responsible for the relatively higher cost ( ⁇ 10 ⁇ ) of RT-PCR versus regular PCR machines.
- Another aspect of the dislcosure comprises a device for carrying out the methods of the invention.
- Such devices may create arrays of digitized and discrete volumes of different sizes.
- the device carries out the method for increasing the dynamic range of digital measurements of a sample, comprising creating a sample concentration gradient and creating sample volumes of different sizes.
- the methods, systems and devices described herein can be applied to isothermal amplification techniques, such as digital ELISA, NASBA, and LAMP.
- ELISA is protein based and usually used for the quantification of proteins or small molecules.
- NASBA and LAMP are isothermal amplification schemes that have been developed to complement PCR.
- isothermal nucleic acid amplification methods such as transcription mediated amplification, nucleic acid sequence-based amplification, signal mediated amplification of RNA technology, strand displacement amplification, rolling circle amplification, loop-mediated isothermal amplification of DNA, isothermal multiple displacement amplification, helicase-dependent amplification, single primer isothermal amplification, and circular helicase-dependent amplification.
- NASBA Nucleic Acid Sequence Based Amplification
- NASBA is an isothermal ( ⁇ 40 °C) process for amplifying RNA, and has been used successfully at detecting both viral and bacterial RNA in clinical samples.
- the advantages offered by NASBA are: (1) It has high amplification efficiency and fast amplification kinetics, where over thousand fold amplification can be achieved within an hour or two; (2) It does not give false positives caused by genomic dsDNA, as in the case of RT-PCR; (3) Gene expression studies can be performed without the use of intron flanking primers; (4) It does not require the degree of temperature control and feedback needed for PCR.
- NASBA has become popular for detecting viral and bacterial RNA.
- the fact that NASBA is an isothermal method makes it possible to run multiple samples simultaneously with the use of a temperature controlled oven, which is an important practical advantage in many field works.
- LAMP which stands for Loop-Mediated Isothermal Amplification, is capable of amplifying DNA with high specificity, efficiency, and rapidity under isothermal conditions ( ⁇ 60 °C). Because of the characteristics of its amplification reaction, LAMP is able to discriminate single nucleotide differences during amplification. As a result, LAMP has been applied for SNP (single nucleotide polymorphism) typing. LAMP has also been shown to have about 10 fold higher sensitivity then RT-PCR in the detection of viruses. Additionally, because LAMP amplification of DNA can be directly correlated with the production of magnesium pyrophosphate, which increases the turbidity of solution, the progress of LAMP has been monitored using a simple turbidimeter. Therefore, a non-homogenous assay can be used for detecting the amplification products that result from LAMP.
- SNP single nucleotide polymorphism
- the present disclosure provides a method for performing digital loop-mediated amplification of a sample.
- the method can include producing a plurality of droplets of the sample on a microfluidic device, wherein at least one droplet in the plurality comprises a nucleic acid molecule (e.g., a DNA and/or a RNA molecule); and performing loop-mediated amplification in the at least one droplet to produce amplified product of the nucleic acid molecule.
- the method can also include detecting the amplified product.
- the method includes determining a number of droplets in the plurality that comprise the amplified product; and calculating a concentration of the nucleic acid molecule in the sample using individual volumes of the droplets in the plurality and the number of droplets in the plurality that contain the nucleic acid molecule.
- the microfluidic device can include a plurality of chambers configured to form the plurality of droplets. Additional aspects of performing digital LAMP with the present invention can be found in Example 3.
- Rolling circle amplification is an isothermal nucleic-acid amplification method. It differs from the polymerase chain reaction and other nucleic-acid amplification schemes in several respects.
- a short DNA probe anneals to a target DNA of interest, such as the DNA of a pathogenic organism or a human gene containing a deleterious mutation.
- the probe then acts as a primer for a Rolling Circle Amplification reaction.
- the free end of the probe anneals to a small circular DNA template.
- a DNA polymerase is added to extend the primer.
- the DNA polymerase extends the primer continuously around the circular DNA template generating a long DNA product that consists of many repeated copies of the circle.
- the polymerase By the end of the reaction, the polymerase generates many thousands of copies of the circular template, with the chain of copies tethered to the original target DNA. This allows for spatial resolution of target and rapid amplification of the signal.
- the use of forward and reverse primers can change the above linear amplification reaction into an exponential mode that can generate up to 1012 copies in 1 hour. The calibration required for such quantitative measurements can be cumbersome.
- the present invention provides digital isothermal amplifications, such as NASBA and LAMP, where the use of an array of digitized volumes, similar to digital PCR, is used for carrying out digital NASBA, digital LAMP, and rolling circle amplification. Furthermore, by using concentration gradients and/or arrays of digitized volumes of different sizes, we can effectively increase the dynamic range of these digital measurements.
- the current method ideally complements these isothermal amplification schemes to make them a quantitative technique for measuring the presence of RNA and DNA.
- the method is applied to antibody based amplification.
- the method is applied to specific molecule recognition based amplification.
- the present disclosure provides systems for using digital measurements to determine a concentration of a sample.
- the systems can include a sample holder containing a first plurality of droplets having a first volume distribution; a detector for detecting a detectable agent contained in at least one droplet of the first plurality; and a computer comprising a memory device with executable instructions stored thereon, the instructions, when executed by a processor, cause the processor to: analyze a second plurality of droplets having a second volume distribution to determine volumes of the droplets in the second plurality and a number of droplets in the second plurality that contain a detectable agent, wherein the first volume distribution is the same or different than the second volume distribution; and use volumes of the droplets in the second plurality and the number of droplets in the second plurality that contain the detectable agent to determine the concentration of the sample.
- the concentration of the detectable agent in the sample is used to calculate the sample concentration.
- the volumes used for digital measurements can be generated and analyzed by a variety of ways.
- the present invention includes a sample holder that can be used to hold the volumes so that the volumes can be further processed and/or analyzed.
- the sample holders of the present invention can include test tubes, eppendorf tubes, arrays of wells on a microarray or in a microfluidic chip, a microfluidic chip configured to generate droplets, as well as other commercially available or otherwise generally known devices capable of holding discrete volumes (e.g., wells or droplets) of a sample.
- the systems of the present invention further include a detection system configured to analyze the volumes.
- the detection systems can include detectors for analyzing the contents of the volumes, determining volumes of droplets, and/or other characteristics of interest.
- the methods described herein will be generally compatible with any known systems capable of detecting and analyzing volumes (e.g., droplets and/or wells).
- the systems can include a computer-readable storage medium for conducting digital measurements.
- the computer-readable storage medium has stored thereon instructions that, when executed by one or more processors of a computer, cause the computer to: analyze a second plurality of droplets having a second volume distribution to determine a number of droplets in the second plurality that contain the detectable agent, wherein the first plurality of droplets comprises the second plurality of droplets and the second volume distribution is narrower than the first volume distribution; and use the number of droplets in the second plurality, the volumes of some or all of the droplets in the second plurality and the number of droplets in the second plurality containing one or more detectable agents to determine a concentration of the detectable agent in the sample.
- a system for analyzing volumes to detect and calculate information from the analyzed volumes.
- the system includes one or more processors, and a memory device including instructions executable by the one or more processors. When the instructions are executed by the one or more processors, the system at least receives a user input to analyze volumes (e.g., a plurality of droplets).
- the system can be configured to carry out aspects of the methods of the present invention, such as counting a number of volumes (e.g., droplets), determining volumes of a plurality of droplets in a volume distribution and use the number of the droplets containing one or more detectable agents to determine a concentration of the detectable agent in the sample.
- the system also provides data to a user. The data provided to the user can include the concentration of the detectable agent in the sample or a sample concentration.
- FIG. 3 is a simplified block diagram of a computer system 100 that may be used for the methods, media and systems described herein.
- computer system 100 may be used to implement any of the systems or methods illustrated and described above.
- computer system 100 includes a processor 102 that communicates with a number of peripheral subsystems via a bus subsystem 104.
- peripheral subsystems may include a storage subsystem 106, comprising a memory subsystem 108 and a file storage subsystem 110, user interface input devices 112, user interface output devices 114, and a network interface subsystem 116.
- Bus subsystem 104 provides a mechanism for enabling the various components and subsystems of computer system 100 to communicate with each other as intended. Although bus subsystem 104 is shown schematically as a single bus, alternative embodiments of the bus subsystem may utilize multiple busses.
- Network interface subsystem 116 provides an interface to other computer systems and networks.
- Network interface subsystem 116 serves as an interface for receiving data from and transmitting data to other systems from computer system 100.
- network interface subsystem 116 may enable a user computer to connect to the Internet and facilitate communications using the Internet.
- User interface input devices 112 may include a keyboard, pointing devices such as a mouse, trackball, touchpad, or graphics tablet, a scanner, a barcode scanner, a touch screen incorporated into the display, audio input devices such as voice recognition systems, microphones, and other types of input devices.
- pointing devices such as a mouse, trackball, touchpad, or graphics tablet
- scanner such as a mouse, trackball, touchpad, or graphics tablet
- barcode scanner such as a touch screen incorporated into the display
- audio input devices such as voice recognition systems, microphones, and other types of input devices.
- use of the term "input device” is intended to include all possible types of devices and mechanisms for inputting information to computer system 100.
- User interface output devices 114 may include a display subsystem, a printer, a fax machine, or non-visual displays such as audio output devices, etc.
- the display subsystem may be a cathode ray tube (CRT), a flat-panel device such as a liquid crystal display (LCD), or a projection device.
- CTR cathode ray tube
- LCD liquid crystal display
- projection device a projection device
- use of the term "output device” is intended to include all possible types of devices and mechanisms for outputting information from computer system 100.
- An advertisement may be output by computer system 100 using one or more of user interface output devices 114.
- Storage subsystem 106 provides a computer-readable storage medium for storing the basic programming and data constructs.
- Software programs, code modules, instructions that when executed by a processor provide the functionality of the methods and systems described herein may be stored in storage subsystem 106. These software modules or instructions may be executed by processor(s) 102.
- Storage subsystem 106 may also provide a repository for storing data used in accordance with the present invention.
- Storage subsystem 106 may include memory subsystem 108 and file/disk storage subsystem 110.
- Memory subsystem 108 may include a number of memories including a main random access memory (RAM) 118 for storage of instructions and data during program execution and a read only memory (ROM) 120 in which fixed instructions are stored.
- File storage subsystem 110 provides a non-transitory persistent (non-volatile) storage for program and data files, and may include a hard disk drive, a floppy disk drive along with associated removable media, a Compact Disk Read Only Memory (CD-ROM) drive, an optical drive, removable media cartridges, and other like storage media.
- CD-ROM Compact Disk Read Only Memory
- Computer system 100 can be of various types including a personal computer, a portable computer, a workstation, a network computer, a mainframe, a kiosk, a server or any other data processing system. Due to the ever-changing nature of computers and networks, the description of computer system 100 depicted in Figure 3 is intended only as a specific example for purposes of illustrating the embodiment of the computer system. Many other configurations having more or fewer components than the system depicted in Figure 3 are possible.
- exp ⁇ C S V i is the probability of finding n molecules in a droplet of volume V i for a given concentration C S of target molecules in solution.
- the amplification reaction will cause a droplet containing one or more molecules to be distinguishable from empty droplets, e.g. by its fluorescence intensity. In this method we know only whether a droplet is empty or occupied.
- P( n >0, C S V i ) needs to be summed over a sufficiently large number of droplets with respective volumes V i .
- Simulations of a digital amplification assay are described, e.g. digital PCR, digital LAMP or digital ELISA, with continuous variable volumes to validate, that the target concentration C S can be accurately determined.
- N d For each simulation a fixed number of droplets, N d , and simulated concentration of analyte molecules, C S , was chosen. Simulations were performed for various values of C S .
- a random number generator was used to choose the diameters for N d droplets from a given range and distribution. To illustrate the principle of this invention, simulations were performed assuming that the droplet diameter D is uniformly distributed between a minimum diameter of 4 microns and a maximum diameter of 190 microns. This results in simulated volumes which range from 34 to 3.6 ⁇ 10 6 fL. A more realistic distribution of droplet diameters is discussed below.
- equation (3) can be fit to N S to obtain a best fit value of the concentration, with C being the only adjustable parameter. We use the Newton-Rhapson algorithm to find the zero of N S - N E .
- the initial value of C is obtained by replacing the V i 's in equation (3) with the median volume of the distribution and solving for C.
- the algorithm then typically takes 5 - 11 iterations for the changes in C to fall below 1 part in 10 5 .
- the value of C at that point is taken to be the best fit value of C.
- some of the goals are (i) to determine how accurately this procedure is in estimating C S and (ii) if two different samples yield different best fit values of C , how to calculate the confidence that the samples have different concentrations.
- This method includes the measurement of the volume of each droplet, and there can be an error associated with that which is taken into account.
- a Gaussian distributed error is added to each of the simulated diameter to yield simulated measured diameters.
- These simulated measured diameters are then used to calculate simulated measured volumes, V ⁇ i which are substituted into equation (3) to yield the expected number of occupied droplets based on measured volumes.
- One method for determining the droplet diameters is by microscopy.
- the accuracy of this method can depend on the numerical aperture (NA) of the objective used as well as other details of the imaging system.
- NA numerical aperture
- E 1 and E 2 Two different magnitudes of measurement error, denoted E 1 and E 2 .
- E 1 the standard deviation of the Gaussian distributed error added to a droplet diameter is the larger of 1 micron or 8% of that droplet's diameter.
- the relative error is included so that the simulation includes a non-negligible measurement error for the largest droplets.
- the standard deviation of the Gaussian distributed error added to a droplet diameter is the larger of 2 micron or 15% of that droplet's diameter. In both cases there is one limit placed on the simulated measured diameters. If a particular Gaussian deviate results in a droplet diameter being less than 0.5 microns, then that deviate is discarded and a new one generated for that droplet.
- C S is the actual, unknown concentration which the procedure is attempting to determine
- C is the best fit estimate
- V i 's are actual volumes of the droplets
- V ⁇ i 's are the volumes measured by the experimenter.
- Results for a typical set of simulations are shown in Figure 4 .
- Simulations were performed with 10,000 droplets and six different concentrations C S (2.0 ⁇ 10 -3 , 2.0 ⁇ 10 -4 , 2.0 ⁇ 10 -5 , 2.0 ⁇ 10 -6 , 2.0 ⁇ 10 -7 , and 2.0 ⁇ 10 -8 molec/fL).
- the droplet sizes were drawn from a uniform distribution of diameters between 4.0 and 190 microns.
- the droplets were sorted by volume, the droplet with the smallest volume was number 1 and the droplet with the largest volume was number 10,000.
- Figure 4 plots the cumulative number of occupied droplets.
- the cumulative number occupied for the ith droplet is the sum of the occupied droplets for all droplets ⁇ i .
- the shape of the curve is a function of both the concentration and the shape of the distribution of droplet volumes.
- a distribution which is uniform in droplet volume (instead of droplet diameter) would yield different shaped curves, as would non-uniform distributions.
- curves of the type in Figure 4 will rise monotonically with droplet number, and curves for different concentrations will never cross. So once the distribution of droplet sizes has been measured, the shape of the curve and the total number of occupied droplets depends only on the concentration of analyte molecules. For sufficiently large concentrations, there is a droplet volume where the probability of being occupied is very close to 1.0. Once the droplet number corresponding to that volume has been reached, the curve rises with near unit slope for all larger droplet numbers. For sufficiently small concentrations there is a droplet volume below which the probability of being occupied is indistinguishable from 0.0. For all droplet numbers smaller than the droplet number corresponding to that volume the curves equal zero.
- the present invention involves individually measuring sizes of droplets. Since the volume of a droplet enters into the probability of it being occupied, it would appear that it is important that the volumes be measured very accurately. For the range of droplet sizes in this simulation, the smallest droplets ( ⁇ 4 micron diameter) are not substantially larger than typical errors in measuring droplet diameters by light microscopy ( ⁇ 1 micron standard deviation). The resulting relative errors in the droplet volume can be significant and might be expected to degrade the accuracy of this method. Surprisingly, this does not appear to be the case. Table 1 compares the results of fitting equation (3) with the results of fitting equation (4) to a series of simulations. For each concentration, 100 simulations were performed, each containing 2000 droplets.
- Equation (3) the simulated volumes, V i , were used.
- equation (4) simulated measured volumes, V ⁇ i , were used. The point is that the results of fitting the simulated results using equation (3) represents the best fit concentrations that are obtained when the volumes of the droplets are known with perfect accuracy, while the results of fitting with equation (4) includes the effect of errors in the measurement of the droplet volumes.
- the average and standard deviations for the best fit concentrations using equations (3) and (4) are listed in Table 1 for both E 1 and E 2 .
- Figure 5 shows the results of a simulation of the cumulative number of occupied droplets for a concentration of 2.0 ⁇ 10 -6 .
- the simulation includes 10,000 droplets whose diameters are uniformly distributed between 4 and 190 microns.
- the curve is divided into three regions: Low, Transition and High. In the Low region, the probability of a droplet being occupied is very small and so the simulated curve is zero there. In the High region, the probability of a droplet being occupied is very close to 1 and the curve rises with near unit slope there. In the Transition region the probability of a droplet being occupied increases from near zero to almost 1. Measurement errors for droplets within the Low or High regions will have little or no effect on the total number of occupied droplets.
- the simulated measured diameters can be less than 4 microns. That is, the distribution of simulated measured diameters will extend to smaller sizes than the actual simulated diameters, which would be a slight broadening of the distribution function near 4 microns.
- the probability of being occupied is calculated using the simulated size, but when fitting the data, the probability of being occupied is calculated using the smaller measured size. This can lead to the fit over estimating the concentration when the Transition region includes these smallest droplets. This is what is seen in Table 1, though the effect is not very large. There should be an equivalent effect at the lowest concentrations due to a slight broadening of the distribution function near 190 microns, but the effect is not as noticeable.
- the null hypothesis would be that the two samples had the same (unknown) concentration. If ⁇ is the probability that two samples with the same concentration could result in best fit concentrations which differ in magnitude by more than
- the acceptable minimum value of (1 - ⁇ ) is chosen to limit false positive results. The use of the power to guard against false negatives is described later.
- Z C 1 ⁇ C 2 ⁇ 1 2 + ⁇ 2 2
- a confidence level of 95% is a common choice and requires Z > 1.96.
- the C n are the best fit results of equation (4) and ⁇ n 2 is the variance associated with the measurement of C n .
- a tractable analytical expression for the ⁇ n 2 does not appear to exist for our method, so it is necessary to estimate the ⁇ n 2 by simulation.
- one additional limitation of the Z test is that it assumes that the measurement results are normally distributed. Since this is not necessarily the case a second simulation method to estimate the confidence was performed and compared with the Z test results.
- the two methods will be denoted the Z method and Pairs or P method.
- N p 500 additional sets of droplet diameters were simulated and for each, the number of occupied droplets were simulated for the concentration C , and the E 1 size of measurement errors was used to generate simulated measured volumes.
- a best fit concentration C ' was obtained for each set.
- the fraction of the ⁇ C ' p which are greater than ⁇ C provides an estimate of ⁇ , the probability that two measurements made from a sample with concentration C would differ from each other by more than ⁇ C .
- the P method estimate of ⁇ is used to calculate the confidence, which equals (1- ⁇ ).
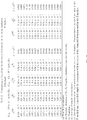
- Table 2 in Figure 17 shows a few of the 100 results.
- Table 2 shows the 5 sets which resulted in the smallest values of the confidence, 6 sets which resulted in confidence values at the median, and 5 sets which resulted in the confidence values near 1.0.
- the results from the Z method are shown in the first 5 columns and the results from the P method are shown in the last 3 columns.
- the values of the confidence, (1- ⁇ ), for the two different methods are in columns 5 and 8 and reasonable agreement between them is found for all of the sets simulated.
- the Z test as implemented in the Z method appears to be sufficiently accurate. While we continue to use the P method in the calculation of the power, in practice the Z method is a reasonable alternative and is computationally less expensive. Furthermore, the P method requires a numerical method for generating distributions of the droplet sizes which is a good approximation to the actual distribution, while the Z method does not. This last requirement is not a problem in simulations, but could be a difficulty in analyzing experimental results, so the Z method would be more useful in that case.
- the confidence level provides an estimate of how likely a result indicating two samples have different concentrations could be a false positive.
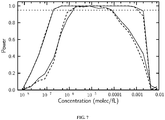
- the power provides an estimate of how likely false negatives are. For this the procedures for the previous set of simulations were used. For a given percentage difference between the reference and test concentrations the fraction of results which are too close together to satisfy a required confidence level is calculated. This is the fraction of results ( ⁇ ) which would yield false negatives for the particular concentration difference and required confidence level (in this case 95%) and the statistical power is (1- ⁇ ). The results for this test are in Figures 6-7 . The different figures are the resulting power for 2 different distributions of droplet diameters and include both the E 1 and E 2 measurement errors.
- Figures 6 and 7 are the results for uniform distributions with diameter ranges of 4 to 190 microns ( Figure 6 , volume range ⁇ 10 5 ), and 10 to 100 microns ( Figure 7 , volume range ⁇ 10 3 ). Each concentration on the abscissa is tested against concentrations which are 20% and 50 % larger (1.2 fold and 1.5 fold resolution, respectively). The results in all of the figures are for sets of 5000 droplets and the other parameters are the same as used in the pairs method for estimating the confidence.
- this method When distinguishing between samples whose concentrations differ by 20% this method is capable of powers > 0.95 for a range of concentrations which span a factor of ⁇ 100. If the requirement is relaxed from 1.2 fold to 1.5 fold resolution, the range of concentrations for which the power is > 0.95 is spans more than a factor of 10 4 for the broad uniform distribution ( Figure 6 , droplet diameters ranging from 4 to 190 microns) and almost 10 4 for the other one ( Figure 7 , droplet diameters ranging from 10 to 100 microns). The location of that range depends on the shape of the droplet size distribution. The range for which the power is > 0.95 increases if the required resolution is relaxed or the number of droplets is increased.
- the total volume of sample in a 5,000 droplet sample for the uniform distribution ranging from 4 to 190 microns is approximately 5 uL.
- the total number of copies in the 8 ⁇ 10 -9 simulation is approximately 35/5000 droplets, or about 7800 copies/ml. Smaller concentrations can be reached using a range of droplets which include larger sized droplets or larger numbers of droplets.
- Droplets of variable size can be created in various ways.
- microfluidics can be used to generate droplets of various sizes at a T-junction or flow-focusing device.
- This uses specialized chips into which the two components (oil phase and aqueous sample) have to be loaded first, before the aqueous sample becomes digitized by droplet formation.
- the aqueous phase containing the reaction mix is pipetted into a 0.2 mL PCR test tube that is prefilled with an appropriate oil-surfactant mix.
- the oil phase consisted of 73% Tegosoft®, 20% light mineral oil and 7% ABIL WE 09 surfactant, which were freshly mixed and equilibrated for at least 30 minutes before use. Emulsions formed with this mixture tend to show superior thermostability during standard emulsion PCR.
- droplets of variable size were formed by vortexing for about ten seconds at about 3000 rpm. Emulsification can be further enhanced by adding a small stir bar to the mix, which during the vortexing promotes breakup of the aqueous phase into smaller droplets.
- the presence of the surfactant in the oil stabilizes the emulsion, such that the individual aqueous droplets did not fuse.
- aqueous phase and oil mix were added to a small collection microtube, containing a small stainless steel bead.
- the tube was subsequently shaken at 15-17 Hz for 20 seconds to generate the emulsion.
- the emulsion was then transferred into a 0.2 mL PCR test tube for running the PCR reaction.
- a small volume of the emulsion was spread out on a silanized glass slide and covered with an excess volume of the oil-surfactant mix.
- the sample was then placed under a widefield microscope and illuminated from the bottom with dark field illumination.
- an opaque disc of suitable dimension is placed in the light path of the illumination source, blocking out most of the light before the specimen.
- the position of the opaque disc is matched to the microscope objective such, that only a small portion of light that is scattered from the specimen can enter the objective lens.
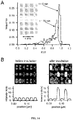
- the sample contrast comes from light that is scattered from the sample, the resulting image is dominated by the ring shaped circumference of the individual droplets as shown in Figure 8A . Due to the large contrast obtained in dark field, the droplet diameter can be easily determined for each circle in the image, provided the droplets are sparsely enough distributed.
- Figure 8B shows the distribution of 577 droplets after emulsification.
- the distribution is highly asymmetric with a median diameter of 20 ⁇ m.
- This emulsification preferentially generated smaller droplets around 10-40 ⁇ m, where the smallest droplets had a diameter of about 6-8 ⁇ m, and the largest droplet diameter found was of the order of 70-80 ⁇ m.
- This factor of 10 in droplet diameter translates into a dynamic volume range of roughly 1000.
- a fluorescence probe is added into the reaction mix that specifically recognizes the presence of the amplicon.
- this is either a molecular beacon, i.e. a hairpin structure, whose fluorescence is highly quenched in its closed conformation and whose intensity is increased once it hybridizes to amplified target DNA, or a Taqman® probe, which hybridizes to the target DNA, and leading to cleavage of a fluorescent reporter from the probe DNA during the next amplification step.
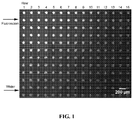
- Figure 11 shows images for two PCR reactions, where (1) the droplets contained no target DNA during amplification (negative control) and (2) the reaction mix contained target DNA. Fluorescence images that show the presence of the reference dye (ROX) and probe (FAM), were taken in epifluorescence, while the droplets were simultaneously imaged in dark field through bottom illumination. The insets show the measured intensity across a line through the center of the droplets.
- ROX reference dye
- FAM probe
- the digital LAMP chip was designed as a series of rectangular cavities to hold the droplets, which were positioned along a smaller rectangular channel used for sample delivery ( Figure 12 ).
- the chip layout was designed to improve droplet stability and retention, automation of the filling process, and operation at elevated temperatures. A reduction of the height ratio between main channel and side cavities to 1/3 reduced the chance of crosstalk between chambers. The depth of the side chamber was extended to 400 ⁇ m, which we found to improve droplet retention. Air pressure regulated flow was used to ensure reproducibility and robustness of the automated filling. Evaporation of the aqueous droplets at higher temperatures was minimised by various measures: a) The chambers were arranged in a dense array and embedded between only a thin top and bottom layer of PDMS. b) An additional sacrificial water channel was placed around the array. c) A self-adhesive film was added on top of the chip as a vapour barrier.
- FIGS 13A and 13B show a sequence of images taken during chamber filling and droplet formation.
- the aqueous phase entered the main channel and slowly displaced the oil from the side chambers. Once the whole sample entered the chip, the tailing oil phase sheared off the fluids at the opening of the side compartments and isolated the nanoliter droplets.
- the uniformity of droplet size across the array depended on the applied air pressure as shown in Figure 13C .
- the volume of the retained droplets was estimated from images taken before chip incubation as described in the experimental section. In our setup, an air pressure between 7-8 psi yielded the most uniform distribution of droplet size, where the majority of droplets showed near complete volume retention, indicated by a relative volume fraction (RVF) near unity. Only a fraction of smaller sizes was found, most of which near the outlet where initial side-chamber filling by the aqueous phase was incomplete. Higher or lower pressures caused the RVF distribution to broaden, with more droplets showing significantly reduced RVF values.
- Figure 13D shows a cumulative histogram of 5000 droplets. More than 96% of droplets occupied at least half the chamber volume, while for 56% of all droplets, the RVF exceeded 90%. On average, we found a RVF value of 0.89 ⁇ 0.14. Droplet uniformity was desirable, since it reduced errors in quantification due to difference in initial droplet volume. We will show in a later section that the distribution of droplet sizes did not significantly affect the outcome of our dLAMP analysis.
- Figure 13E displays the reproducibility of sample digitization with 7 psi air pressure. For 15 individual chips, the average RVF and its standard deviation were calculated. The average RVF varied within a 10% window, which demonstrates adequate reproducibility in chip performance. Also the standard deviation in droplet size was comparable for all chips, albeit with a somewhat larger chip-to-chip variation.
- the chip was incubated at 65 °C for 70 minutes to carry out isothermal DNA amplification.
- nanoliter-sized compartments are prone to water evaporation through the PDMS and partitioning of water into the oil phase. This would result in increases in reagent concentration, for example the ionic strength, which might cause inhibition of the reaction.
- FIG. 14B shows images and intensity scans across a section of a chip before and after incubation. As expected, some chambers showed a significant increase in fluorescence, while neighbouring chambers remained dark. Crosstalk between chambers thus appeared not to be an issue: LAMP-competent chambers were well separated by neighbouring chambers that showed only background signal.
- f eff an "effective" fraction, f eff , which we approximated based on the initial droplet volume.
- f eff was calculated as the sum of the inverse relative volume fractions for all positive droplets. In other words, a droplet that had a RVF of 50%, contributed twice as much as a droplet that occupied the full side chamber.
- f 0 and f eff were compared between the three chips that were analysed. We found that for our system, both analysis schemes gave similar results in all parameters. The roughly 10% increase of f eff over f 0 reflects the 10-15% variation in initial droplet size. From this comparison, we concluded that in our experiments the homogeneity of initial droplet size was good enough to validate the straightforward counting method.
- the target template was compared to a dilution series of ⁇ -phage DNA of known concentration. All samples were incubated with a DNA intercalating dye (Evagreen®, Biotium, Hayward, CA, USA) for 30 minutes. The fluorescence signal of each sample was then quantified on the TyphoonTM imager. Since concentration and length of the ⁇ -phage DNA were known (48502 bp), we obtained at least an accurate estimate of the number of bp present in the template solution. The intensity from the unknown sample was comparable to the intensity from solutions of less than 10 5 ⁇ -phage DNA per ⁇ l. Because of the low contrast in this concentration regime, we could not narrow down the concentration further. Assuming the plasmid being comparable in size to a full ⁇ -phage DNA, we thus estimate a concentration between 10 4 and 10 5 template copies per ⁇ l.
- dLAMP chip was capable of correctly determining absolute DNA concentrations as well as relative changes in DNA concentrations. Together with its simple operation, dLAMP in a SD chip provides a convenient platform to perform isothermal, digital DNA quantification with minimum sample consumption.
- Digital LAMP signatures reproduced absolute DNA concentrations as well as relative changes with sufficient accuracy within an incubation period of 70 minutes. Droplet shrinkage during sample incubation at elevated temperatures was minimal and did not affect the amplification process. We also addressed the issue of variations in droplet size during chip filling and demonstrated sufficient size homogeneity, with droplet volumes varying around 10-15%. Differences in droplet volume can potentially affect the average number of templates per droplet and the resulting digital signature. We verified that our autonomous chip filling produced droplets with sufficiently homogeneous volumes so that data analysis simplifies to the counting of LAMP-competent chambers, without the need to consider the variation in droplet volume.
- LoopAmp® DNA amplification kit and the Calcein fluorescence indicator kit were purchased from SA Scientific (San Antonio, TX, USA). Positive control DNA and with a set of corresponding primers was included in the kit.
- Light mineral oil, sorbitan monooleate (SPAN-80), bovine serum albumin (BSA), propylene glycol methyl ether acetate (PGMEA) and isopropyl alcohol were obtained from Sigma Aldrich (St. Louis, MO, USA).
- Polydimethylsiloxane (PDMS, Sylgard 184 kit) was purchased from Dow Corning (Midland, MI, USA).
- forward inner primer 5'-CAGCATCCCTTTCGGCATACCAGGTGGCAAGGGTAATGAGG-3' (SEQ ID NO:1)
- backward inner primer BIP
- forward outer primer F3
- forward outer primer F3
- forward outer primer F3
- backward outer primer B3
- loop forward primer LF
- 5'-GGCGGCAGAGTCATAAAGCA-3' SEQ ID NO:5
- loop backward primer LB
- Microfluidic chips for digital LAMP were replicated in polydimethylsiloxane (PDMS) with standard soft lithography.
- the network of microfluidic channels and side chambers was designed in AutoCAD (Autodesk, San Rafael, CA, USA) and printed onto a Mylar photomask (Fineline Imaging, Colorado Springs CO, USA).
- the mask was used to fabricate a two layer SU-8 on-silicon master. For each layer, the following steps were performed: SU-8 photoresist (SU-8 2050, MicroChem, Newton, MA, USA) was spin coated onto a freshly cleaned silicon wafer. After soft baking, wafer and photomask were aligned and exposed to UV in a commercial mask aligner (Newport, Irvine CA, USA).
- the wafer was coated with (tridecafluoro)-1,1,2,2-tetrahydrooctyl) trichlorosilane (Gelest, Morrisville, PA, USA) by gas-phase deposition.
- PDMS base and catalyst were mixed in a 10:1 weight ratio as recommended by the manufacturer.
- the mix was degassed for 15-20 minutes and spin coated onto the SU-8 on-silicon master to form a thin film, approximately 300 ⁇ m thick.
- the PDMS was peeled off the wafer. Access holes were punched into the elastomer with a sharpened 15 gauge punch.
- the PDMS replica was bonded to a microscope slide coated with a thin layer of cured PDMS via oxygen plasma treatment.
- the PDMS chip was stored at 115 °C for 2 days, which reverted the surface back to hydrophobic.
- a set of small troughs matching the inlet and outlet holes was replicated into PDMS and attached to the chip with double-sided tape. Each trough provided a reservoir of approximately 50 ⁇ l.
- the chip was placed under vacuum for 20-30 minutes to remove excess air from the bulk PDMS.
- 40 ⁇ l of light mineral oil supplemented with 0.025% w/w SPAN-80 were placed into the inlet of the main channel to prime the chip. Air pressure was applied to maintain oil flow until the air was driven out of the chip.
- the chip was covered with a small piece of adhesive PCR sealant film (Bio-Rad, Hercules, CA, USA) to reduce water evaporation during the incubation.
- the Calcein fluorescence was highly quenched, its residual emission could still be monitored with the Typhoon imager to determine initial droplet size in the chamber.
- the distribution of initial droplet sizes was quantified in terms of the retained volume fraction (RVF) estimated as the ratio of the droplet area to the area of the side chamber.
- RVF retained volume fraction
- a threshold equal to 1/3 of the average pixel intensity of the Calcein fluorescence in droplets was used to discriminate against background. Only droplets with a RVF of at least 0.15 were considered for further analysis.
- a statistical analysis of a digital droplet assay using droplets from a continuous distribution of sizes is presented.
- the best fit concentrations are moderately insensitive to modest unbiased errors in the determination of the individual droplet volumes, so the required accuracy of that determination should not be an unreasonable burden.
- a simple method for estimating the confidence when comparing results from different samples is presented. It produces estimates of the confidence in reasonable agreement with a more computationally intensive estimate of the confidence. From simulations, the statistical power of the method can be calculated for three different distributions of the droplet diameters for 1.2 and 1.5 fold resolutions. Given a desired resolution, droplet size distribution and number of droplets, these methods can be used to determine the range of concentrations for which this method should yield usable results.
Landscapes
- Chemical & Material Sciences (AREA)
- Organic Chemistry (AREA)
- Life Sciences & Earth Sciences (AREA)
- Health & Medical Sciences (AREA)
- Zoology (AREA)
- Wood Science & Technology (AREA)
- Engineering & Computer Science (AREA)
- Proteomics, Peptides & Aminoacids (AREA)
- Analytical Chemistry (AREA)
- Molecular Biology (AREA)
- General Health & Medical Sciences (AREA)
- Microbiology (AREA)
- Biotechnology (AREA)
- Genetics & Genomics (AREA)
- Immunology (AREA)
- Chemical Kinetics & Catalysis (AREA)
- Biochemistry (AREA)
- Bioinformatics & Cheminformatics (AREA)
- General Engineering & Computer Science (AREA)
- Physics & Mathematics (AREA)
- Biophysics (AREA)
- Measuring Or Testing Involving Enzymes Or Micro-Organisms (AREA)
- Apparatus Associated With Microorganisms And Enzymes (AREA)
- Investigating, Analyzing Materials By Fluorescence Or Luminescence (AREA)
- Automatic Analysis And Handling Materials Therefor (AREA)
- Micromachines (AREA)
- Measurement Of Current Or Voltage (AREA)
Claims (15)
- Verfahren zur Verwendung digitaler Messungen zum Bestimmen einer Konzentration eines Analyten in einer Probe, wobei das Verfahren Folgendes umfasst:Erzeugen einer Vielzahl von Tröpfchen mit einer Volumenverteilung, wobei die Volumenverteilung eine kontinuierliche Volumenverteilung ist, und wobei mindestens eines der Tröpfchen der Vielzahl Inhalte von der Probe enthält;Assoziieren eines detektierbaren Mittels mit dem Analyt;Analysieren einiger oder aller der Vielzahl von Tröpfchen zum Bestimmen individueller Volumen der Tröpfchen in den einigen oder allen der Vielzahl und einer Anzahl Tröpfchen in den einigen oder allen der Vielzahl, die das detektierbare Mittel und den Analyten enthalten; undVerwenden individueller Volumen der einigen oder allen der Tröpfchen in der Vielzahl und der Anzahl von Tröpfchen in den einigen oder allen der Vielzahl, die das detektierbare Mittel und den Analyten enthalten, um die Konzentration des Analyten in der Probe zu bestimmen.
- System zur Verwendung digitaler Messungen zum Bestimmen einer Konzentration eines Analyten in einer Probe, wobei das System Folgendes umfasst:einen Probenhalter, der eine Vielzahl von Tröpfchen mit einer Volumenverteilung enthält, wobei:die Volumenverteilung eine kontinuierliche Volumenverteilung ist;mindestens ein Tröpfchen einiger oder aller der Vielzahl von Tröpfchen ein detektierbares Mittel und den Analyten enthalten;einen Detektor zum Detektieren des detektierbaren Mittels, das in mindestens einem Tröpfchen einiger oder aller der Vielzahl von Tröpfchen enthalten ist;einen Detektor zum Bestimmen individueller Volumen der einigen oder allen der Vielzahl von Tröpfchen; undeinen Computer, umfassend eine Speichervorrichtung mit darauf gespeicherten ausführbaren Anweisungen,wobei die Anweisungen, wenn sie von einem Prozessor ausgeführt werden, den Prozessor zu Folgendem veranlassen:Analysieren einiger oder aller der Vielzahl von Tröpfchen zum Bestimmen individueller Volumen der Tröpfchen in den einigen oder allen der Vielzahl von Tröpfchen und einer Anzahl Tröpfchen in den einigen oder allen der Vielzahl von Tröpfchen, die das detektierbare Mittel und den Analyten enthalten; undVerwenden individueller Volumen der einigen oder allen der Tröpfchen in der Vielzahl von Tröpfchen und der Anzahl von Tröpfchen in den einigen oder allen der Vielzahl von Tröpfchen, die das detektierbare Mittel und den Analyten enthalten, um die Konzentration des Analyten in der Probe zu bestimmen.
- Verfahren oder System nach einem der Ansprüche 1 bis 2, wobei die Volumenverteilung der Vielzahl von Tröpfchen einen Volumenbereich von ungefähr 100 Nanolitern (nl) bis ungefähr 1 Femtoliter (fl), von ungefähr 10 nl bis ungefähr 10 fl, von ungefähr 1 nl bis ungefähr 100 fl, von ungefähr 100 nl bis ungefähr 1 Picoliter (pl), von ungefähr 10 nl bis ungefähr 10 pl, oder von ungefähr 1 nl bis ungefähr 1 pl.
- Verfahren oder System nach einem der Ansprüche 1 bis 3, wobei die Vielzahl von Tröpfchen in einer Emulsion durch Kombinieren von unmischbaren Fluids erzeugt wird, vorzugsweise wobei die unmischbaren Fluids Wasser und Öl umfassen; und/oder wobei die die Emulsion ein Netzmittel umfasst.
- Verfahren oder System nach einem der Ansprüche 1 bis 4, wobei das detektierbare Mittel fluoreszent ist.
- Verfahren nach einem der Ansprüche 1 und 3 bis 5, ferner umfassend ein Durchführen einer Polymerase-Kettenreaktion (polymerase chain reaction, PCR), Rolling-Circle-Amplifikation (RCA), Nukleinsäuresequenz-basierte Amplifikation (NASBA), Schleifen-vermittelte Amplifikation (loop-mediated amplification, LAMP) oder einer Kombination davon.
- Verfahren oder System nach einem der Ansprüche 1 bis 6, wobei die Konzentration des detektierbaren Mitteln über einen dynamischen von mindestens drei Größenordnungen oder mindestens sechs Größenordnungen bestimmt wird.
- Verfahren oder System nach einem der Ansprüche 1 bis 7, wobei das Volumen in der Volumenverteilung um mehr als einen Faktor 2, um mehr als einen Faktor 10 oder um mehr als einen Faktor 100 variiert.
- Verfahren nach einem der Ansprüche 1 und 3 bis 8, ferner umfassend einer digitalen, Schleifen-vermittelten Amplifikation einer Probe, umfassend:Erzeugen einer Vielzahl von Tröpfchen der Probe auf einer mikrofluidischen Vorrichtung, wobei mindestens ein Tröpfchen in der Vielzahl ein Nukleinsäuremolekül umfasst; undAusführen einer Schleifen-vermittelten Amplifikation in dem mindestens einen Tröpfchen, um ein amplifiziertes Produkt des Nukleinsäuremoleküls zu erzeugen.
- Verfahren nach Anspruch 9, ferner umfassend ein Detektieren des amplifizierten Produkts.
- Verfahren nach einem der Ansprüche 9 bis 10, ferner umfassend:Bestimmen einer Vielzahl von Tröpfchen in den einigen oder allen der Vielzahl von Tröpfchen, die das amplifizierte Produkt umfassen; undBerechnen einer Konzentration des Nukleinsäuremoleküls in der Probe unter Verwendung individueller Volumen der Tröpfchen in den einigen oder allen der Vielzahl und der Anzahl von Tröpfchen in den einigen oder allen der Vielzahl, die das Nukleinsäuremolekül enthalten.
- Verfahren nach einem der Ansprüche 9 bis 11, wobei die mikrofluidische Vorrichtung eine Vielzahl von Kammern umfasst, die konfiguriert sind, um die Vielzahl von Tröpfchen zu bilden.
- Verfahren nach Anspruch 1 oder das System nach Anspruch 2, wobei die analysierten Tröpfchen eine Volumenverteilung aufweisen, die schmaler ist als die Volumenverteilung der gesamten erzeugten Tröpfchen.
- Verfahren oder System nach einem der Ansprüche 1 bis 8, wobei der Analyt ein Nukleinsäuremolekül, ein Peptid, ein Protein, oder eine Kombination davon ist.
- Verfahren oder System nach einem der Ansprüche 1 bis 14, wobei der Analyt über kovalente Interaktionen, nicht-kovalenten Interaktionen oder einer Kombination davon mit dem detektierbaren Mittel assoziiert ist.
Priority Applications (1)
| Application Number | Priority Date | Filing Date | Title |
|---|---|---|---|
| EP18184052.1A EP3410080B1 (de) | 2011-01-20 | 2012-01-20 | Verfahren und systeme zur durchführung digitaler messungen |
Applications Claiming Priority (2)
| Application Number | Priority Date | Filing Date | Title |
|---|---|---|---|
| US201161434670P | 2011-01-20 | 2011-01-20 | |
| PCT/US2012/022081 WO2012100198A2 (en) | 2011-01-20 | 2012-01-20 | Methods and systems for performing digital measurements |
Related Child Applications (2)
| Application Number | Title | Priority Date | Filing Date |
|---|---|---|---|
| EP18184052.1A Division EP3410080B1 (de) | 2011-01-20 | 2012-01-20 | Verfahren und systeme zur durchführung digitaler messungen |
| EP18184052.1A Division-Into EP3410080B1 (de) | 2011-01-20 | 2012-01-20 | Verfahren und systeme zur durchführung digitaler messungen |
Publications (3)
| Publication Number | Publication Date |
|---|---|
| EP2665995A2 EP2665995A2 (de) | 2013-11-27 |
| EP2665995A4 EP2665995A4 (de) | 2014-05-21 |
| EP2665995B1 true EP2665995B1 (de) | 2018-08-29 |
Family
ID=46516410
Family Applications (2)
| Application Number | Title | Priority Date | Filing Date |
|---|---|---|---|
| EP12736553.4A Active EP2665995B1 (de) | 2011-01-20 | 2012-01-20 | Verfahren und systeme zur durchführung digitaler messungen |
| EP18184052.1A Active EP3410080B1 (de) | 2011-01-20 | 2012-01-20 | Verfahren und systeme zur durchführung digitaler messungen |
Family Applications After (1)
| Application Number | Title | Priority Date | Filing Date |
|---|---|---|---|
| EP18184052.1A Active EP3410080B1 (de) | 2011-01-20 | 2012-01-20 | Verfahren und systeme zur durchführung digitaler messungen |
Country Status (5)
| Country | Link |
|---|---|
| US (4) | US9428793B2 (de) |
| EP (2) | EP2665995B1 (de) |
| JP (3) | JP6063395B2 (de) |
| CN (2) | CN103429997B (de) |
| WO (1) | WO2012100198A2 (de) |
Families Citing this family (39)
| Publication number | Priority date | Publication date | Assignee | Title |
|---|---|---|---|---|
| US9180453B2 (en) | 2008-08-15 | 2015-11-10 | University Of Washington | Method and apparatus for the discretization and manipulation of sample volumes |
| EP2665995B1 (de) | 2011-01-20 | 2018-08-29 | University of Washington through its Center for Commercialization | Verfahren und systeme zur durchführung digitaler messungen |
| WO2012135667A1 (en) * | 2011-04-01 | 2012-10-04 | Life Technologies Corporation | System and method for determining copies-per-unit-volume using pcr and flow control of droplets |
| BR112014011818A2 (pt) | 2011-11-17 | 2017-05-02 | Curiosity Diagnostics Sp Z O O | método para realizar ensaios de quantificação |
| CN114717296B (zh) | 2012-02-03 | 2025-04-04 | 加州理工学院 | 多路生化测定中信号的编码和解码 |
| US10209246B2 (en) | 2012-06-26 | 2019-02-19 | Curiosity Diagnostics Sp. Z.O.O. | Method for performing quantitation assays |
| EP3901243A1 (de) | 2012-08-03 | 2021-10-27 | California Institute of Technology | Multiplexing und quantifizierung in pcr mit reduzierter hardware und reduzierten anforderungen |
| US10726589B2 (en) | 2012-11-07 | 2020-07-28 | Life Technologies Corporation | Visualization tools for digital PCR data |
| JP5878113B2 (ja) * | 2012-12-28 | 2016-03-08 | シスメックス株式会社 | 核酸増幅方法および核酸増幅反応用キット |
| JP2014135941A (ja) * | 2013-01-18 | 2014-07-28 | Seiko Epson Corp | 熱サイクル装置及び熱サイクル方法 |
| JP6506747B2 (ja) * | 2013-06-25 | 2019-04-24 | ユニバーシティ オブ ワシントン スルー イッツ センター フォー コマーシャリゼーション | サンプル体積の自己デジタル処理 |
| WO2014210559A1 (en) * | 2013-06-28 | 2014-12-31 | Life Technologies Corporation | Methods and systems for visualizing data quality |
| CN113215221A (zh) | 2014-04-08 | 2021-08-06 | 华盛顿大学商业中心 | 用于使用多分散小滴执行数字检定的方法和设备 |
| JP6482774B2 (ja) * | 2014-05-23 | 2019-03-13 | 株式会社日立ハイテクノロジーズ | 生体分析用のデバイス、分析装置および分析方法 |
| CN105420348B (zh) * | 2014-09-04 | 2019-10-15 | 中国科学院北京基因组研究所 | 改进的测序文库及其制备和应用 |
| CN104846100B (zh) * | 2015-05-24 | 2017-10-10 | 北京工业大学 | 一种可用于微滴数字pcr的微滴制备方法 |
| JP6868289B2 (ja) | 2015-07-07 | 2021-05-12 | ユニバーシティ オブ ワシントンUniversity of Washington | サンプルの自己デジタル化のためのシステム、方法、およびデバイス |
| HK1247662B (en) | 2015-10-07 | 2019-11-01 | Selma Diagnostics Aps | Flow system and methods for digital counting |
| CN109313176B (zh) * | 2016-06-20 | 2021-05-14 | 阿克斯比尔公司 | 用于检测生物大分子的电子装置 |
| WO2018020024A1 (en) | 2016-07-29 | 2018-02-01 | Selma Diagnostics Aps | Improvements in methods for digital counting |
| WO2018152050A1 (en) | 2017-02-14 | 2018-08-23 | Axbio Inc. | Apparatus and methods for continuous diagnostics of macromolecules |
| JP6921638B2 (ja) | 2017-06-16 | 2021-08-18 | 株式会社東芝 | 核酸検出定量方法、チップ、アッセイキット、核酸検出定量装置及びプログラム |
| CN107312850A (zh) * | 2017-07-19 | 2017-11-03 | 华东医药(杭州)基因科技有限公司 | 一种pcr无效扩增的检测方法 |
| JP2019030273A (ja) * | 2017-08-09 | 2019-02-28 | キヤノン株式会社 | 分析システム、分析方法、プログラム、および記憶媒体 |
| GB2569328A (en) * | 2017-12-13 | 2019-06-19 | Univ Oxford Innovation Ltd | Methods and apparatus for manufacturing a microfluidic arrangement , and a microfluidic arrangement |
| US12454720B2 (en) | 2018-04-17 | 2025-10-28 | ChromaCode, Inc. | Methods and systems for multiplex analysis |
| US12203129B2 (en) | 2018-07-03 | 2025-01-21 | ChromaCode, Inc. | Formulations and signal encoding and decoding methods for massively multiplexed biochemical assays |
| CN108977558A (zh) * | 2018-08-24 | 2018-12-11 | 暨南大学 | 基于数字lamp技术检测金黄色葡萄球菌的引物及其试剂盒与方法 |
| US11273444B2 (en) * | 2018-11-16 | 2022-03-15 | Precigenome, LLC | Integrated microfluidic system for droplet generation, nucleic acid amplification, and detection |
| US11305284B2 (en) * | 2018-11-26 | 2022-04-19 | Tokitae, LLC | Determining a bulk concentration of a target in a sample using a digital assay with compartments having nonuniform volumes |
| US20220333177A1 (en) * | 2019-05-27 | 2022-10-20 | Centre National De La Recherche Scientifique (Cnrs) | Digital biomolecules detection and/or quantification using isothermal amplification |
| US20220411858A1 (en) * | 2019-11-29 | 2022-12-29 | Mgi Tech Co., Ltd. | Random emulsification digital absolute quantitative analysis method and device |
| CN112067244B (zh) * | 2020-09-07 | 2023-09-05 | 中国航空工业集团公司沈阳空气动力研究所 | 适用于亚声速暂冲风洞的双组分荧光油膜配方及使用方法 |
| CN116783303A (zh) * | 2021-01-13 | 2023-09-19 | 深圳华大智造科技股份有限公司 | 基于体积分布分析液滴的方法、计算机装置及存储介质 |
| CN113528315A (zh) * | 2021-08-03 | 2021-10-22 | 北京林电伟业电子技术有限公司 | 一种模拟基因扩增标准曲线的方法 |
| CN114015560B (zh) * | 2021-10-20 | 2024-07-05 | 深圳市中科先见医疗科技有限公司 | 一种分子检测芯片 |
| CN115166255B (zh) * | 2022-06-10 | 2023-07-28 | 哈尔滨工业大学(深圳) | 微流控芯片及单细胞检测系统、方法、存储介质 |
| EP4438737A1 (de) * | 2023-03-31 | 2024-10-02 | Blink AG | Verfahren zur quantifizierung einer analytkonzentration in einer probe |
| EP4722733A1 (de) * | 2023-06-05 | 2026-04-08 | Hitachi High-Tech Corporation | Probenlösungstrennvorrichtung, probenlösungstrennsystem und probenlösungstrennverfahren |
Family Cites Families (17)
| Publication number | Priority date | Publication date | Assignee | Title |
|---|---|---|---|---|
| US7598033B2 (en) | 2003-12-15 | 2009-10-06 | University Of Pennsylvania | Method and devices for running reactions on a target plate for MALDI mass spectrometry |
| US20070099288A1 (en) | 2005-11-02 | 2007-05-03 | Affymetrix, Inc. | Microfluidic Methods, Devices, and Systems for Fluid Handling |
| US20100105025A1 (en) * | 2006-10-12 | 2010-04-29 | Engelhard Eric K | Devices for generating detectable polymers |
| EP2089542B1 (de) * | 2006-11-29 | 2017-01-04 | Canon U.S. Life Sciences, Inc. | Vorrichtung und verfahren für digitale multiplex-pcr-assays |
| US9029085B2 (en) | 2007-03-07 | 2015-05-12 | President And Fellows Of Harvard College | Assays and other reactions involving droplets |
| US8926811B2 (en) | 2007-06-27 | 2015-01-06 | Digital Biosystems | Digital microfluidics based apparatus for heat-exchanging chemical processes |
| US8367370B2 (en) | 2008-02-11 | 2013-02-05 | Wheeler Aaron R | Droplet-based cell culture and cell assays using digital microfluidics |
| US9132394B2 (en) * | 2008-09-23 | 2015-09-15 | Bio-Rad Laboratories, Inc. | System for detection of spaced droplets |
| US8586126B2 (en) | 2008-10-21 | 2013-11-19 | Molecular Imprints, Inc. | Robust optimization to generate drop patterns in imprint lithography which are tolerant of variations in drop volume and drop placement |
| DK200801722A (en) | 2008-12-05 | 2010-06-06 | Unisensor As | Optical sectioning of a sample and detection of particles in a sample |
| US9464319B2 (en) * | 2009-03-24 | 2016-10-11 | California Institute Of Technology | Multivolume devices, kits and related methods for quantification of nucleic acids and other analytes |
| JP5766178B2 (ja) * | 2009-03-24 | 2015-08-19 | ザ・ユニバーシティ・オブ・シカゴThe University Of Chicago | SlipChip装置および方法 |
| US8088690B2 (en) | 2009-03-31 | 2012-01-03 | International Business Machines Corporation | CMP method |
| CN101736087A (zh) * | 2010-01-28 | 2010-06-16 | 华东医学生物技术研究所 | 一种微乳液克隆扩增结合水凝胶微球芯片数字化检测微突变的方法 |
| EP2665995B1 (de) | 2011-01-20 | 2018-08-29 | University of Washington through its Center for Commercialization | Verfahren und systeme zur durchführung digitaler messungen |
| WO2012135667A1 (en) | 2011-04-01 | 2012-10-04 | Life Technologies Corporation | System and method for determining copies-per-unit-volume using pcr and flow control of droplets |
| CN113215221A (zh) | 2014-04-08 | 2021-08-06 | 华盛顿大学商业中心 | 用于使用多分散小滴执行数字检定的方法和设备 |
-
2012
- 2012-01-20 EP EP12736553.4A patent/EP2665995B1/de active Active
- 2012-01-20 CN CN201280012684.6A patent/CN103429997B/zh active Active
- 2012-01-20 EP EP18184052.1A patent/EP3410080B1/de active Active
- 2012-01-20 CN CN201710722246.3A patent/CN107502660B/zh active Active
- 2012-01-20 US US13/980,457 patent/US9428793B2/en active Active
- 2012-01-20 JP JP2013550633A patent/JP6063395B2/ja active Active
- 2012-01-20 WO PCT/US2012/022081 patent/WO2012100198A2/en not_active Ceased
-
2016
- 2016-08-05 US US15/230,162 patent/US10000797B2/en active Active
- 2016-11-14 JP JP2016221388A patent/JP6426679B2/ja active Active
-
2018
- 2018-04-25 US US15/962,944 patent/US10590470B2/en active Active
- 2018-10-25 JP JP2018200507A patent/JP6654680B2/ja active Active
-
2020
- 2020-02-05 US US16/783,037 patent/US11401547B2/en active Active
Non-Patent Citations (1)
| Title |
|---|
| None * |
Also Published As
| Publication number | Publication date |
|---|---|
| WO2012100198A2 (en) | 2012-07-26 |
| US10590470B2 (en) | 2020-03-17 |
| CN103429997B (zh) | 2017-08-25 |
| JP2019030323A (ja) | 2019-02-28 |
| WO2012100198A3 (en) | 2012-10-04 |
| EP3410080B1 (de) | 2022-07-13 |
| CN107502660B (zh) | 2021-08-10 |
| JP6654680B2 (ja) | 2020-02-26 |
| US9428793B2 (en) | 2016-08-30 |
| JP2017062250A (ja) | 2017-03-30 |
| JP2014505476A (ja) | 2014-03-06 |
| US20140087386A1 (en) | 2014-03-27 |
| US11401547B2 (en) | 2022-08-02 |
| EP3410080A1 (de) | 2018-12-05 |
| US20200157615A1 (en) | 2020-05-21 |
| CN103429997A (zh) | 2013-12-04 |
| EP2665995A4 (de) | 2014-05-21 |
| CN107502660A (zh) | 2017-12-22 |
| EP2665995A2 (de) | 2013-11-27 |
| JP6426679B2 (ja) | 2018-11-21 |
| JP6063395B2 (ja) | 2017-01-18 |
| US20170145490A1 (en) | 2017-05-25 |
| US20180251827A1 (en) | 2018-09-06 |
| US10000797B2 (en) | 2018-06-19 |
Similar Documents
| Publication | Publication Date | Title |
|---|---|---|
| US11401547B2 (en) | Methods and systems for performing digital measurements | |
| Tan et al. | Current commercial dPCR platforms: technology and market review | |
| Basu | Digital assays part I: partitioning statistics and digital PCR | |
| US12275997B2 (en) | System and method for determining copies-per-unit-volume using PCR and flow control of droplets | |
| Gansen et al. | Digital LAMP in a sample self-digitization (SD) chip | |
| Klein | Quantification using real-time PCR technology: applications and limitations | |
| US11667970B2 (en) | Spatial molecular analysis of tissue | |
| JP6673938B2 (ja) | デジタルマイクロ流体技術を用いたデジタルpcrシステム及び方法 | |
| JP2008245612A (ja) | 試料調製法および装置 | |
| Chen et al. | Elliptical pipette generated large microdroplets for POC visual ddPCR quantification of low viral load | |
| JP2018046819A (ja) | デジタルポリメラーゼ連鎖反応における反応体積偏差によって引き起こされる定量化誤差を減少させるための方法 | |
| Hsieh et al. | Digital droplet loop-mediated isothermal amplification featuring a molecular beacon assay, 3D printed droplet generation, and smartphone imaging for sequence-specific DNA detection | |
| Ganguly et al. | A Poisson-independent approach to precision nucleic acid quantification in microdroplets | |
| CN113736863A (zh) | 诊断方法和组合物 | |
| HK1255279A1 (en) | Diagnostic methods and compositions |
Legal Events
| Date | Code | Title | Description |
|---|---|---|---|
| PUAI | Public reference made under article 153(3) epc to a published international application that has entered the european phase |
Free format text: ORIGINAL CODE: 0009012 |
|
| 17P | Request for examination filed |
Effective date: 20130802 |
|
| AK | Designated contracting states |
Kind code of ref document: A2 Designated state(s): AL AT BE BG CH CY CZ DE DK EE ES FI FR GB GR HR HU IE IS IT LI LT LU LV MC MK MT NL NO PL PT RO RS SE SI SK SM TR |
|
| RIN1 | Information on inventor provided before grant (corrected) |
Inventor name: LORENZ, ROBERT M. Inventor name: GANSEN, ALEXANDER R. Inventor name: FUJIMOTO, BRYANT S. Inventor name: YEN, GLORIA S. Inventor name: CHIU, DANIEL T. |
|
| DAX | Request for extension of the european patent (deleted) | ||
| A4 | Supplementary search report drawn up and despatched |
Effective date: 20140417 |
|
| RIC1 | Information provided on ipc code assigned before grant |
Ipc: C12Q 1/68 20060101ALI20140411BHEP Ipc: G01N 33/68 20060101ALI20140411BHEP Ipc: G01F 22/00 20060101AFI20140411BHEP Ipc: C12M 1/34 20060101ALI20140411BHEP |
|
| 17Q | First examination report despatched |
Effective date: 20150803 |
|
| GRAP | Despatch of communication of intention to grant a patent |
Free format text: ORIGINAL CODE: EPIDOSNIGR1 |
|
| STAA | Information on the status of an ep patent application or granted ep patent |
Free format text: STATUS: GRANT OF PATENT IS INTENDED |
|
| INTG | Intention to grant announced |
Effective date: 20170601 |
|
| GRAJ | Information related to disapproval of communication of intention to grant by the applicant or resumption of examination proceedings by the epo deleted |
Free format text: ORIGINAL CODE: EPIDOSDIGR1 |
|
| STAA | Information on the status of an ep patent application or granted ep patent |
Free format text: STATUS: EXAMINATION IS IN PROGRESS |
|
| INTC | Intention to grant announced (deleted) | ||
| GRAP | Despatch of communication of intention to grant a patent |
Free format text: ORIGINAL CODE: EPIDOSNIGR1 |
|
| STAA | Information on the status of an ep patent application or granted ep patent |
Free format text: STATUS: GRANT OF PATENT IS INTENDED |
|
| INTG | Intention to grant announced |
Effective date: 20180315 |
|
| GRAS | Grant fee paid |
Free format text: ORIGINAL CODE: EPIDOSNIGR3 |
|
| GRAA | (expected) grant |
Free format text: ORIGINAL CODE: 0009210 |
|
| STAA | Information on the status of an ep patent application or granted ep patent |
Free format text: STATUS: THE PATENT HAS BEEN GRANTED |
|
| AK | Designated contracting states |
Kind code of ref document: B1 Designated state(s): AL AT BE BG CH CY CZ DE DK EE ES FI FR GB GR HR HU IE IS IT LI LT LU LV MC MK MT NL NO PL PT RO RS SE SI SK SM TR |
|
| REG | Reference to a national code |
Ref country code: GB Ref legal event code: FG4D |
|
| REG | Reference to a national code |
Ref country code: CH Ref legal event code: EP |
|
| REG | Reference to a national code |
Ref country code: AT Ref legal event code: REF Ref document number: 1035667 Country of ref document: AT Kind code of ref document: T Effective date: 20180915 |
|
| REG | Reference to a national code |
Ref country code: IE Ref legal event code: FG4D |
|
| REG | Reference to a national code |
Ref country code: DE Ref legal event code: R096 Ref document number: 602012050386 Country of ref document: DE |
|
| REG | Reference to a national code |
Ref country code: NL Ref legal event code: MP Effective date: 20180829 |
|
| REG | Reference to a national code |
Ref country code: LT Ref legal event code: MG4D |
|
| PG25 | Lapsed in a contracting state [announced via postgrant information from national office to epo] |
Ref country code: GR Free format text: LAPSE BECAUSE OF FAILURE TO SUBMIT A TRANSLATION OF THE DESCRIPTION OR TO PAY THE FEE WITHIN THE PRESCRIBED TIME-LIMIT Effective date: 20181130 Ref country code: SE Free format text: LAPSE BECAUSE OF FAILURE TO SUBMIT A TRANSLATION OF THE DESCRIPTION OR TO PAY THE FEE WITHIN THE PRESCRIBED TIME-LIMIT Effective date: 20180829 Ref country code: FI Free format text: LAPSE BECAUSE OF FAILURE TO SUBMIT A TRANSLATION OF THE DESCRIPTION OR TO PAY THE FEE WITHIN THE PRESCRIBED TIME-LIMIT Effective date: 20180829 Ref country code: IS Free format text: LAPSE BECAUSE OF FAILURE TO SUBMIT A TRANSLATION OF THE DESCRIPTION OR TO PAY THE FEE WITHIN THE PRESCRIBED TIME-LIMIT Effective date: 20181229 Ref country code: NO Free format text: LAPSE BECAUSE OF FAILURE TO SUBMIT A TRANSLATION OF THE DESCRIPTION OR TO PAY THE FEE WITHIN THE PRESCRIBED TIME-LIMIT Effective date: 20181129 Ref country code: RS Free format text: LAPSE BECAUSE OF FAILURE TO SUBMIT A TRANSLATION OF THE DESCRIPTION OR TO PAY THE FEE WITHIN THE PRESCRIBED TIME-LIMIT Effective date: 20180829 Ref country code: BG Free format text: LAPSE BECAUSE OF FAILURE TO SUBMIT A TRANSLATION OF THE DESCRIPTION OR TO PAY THE FEE WITHIN THE PRESCRIBED TIME-LIMIT Effective date: 20181129 Ref country code: NL Free format text: LAPSE BECAUSE OF FAILURE TO SUBMIT A TRANSLATION OF THE DESCRIPTION OR TO PAY THE FEE WITHIN THE PRESCRIBED TIME-LIMIT Effective date: 20180829 Ref country code: LT Free format text: LAPSE BECAUSE OF FAILURE TO SUBMIT A TRANSLATION OF THE DESCRIPTION OR TO PAY THE FEE WITHIN THE PRESCRIBED TIME-LIMIT Effective date: 20180829 |
|
| REG | Reference to a national code |
Ref country code: AT Ref legal event code: MK05 Ref document number: 1035667 Country of ref document: AT Kind code of ref document: T Effective date: 20180829 |
|
| PG25 | Lapsed in a contracting state [announced via postgrant information from national office to epo] |
Ref country code: HR Free format text: LAPSE BECAUSE OF FAILURE TO SUBMIT A TRANSLATION OF THE DESCRIPTION OR TO PAY THE FEE WITHIN THE PRESCRIBED TIME-LIMIT Effective date: 20180829 Ref country code: LV Free format text: LAPSE BECAUSE OF FAILURE TO SUBMIT A TRANSLATION OF THE DESCRIPTION OR TO PAY THE FEE WITHIN THE PRESCRIBED TIME-LIMIT Effective date: 20180829 Ref country code: AL Free format text: LAPSE BECAUSE OF FAILURE TO SUBMIT A TRANSLATION OF THE DESCRIPTION OR TO PAY THE FEE WITHIN THE PRESCRIBED TIME-LIMIT Effective date: 20180829 |
|
| PG25 | Lapsed in a contracting state [announced via postgrant information from national office to epo] |
Ref country code: CZ Free format text: LAPSE BECAUSE OF FAILURE TO SUBMIT A TRANSLATION OF THE DESCRIPTION OR TO PAY THE FEE WITHIN THE PRESCRIBED TIME-LIMIT Effective date: 20180829 Ref country code: RO Free format text: LAPSE BECAUSE OF FAILURE TO SUBMIT A TRANSLATION OF THE DESCRIPTION OR TO PAY THE FEE WITHIN THE PRESCRIBED TIME-LIMIT Effective date: 20180829 Ref country code: ES Free format text: LAPSE BECAUSE OF FAILURE TO SUBMIT A TRANSLATION OF THE DESCRIPTION OR TO PAY THE FEE WITHIN THE PRESCRIBED TIME-LIMIT Effective date: 20180829 Ref country code: PL Free format text: LAPSE BECAUSE OF FAILURE TO SUBMIT A TRANSLATION OF THE DESCRIPTION OR TO PAY THE FEE WITHIN THE PRESCRIBED TIME-LIMIT Effective date: 20180829 Ref country code: EE Free format text: LAPSE BECAUSE OF FAILURE TO SUBMIT A TRANSLATION OF THE DESCRIPTION OR TO PAY THE FEE WITHIN THE PRESCRIBED TIME-LIMIT Effective date: 20180829 Ref country code: AT Free format text: LAPSE BECAUSE OF FAILURE TO SUBMIT A TRANSLATION OF THE DESCRIPTION OR TO PAY THE FEE WITHIN THE PRESCRIBED TIME-LIMIT Effective date: 20180829 Ref country code: IT Free format text: LAPSE BECAUSE OF FAILURE TO SUBMIT A TRANSLATION OF THE DESCRIPTION OR TO PAY THE FEE WITHIN THE PRESCRIBED TIME-LIMIT Effective date: 20180829 |
|
| PG25 | Lapsed in a contracting state [announced via postgrant information from national office to epo] |
Ref country code: SM Free format text: LAPSE BECAUSE OF FAILURE TO SUBMIT A TRANSLATION OF THE DESCRIPTION OR TO PAY THE FEE WITHIN THE PRESCRIBED TIME-LIMIT Effective date: 20180829 Ref country code: DK Free format text: LAPSE BECAUSE OF FAILURE TO SUBMIT A TRANSLATION OF THE DESCRIPTION OR TO PAY THE FEE WITHIN THE PRESCRIBED TIME-LIMIT Effective date: 20180829 Ref country code: SK Free format text: LAPSE BECAUSE OF FAILURE TO SUBMIT A TRANSLATION OF THE DESCRIPTION OR TO PAY THE FEE WITHIN THE PRESCRIBED TIME-LIMIT Effective date: 20180829 |
|
| REG | Reference to a national code |
Ref country code: DE Ref legal event code: R097 Ref document number: 602012050386 Country of ref document: DE |
|
| PLBE | No opposition filed within time limit |
Free format text: ORIGINAL CODE: 0009261 |
|
| STAA | Information on the status of an ep patent application or granted ep patent |
Free format text: STATUS: NO OPPOSITION FILED WITHIN TIME LIMIT |
|
| 26N | No opposition filed |
Effective date: 20190531 |
|
| PG25 | Lapsed in a contracting state [announced via postgrant information from national office to epo] |
Ref country code: MC Free format text: LAPSE BECAUSE OF FAILURE TO SUBMIT A TRANSLATION OF THE DESCRIPTION OR TO PAY THE FEE WITHIN THE PRESCRIBED TIME-LIMIT Effective date: 20180829 Ref country code: SI Free format text: LAPSE BECAUSE OF FAILURE TO SUBMIT A TRANSLATION OF THE DESCRIPTION OR TO PAY THE FEE WITHIN THE PRESCRIBED TIME-LIMIT Effective date: 20180829 |
|
| PG25 | Lapsed in a contracting state [announced via postgrant information from national office to epo] |
Ref country code: LU Free format text: LAPSE BECAUSE OF NON-PAYMENT OF DUE FEES Effective date: 20190120 |
|
| REG | Reference to a national code |
Ref country code: BE Ref legal event code: MM Effective date: 20190131 |
|
| REG | Reference to a national code |
Ref country code: IE Ref legal event code: MM4A |
|
| PG25 | Lapsed in a contracting state [announced via postgrant information from national office to epo] |
Ref country code: BE Free format text: LAPSE BECAUSE OF NON-PAYMENT OF DUE FEES Effective date: 20190131 |
|
| PG25 | Lapsed in a contracting state [announced via postgrant information from national office to epo] |
Ref country code: IE Free format text: LAPSE BECAUSE OF NON-PAYMENT OF DUE FEES Effective date: 20190120 |
|
| PG25 | Lapsed in a contracting state [announced via postgrant information from national office to epo] |
Ref country code: TR Free format text: LAPSE BECAUSE OF FAILURE TO SUBMIT A TRANSLATION OF THE DESCRIPTION OR TO PAY THE FEE WITHIN THE PRESCRIBED TIME-LIMIT Effective date: 20180829 |
|
| PG25 | Lapsed in a contracting state [announced via postgrant information from national office to epo] |
Ref country code: PT Free format text: LAPSE BECAUSE OF FAILURE TO SUBMIT A TRANSLATION OF THE DESCRIPTION OR TO PAY THE FEE WITHIN THE PRESCRIBED TIME-LIMIT Effective date: 20181229 Ref country code: MT Free format text: LAPSE BECAUSE OF NON-PAYMENT OF DUE FEES Effective date: 20190120 |
|
| PG25 | Lapsed in a contracting state [announced via postgrant information from national office to epo] |
Ref country code: CY Free format text: LAPSE BECAUSE OF FAILURE TO SUBMIT A TRANSLATION OF THE DESCRIPTION OR TO PAY THE FEE WITHIN THE PRESCRIBED TIME-LIMIT Effective date: 20180829 |
|
| PG25 | Lapsed in a contracting state [announced via postgrant information from national office to epo] |
Ref country code: HU Free format text: LAPSE BECAUSE OF FAILURE TO SUBMIT A TRANSLATION OF THE DESCRIPTION OR TO PAY THE FEE WITHIN THE PRESCRIBED TIME-LIMIT; INVALID AB INITIO Effective date: 20120120 |
|
| PG25 | Lapsed in a contracting state [announced via postgrant information from national office to epo] |
Ref country code: MK Free format text: LAPSE BECAUSE OF FAILURE TO SUBMIT A TRANSLATION OF THE DESCRIPTION OR TO PAY THE FEE WITHIN THE PRESCRIBED TIME-LIMIT Effective date: 20180829 |
|
| P01 | Opt-out of the competence of the unified patent court (upc) registered |
Effective date: 20230519 |
|
| PGFP | Annual fee paid to national office [announced via postgrant information from national office to epo] |
Ref country code: CH Payment date: 20250201 Year of fee payment: 14 |
|
| PGFP | Annual fee paid to national office [announced via postgrant information from national office to epo] |
Ref country code: GB Payment date: 20251218 Year of fee payment: 15 |
|
| PGFP | Annual fee paid to national office [announced via postgrant information from national office to epo] |
Ref country code: FR Payment date: 20251222 Year of fee payment: 15 |
|
| PGFP | Annual fee paid to national office [announced via postgrant information from national office to epo] |
Ref country code: DE Payment date: 20251216 Year of fee payment: 15 |