EP2677448A2 - Procédés et systèmes d'utilisation de jeux de données de haute fiabilité - Google Patents
Procédés et systèmes d'utilisation de jeux de données de haute fiabilité Download PDFInfo
- Publication number
- EP2677448A2 EP2677448A2 EP13183011.9A EP13183011A EP2677448A2 EP 2677448 A2 EP2677448 A2 EP 2677448A2 EP 13183011 A EP13183011 A EP 13183011A EP 2677448 A2 EP2677448 A2 EP 2677448A2
- Authority
- EP
- European Patent Office
- Prior art keywords
- data
- sorted
- substantially equivalent
- value
- data set
- Prior art date
- Legal status (The legal status is an assumption and is not a legal conclusion. Google has not performed a legal analysis and makes no representation as to the accuracy of the status listed.)
- Withdrawn
Links
Images










Classifications
-
- G—PHYSICS
- G01—MEASURING; TESTING
- G01J—MEASUREMENT OF INTENSITY, VELOCITY, SPECTRAL CONTENT, POLARISATION, PHASE OR PULSE CHARACTERISTICS OF INFRARED, VISIBLE OR ULTRAVIOLET LIGHT; COLORIMETRY; RADIATION PYROMETRY
- G01J1/00—Photometry, e.g. photographic exposure meter
- G01J1/58—Photometry, e.g. photographic exposure meter using luminescence generated by light
-
- G—PHYSICS
- G16—INFORMATION AND COMMUNICATION TECHNOLOGY [ICT] SPECIALLY ADAPTED FOR SPECIFIC APPLICATION FIELDS
- G16B—BIOINFORMATICS, i.e. INFORMATION AND COMMUNICATION TECHNOLOGY [ICT] SPECIALLY ADAPTED FOR GENETIC OR PROTEIN-RELATED DATA PROCESSING IN COMPUTATIONAL MOLECULAR BIOLOGY
- G16B25/00—ICT specially adapted for hybridisation; ICT specially adapted for gene or protein expression
-
- G—PHYSICS
- G06—COMPUTING OR CALCULATING; COUNTING
- G06F—ELECTRIC DIGITAL DATA PROCESSING
- G06F11/00—Error detection; Error correction; Monitoring
- G06F11/004—Error avoidance
Definitions
- the present teachings relate to methods and systems for high-confidence utilization of large-scale datasets.
- the method of the present teachings includes selecting a metric for determining substantially optimal combination of true positives and false positives in a data set, applying an optimization technique, and obtaining, from the results of the optimization technique, a value for at least one optimization parameter, the value for at least one optimization parameter resulting in substantially optimal combination of true positives and false positives.
- a number of true positives and a number of false positives are a function of the one or more optimization parameters.
- the method of the present teachings for summarizing parameter value includes grouping measurement result from a data set into a number of pairs of measurement results, determining, for each one pair of measurement results, whether predetermined measures for the one pair of measurement results satisfy threshold criteria, classifying a pair of measurement results from the number of pairs of measurement results as not changing if the predetermined measures do not satisfy the threshold criteria; comparing, if the predetermined measures satisfied the threshold criteria, one measurement result in each one pair of measurement results to another measurement result in each one pair of measurement results, classifying, after the comparison, each one pair of measurement results according to result of the comparison.
- the present teachings include a set of methods and algorithms to aid high-confidence utilization of large-scale datasets, viz., (a) a response surface assisted strategy to study datasets represented by multiple measurements of each parameter (especially using independent aspects of the same parameter) and aid in design of such measurement technologies and schemes, (b) methods for determining data-specific thresholds, (c) to test the efficacy of a selection strategy (statistical and/or mathematical) in the data analysis scheme, and (d) a new normalizing scheme for making datasets comparable.
- each transcript is represented by eleven or more 25 nucleotide long probes complementary to the mRNA to probe the transcriptional status of the system being studied.
- a corresponding mismatch probe to represent the cross-hybridization signal (would be considered probe-specific noise) is included in the chip.
- High feature densities have been achieved and known and predicted transcripts have been arrayed onto one to few chips for human and other organisms.
- mismatch probes is included to represent the cross-hybridization or probe-specific noise signal and is used in that sense in examples described here, other variations (and applications) that do not include these MM probes (e.g., as suggested in dCHIP: www.dchip.org and Irizarry et. al. 2003) are equally well utilized by the approaches described as part of this set of teachings, and advantages if any would directly translate in the outcome.
- each probe though representing a single transcript i.e., transcript expressed at a particular quantal level
- hybridization intensity levels This leads to difficulties in direct utilization of the signal levels.
- One common approach that has been extensively researched on and being continually developed is to use model based approaches to summarize the data represented by multiple probes into a single summary measure for each transcript (see U. S. Pat. No. 6571005 , which is incorporated by reference herein).
- This approach has the advantage of user friendly representation of the data and in ease of utilization in advanced statistical and mathematical applications for the utilization of the data in the context of advancement of knowledge of the system/process being studied (using pattern recognition, classifiers for diagnostics, identification and study of pathways and new processes, lead candidates for product development etc.).
- parameter is used in two context specific manner: (i) to describe each experimental feature within a dataset (transcript, protein etc.,), and (ii) thresholds and other calculated numbers used in the process of utilizing the invention(s) in statistical and mathematical sense.
- thresholds and other calculated numbers used in the process of utilizing the invention(s) in statistical and mathematical sense.
- the difference between a calculated value and a set of calculated/estimated or designated threshold is differentiated by a superscripted single quote (for example distance designated d would be d' when used as threshold).
- independent measures simply imply measures of one parameter (transcript etc.,) using entirely different measurement criteria (e.g., different regions of a transcript as probe, different regions of a protein - peptide fragments, more than one antibody to measure a protein etc., - while the different region might have physical overlap it could have different signal properties under the same condition.
- the embodiments described herein are not limited to this type of statistical independence.
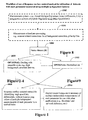
- FIG.1 illustrates one representative an embodiment of early stage workflow in processing data.
- data are collected from a measurement system step 1002 and pre-processed steps 1004 and 1008. This pre-processing would depend on the data-collection technology-specific properties and are assumed to be carried out, unless mentioned otherwise (if needed, prior to applying embodiments of the teachings described herein).
- Such pre-processed datasets are denoted as starter datasets and indicated by letter D step 1006 in the rest of the document and in the figures.
- Some other figures are referred to in this overview depicted in FIG. 1 ( FIG. 2a - to FIG. 4 step 1010, FIG. 8 step 1012 and FIG. 9 step 1014). Aspects of FIG. 2a through FIG.
- FIG. 4 depicts a response surface approach proposed to study the properties of a given data design that would (i) aid high-confidence data analysis, and (ii) conversely, aid development of design principles for a given system using some initial properties of the experimental and technological aspects.
- FIG. 14 depicts a new normalization scheme that is motivated by biological invariance principles.
- FIG. 9 depicts application of these two above embodiments in combination or using the first aspect alone, together with methods for data specific thresholds for parameters used in their application in a new summarization scheme as well as in high-confidence differential identification between datasets representing different observations of experimental or natural processes. Variations and details of some individual steps are referred to in those figures as additional figures with appropriate figure numbers.
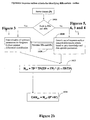
- FIG. 2a , 2b show an embodiments of the method of these teachings.
- One instance has a tester system with built-in true and false positives mixed into the system, step 1016, or to mix an appropriately simulated true and false positives step 1020 (for example using techniques described in developing the methods and algorithms referred to as DaST and SCALEIT ), described below.
- the method of this teaching includes optimizing the identification of differentials between datasets maximizing the identification of true positives and minimizing the identification of false positives.
- a metric termed N eff (for effective number of differentials) is utilized.
- the following equation is utilized (also used in FIG. 2b step 1022) - alternative forms suited for specific applications can be used for this purpose ( FIG. 2a , step 1024).
- N eff TP * TP / TP + FP * 1 - FP / TP
- a response surface of Neff with differing values of N (number of independent measures) of that parameter in that dataset included and any appropriate statistical/mathematical measure of confidence of the determination F (i.e., differential against the noise) - e.g., Student's t-test for pair-wise comparison of datasets (with replicates) or Fishers test for comparing multiple groups of data - is a surface with multiple maximum and minimum points on the surface.
- the Dataset used is Affymetrix Latin Square Experiments (2 to 7) with three replicates each using U133A-TAG chip (available at http://www.affymetrix.com/support/technical/sample_data/datasets.affx) .
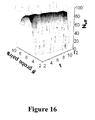
- the normalization used in the results shown in FIG. 16 was scaling average of all PM and MM intensity values between values 46,000 (saturation) and overall chip background (28) to 500.
- the response surface of N eff step 1022, in FIG.16 indicates a broad range of t statistic and a range of N (independent measures included) that gives near maximal value of N eff .
- a cost factor involving N and F symbol F is used as the measure of any statistic / mathematical measure of confidence used throughout the document. The lower the F and N that gives the substantially optimal combination of true and false positives, the better the ability to detect small changes with sensitivity. Increased specificity would result from the use of multiple independent measurements in its full form (i.e., without summarizing to a single value) in the analysis schema.
- FIG. 6 and FIG. 7 An alternative strategy that eliminates the need for iteration to determine F' as described above but determines a data specific threshold, is described in FIG. 6 and FIG. 7 .
- substantially optimum parameters for F' and N' would still need to be determined based on knowledge based on test cases run using algorithm in FIGS. 3a , 3b starting step 1032 and FIGS'. 2a, 2b steps 1026 and 1028.
- An embodiment of the method for the devising of measurements includes obtaining a relationship between one or more preselected parameters and one or more performance indicators for the measurement of the data set, selecting a metric based on the at least one performance indicator, applying an optimization technique, and obtaining, from the results of the optimization technique, one or more substantially optimal values of the one or more parameters.
- the one or more substantially optimal values of the one or more parameters enables devising the measurement/collection strategy of the data set.
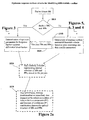
- FIG. 3a and FIG. 3b depict an algorithm to study these behaviors and iteration over the parameters to determine the substantially optimal threshold.
- the method described in FIG. 3a and FIG. 3b includes iterating over possible values of N (number of independent measures included, steps 1032 and 1032b) and over a range of user determined confidence threshold of F (when there are more than one replicated group, FIG. 3b - step 1032b).
- the datasets could, in one instance, be composed of two or more observations, or groups of replicated dataset representing properties of different process states.
- the increment for iteration over N (N inc ) would be 1 (as this represents the number of measures), and for F (F inc ) - step 1032 and 1032b, FIG. 3a and FIG.
- Each parameter (i) is evaluated to satisfy a set of noise threshold criteria and confidence measures on a comparative basis (i.,e between two observations or between sets of replicated observations classified into groups) as decribed below. In one instance, only measures that satisfies the noise control criteria mentioned below and in FIG. 3a step 1036 and FIG. 3b step 1036 and step 1046 are used.
- ⁇ j 1 M x
- x jA and x jB above refers to signal of that measure for that parameter being evaluated (x) between two conditions designated A and B, and j running over the M measures of that parameter i.
- F applies to cases with replicated groups in the dataset (step 1046).
- max and min are used in step 1036 to represent a general case where max refers to maximum and min the minimum of the two values in case of single values being compared, maximum/minimum of two averages or medians or maximum/minimum of the group with the lower average or median.
- step 1050 When the evaluation of a measure satisfy these criteria it is used in the measures included in the analysis (step 1050) and the next measure is evaluated. This is repeated for all the measures of a parameter (step 1034). When the number of measures passing the above criteria exceeds the threshold number of measures for that iteration (step 1052), then that parameter is considered differential between the observations (or groups) being compared. When all the parameters are evaluated the results are for that set of threshold used in that iteration are recorded (step 1054) and the values of the parameter thresholds are incremented and used for the next iteration (step 1058). Once the range of iterations are covered using the increments specified all the stored results are used to select the substantially optimal combination of N' - and F' in case of multiple replicated groups as in FIG. 3b - (step 1056), one embodiment of which is described in FIG. 2 , using known or simulated differentials.
- FIG. 3b which is an extension of FIG. 3a deals with the case of multiple replicated groups involves optimization of two parameters, the number of measures of that parameter (N') and a confidence measure (F').
- the use of the confidence measure based on replicated observations in combination with multiple measures substantially improves the comparative analyses of the data.
- the iterations are carried out similar to that of FIG. 3a but for each increment of F in the range selected (i.e., F' for that iteration), the values as described in FIG. 3a above are calculated for the whole range of N through iterative loop with changing N' (steps 1032b and 1058b).
- the specifics of the strategy are nearly identical except that for each measure and for each evaluation cycle the confidence measure F (step 1044) that is calculated on a comparative basis between two replicates should also exceed the threshold F' (step 1046 ).
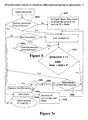
- FIG. 4 depicts a strategy that eliminates some groups (in multi-group comparisons) based on these thresholding strategies and allows varying group number based differential identification for each measure to be evaluated.
- the noise thresholding is based on comparison of average values over all G groups (termed AvgT step 1060) to that of individual group for each parameter i.
- average could be replaced by median or maximum and minimum of the groups or over all groups as described for FIG. 3 .
- FIG. 17 depicts an example of the behavior of CAN eff with varying values of measurements included (N) and of the statistic (t-statistic in this case) for the same comparison shown in FIG.16 . It can be seen from FIG. 16 and Table 1 that (i) the nearly flat surface in FIG. 16 of the response surface of N eff can now be reduced to a few distinct peaks, and (ii) the statistical threshold is much lower than that of commonly used data analysis threshold for p value of 0.05.
- Table 1 Indicated, in Table 1, are the number of spike-ins of two fold difference identified at each threshold (out of 9, three in each comparison for three individual comparisons).
- concentration of the spike-in (in pM) are indicated in the leftmost column in each case the concentration of the spike-in in the other dataset is twice this amount (except as indicated below).
- the threshold of t-statistic (F') and number of valid probe-pairs (N') is indicated in the first row as (F',N').
- FP is number of false positives
- PPV positive prediction value [TP/(TP+FP)]
- sensitivity is [TP/(TP + FN)].
- ⁇ CR indicates cross-reactive transcripts/probesets with homology to spike-ins (out of 9, three in each comparison for three individual comparisons). The dataset are the same as used in example shown in FIG. 16 and FIG. 17 . (Note that, in FIG. 17 , t used instead of F' above and that N' is equal to the number of probe pairs.)
- Table 2 demonstrate the significant advantages of these findings, i.e., ability to select true positives without much impact on the number of false positives identified even at lower confidence thresholds. Further this precludes the need for guessing the threshold. Strategies for estimating data-specific thresholds are described later ( FIG. 5 , FIG. 6 and FIG. 7 ). Some aspects of applications of this invention in the context of gene expression measurements using GeneChip® technology are described in Gopalan, Genome Biology 2004 5:p 14, which is incorporated by reference herein.
- Some of the embodiments described above utilized a dataset specifically designed for such purposes. Many currently existing datasets seldom are designed with built-in true and false positives, or not in sufficient number and variety.
- One embodiment, for the instance in which there is not a sufficient number of variety of true and false-positives utilizes a tester dataset as above to determine thresholds that could be used with that type of data generation technology.
- the use of distance and ratio thresholds have already been demonstrated in several conventional analyses schemes, but, in this teachings, algorithms for determining data-specific thresholds of these parameters are disclosed.
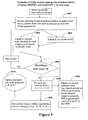
- FIG. 5 depicts a schema that determines data-specific thresholds for distance (d) (i.e., numerical difference between the two values or two groups) and ratio (r) that would typically lie within noise level for that data.
- a percentile is determined at which these values d and r would be optimum based on the ability to detect substantially optimal combination of true and positives from a tester dataset, e.g., using N eff step 1022.
- N eff step 1022 e.g., using N eff step 1022.
- a large enough random sampling of the data - step 1062 or the whole data, step 1064 is selected and the distance and ratio are determined between the maximum and minimum for each selected measure for example within replicates (thus capturing the noise component of the data, step 1066).
- the calculated distances and ratios are sorted in ascending order of values (of d and r) and values of d and r at different percentiles on the ordered set of values are chosen as thresholds ( d' and r') - step 1072 - and used as described in applications described in previous sections or in determining thresholds for many data analyses scheme (either for selection or for elimination to avoid dealing with data just in noise range).
- the different thresholds are tested on a training set and optimum value chosen (for example by using equation for N eff ). This percentile value can be used to determine d' and r' (the selected thresholds - DaSTd' and DaSTr') step 1074.
- Dynamic thresholds can also be determined by using similar strategies on a data ranked by values of the measures at different points along the distribution and assuming piecewise linearity (step 1076).
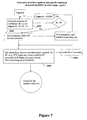
- FIG. 6 and FIG. 7 describes similar embodiments, but with additional intricacies for the determination of data-specific threshold of F (the measure of confidence used) to avoid differentials primarily within the range of noise (hence few true positives in those ranges).
- F the measure of confidence used
- a large enough sample of parameters and all its replicates are used and additional values within the range of values represented by the replicates are simulated, step 1080.
- step 1096 This value can either be chosen on user determined confidence level or iterated for using a training set, step 1096.
- the noise range elimination strategies described earlier steps 1036 and 1048 could optionally included in calculating DaSTd', DaSTr' and DaSTF'.
- Alternate manifestations of step 1092 could include median or any other percentile of values calculated for the N' measures of each parameter, rather than the minimum over the N' values of F.
- N' value was set as 50% of all probesets (independent measures) available, based on prior trials with data used in example results shown in Tables 1 and 2 (Table 3).
- Table 3- Application of data-specific thresholding strategy (FIG. 5 - FIG. 7), BINorm scheme (FIG. 14), and ReSurfX (FIG.
- Intensity measure used is PM - MM, for each probe pair. Normalization used is BINorm at 25% middle values in each subset using known spiked-in invariant set built-in the data. AvgA and AvgB are used instead of max and min in Figure 3 .
- Embodiments of the method of the present teachings for summarizing parameter value includes grouping measurement result from a data set into a number of pairs of measurement results, determining, for each one pair of measurement results, whether predetermined measures for the one pair of measurement results satisfy threshold criteria, classifying a pair of measurement results from the number of pairs of measurement results as not changing if the predetermined measures do not satisfy the threshold criteria; comparing, if the predetermined measures satisfied the threshold criteria, one measurement result in each one pair of measurement results to another measurement result in each one pair of measurement results, classifying, after the comparison, each one pair of measurement results according to result of the comparison.
- the embodiment includes the steps of averaging the measurement results over replications and grouping the averaged measurement results into a number of pairs of averaged measurement results.
- the method proceeds similar to the preceding embodiment, utilizing pairs of averaged measurement results instead of pairs of results.
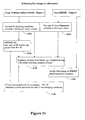
- FIG. 9 and FIG. 10 describe an embodiment of the method of these teachings for summary measure using groups of data (typically replicates of observations in a dataset), while FIG. 8 and FIG.10 describe a similar algorithm but for dealing with each observation as single unit (typically unreplicated observations).
- Each independent measure satisfying noise threshold criteria i.e., steps 1100, 1102, 1110, 1112 and 1114 (as in steps 1036 and 1048) of a parameter is classified as no change (NC), increase (I) or decrease (D) i.e., steps 1104, 1106, 1108, 1116, 1118, 1120 based on pair-wise comparisons, step 1098.
- noise threshold criteria i.e., steps 1100, 1102, 1110, 1112 and 1114 (as in steps 1036 and 1048) of a parameter is classified as no change (NC), increase (I) or decrease (D) i.e., steps 1104, 1106, 1108, 1116, 1118, 1120 based on pair-wise comparisons, step 1098.
- the independent measurements satisfying the specified criteria in the pairs over a particular threshold of datasets and as many independent measurements having uniform classification for that parameter are chosen for each parameter step 1122.
- the number of independent measurements chosen for each parameter is above N' the values based one reference chip or a set of chips are ordered and the middle N' measurements are used for calculation of expression summaries for all datasets step 1128.
- Some alternate purpose/technology specific embodiments would include ordering the usable parameters N based on purpose specific criteria (e.g., along a predicted transcript and using a set that maximizes chances of detecting a variant of the transcript of interest among possible alternatively spliced forms).
- N' measurements satisfying minimum criteria are used (step 1126), sorted and measurements representing middle N' values chosen.
- the expression summary could be a simple measure such as weighted average with outlier correction or any other established or modified summary measures step 1130.
- N' measurements that have uniform property over many comparisons usually can be set as a threshold percentage of comparisons available to determine this property
- a common set for use with that type of dataset for most uses beyond available or used for this step can be chosen and stored for future use.
- EMINE uses such uniform set of measurements for each parameter for all datasets, termed the Chosenset step 1122, makes the summarized values have naturally better quality than using all or variable number of informative measurements.
- Use of an additional appropriate normalization after EMINE may be advantageous in some instances.
- One advantage of EMINE is the minimal use of numerical correction criteria.
- Embodiment of the method of these teachings for estimating fold change confidence estimates of differentials for Response surface based data analysis are disclosed herein below.
- FIG. 11 and FIG. 12 depict embodiments for determining estimates of ratio of differential (in pair-wise comparisons) and estimate of confidence for differentials when using Response surface assisted strategy, respectively.
- estimate of ratio is obtained by taking pair-wise ratio for each selected measurement (selection is either based on noise threshold elimination strategies, step 1132 ) similar to steps 1036 and 1048, using all N passing threshold elimination, the Chosenset strategy (step 1134), or the N' values nearest to median (step 1136), as described below and in step 1042) of that parameter followed by a summary metric - step 1138 - (e.g., weighted average with outlier correction as in step 1130 ).
- N failing noise threshold elimination strategy is greater than N' (step 1140 ) the failed ones can be used for summary measure.
- middle N' ratios as in step 1136 can be used. The spread of the estimated ratio for each parameter over the number of measures used is used to determine and report an estimate of the ratio.
- the measure of confidence uses similar techniques (steps 1144 and 1146) except that a minimum value is used to give the most conservative measure of confidence, other variations based on percentiles of all confidence measures from informative measurements of that parameter in that comparison could also be used.
- informative N is greater than threshold N', an alternative is to use the middle N' values of a sorted (descending) array of F values - step 1148.
- the confidence measure can then be used as in the cost factor as an additive measure of N' and F' (step 1026) or can be converted to a p-value from a standard statistic or bootstrap based statistics and presented in desirable format (some usable forms are proposed in FIG. 12 , step 1150).
- standard mathematical and/or statistical can be applied - steps 1142 and 1152.
- SCALEIT differential selection scheme used in analyses of datasets
- FIG. 13 describes an embodiment of the method of these teachings using a data-scaling approach (SCALEIT), and an example of its utility provided.
- SCALEIT data-scaling approach
- SCALEIT involves scaling the whole dataset and its replicates to varying extent (e.g., 1.2, 1.5, 2 times etc.,) - step 1154 - and application of the data analysis/differential identification scheme - step 1156.
- extent e.g., 1.2, 1.5, 2 times etc.
- the advantage with this approach being the utilization of all possible variance structures inherent to the system.
- An example of this approach in the context of Response surface assisted method to identify differentials at various thresholds - step 1158 - is shown in Table 2.
- Some forms of data analysis schemes would be better tested by modifications of this unidirectional scaling strategy, for example bidirectional changes or mixture of such changes suitably combined with original dataset.
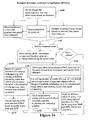
- An embodiment of the method of these teachings for normalizing data from a data set includes the steps of sorting data from the data set according to measurement value, selecting, according to a predetermined criterion, reference subsets, the reference subsets having at least one reference measurement value, selecting, from the sorted data, data elements having measurement values substantially equivalent to the one or more reference measurement values, sorting the data elements having substantially equivalent measurement values, the sorted data elements comprising a sorted substantially equivalent subset, and utilizing the one or more reference measurement values and the sorted substantially equivalent subset to normalize the data set.
- BINorm An embodiment of such teachings motivated by principles of biological invariance to normalize data, referred to as BINorm, is disclosed herein below.
- Array based as well as many other technologies rely highly on normalization (or some form of numerical equivalency of data) between datasets within a platform and across platforms.
- Most normalization used to date relies on ordering of datasets and correcting systematic variations in a intensity dependent manner either using the whole data based distributions, or in spatially separated groups as in print-tip normalizations (e.g., lowess).
- a rank based assumption is built-into the system including nearly exact distribution of datasets, or ordering the whole datasets and choosing rank based invariant sets between a reference and a target dataset (e.g., U. S. Patent No.
- the reference data is ordered by measured values - step 1162 - and subsets are chosen along the total distribution of the data, termed Iref, step 1164.
- the measures equivalent to each subset i.e., indexes of the data points in the subset are used) are chosen from the target data and this subset sorted, termed Itarget , step 1166.
- the middle x % of values in the target subset should have equivalent values of the subset from reference array - simplified version of step 1168 - (e.g., middle 10% in a 100 point subset of Iref and Itarget).
- the average (or median) of the x values in Itarget will be equivalent to Iref.
- the equivalence determined this way along the whole dataset would then be used to normalize using a piecewise linear functionality.
- the value of x would vary with the percentage of invariance and can be iterated upon, step 1176, after the above step or on another embodiment depicted in the picture after iterating on regional equivalence of values in Itarget as described below. As long as the percentage of invariance between the datasets is above x, there should be no degradation of quality even when much lower percentage, than actual invariance in the data is used. Variations in regional selection of invariance are needed when unidirectional skew in differentials is present between datasets.
- One embodiment to deal with such cases, represented in steps 1168 and 1170, is to iterate over the equivalent region by scaling the x% of ordered measurements of Itarget at different at different percentiles on the ordered data (e.g., x% starting at 10 th percentile rather then the middle) and scaling the value to the middle x% of Iref.
- a built-in training set, a large enough putative invariant set can be used to test the quality of the normalization to particular datasets - step 1172 - or using an appropriate test scheme for equivalence.
- the equivalent range chosen to scale the whole data would be the one that gives the best concordance between the two datasets as determined with the test using known/simulated invariants or another test scheme for equivalence - step 1174.
- BINorm scheme has the advantage of simple correction of systematic changes while preserving variability inherent in the experimental design, thus improving specificity and confidence in the utilization of resultant inferences from the analyses.
- An example of such usage with a perfect invariant set is shown in Table 3, though these teachings not being limited to such an example.
- a computer usable medium 1179 has computer readable code embodied therein, where the computer readable code is capable of causing the computer system 1175 to execute the methods of these teachings.
- the GeneChip expression data set used in these analyses is from the Affymetrix dataset released for purposes of algorithm development, and based on HG-U133A-Tag arrays Experiments 2 through 5, replicates R1 through R3 (http://www.affymetrix.com/support/technica)/sample_data/datasets.affx).
- This data set was generated using a hybridization cocktail consisting of specific RNA spike-ins of known concentration mixed with total cRNA from HeLa cell line, by Affymetrix.
- Probe level data were extracted from Cell files (using tiling coordinates defined by probesequence information supplied for the chip type - U133A-Tag by Affymetrix) and the mean of all signal values (of perfect matches and mismatches that were between the value 28 (the lowest background in the chips used) and a saturation value of 46,000) were scaled to target value of 500.
- b is the background of that chip (as determined by Microarray Suite 5.0).
- probe-pairs represented a probeset only the first 11 (in their order of listing in Affymetrix probesequence file) were extracted and used. The difference between perfect match and mismatch value for each probe-pair was used for all further evaluations. Zero or negative differences were set to background.
- the signal values were extracted using Microarray Suite 5.0 (Affymetrix, CA) with the trimmed mean (top and bottom 2% signal values are trimmed) for each array scaled to a target intensity of 500, for representation in Figure 3 .
- variance weighted average were used, as mentioned.
- Typical analysis of GeneChip data for identification of differentials between datasets involve extraction of the probe level data using an unified expression index signifying the estimated level of expression of that transcript summarizing the information in the eleven or more probe-pairs, following normalization or scaling.
- Some common methods used for this purpose are dCHIP, RMA and MAS (Microarray Suite, currently version 5,0, Affymetrix, CA).
- the use of unified expression index is advantageous in terms of computational simplicity and easy adaptation of statistical methods to high dimensional datasets. But, due the extremely variable behavior inherent to each probe representing the transcript the unified expression index do not always perform satisfactorily. Consequently, statistical approach to reduction of false positives based on ordered statistics or other Bayesian approaches does not satisfactorily address the issue of false positives.
- a valid probe-pair was defined as one that has a minimum difference of average signal value (difference between signal for perfect match and mismatch) above background, and the ratio of averages is at least 1.1 (selected intuitively, but can be determined empirically for different datasets) and above threshold t, to avoid values in very close range.
- n is the number of probe-pairs satisfying the conditions
- t' is the threshold for t statistic
- np is the threshold for number of valid probe-pairs
- xie and xib is the signal value for probe-pair i, in experimental and baseline chips, respectively.
- the above equation represents selection of probesets where the chip designated the experimental chip has higher value than the chip designated the baseline chip, the equation for probesets with value for baseline chip higher can be obtained by interchanging xie and xib.
- FIG. 18A shows the positive prediction value (PPV) increases i.e., a decreasing number of false positives are identified and sensitivity decreases i.e., lesser number of true positives are identified as differentials.
- FIG. 18B shows the decrease of true and false positives with increasing threshold of t and np.
- FIG. 16 shows the response surface of this effective number of positives as a function of and number of valid probe-pairs (np). It can be seen from the figure that a range of t and np can result in comparable Neff, with top two Neff at (t',np) of (7,5) and (6,6) with (true positives, false positives) of (91,1),(89,1) and (87,0), respectively. The total possible number of true positives and false positives were 135, and 66,555, respectively. It should be noted that the lowest differential (two fold) was used from the dataset, higher differentials would lead to identifcation of higher number of true positives.
- the response surface for CANeff as a function of t' and np is shown in FIG. 17 . It can be seen from the surface of CANeff ( FIG. 17 ) that the largely flat area near the peak of Neff (in FIG. 16 ) can now be reduced to a few distinct and narrow peaks.
- the (t',np) values yielding the top three CANeff are (3,7), (4,6) and (4,7) with (true positives, false positives) (86, 2), (91,5) and (85,0), respectively. It should be highlighted that these values of true and false positives selected at this threshold are comparable to that of the maximum Neff mentioned before.
- ResurfP Response surface assisted Parametic test.
- ResurfP Response surface assisted Parametic test.
- the threshold that can give good selectivity, the better it is to select small differentials and differentials in transcripts with low expression levels.
- the advantage of the lowered threshold were evaluated by scaling one of the two datasets (i.e., the probe level data extracted as outlined herein) used in above comparison to varying extents (1.5, 2, 3 and 4 fold) and comparing to the other dataset. This should allow comparison of data classes with wider variety of variances as opposed to a few signified by the spike-ins. Further, this should also reveal the sensitivity of the methodology in the context of technical replicates, thus revealing the maximum achievable sensitivity.
- a steep decline face on the surface of FIG 17 (right hand side) with increasing probe-pair threshold together with results indicated in Table 2 also indicate a higher penalty for increasing the probe-pair threshold than for increasing t statistic threshold. Additionally, these data indicate that an appropriate choice of a lower probe-pair threshold can lead to significantly higher number of true differentials without concomitant increase in false positives.
- the techniques described above may be implemented in one or more computer programs executing on a programmable computer including a processor, a storage medium readable by the processor (including, for example, volatile and non-volatile memory and/or storage elements), and, in some embodiments, also including at least one input device, and/or at least one output device.
- Program code may be applied to data entered using the input device (or user interface) to perform the functions described and to generate output information.
- the output information may be applied to one or more output devices.
- Each computer program may be implemented in any programming language, such as assembly language, machine language, a high-level procedural programming language, an object-oriented programming language, or a combination thereof.
- the programming language may be a compiled or interpreted programming language.
- Each computer program may be implemented in a computer program product tangibly embodied in a computer-readable storage device for execution by a computer processor.
- Method steps of the invention may be performed by a computer processor executing a program tangibly embodied on a computer-readable medium to perform functions of the invention by operating on input and generating output.
- Other methods and/or computer codes can provide input to these programs based on combinations of components herein or take output from these combinations as input. Combinations of input and output, i.e., communicative and integrative use of components described herein and other methods or computer codes could also be implemented.
- Computer-readable (computer usable) media include, for example, a floppy disk, a flexible disk, hard disk, magnetic tape, or any other magnetic medium, a CDROM, any other optical medium, punched cards, paper tape, any other physical medium with patterns of holes or other patterns, a RAM, a PROM, and EPROM, a FLASH-EPROM, any other memory chip or cartridge, a carrier wave, such as electromagnetic radiation or electrical signals, or any other medium from which a computer can read.
- NPs Numbered Paragraphs
Landscapes
- Physics & Mathematics (AREA)
- Engineering & Computer Science (AREA)
- Theoretical Computer Science (AREA)
- Health & Medical Sciences (AREA)
- Life Sciences & Earth Sciences (AREA)
- Spectroscopy & Molecular Physics (AREA)
- General Physics & Mathematics (AREA)
- Medical Informatics (AREA)
- Bioinformatics & Computational Biology (AREA)
- Biotechnology (AREA)
- Evolutionary Biology (AREA)
- General Health & Medical Sciences (AREA)
- Bioinformatics & Cheminformatics (AREA)
- Molecular Biology (AREA)
- Genetics & Genomics (AREA)
- Biophysics (AREA)
- General Engineering & Computer Science (AREA)
- Quality & Reliability (AREA)
- Investigating Or Analysing Biological Materials (AREA)
- Complex Calculations (AREA)
- Electron Beam Exposure (AREA)
- Image Analysis (AREA)
- Information Retrieval, Db Structures And Fs Structures Therefor (AREA)
- Data Exchanges In Wide-Area Networks (AREA)
- Communication Control (AREA)
Applications Claiming Priority (4)
| Application Number | Priority Date | Filing Date | Title |
|---|---|---|---|
| US70508305P | 2005-08-03 | 2005-08-03 | |
| US70558905P | 2005-08-04 | 2005-08-04 | |
| US11/497,926 US7480593B2 (en) | 2005-08-03 | 2006-08-02 | Methods and systems for high confidence utilization of datasets |
| EP06789227A EP1987450A4 (fr) | 2005-08-03 | 2006-08-03 | Procedes et systemes d'utilisation de haute fiabilite de jeux de donnees |
Related Parent Applications (1)
| Application Number | Title | Priority Date | Filing Date |
|---|---|---|---|
| EP06789227.3 Division | 2006-08-03 |
Publications (1)
| Publication Number | Publication Date |
|---|---|
| EP2677448A2 true EP2677448A2 (fr) | 2013-12-25 |
Family
ID=37718747
Family Applications (2)
| Application Number | Title | Priority Date | Filing Date |
|---|---|---|---|
| EP06789227A Withdrawn EP1987450A4 (fr) | 2005-08-03 | 2006-08-03 | Procedes et systemes d'utilisation de haute fiabilite de jeux de donnees |
| EP13183011.9A Withdrawn EP2677448A2 (fr) | 2005-08-03 | 2006-08-03 | Procédés et systèmes d'utilisation de jeux de données de haute fiabilité |
Family Applications Before (1)
| Application Number | Title | Priority Date | Filing Date |
|---|---|---|---|
| EP06789227A Withdrawn EP1987450A4 (fr) | 2005-08-03 | 2006-08-03 | Procedes et systemes d'utilisation de haute fiabilite de jeux de donnees |
Country Status (9)
| Country | Link |
|---|---|
| US (5) | US7480593B2 (fr) |
| EP (2) | EP1987450A4 (fr) |
| JP (1) | JP2009503741A (fr) |
| CN (1) | CN101278291B (fr) |
| AU (1) | AU2006278618B2 (fr) |
| CA (2) | CA2697606A1 (fr) |
| IL (1) | IL189170A (fr) |
| SG (1) | SG196801A1 (fr) |
| WO (1) | WO2007019182A2 (fr) |
Families Citing this family (19)
| Publication number | Priority date | Publication date | Assignee | Title |
|---|---|---|---|---|
| WO2002001391A2 (fr) * | 2000-06-23 | 2002-01-03 | Ecomsystems, Inc. | Systeme et procede de creation d'annonces publicitaires par ordinateur |
| US7480593B2 (en) * | 2005-08-03 | 2009-01-20 | Suresh Gopalan | Methods and systems for high confidence utilization of datasets |
| US20080103849A1 (en) * | 2006-10-31 | 2008-05-01 | Forman George H | Calculating an aggregate of attribute values associated with plural cases |
| US7925651B2 (en) * | 2007-01-11 | 2011-04-12 | Microsoft Corporation | Ranking items by optimizing ranking cost function |
| US8027972B2 (en) * | 2007-09-26 | 2011-09-27 | International Business Machines Corporation | Nodal data normalization |
| US8239416B2 (en) | 2008-05-30 | 2012-08-07 | Armanta, Inc. | System, method, and computer program product for modeling changes to large scale datasets |
| US8306758B2 (en) * | 2009-10-02 | 2012-11-06 | Dh Technologies Development Pte. Ltd. | Systems and methods for maintaining the precision of mass measurement |
| JP5399938B2 (ja) * | 2010-02-08 | 2014-01-29 | アズビル株式会社 | 推定用多項式生成装置、推定装置、推定用多項式生成方法および推定方法 |
| WO2012058242A2 (fr) | 2010-10-26 | 2012-05-03 | Stanley Victor Campbell | Système et procédé d'identification d'un code de diagnostic médical sur machine, d'accumulation, d'analyse et d'adjudication automatique d'un processus de revendication |
| US9460226B2 (en) * | 2012-06-28 | 2016-10-04 | Yahoo! Inc. | Index replication in distributed search engines |
| US9146248B2 (en) | 2013-03-14 | 2015-09-29 | Intelligent Bio-Systems, Inc. | Apparatus and methods for purging flow cells in nucleic acid sequencing instruments |
| US9591268B2 (en) | 2013-03-15 | 2017-03-07 | Qiagen Waltham, Inc. | Flow cell alignment methods and systems |
| US9923892B1 (en) * | 2013-06-14 | 2018-03-20 | Whitehat Security, Inc. | Enhanced automatic response culling with signature generation and filtering |
| WO2015016949A1 (fr) * | 2013-08-02 | 2015-02-05 | Schneider Electric Usa Inc. | Systèmes et procédés pour l'équivalence de mesure |
| CN108647186B (zh) * | 2018-04-17 | 2021-05-28 | 大连理工大学 | 基于灰自助和未确知有理数的小样本试验数据估计方法 |
| US11188865B2 (en) * | 2018-07-13 | 2021-11-30 | Dimensional Insight Incorporated | Assisted analytics |
| CN109101759B (zh) * | 2018-09-04 | 2023-06-16 | 贵州理工学院 | 一种基于正逆响应面法的参数识别方法 |
| CN112883056B (zh) * | 2021-03-11 | 2023-08-11 | 杭州广立微电子股份有限公司 | 一种半导体测试数据处理方法及装置 |
| CN114019214B (zh) * | 2021-10-21 | 2024-05-28 | 广州市瀚云信息技术有限公司 | 一种直放站的状态监控方法及装置 |
Citations (4)
| Publication number | Priority date | Publication date | Assignee | Title |
|---|---|---|---|---|
| US6303301B1 (en) | 1997-01-13 | 2001-10-16 | Affymetrix, Inc. | Expression monitoring for gene function identification |
| US6551784B2 (en) | 1989-06-07 | 2003-04-22 | Affymetrix Inc | Method of comparing nucleic acid sequences |
| US6571005B1 (en) | 2000-04-21 | 2003-05-27 | The Regents Of The University Of California | Feature extraction and normalization algorithms for high-density oligonucleotide gene expression array data |
| US20050038839A1 (en) | 2003-08-11 | 2005-02-17 | Srinka Ghosh | Method and system for evaluating a set of normalizing features and for iteratively refining a set of normalizing features |
Family Cites Families (21)
| Publication number | Priority date | Publication date | Assignee | Title |
|---|---|---|---|---|
| US4344142A (en) * | 1974-05-23 | 1982-08-10 | Federal-Mogul Corporation | Direct digital control of rubber molding presses |
| US5506117A (en) * | 1989-10-18 | 1996-04-09 | Cytokinetics, Inc. | Biochemical process for growing living cells by measuring the amount of nutrient added to the reaction medium |
| US6321164B1 (en) * | 1995-06-07 | 2001-11-20 | Akzo Nobel N.V. | Method and apparatus for predicting the presence of an abnormal level of one or more proteins in the clotting cascade |
| JP3193658B2 (ja) | 1997-02-19 | 2001-07-30 | インターナショナル・ビジネス・マシーンズ・コーポレ−ション | データ間結合ルール導出方法及び装置、及び直交凸領域切出方法及び装置 |
| US5999639A (en) | 1997-09-04 | 1999-12-07 | Qualia Computing, Inc. | Method and system for automated detection of clustered microcalcifications from digital mammograms |
| ES2231167T3 (es) * | 1999-02-04 | 2005-05-16 | Biomerieux, Inc. | Procedimiento y aparato para predecir la disfuncion hemostatica en una muestra de un paciente. |
| US7016977B1 (en) * | 1999-11-05 | 2006-03-21 | International Business Machines Corporation | Method and system for multilingual web server |
| JP2001331362A (ja) * | 2000-03-17 | 2001-11-30 | Sony Corp | ファイル変換方法、データ変換装置及びファイル表示システム |
| CA2327527A1 (fr) | 2000-12-27 | 2002-06-27 | Geneka Biotechnologie Inc. | Methode pour la normalisation du rapport des intensites de fluorescence de deux echantillons d'arn dans des series d'hybridation |
| US20030207270A1 (en) * | 2001-03-09 | 2003-11-06 | Kung Patrick C. | Phytomics: a genomic-based approach to herbal compositions |
| US7418351B2 (en) | 2002-01-31 | 2008-08-26 | Rosetta Inpharmatics Llc | Methods for analysis of measurement errors in measured signals |
| US7403890B2 (en) * | 2002-05-13 | 2008-07-22 | Roushar Joseph C | Multi-dimensional method and apparatus for automated language interpretation |
| US7424425B2 (en) * | 2002-05-19 | 2008-09-09 | International Business Machines Corporation | Optimization of detection systems using a detection error tradeoff analysis criterion |
| US7512496B2 (en) * | 2002-09-25 | 2009-03-31 | Soheil Shams | Apparatus, method, and computer program product for determining confidence measures and combined confidence measures for assessing the quality of microarrays |
| US8060173B2 (en) * | 2003-08-01 | 2011-11-15 | Dexcom, Inc. | System and methods for processing analyte sensor data |
| US20070026406A1 (en) * | 2003-08-13 | 2007-02-01 | Iconix Pharmaceuticals, Inc. | Apparatus and method for classifying multi-dimensional biological data |
| FR2869692B1 (fr) * | 2004-05-03 | 2006-06-23 | Commissariat Energie Atomique | Procede de correction des spectres bi-parametriques |
| US20090299646A1 (en) * | 2004-07-30 | 2009-12-03 | Soheil Shams | System and method for biological pathway perturbation analysis |
| EP1828408A4 (fr) * | 2004-12-04 | 2008-08-27 | Univ California Los Alamos Nat | Systeme de detection d'interactions proteine-proteine faisant appel a des microdomaines de proteines fluorescentes |
| US7480593B2 (en) * | 2005-08-03 | 2009-01-20 | Suresh Gopalan | Methods and systems for high confidence utilization of datasets |
| JP5382692B2 (ja) * | 2006-07-10 | 2014-01-08 | 学校法人藤田学園 | 抗体の分類法、抗原の同定法、抗体又は抗体セットの取得法、抗体パネルの作成法、並びに抗体又は抗体セット及びその用途 |
-
2006
- 2006-08-02 US US11/497,926 patent/US7480593B2/en not_active Expired - Fee Related
- 2006-08-03 CA CA2697606A patent/CA2697606A1/fr not_active Abandoned
- 2006-08-03 EP EP06789227A patent/EP1987450A4/fr not_active Withdrawn
- 2006-08-03 AU AU2006278618A patent/AU2006278618B2/en not_active Ceased
- 2006-08-03 JP JP2008525162A patent/JP2009503741A/ja active Pending
- 2006-08-03 SG SG2014001739A patent/SG196801A1/en unknown
- 2006-08-03 EP EP13183011.9A patent/EP2677448A2/fr not_active Withdrawn
- 2006-08-03 WO PCT/US2006/030138 patent/WO2007019182A2/fr not_active Ceased
- 2006-08-03 CN CN2006800369518A patent/CN101278291B/zh not_active Expired - Fee Related
- 2006-08-03 CA CA2654064A patent/CA2654064C/fr not_active Expired - Fee Related
-
2008
- 2008-01-31 IL IL189170A patent/IL189170A/en active IP Right Grant
-
2009
- 2009-01-16 US US12/355,195 patent/US8069014B2/en not_active Expired - Fee Related
-
2011
- 2011-10-24 US US13/279,804 patent/US8532959B2/en not_active Expired - Fee Related
- 2011-10-24 US US13/279,514 patent/US8483994B2/en not_active Expired - Fee Related
-
2013
- 2013-06-25 US US13/926,096 patent/US20130289921A1/en active Pending
Patent Citations (4)
| Publication number | Priority date | Publication date | Assignee | Title |
|---|---|---|---|---|
| US6551784B2 (en) | 1989-06-07 | 2003-04-22 | Affymetrix Inc | Method of comparing nucleic acid sequences |
| US6303301B1 (en) | 1997-01-13 | 2001-10-16 | Affymetrix, Inc. | Expression monitoring for gene function identification |
| US6571005B1 (en) | 2000-04-21 | 2003-05-27 | The Regents Of The University Of California | Feature extraction and normalization algorithms for high-density oligonucleotide gene expression array data |
| US20050038839A1 (en) | 2003-08-11 | 2005-02-17 | Srinka Ghosh | Method and system for evaluating a set of normalizing features and for iteratively refining a set of normalizing features |
Non-Patent Citations (1)
| Title |
|---|
| GENOMICS OF CARDIOVASCULAR DEVELOPMENT, ADAPTATION, AND REMODELING SITE. NHLBI PROGRAM FOR GENOMIC APPLICATIONS, 28 May 2004 (2004-05-28), Retrieved from the Internet <URL:littp://www.cardiogenomics.org> |
Also Published As
| Publication number | Publication date |
|---|---|
| IL189170A0 (en) | 2008-08-07 |
| WO2007019182A3 (fr) | 2007-05-31 |
| US7480593B2 (en) | 2009-01-20 |
| AU2006278618A1 (en) | 2007-02-15 |
| JP2009503741A (ja) | 2009-01-29 |
| CA2654064C (fr) | 2010-06-22 |
| AU2006278618B2 (en) | 2012-06-28 |
| US20120095694A1 (en) | 2012-04-19 |
| CA2654064A1 (fr) | 2007-02-15 |
| US20130289921A1 (en) | 2013-10-31 |
| CN101278291B (zh) | 2011-04-13 |
| US20070033158A1 (en) | 2007-02-08 |
| WO2007019182A2 (fr) | 2007-02-15 |
| US8483994B2 (en) | 2013-07-09 |
| US20090177408A1 (en) | 2009-07-09 |
| SG196801A1 (en) | 2014-02-13 |
| EP1987450A4 (fr) | 2010-02-24 |
| EP1987450A2 (fr) | 2008-11-05 |
| CA2697606A1 (fr) | 2007-02-15 |
| IL189170A (en) | 2016-11-30 |
| US8069014B2 (en) | 2011-11-29 |
| US8532959B2 (en) | 2013-09-10 |
| CN101278291A (zh) | 2008-10-01 |
| US20120095695A1 (en) | 2012-04-19 |
Similar Documents
| Publication | Publication Date | Title |
|---|---|---|
| US8483994B2 (en) | Methods and systems for high confidence utilization of datasets | |
| Hanczar et al. | Small-sample precision of ROC-related estimates | |
| Ackermann et al. | A general modular framework for gene set enrichment analysis | |
| US8515681B2 (en) | Classification of sample data | |
| Celton et al. | Comparative analysis of missing value imputation methods to improve clustering and interpretation of microarray experiments | |
| Cordero et al. | Microarray data analysis and mining approaches | |
| Li et al. | Effectively integrating information content and structural relationship to improve the GO-based similarity measure between proteins | |
| Yun et al. | Biclustering for the comprehensive search of correlated gene expression patterns using clustered seed expansion | |
| Oh et al. | Biological impact of missing-value imputation on downstream analyses of gene expression profiles | |
| Bhattacharyya et al. | Robust sparse hyperplane classifiers: application to uncertain molecular profiling data | |
| Kim et al. | Improving identification of differentially expressed genes in microarray studies using information from public databases | |
| US20190316961A1 (en) | Methods and systems for high confidence utilization of datasets | |
| Simon | BRB-ArrayTools Version 4.3 | |
| Holloway et al. | Classifying transcription factor targets and discovering relevant biological features | |
| Motsinger-Reif | The effect of alternative permutation testing strategies on the performance of multifactor dimensionality reduction | |
| US20200357484A1 (en) | Method for simultaneous multivariate feature selection, feature generation, and sample clustering | |
| Akay | Genomics and proteomics engineering in medicine and biology | |
| Ghosh et al. | Rank-statistics based enrichment-site prediction algorithm developed for chromatin immunoprecipitation on chip experiments | |
| Gopalan | ResurfP: a response surface aided parametric test for identifying differentials in GeneChip based oligonucleotide array experiments | |
| Kerr et al. | Edge-weighting of gene expression graphs | |
| Wang et al. | Clustering of time-course gene expression profiles using normal mixture models with AR (1) random effects | |
| Wang et al. | A Classification Method Incorporating Interactions among Variables for High-dimensional Data | |
| Kotoka | Identification of Differentially Expressed Genes When the Distribution of Effect Sizes is Asymmetric in Two Class Experiments | |
| Li et al. | Data-driven smoothness enhanced variance ratio test to unearth responsive genes in 0-time normalized time-course microarray data | |
| Zou | Clustering raw distributions of intensities from Affymetrix gene expression microarrays in order to evaluate statistical preprocessing methods |
Legal Events
| Date | Code | Title | Description |
|---|---|---|---|
| PUAI | Public reference made under article 153(3) epc to a published international application that has entered the european phase |
Free format text: ORIGINAL CODE: 0009012 |
|
| AC | Divisional application: reference to earlier application |
Ref document number: 1987450 Country of ref document: EP Kind code of ref document: P |
|
| AK | Designated contracting states |
Kind code of ref document: A2 Designated state(s): AT BE BG CH CY CZ DE DK EE ES FI FR GB GR HU IE IS IT LI LT LU LV MC NL PL PT RO SE SI SK TR |
|
| RIN1 | Information on inventor provided before grant (corrected) |
Inventor name: GOPALAN, SURESH |
|
| STAA | Information on the status of an ep patent application or granted ep patent |
Free format text: STATUS: THE APPLICATION IS DEEMED TO BE WITHDRAWN |
|
| 18D | Application deemed to be withdrawn |
Effective date: 20150303 |