EP2779089A2 - Systeme und Verfahren zur Segmentierung und Verarbeitung von Gewebebildern und Merkmalsextraktion daraus zur Behandlung, Diagnose oder Vorhersage von Erkrankungen - Google Patents
Systeme und Verfahren zur Segmentierung und Verarbeitung von Gewebebildern und Merkmalsextraktion daraus zur Behandlung, Diagnose oder Vorhersage von Erkrankungen Download PDFInfo
- Publication number
- EP2779089A2 EP2779089A2 EP14160371.2A EP14160371A EP2779089A2 EP 2779089 A2 EP2779089 A2 EP 2779089A2 EP 14160371 A EP14160371 A EP 14160371A EP 2779089 A2 EP2779089 A2 EP 2779089A2
- Authority
- EP
- European Patent Office
- Prior art keywords
- image
- nuclei
- tissue
- segmentation
- ring
- Prior art date
- Legal status (The legal status is an assumption and is not a legal conclusion. Google has not performed a legal analysis and makes no representation as to the accuracy of the status listed.)
- Granted
Links
Images


















Classifications
-
- G—PHYSICS
- G06—COMPUTING OR CALCULATING; COUNTING
- G06V—IMAGE OR VIDEO RECOGNITION OR UNDERSTANDING
- G06V20/00—Scenes; Scene-specific elements
- G06V20/60—Type of objects
- G06V20/69—Microscopic objects, e.g. biological cells or cellular parts
- G06V20/698—Matching; Classification
-
- G—PHYSICS
- G06—COMPUTING OR CALCULATING; COUNTING
- G06T—IMAGE DATA PROCESSING OR GENERATION, IN GENERAL
- G06T5/00—Image enhancement or restoration
- G06T5/90—Dynamic range modification of images or parts thereof
- G06T5/94—Dynamic range modification of images or parts thereof based on local image properties, e.g. for local contrast enhancement
-
- G—PHYSICS
- G06—COMPUTING OR CALCULATING; COUNTING
- G06T—IMAGE DATA PROCESSING OR GENERATION, IN GENERAL
- G06T7/00—Image analysis
- G06T7/0002—Inspection of images, e.g. flaw detection
- G06T7/0012—Biomedical image inspection
-
- G—PHYSICS
- G06—COMPUTING OR CALCULATING; COUNTING
- G06T—IMAGE DATA PROCESSING OR GENERATION, IN GENERAL
- G06T7/00—Image analysis
- G06T7/10—Segmentation; Edge detection
- G06T7/11—Region-based segmentation
-
- G—PHYSICS
- G06—COMPUTING OR CALCULATING; COUNTING
- G06T—IMAGE DATA PROCESSING OR GENERATION, IN GENERAL
- G06T7/00—Image analysis
- G06T7/10—Segmentation; Edge detection
- G06T7/155—Segmentation; Edge detection involving morphological operators
-
- G—PHYSICS
- G06—COMPUTING OR CALCULATING; COUNTING
- G06T—IMAGE DATA PROCESSING OR GENERATION, IN GENERAL
- G06T7/00—Image analysis
- G06T7/40—Analysis of texture
- G06T7/41—Analysis of texture based on statistical description of texture
- G06T7/45—Analysis of texture based on statistical description of texture using co-occurrence matrix computation
-
- G—PHYSICS
- G06—COMPUTING OR CALCULATING; COUNTING
- G06T—IMAGE DATA PROCESSING OR GENERATION, IN GENERAL
- G06T2207/00—Indexing scheme for image analysis or image enhancement
- G06T2207/10—Image acquisition modality
- G06T2207/10056—Microscopic image
-
- G—PHYSICS
- G06—COMPUTING OR CALCULATING; COUNTING
- G06T—IMAGE DATA PROCESSING OR GENERATION, IN GENERAL
- G06T2207/00—Indexing scheme for image analysis or image enhancement
- G06T2207/20—Special algorithmic details
- G06T2207/20036—Morphological image processing
- G06T2207/20041—Distance transform
-
- G—PHYSICS
- G06—COMPUTING OR CALCULATING; COUNTING
- G06T—IMAGE DATA PROCESSING OR GENERATION, IN GENERAL
- G06T2207/00—Indexing scheme for image analysis or image enhancement
- G06T2207/20—Special algorithmic details
- G06T2207/20212—Image combination
-
- G—PHYSICS
- G06—COMPUTING OR CALCULATING; COUNTING
- G06T—IMAGE DATA PROCESSING OR GENERATION, IN GENERAL
- G06T2207/00—Indexing scheme for image analysis or image enhancement
- G06T2207/30—Subject of image; Context of image processing
- G06T2207/30004—Biomedical image processing
- G06T2207/30024—Cell structures in vitro; Tissue sections in vitro
Definitions
- Embodiments of the present invention relate to systems and methods for segmentation and processing of images (e.g., tissue images of nuclei and/or cytoplasm) and feature extraction from the same for, for example, treating, diagnosing, and/or predicting the occurrence (e.g., recurrence) of one or more medical conditions (e.g., cancer or other types of disease).
- images e.g., tissue images of nuclei and/or cytoplasm
- feature extraction from the same for, for example, treating, diagnosing, and/or predicting the occurrence (e.g., recurrence) of one or more medical conditions (e.g., cancer or other types of disease).
- tissue images are prone to misclassification of objects in tissue (e.g., epithelial and stromal nuclei) and may produce irregular nuclei, incorrectly identify cytoplasm boundaries, and result in over and under-segmentation of clustered nuclei. These problems are exacerbated by variations in image acquisition conditions and image artifacts.
- tissue e.g., epithelial and stromal nuclei
- tissue architecture may typically consist of isolated or touching gland rings surrounded by fibromuscular tissue (stroma). Each gland ring may include rows of epithelial cells surrounding a duct (lumen). The connected glandular cytoplasm (e.g., epithelial unit) may include a gland ring.
- epithelial cells replicate in an uncontrolled way, disrupting regular ring structures.
- epithelial units fuse together creating chains of gland rings, or dense cribriform sheets of rings, all in the same epithelial unit, while lumens shrink or disappear.
- this can lead to touching/fused epithelial cells/units.
- Existing segmentation systems also have difficulty performing segmentation based on lumens, which have shrunk or disappeared. The same segmentation difficulty arises for Gleason grade 5, where the tumor loses these structures and becomes undifferentiated sheets of epithelial cells and/or epithelial fragments.
- Some embodiments of the present invention are directed to apparatus, methods, and computer-readable media for segmentation and processing of tissue images (e.g., images of nuclei and/or cytoplasm) and feature extraction from the same.
- Tissue images processed by various embodiments described herein may be generated by Hematoxylin and Eosin (H&E) staining, immunofluorescence (IF) detection, immunohistochemistry (IHC), similar and/or related staining processes, and/or other processes.
- Predictive features described herein may be provided for use in, for example, one or more predictive models for treating, diagnosing, and/or predicting the occurrence (e.g., recurrence) of one or more medical conditions such as, for example, cancer or other types of disease.
- an apparatus, method, and computer-readable medium are provided for reducing non-uniform variations in intensity in a tissue image.
- Such non-uniform variations may result from, for example, variations in image acquisition conditions.
- the image may be an image of nuclei in tissue labeled with nuclear counterstain 4'-6-diamidino-2-phenylindole (DAPI).
- the image may be an image of cytoplasm in tissue labeled with biomarker cytokeratin 18 (CK18).
- One or more computers may estimate an inverse illumination field of the tissue image, and generate a modified image based on the inverse illumination field of the tissue image.
- the modified image may be subject to additional computer processing including, for example, segmentation, classification of cellular and/or tissue components, and/or feature extraction.
- generating a modified image based on the inverse illumination field includes multiplying the tissue image by its inverse illumination field.
- estimating the inverse illumination field of the tissue image includes one or more of subtracting background from the tissue image (e.g., using a top hat filter), performing blob detection (e.g., using an Eigenvalues-of-Hessian matrix method (EoH)), identifying local maxima, dividing the tissue image into a plurality of components around the local maxima, setting an intensity inside each component of the plurality of components, for example, to an average intensity, and estimating the inverse illumination field by filtering (e.g., using a Gaussian filter).
- contrast enhancement may be applied to the image, for example, subsequent to subtracting background from the tissue image.
- dividing the image into a plurality of components around the local maxima may include one or more of producing a distance map based on the local maxima and performing a watershed transformation using the distance map.
- estimating the inverse illumination field of the tissue image includes partitioning the tissue image into blocks and, for each block, calculating a statistic (e.g., maximum, minimum, mean, median, standard deviation, and variance).
- the statistic for all blocks may be used to generate a new image, and the new image may be resampled to create an illumination field image.
- an apparatus, method, and computer-readable medium are provided for binarization of an image of tissue (e.g., DAPI image or CK18 image).
- an adaptive process may be provided that identifies an optimal binarization procedure for each image based on one or more intensity patterns, for example, background texture in the image.
- An initial binarization of the tissue image may be performed (e.g., using minimum error thresholding) to extract a background region of the image, and an intensity pattern of the background region, for example, texture of the background region may be evaluated.
- An additional or final binarization of the tissue image may be performed based on the evaluation.
- At least one of a filter size and a threshold cut-off point for use in the additional binarization maybe selected based on the evaluation.
- at least one of the filter size and the threshold cut-off point for the additional binarization are different than a filter size and a threshold cut-off point used in the initial binarization of the tissue image.
- evaluating the intensity pattern(s) of the background region of the tissue image includes evaluating a contrast of the background region.
- evaluating the texture includes evaluating an energy of the background region.
- evaluating the texture includes evaluating a contrast and an energy of the background region of the tissue image to produce a value indicative of the contrast and a value indicative of the energy.
- an aggregate value representative of the texture may be computed as, for example, (1 - the value of the contrast) multiplied by the value of the energy.
- the foregoing binarization procedure may be performed on a tissue image already subject to processing to reduce non-uniform variations in intensity in the image.
- an apparatus, method, and computer-readable medium are provided for processing a segmented image of cytoplasm (e.g., segmented CK18 image).
- this processing may be performed on a tissue image already subject to at least one of processing to reduce non-uniform variations in intensity, and binarization.
- gaps on boundaries of the segmented image of cytoplasm e.g., scalloped edges overlapping with nuclei objects
- holes caused by the gaps may be filled using one or more morphological operations (e.g., dilation).
- gaps inside the segmented image of cytoplasm and/or on its boundary may be identified and removed (e.g., using a gray-scale morphological closing operation).
- cytoplasm holes having a certain size e.g., less than or equal to an average nucleus size for the image
- holes that are greater than that certain size and at least partially filled by a single nucleus e.g., holes smaller than four times the average nucleus size and at least 50% filled by a single nucleus
- an apparatus, method, and computer-readable medium are provided for classifying nuclei into one or more (e.g., three or more) classes (e.g., epithelial nuclei, stromal nuclei, and unclassified/undefined) depending on, for example, distance from and/or overlap of the nuclei to a cytoplasm border.
- one or more classes e.g., epithelial nuclei, stromal nuclei, and unclassified/undefined
- an apparatus, method, and computer-readable medium are provided for removing artifacts from a segmented image of nuclei.
- this processing may be performed on a tissue image already subject to at least one of processing to reduce non-uniform variations in intensity, and binarization.
- a segmented (e.g., binarized) image of nuclei may be received.
- Lumen artifacts may be detected and removed from the segmented image in order to produce an output nuclei image.
- detecting and removing artifacts includes determining whether an object within the segmented image of nuclei is an artifact based on at least one of a morphological characteristic and a texture characteristic of at least one of the object and a component connected to the object.
- the morphological characteristic(s) are selected from the group consisting of a size of the connected component, nucleus size, average nucleus size, percentage relative to tumor area, percentage of object area inside lumen, eccentricity, nuclei elongation, and/or other morphological characteristics.
- the texture characteristic(s) are selected from the group consisting of average nuclei intensity (e.g., DAPI intensity), standard deviation of nuclei intensity, and/or other texture characteristics.
- an apparatus, method, and computer-readable medium are provided for separating epithelial units within a segmented tissue image (e.g., cytoplasm binary mask).
- Each epithelial unit may include, consist of, or consist essentially of cytoplasm contained within one or more related epithelial cells that are confined by stroma.
- this processing may be performed on a tissue image already subject to at least one of processing to reduce non-uniform variations in intensity, binarization, and post-processing (e.g., to remove artifacts).
- a propagation process is performed starting from marker regions within each epithelial unit, and proceeding towards touching boundaries of the epithelial units.
- the marker regions may be created from, for example, a segmented image of epithelial nuclei and/or a segmented image of lumens.
- an image resulting from epithelial unit separation may be used, for example, within subsequent gland ring segmentation (e.g., to identify whether gland rings are part of the same epithelial unit, or different epithelial units).
- epithelial unit separation may be achieved by, for example: receiving a segmented nuclei image (e.g., DAPI) binary mask) and variably dilating it using morphological dilation.
- a complement image of the dilated nuclei image may be generated and marker centers may be extracted from the complement image.
- marker centers may be extracted from the complement image.
- a cytoplasm (e.g., CK18) image, and a segmented cytoplasm image e.g., cytoplasm binary mask
- a transform (e.g., watershed transform) may be applied to the new image to obtain lines (e.g., watershed lines) of separations within a resulting image, and the resulting image may be segmented (e.g., binarized). For example, a segmented cytoplasm binary mask and watershed binarized image may be merged, and missing epithelial units from the segmented cytoplasm binary mask may be identified and retained. An image resulting from the identifying and retaining procedure may be labeled, and separation boundaries may be extracted from the labeled image. In some embodiments, one or more of these processing stages, and/or other processing stages described in the present application, arc optional and can be omitted and/or replaced by other stages.
- the foregoing process may be a center initialized process.
- a boundary initialized process e.g., same or similar to the process shown and described in connection with FIG. 12C .
- These two processes have complementary effects, and between the two of them may pick up most if not all of the epithelial unit separations. In some embodiments of the present invention, these two processes could eliminate the need to use a watershed transform for epithelial unit separation.
- an apparatus, method, and computer-readable medium are provided for segmenting gland units from a nuclei image.
- a segmented epithelial nuclei binary mask may be received.
- the nuclei binary mask may be variably dilated using morphological dilation.
- a complement of the dilated nuclei binary mask may be generated. Marker centers may then be extracted from the complement of the dilated mask.
- an apparatus, method, and computer-readable medium are provided for refining an epithelial unit segmentation within a segmented tissue image.
- this processing may be performed on a tissue image already subject to at least one of (i) processing to reduce non-uniform variations in intensity, (ii) binarization, (iii) post-processing (e.g., to remove artifacts), and (iv) initial gland ring segmentation.
- Intensity may be computed on individual separations of a cytoplasm (e.g., CK18) intensity image.
- Standard deviation may also be computed corresponding to the intensity computations, and on a standard deviation of intensity on individual separations of a gradient of the cytoplasm image. Separations may be identified that touch any nuclei marker centers. Separation boundaries may be eliminated based on a threshold criterion, and refined separation boundaries may be extracted.
- an apparatus, method, and computer-readable medium are provided for enhancing ridges formed by cytoplasm membranes around an outer boundary of touching or almost touching cytoplasm within a tissue image.
- this processing may be performed on a tissue image already subject to at least one of processing to reduce non-uniform variations in intensity, binarization, post-processing (e.g., to remove artifacts), and gland ring segmentation.
- a propagation process may be performed, starting from higher contrast edges of a cytoplasm mask and proceeding along lower contrast ridges and edges between epithelial units.
- enhancement of ridges formed by cytoplasm membranes may be achieved by, for example: generating a speed image that includes cytoplasm edge and ridge strength.
- Fast marching edge strength propagation may be performed using the speed image (e.g., initialized from the cytoplasm borders) to create a distance map.
- a segmentation (e.g., watershed segmentation) of an inversion of the distance map may be performed.
- an apparatus, method, and computer-readable medium are provided for segmenting and/or classifying gland rings within a tissue image.
- geometric clustering of nuclei e.g., based on triangulation or tessellation of epithelial nuclei coordinates
- triangulation is performed on the tissue image with epithelial nuclei centers as vertices, and selected regions of the triangles are merged.
- epithelial regions are classified as gland rings or glandular non-rings.
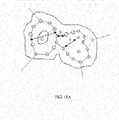
- segmenting gland rings may be achieved by, for example: triangulation (e.g., Delaunay triangulation) on a tissue image with epithelial nuclei centers as vertices. Selected regions of the triangles may be merged. Polygonal areas may then be classified as gland rings or glandular non-rings (e.g., and stromal and undefined areas). In some embodiments of the present invention, the classification of the polygonal areas as gland rings or glandular non-rings may be based on one or more of a size, stromal area, lumen area, ring density, and cytoplasm connectivity around the ring.
- the process may additionally include assigning a depth to each triangle (e.g., equal or substantially equal to a length of a longest side of that triangle), sorting the triangles by depth, and/or performing the merging starting with the deepest triangles.
- regions may be merged if a length of a common side between triangles is at least, for example, 90% of a depth of a neighbor and/or if both regions touch the same one or more epithelial units.
- a process that includes a watershed transform e.g., same or similar to the process used for epithelial unit separation but, for example, having smaller markers may be used to separate gland rings.
- an apparatus, method, and computer-readable medium are provided for localizing and quantifying biomarker signal within a tissue image (e.g., an image of a fine needle aspirate, biopsy sample, whole tissue section, and/or tissue micro array (TMA)).
- a tissue image e.g., an image of a fine needle aspirate, biopsy sample, whole tissue section, and/or tissue micro array (TMA)
- One or more bright objects having a size below a threshold may be removed from an image of tissue as being indicative of speckle noise.
- a threshold specific to the image, may be determined and applied to distinguish between background and real signal intensity for a plurality of objects (e.g., nuclei objects, cytoplasm objects, and/or glandular objects) remaining in the image, thereby producing a thresholded image.
- a histogram corresponding to the thresholded image may be generated.
- one or more predictive features may be extracted from the thresholded image.
- the threshold in addition to varying from one image to another, the threshold may
- an apparatus, method, and computer-readable medium are provided for predicting occurrence of a medical condition (e.g., prostate cancer).
- a dataset for a patient may be evaluated with a computer-implemented model predictive of the medical condition, where the model is based on one or more ring features measured from one or more tissue images, thereby evaluating the medical condition in the patient.
- the one or more ring features may be selected from the group of gland ring features consisting of statistical combinations over the image of individual ring metrics such as outer diameter of ring, inner diameter of ring, border gap, lumen or clearing diameter, border density, lumen ratio, proportion of border touching inner clearing, proportion of border touching stroma, ratio of border less than a predefined number of pixels from stroma, mean distance of border pixels from stroma, and width of epithelial padding between ring and stroma, and/or the individual ring metrics themselves.
- the ring metrics may be combined and/or averaged over the whole image to create image features.
- these image features may be parameterized in, for example, any one or more of four ways: by statistic (two alternatives), by region type (8 alternatives), by weight (8+ alternatives) and/or by variable (20+ alternatives), creating in total more than 2x8x8x20 possible features according to various embodiments of the present invention, as shown for example in Tables 2-8 herein, Table 2 shows basic ring measurements from which statistical combination image features may be constructed according to some embodiments of the present invention. In these tables, a consistent feature naming convention is formed as "Statisitic_Weight_RegionType_Variable.”
- the computer-implemented predictive model may produce a value indicative of the medical condition in the patient.
- the model may be based on at least one additional feature selected from the group of features consisting of one or more clinical features, one or more molecular features, and/or one or more computer-generated morphometric feature(s) generated from one or more tissue image(s).
- an apparatus, method, and computer-readable medium for evaluating a dataset for a patient with a model predictive of the medical condition, where the model is based on one or more features selected from the group of features consisting of (i) a feature generated based upon a comparison of histograms corresponding to compartments or sub-compartments of cellular objects and (ii) a feature generated from an intensity index corresponding to image signal intensity.
- an apparatus, method, and computer-readable medium for evaluating a dataset for a patient with a model predictive of the medical condition, where the model is based on one or more texture features selected from the group of features consisting of (i) homogeneity and (ii) correlation, thereby evaluating the medical condition in the patient.
- an apparatus, method, and computer-readable medium are provided for extracting one or more texture features from an image of tissue.
- Objects e.g., nuclei
- Sub-objects e.g., epithelial nuclei
- One or more texture features may be computed for each epithelial nucleus (e.g., homogeneity and/or correlation).
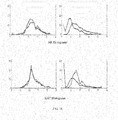
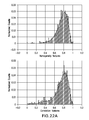
- a histogram may be generated based on the one or more texture features, and a polynomial may be fit to the histogram.
- the histogram corresponding to the first type of sub-objects may be divided by a second histogram corresponding to a second type of sub-objects (e.g., stromal nuclei) to obtain a new histogram, a new polynomial may be fit to the new histogram.
- features may be extracted from one or more of the polynomials.
- the first and second histograms e.g., epithelial and stromal histograms
- a histogram normalization process may be used, for example, as an alternative or in addition to polynomial fitting.
- an apparatus, method, and computer-readable medium are provided for assessing the statistical stability of a segmentation image or process.
- a medical or non-medical image e.g., a tissue image, cytology image, radiograph, computed tomography image, ultrasound image, brightfield and/or darkfield image of semiconductor material, geospatial image, or astronomical image
- a medical or non-medical image e.g., a tissue image, cytology image, radiograph, computed tomography image, ultrasound image, brightfield and/or darkfield image of semiconductor material, geospatial image, or astronomical image
- Segmentation may be performed on the image and the one or more variant images to produce segmented versions of the image and the one or more variant images.
- One or more metrics of similarity may be computed for the segmented versions of the image and the one or more variant images in order to perform one or more of the following functions: (i) assess the stability of the segmentation; (ii) assess the segmentation quality of an image; (iii) rank an image by its segmentation quality; (iv) compare an image to other images; (v) determine if an image should be included or excluded from other processes (e.g., feature extraction and analysis); and/or (vi) determine if an image segmentation output meets one or more performance quality criteria.
- extensions of one or both of the Dice or Jaccard similarity metrics may be computed and used to assess segmentation stability.
- an apparatus, method, and computer-readable medium are provided for assessing the partition stability of a segmentation image or process. Segmentation may be performed on an image. One or more additional partitions around the segmentation boundaries of the image may be created (e.g., by eroding or dilating the segmentation boundaries).
- One or more intensity pattern metrics, or combination(s) of intensity pattern metrics may be calculated from one or more partitions in order to perform one or more of the following functions: (i) assess the stability of the segmentation process; (ii) assess the segmentation quality of an image; (iii) rank an image by its segmentation quality; (iv) compare an image to other images; (v) determine if an image should be included or excluded from other processes; and/or (vi) determine if an image segmentation output meets one or more performance quality criteria. For example, in some embodiments, the energy of the dilated background may be compared to the energy of the original background to assess segmentation stability.
- FIG. 1 is a block diagram of an image analysis system 100 according to some embodiments of the present invention.
- System 100 includes image acquisition module 102, preprocessing module 104, segmentation module 106, postprocessing module 108, and feature extraction module 110.
- image acquisition module 102 may include a multispectral camera (e.g., Nuance multispectral camera) at, for example, 20x by 10x resolution.
- Modules 102-110 are shown in FIG. 1 as being serially coupled.
- any other suitable system arrangements may be used including, for example, coupling any one or more of modules 102-110 to another any one more of modules 102-110 or causing all of modules 102-110 to be coupled (e.g., directly or indirectly to allow for communication) to each other.
- modules 102-108 may include any suitable hardware (e.g., one or more computers or processors), software, firmware, or combination thereof for performing the respective functions described herein in connection with, for example, one or more of FIGS. 2A -26D.
- preprocessing module 104 may be an apparatus configured to perform any one or more (e.g., all) of the functions described in connection with FIGS. 2A-4 including, for example, correcting non-uniform variations in intensity in tissue images.
- segmentation module 106 may be an apparatus configured to perform any one or more (e.g., all) of the functions described in connection with FIGS. 5-6E including, for example, binarization of tissue images.
- postprocessing module 108 may be an apparatus configured to perform any one or more (e.g., all) of the functions described in connection with FIGS. 7-11D including, for example, separating touching or connected components, filling holes, and/or removing artifacts within the tissue images (e.g., tissue images already subjected to a segmentation process).
- postprocessing module 108 may be configured to perform any one or more (e.g., all) of the functions described in connection with FIGS. 12A-13 relating to, for example, additional segmentation of tissue images into epithelial units and/or FIG. 14 relating to, for example, additional segmentation of tissue images into gland rings.
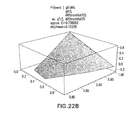
- feature extraction module 110 may be configured to perform any one or more (e.g., all) of the functions described in connection with FIGS. 15-22B including, for example, extracting gland ring features, texture features (e.g., homogeneity and/or correlation), and/or other features.
- module 102 and/or another suitable apparatus e.g., including hardware, software, firmware, or combination thereof
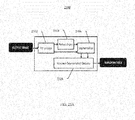
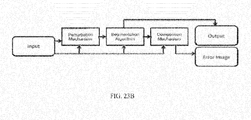
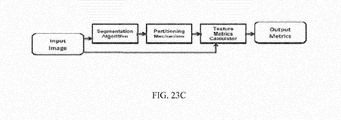
- module 102 and/or another suitable apparatus may be configured to perform any one or more (e.g., all) of the functions described in connection with FIG. 23A-D including, for example, assessing the performance of one or more segmentation algorithms without using ground truth images.
- Modules 102-110 are shown in FIG. 1 as being separate modules (e.g., utilizing different hardware, software, firmware, or a combination thereof). In other embodiments of the present invention, any other suitable system arrangements may be used including, for example, implementing any two or more of modules 102-110 using at least partially the same hardware, software, firmware, and/or combination thereof.
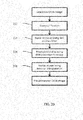
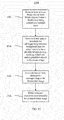
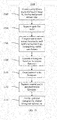
- FIG. 2A is a flowchart 200 of illustrative stages involved in pre-processing an image of tissue according to some embodiments of the present invention.
- Process 200 may be utilized to correct for non-uniform variations in intensity due to, for example, the history of the underlying tissue (e.g., variations regarding how such tissue was initially collected, processed, or subsequently handled) and/or image acquisition conditions.
- process 200 may be performed by pre-processing module 104 ( FIG. 1 ) or other suitable computing equipment.
- Signal intensity in a tissue image is often used as a criterion to determine whether a given portion of the image is "positive"' signal or background signal. For example, when the intensity of a given portion (e.g., one or more pixels) of the image exceeds a threshold value, the signal may be deemed a positive signal. Portions of the image having an intensity below the threshold may be deemed background signal. Positive signal may be included in subsequent processing of the tissue image including, for example, segmentation and classification of the positive signal into cellular and/or tissue objects and/or feature extraction. Background signal, on the other hand, may be ignored in subsequent processing. Non-uniform variations in intensity can result in a failure, for example, to properly distinguish positive signal from background signal and can lead to segmentation errors, misclassification of cellular and/or tissue objects, and incorrect feature extraction.
- multispectral microscopy for example, multiple proteins (antigens) in a tissue specimen are simultaneously labeled with different fluorescent dyes conjugated to antibodies specific to each particular protein. Each dye has a distinct emission spectrum and binds to its target protein within a tissue compartment.
- the labeled tissue is imaged under an excitation light source using a microscope fitted with one or more relevant filters and a multispectral camera.
- the resulting multispectral image (e.g., image cube) is then subjected to spectral unmixing to separate the overlapping spectra of the fluorescent labels.
- the unmixed images have multiple components, where each component (e.g., image layer) represents the expression level of a protein-antigen in the tissue. For each image, the presence or absence of a positive signal within any given region of the image may be determined based on the intensity of the signal in that region.
- process 200 may include, consist of, or consist essentially of estimating the inverse illumination field of a tissue image at stage 202, and generating a corrected image at stage 204 based on (e.g., based at least in part on) the estimated inverse illumination field (e.g., multiplying the tissue image by the inverse illumination field to obtain a corrected image).
- the intensity non-uniformity in the tissue image input to stage 202 may be corrected or substantially improved by process 200.
- the output of stage 204 may be a corrected or substantially improved image having fewer (e.g., none) non-uniform intensity variations than the tissue image input to stage 202.
- images resulting from process 200 may be subsequently processed at stage 206 (e.g., subject to segmentation, classification of cellular and/or tissue objections, and/or feature extraction).
- stage 206 e.g., subject to segmentation, classification of cellular and/or tissue objections, and/or feature extraction.
- the operation of stages 202-204 may allow for improved results (e.g., fewer errors) in such subsequent processing.
- process 200 may be used to correct for intensity non-uniformity in a tissue image that includes primarily nuclei.
- the tissue image input to process 200 may be generated, for example, by imaging tissue that is labeled with the nuclear counterstain 4'-6-diamidino-2-phenylindole (DAPI). Such imaging may be performed by image acquisition module 102.
- DAPI is a fluorescent dye that has a distinct emission spectrum.
- DAPI may be used alone or in combination with one or more additional fluorescent dyes such as, for example, the biomarker cytokeratin 18 (CK18) that binds to cytoplasm.
- CK18 biomarker cytokeratin 18
- process 200 may be utilized to correct for non-uniform intensity variations in other types of images including, for example, images that include primarily cytoplasm (e.g., generated by imaging tissue labeled with CK18), images generated by imaging tissue labeled with other biomarker(s), and/or images that include other tissue or cellular components or a combination of tissue and/or cellular components.
- images that include primarily cytoplasm e.g., generated by imaging tissue labeled with CK18
- images generated by imaging tissue labeled with other biomarker(s) e.g., generated by imaging tissue labeled with other biomarker(s)
- images that include other tissue or cellular components or a combination of tissue and/or cellular components e.g., images that include primarily cytoplasm (e.g., generated by imaging tissue labeled with CK18), images generated by imaging tissue labeled with other biomarker(s), and/or images that include other tissue or cellular components or a combination of tissue and/or cellular components.
- FIG. 2B is a flowchart of illustrative substages involved in process 200 ( FIG. 2A ) according to some embodiments of the present invention.
- estimating the inverse illumination field of the tissue image at stage 202 ( FIG. 2A ) may include top-hat filtering, Eigenvalues-of-Hessian blob detection, and/or a distance transform.
- Suitable examples of top-hat filtering, Eigenvalues-of-Hessian blob detection, and distance transformation according to some embodiments of the present invention are described in Gonzalez R. C and Woods R. E., Digital Image Processing, Second Edition, Prentice-Hall Inc, 2002 , which is hereby incorporated by reference herein in its entirety.
- tissue background in a tissue image is subtracted from the image using, for example, a top hat filter.
- tissue background may correspond to a gray-level in the tissue image, which is in contrast to brighter regions of the tissue image that represent tissue foreground (e.g., nuclei and/or cytoplasm).
- the top hat filter may remove smooth regions that are larger than most, if not all, tissue and/or cellular components of interest in the image (e.g., nuclei clusters, or cytoplasm clusters when, for example, stage 208 is applied to CK18 images).
- a filter size e.g., 30 pixels
- nuclei and/or cytoplasm clusters have a size range from three to five small nuclei clumps (e.g., occupying roughly 100-200 pixels) to 10-30 nuclei large clumps (e.g., occupying roughly 500-2000 pixels).
- contrast enhancement is applied to the filtered image resulting from stage 208.
- contrast enhancement stretches the image (e.g., some or all pixels in the image), for example, to fill the full range of intensity values.
- 255 is replaced by 65535.
- stage 210 may be optional and may be omitted from process 200. In other embodiments, stage 210 may be utilized, for example, as necessitated by the top-hat filtering of stage 208 and/or low contrast present in the original tissue image that serves as input to process 200.
- blob detection e.g., nuclei detection
- stage 212 blob detection is performed on the image resulting from stage 210, or from stage 208 if stage 210 is not utilized.
- detection may be performed using an Eigenvalues-of-Hessian matrix method (EoH).
- EuH Eigenvalues-of-Hessian matrix method
- the present inventors have determined that such a detection method can detect both bright and dim components of the types (e.g., both bright and dim nuclei) that may be present in the tissue images evaluated by process 200 according to some embodiments of the present invention. Illustrative substages involved in stage 212 are described below in connection with FIG. 2C .
- stage 214 local maxima are extracted from (identified in) the image resulting from stage 212.
- stage 212 generates a blob image, which may be subsequently thresholded (e.g., as shown in FIG. 3D ) in order to identify the local maxima.
- the local maxima are the pixels that have the highest intensity value in their respective local regions. For example, for the image, they may represent a rough estimate of the average maximum intensity in each region.
- the intensity inverse illumination field is obtained by processing the local maxima points.
- an inverse Euclidean distance transform is computed starting from the local maxima points to produce a distance map.
- a watershed transformation is performed using the distance map from stage 216 as input.
- the watershed transformation divides the image into small components or cells around the local maxima (e.g., local maxima of the nuclei).
- a suitable example of a watershed transformation process according to some embodiments of the present invention is described in above-incorporated Gonzalez R. C and Woods R. E., Digital Image Processing, Second Edition, Prentice-Hall Inc, 2002 .
- the intensity inside each component or cell is set to its average intensity at stage 220 ("field estimation").
- a first estimate of the intensity field is obtained by, for example, smoothing the image resulting from stage 220 using a Gaussian filter.
- process 200 includes an additional stage (e.g., after stage 224) of enhancing the separation between clustered components (e.g., nuclei), for example, along the thin dark ridges that separate them using a morphological top-hat transform on the intensity corrected nuclei image.
- this top-hat transform may be the same as, or similar to, the top-hat filter described above in connection with stage 208 (e.g., having a filter size of 30 pixels).
- FIG. 2C is a flowchart of illustrative sub-stages involved in the blob detection of stage 212 ( FIG. 2B ) according to some embodiments of the present invention.
- an EoH matrix is used to compute a shape index at each point.
- the blobs are defined as the points for which ⁇ / 4 ⁇ ⁇ ( x, y ) ⁇ 3 ⁇ / 4 although other values could be employed in other embodiments of the present invention.
- FIG. 2D describes illustrative stages involved in correcting for non-uniform intensity variations in, for example, a cytoplasm (e.g., gray-level GK18) image according to some embodiments of the present invention.
- the process of FIG. 2D may be a form of block-based non-uniformity correction.
- the process of FIG. 2D may be an alternative to the process shown in FIGS. 2A-2C .
- the process of FIG. 2D may utilize background averaging and/or background sampling.
- the image may be contrasted by, for example, stretching a bottom portion (e.g., bottom 10%) and a top portion (e.g., top 10%) of all pixel values.
- this process may be the same or similar to the contrast enhancement process described above in connection with stage 210.
- noise e.g., salt and pepper noise
- block processing may be used to enhance dark pixels in the image.
- a 4x4 block may be used with a maximum function that replaces the maximum pixel value in each 4x4 neighborhood.
- the image may be resized back to its original size or similar or other size using, for example, bilinear interpolation.
- the result of the FIG. 2D process may be an image that has been adjusted for non-uniform variations.
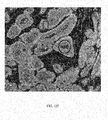
- FIG. 3 shows illustrative examples of images resulting from tissue image processing according to FIGS. 2A-2C according to some embodiments of the present invention.
- Image A is the original, uncorrected DAPI image of nuclei present in tissue that served as an input to process 200.
- Image B is the modified image that resulted from top-hat filtering at stage 208.
- Image C is the modified image resulting from contrast enhancement at stage 210.
- Image D is the modified image resulting from EoH blob detection and image thresholding at stages 212 and 214.
- Image E is the estimated inverse illumination field resulting from stage 224.
- image F is the intensity corrected image resulting from multiplying the original image A by image E representing the estimated inverse illumination field.
- FIG. 4 shows additional illustrative examples of images resulting from tissue image processing according to FIGS. 2A-2C according to some embodiments of the present invention.
- Image A is the original, uncorrected DAPI image of nuclei present in tissue that served as an input to process 200.
- Image B is the estimated inverse illumination field resulting from stage 224.
- image C is the intensity corrected image resulting from multiplying the original image A by image B representing the estimated inverse illumination field.
- FIG. 5 is a flowchart 500 of illustrative stages involved in binarization of an image of tissue according to some embodiments of the present invention.
- Process 300 may be utilized, for example, to extract from an image of nuclei (e.g., DAPI image resulting from spectral detection) the portions of the image corresponding to tissue foreground or positive signal (i.e., nuclei).
- process 500 may be performed by segmentation module 106 ( FIG. 1 ) or other suitable computing equipment.
- process 500 may be performed on a tissue image that has already been preprocessed according to process 200 ( FIGS. 2A-2C ) to remove non-uniform intensity variations.
- an image of tissue is received.
- the image is binarized using minimum error thresholding.
- minimum error thresholding may include a clustering-based approach that assumes that the histogram of signal intensity in the image is bimodal in order to estimate the Poisson mixture parameters (e.g., assuming that a DAPI image resulting from process 200 ( FIGS. 2A-2C ) has a representative histogram that includes of a mixture of two Poisson distributions).
- stage 504 may include using the minimum error thresholding method described in Al-Kofahi et al., "Improved automatic detection and segmentation of cell nuclei in histopathology images," IEEE Transactions on Biomedical Engineering, 57(4), 2010 , which is hereby incorporated by reference herein in its entirety, or another suitable process.
- process 500 may result in the identification of congruent regions (e.g., of nuclei) as well as fragments (e.g., of nuclei) that do not belong to any region.
- fragments smaller than, for example, 30 pixels in area may be removed.
- the resulting image may then be labeled using a relabeled components method.
- k , i 1 , 2 , ... , I max where P k is the prior probability of the k th component, p ( i
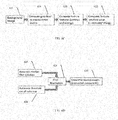
- FIG. 6A is another flowchart 600 of illustrative stages involved in binarization of an image of tissue according to some embodiments of the present invention.
- Process 600 may be utilized, for example, to extract from an image of cytoplasm (e.g., CK18 image resulting from spectral detection) the portions of the image corresponding to tissue foreground or positive signal (i.e., cytoplasm).
- process 600 may adapt the processing performed (e.g., the parameters of a minimum error threshold process) based on background texture in the image (e.g., non-epithelial background texture).
- background texture e.g., non-epithelial background texture
- process 600 may be performed by segmentation module 106 ( FIG. 1 ) or other suitable computing equipment.
- process 600 may be performed on a tissue image that has already been preprocessed according to process 200 ( FIGS. 2A-2C ) to remove non-uniform intensity variations.
- an image of tissue (e.g., CK18 image of cytoplasm obtained by spectral imaging) is received.
- the image is subjected to initial segmentation.
- the background texture in the image is evaluated.
- the image is subjected to an additional or final segmentation.
- FIG. 6B is a flowchart of illustrative substages involved in initial segmentation 604 within process 600 ( FIG. 6A ) according to some embodiments of the present invention.
- a filter e.g., average size 10 x 10 pixel median filter
- filter size according to process 600 may vary between, for example, 2 to 18, with the smallest value of the median filter being 2x2 and the largest being 18x18. With values of 2x2 through 18x18 in this example, the average size median filter may be 10x10.
- the resulting image is binarized using, for example, the minimum error threshold method described above or another suitable process.
- the threshold cut-off may be, for example, 0.5*Otsu threshold.
- the threshold cut-off may refer to the pixel value at which the process converts the intensity image to a binary image.
- the 0.5*Otsu threshold may refer to a cut-off value determined by computing half the value of the threshold determined by the Otsu method, which chooses a threshold to minimize the intra-class variance of black and white pixels.
- the complement of the binarized image is then multiplied with a normalized version of the original image to extract the non-epithelial background.
- FIG. 6C is a flowchart of illustrative substages involved in background texture evaluation 606 within process 600 ( FIG. 6A ) according to some embodiments of the present invention.
- a background image may be generated by complementing (inverting) the cytoplasm mask from the initial segmentation and multiplying the complemented image by the original (e.g., CK18) image.
- the initial segmentation may utilize an average size median filter of 10x 10 and a 0.5*Otsu threshold level.
- stage 616 e.g., non-epithelial background image
- a gray level co-occurrence matrix is computed from the background image.
- textural features e.g.
- contrast and energy are computed from the matrix.
- Energy may be defined as: ⁇ i , j p ⁇ i ⁇ j 2
- Contrast may be defined as: ⁇ i , j i - j 2 ⁇ p i ⁇ j
- p(i,j) is obtained from the gray-level co-occurrence matrix that calculates how often a pixel with gray-level (grayscale intensity) value i occurs horizontally adjacent to a pixel with the value j.
- Suitable examples of energy and contrast parameters are described in above-incorporated Gonzalez R. C and Woods R.
- the features are combined to generate texture aggregate values.
- the aggregate value may be computed as (1 - contrast)*energy.
- FIG. 6D is a flowchart of illustrative substages involved in additional or final segmentation 608 within process 600 ( FIG. 6A ) according to some embodiments of the present invention.
- the optimal median filter size and the optimal cut-off point for additional or final binarization arc automatically selected. Additional for final binarization is performed at stage 628.
- a smaller median size filter and/or lower cut-off threshold value are selected for images that have less noise in the background.
- this automatic selection is performed adaptively based on each image's background texture product value (e.g., calculated as indicated above).
- a larger texture product value is typical for images with limited background noise.
- the median filter size and cut-off threshold value are gradually increased to cover additional (e.g,. two more) regions of texture product value as the level of background noise increases. These (e.g., three) regions together may cover the complete background texture noise range.
- three regions corresponding texture product value e.g., defined as (1 - contrast)*energy
- the texture product values will always lie between 0 to 1. In some embodiments, it may be split into three regions, for example, (i) 0.00-0.33, (ii) 0.34-0.66, and (iii) 0.67-1.00.
- the threshold cut-off is 0.9 and median filter size is 18 for the first region of 0.0 to 0.33; the threshold cut-off is 0.55 and median filter size is 15 for the second region of 0.34 to 0.66; and/or the threshold cut-off is 0.35 and median filter size is 5 for the third region of 0.67 to 1.00.
- the binarized images are converted into labeled images using connected components at stage 630.
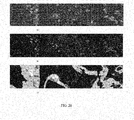
- FIG. 6E is a comparison of adaptive cytoplasm segmentation (images on left) with non-adaptive segmentation (images on right) in images with noisy background.
- the background texture estimation facilitates improved cytoplasm segmentation by, for example, the automatic selection of median filter and binarization parameters.
- Adaptive epithelial cytoplasm segmentation as described above was applied on 1030 images (from 383 patients) that had fairly noisy to very noisy background. A fraction of the images had high levels of noise in the background that made the difference in foreground and background contrast very low. These were the most challenging cases.
- the background texture estimation process facilitated improved cytoplasm segmentation by the automatic selection of median filter size and binarization threshold level parameters. The segmentation was thus fine-tuned to adapt to every image based on the quantitative level of background noise.
- FIG. 7 is a flowchart 700 of illustrative stages involved in separating touching or connected components of positive or foreground signal in an image of tissue (e.g., DAPI image of nuclei and/or CK18 image of cytoplasm resulting from spectral detection).
- process 700 may be performed by segmentation module 106 ( FIG. 1 ) or other suitable computing equipment.
- process 700 may be performed on a tissue image that has already been preprocessed according to process 200 ( FIGS. 2A-2C ) to remove non-uniform intensity variations, and/or binarized according to process 500 ( FIG. 5 ) or process 600 ( FIGS. 6A-6D ) to extract from an image the portions of the image corresponding to tissue foreground or positive signal.
- process 700 may detect a seed point for a plurality of (e.g., all) components (e.g., nuclei or cell) within an image.
- a seed point for a plurality of (e.g., all) components e.g., nuclei or cell
- an image of tissue is received.
- seed detection is performed on the image to separate touching or connected components in the image.
- seed detection at stage 704 may be performed using a multi-scale Laplacian of Gaussian (LoG) filter (specifically, the LoG's Difference of Gaussian (DoG) approximation).
- LoG Laplacian of Gaussian
- DoG the LoG's Difference of Gaussian
- use of the LoG (or DoG) filter may be based on the idea that most of nuclei and cytoplasm objects have a blob-like appearance.
- the scale of the filter (usually the standard deviation of its Gaussian kernel) may be directly related to the size of the blob.
- the maximum LoG response at the center of the blob may occur when using an LoG filter with a size that matches the size of the blob.
- the use of multiple LoG scales may be necessitated by the presence of multiple nuclei and cytoplasm object sizes in the images within a dataset under consideration.
- the Difference of Gaussian (DoG) approximation of the multi-scale LoG may be used because of its ease of implementation and the fact that the DoG method does not require normalization across the scale.
- seed detection may be performed using the process described in above-incorporated Al-Kofahi et al., "Improved automatic detection and segmentation of cell nuclei in histopathology images," IEEE Transactions on Biomedical Engineering, 57(4), 2010 , or another suitable process. Also incorporated by reference herein in its entirety is Al-Kofahi, Algorithms and Framework for Cellular-Scale Mapping, Doctoral Desertation, Renssealaer Polytechnic Institute, Troy, New York, 2009 .
- seed detection in the image may be performed as follows: assuming that L norm ( x , y ; ⁇ ) is scale normalized LoG at scale ⁇ , in terms of a difference of Gaussians, it follows that: L norm x ⁇ y ⁇ ⁇ ⁇ 1 2 ⁇ ⁇ ⁇ G ⁇ x , y ; ⁇ + ⁇ - G ⁇ x , y ; ⁇ - ⁇ where G ( x , y , ⁇ ) is a Gaussian kernel with standard deviation ⁇ .
- the resulting image R ( x , y ) referred to as the LoG response image can be thought of as a topographic surface in which each blob (e.g., nuclei or cytoplasm) is represented by a Gaussian like blob with one local maxima.
- seed points may be detected by identifying these local maxima points.
- a minimum size constraint may be used to limit the size of the identified blob.
- the size of the area (search box) may depend on a parameter termed the clustering resolution r , which in turn depends on the minimum scale.
- the clustering resolution parameter may be subsequently used to perform local maximum clustering.
- An advantage of using the multi-scale LoG method for seed detection is that in addition to producing seed points, the method yields the LoG response image R ( x , y ).
- the LoG response image and the detected seeds may be combined with a clustering based approach to separate touching cells. In some embodiments, this process may not be followed by segmentation refinement using a Graph-cuts based approach. This is because the present applicant has determined that results produced by applying a local maximum clustering approach are adequate, rendering segmentation refinement unnecessary.
- the clustering method groups points in the image around their local maxima using a graduated region growth approach. As the clustering is applied to the response image and the local maxima of the image are also the seed points, the clustering method degenerates to a simple task of assigning image points to seed points.
- the local maximum clustering algorithm uses a sliding box having a size defined by a resolution parameter where each point in the image is first assigned to its local maximum inside that box. In subsequent iterations, that assignment may be propagated until each foreground point is assigned to a seed point.
- this clustering method there may be two advantages to this clustering method over, for example, use of a watershed transform method. First, this method may have a clustering resolution parameter that controls the smallest cluster size possible, thus making it possible to avoid producing very small clusters or fragments. Second, this method can be applied on the foreground points only (or could be constrained to a limited portion of the image), making it computationally attractive and flexible.
- FIG. 8 is a flowchart 800 of illustrative stages involved in removing artifacts and/or other unwanted fragments or errors in a segmented image of tissue (e.g., DAPI image of nuclei or CK18 image of cytoplasm) according to some embodiments of the present invention.
- process 800 may be performed by post-processing module 108 ( FIG. 1 ) or other suitable computing equipment.
- process 800 may be performed on a tissue image that has already been preprocessed according to process 200 ( FIGS. 2A-2C ) to remove non-uniform intensity variations, and/or binarized according to process 500 ( FIG. 5 ) or process 600 ( FIGS. 6A-6D ) to extract from an image the portions of the image corresponding to tissue foreground or positive signal, and/or processed according to process 700 ( FIG. 7 ) to separate touching or connected components of positive or foreground signal in the tissue image.
- Process 800 may include using a first segmented image (e.g., nuclei segmentation) as a template to fill holes in a second segmented image (e.g., cytoplasm segmentation).
- a first segmented image e.g., nuclei segmentation
- a second segmented image e.g., cytoplasm segmentation
- process 800 may entail filling holes in the second image left by the DAPI staining.
- the first and second images may be the output of a nuclei image (e.g., DAPI) segmentation process ("nuclei mask") and the output of a cytoplasm image (e.g., CK18) segmentation process ("cytoplasm mask").
- the first type represents nuclei objects that are missed during an initial thresholding step (e.g., stage 504, FIG. 5 ) because they are too dim and close to the background intensity level.
- the second type represents lumen holes inside a gland object. The holes due to the lumen are typically dimmer and larger than the nuclear holes. In some embodiments, the hole filling process is used to fill in the first type of holes but not the second type.
- stage 802 small gaps inside the cytoplasm image or on its boundary are closed by applying, for example, a gray-scale morphological closing operation.
- a suitable example of a gray-scale morphological closing operation according to some embodiments of the present invention is described in above-incorporated Gonzalez R. C and Woods R. E., Digital Image Processing, Second Edition, Prentice-Hall Inc, 2002 .
- this may be followed by filling multiple (e.g., all) of the cytoplasm holes, for example, having a size less than or equal to an average nucleus size for the image.
- holes smaller than, for example, four times the average nucleus size and/or at least 50% filled by a single nucleus may also be filled.
- the remaining holes may be considered (e.g., labeled or classified by one or more computers as) lumen holes.
- semi-holes that touch an edge of a non-tumor mask and are completely enclosed by one cytoplasm object may be considered (e.g., labeled or classified by one or more computers as) lumen holes.
- FIG. 9 is another flowchart 900 of illustrative stages involved in removing artifacts and/or other unwanted fragments in a segmented image of tissue (e.g., DAPI image of nuclei) according to some embodiments of the present invention.
- process 900 may be performed by post-processing module 108 ( FIG. 1 ) or other suitable computing equipment.
- process 900 may be performed on a tissue image that has already been preprocessed according to process 200 ( FIGS. 2A-2C ) to remove non-uniform intensity variations, and/or binarized according to process 500 ( FIG. 5 ) or process 600 ( FIGS.
- process 900 may include receiving a nuclei image at stage 902, and detecting and removing lumen artifacts at stage 904 in order to produce an output nuclei image.
- at least a portion (e.g., most) of the unwanted artifacts may have been located within lumen holes previously extracted during the generation of the cytoplasm mask (e.g., according to process 800, FIG. 8 ).
- not every lumen hole extracted in the previous step may have been a real lumen hole. For instance, over-estimating the CK18 signal can resulted in merging neighboring glands. As a result, gaps between those glands can be misclassified as lumen holes. Further, nuclei may occasionally be present in the lumen holes.
- process 900 may involve determining different features and measurements from each DAPI object (and connected component) inside the lumen in order to distinguish artifacts from stromal nuclei.
- a classification problem like this one is solved by supervised learning with examples. This may entail deriving multiple feature-based models of the artifacts from examining a series of examples. The learned models may then be used to identify lumen artifacts at stage 904. Examples of lumen artifacts that can be removed during processing are shown in FIG. 10 .
- stage 904 may involve the use (e.g., by one or more computers) of a rule-based system that considers the morphological characteristics and texture of objects and/or their connected components in determining if they are likely artifacts.
- Connected component features may include, for example, one or more (e.g., all) of the size of the connected component Z c , and its average and standard deviation of intensities A c and S c respectively.
- object-based (nuclei) features they may include one or more (e.g., all) of nucleus size, eccentricity C n and elongation E n .
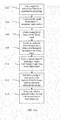
- FIG. 11A is a flowchart of illustrative stages involved in classifying nuclei into epithelial and stromal nuclei according to some embodiments of the present invention.
- a geometric method based on overlap ratios may be applied to a boundary of cytoplasm to classify nuclei into epithelial and stromal categories.
- a filter e.g., connected component filter
- a mask e.g., binary mask
- a complement image may be created from the binary mask of the cytoplasm segmentation to create a new image. Relative to an initial image, an image complement may be generated by, for example, replacing all high-pixel values in the initial image with low pixel values, and replacing all of the low pixel values in the initial image with high pixel values, which may also be referred to as image inversion.
- an operation e.g., binary morphological operation
- binary erosion, binary dilation, binary closing or binary opening may be applied to the binary mask of the cytoplasm segmentation output (e.g., erode the mask by 2 pixels) to create an epithelial mask.
- an operation e.g., a binary morphological operation
- binary erosion, binary dilation, binary closing or binary opening may be applied to the complement of the binarized cytoplasm segmentation output (e.g., erode the mask by 5 pixels) to create a stroma mask.
- stage 1112 for each nuclei object in the nuclei segmentation output image, its overlap with the epithelial and/or stroma masks may be determined.
- the nuclei object may be labeled as an epithelial object.
- a given fraction e.g., predetermined, fixed fraction, e.g., 0.6
- the nuclei object may be labeled as an epithelial object.
- the overlap with the stroma mask is greater than a given fraction (e.g., predetermined, fixed fraction which could be the same or different from the fraction above, e.g., 0.5)
- the nuclei object may be labeled as a stroma object.
- the nuclei is neither labeled as epithelial nor stroma (e.g., due to insufficient overlap), it may be labeled as unclassified.
- stage 1114 for each nuclei labeled as epithelial and/or stroma objects, it may be determined whether the nuclei's one or more morphological shape features (e.g., eccentricity, circularity, roundness, etc.) and/or one or more texture features (e.g., energy, standard deviation of grayscale values, etc.) meet one or more thresholds (e.g., confirm that all nuclei labeled stroma nuclei have eccentricity greater than 0.5).
- stage 1114 may be optional and may be omitted from the process of FIG. 11A .
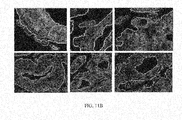
- FIG. 11B shows examples of nuclei boundary classifications according to some embodiments of the present invention.
- epithelial nuclei had a blue boundary and hue
- stroma nuclei had a red boundary and hue
- cytoplasm had a green boundary and hue.
- a color version is provided in applicants' above-incorporated U.S. Provisional Application No. 61/400,642, filed July 30, 2010 .
- FIG. 11C is a flowchart of illustrative stages involved in adjusting boundaries of cytoplasm objects within a tissue image to avoid dividing border nuclei according to some embodiments of the present invention.
- an image resulting from cytoplasm segmentation may be received.
- an image resulting from nuclei segmentation may be received.
- a mask e.g., binary mask
- a mask may be created from the image resulting from the cytoplasm segmentation.
- stage 1122 for each nuclei object in the image resulting from the nuclei segmentation, its overlap with the cytoplasm mask may be determined.
- the nuclei object may be labeled as a touching object.
- a touching object image may be created from all the touching objects.
- an operation e.g., binary logical AND operation
- an operation e.g., binary morphological operation
- binary erosion, binary dilation, or binary closing e.g., perform binary closing with pixel size 5
- binary closing e.g., perform binary closing with pixel size 5
- FIG. 11D is a flowchart of illustrative stages involved in adjusting the boundaries of cytoplasm objects given a scalloped appearance, for example, caused by weak stain around the nuclei along the boundary according to some embodiments of the present invention.
- an image resulting from cytoplasm segmentation may be received.
- an image resulting from nuclei segmentation may be received.
- a mask e.g., binary mask
- an operation e.g., a binary morphological operation
- binary closing e.g. perform binary closing with pixel size 10.
- stage 1138 for each nuclei object in the image resulting from the nuclei segmentation, its overlap with the modified cytoplasm mask resulting from stage 1136 may be determined. In some embodiments, if the overlap with the cytoplasm mask is greater than a given fraction (e.g., predetermined, fixed fraction, e.g., 0.1), the nuclei object may be labeled as a touching object. At stage 1140, a touching object image may be created from all the touching objects. At stage 1142, an operation (e.g., binary AND operation) may be performed to combine the touching object image with the cytoplasm mask. At stage 1144, an operation (e.g., binary morphological operation) such as binary erosion, binary dilation, or binary closing (e.g. perform binary closing with pixel size 5) may be performed on the combination image to obtain an output image.
- a given fraction e.g., predetermined, fixed fraction, e.g., 0.1
- a touching object image may be created from all the touching objects.
- Segmentation performance was measured using the standard Dice and Jaccard metrics (below) and also using 'Dice Average' and 'Jaccard Average,' which are extensions of the traditional metrics to multiple object, multiple impingement systems (such as cellular images).
- the overall segmentation accuracy for image processing and segmentation according to some embodiments set forth herein exceeded 94% using all four metrics.
- the artifact removal process was tested using 981 actual prostate cancer tissue images. To judge the efficacy of the process, trained personnel were asked to rate overall artifact condition of the resultant images as 'satisfactory' or 'not satisfactory'.
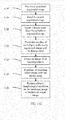
- FIGS. 12A-D are flowcharts of illustrative stages involved in segmenting an image of tissue to identify, for example, epithelial units.
- these processes receive as input, for example, two biomarker images of the same tissue: a CK18 image showing epithelial cytoplasm, and a DAPI image showing epithelial and stromal nuclei.
- these images are previously segmented, using the segmentation procedure(s) described above to produce labeled masks of the connected epithelial area.
- the epithelial unit separation is performed using the processes described below that have complementary effects and between the two they capture most or all of the separations.
- some embodiments of the present invention separate touching but not fused epithelial units and/or group epithelial nuclei into discrete rings that do not depend on lumens or initial lumen segmentation.
- FIG. 12A is a flowchart of illustrative stages involved in epithelial unit separation according to some embodiments of the present invention.
- this process utilizes initialization of a watershed algorithm from the interior or marker centers.
- a marker center may be a binary structure obtained by dilating, for example, a segmented epithelial DAPI nuclei mask and complementing the dilated mask.
- the processes of one or more of FIGS. 12A-D may be performed on a tissue image that has already been preprocessed according to process 200 ( FIGS. 2A-2C ) to remove non-uniform intensity variations, and/or binarized according to process 500 ( FIG. 5 ) or process 600 ( FIGS.
- a segmented nuclei (e.g., DAPI) binary mask is received.
- the segmented nuclei binary mask is variably dilated using morphological dilation.
- the complement of the dilated mask is generated.
- marker centers are extracted from the complement of the dilated mask.
- a smoothed cytoplasm (e.g., CK18) image e.g., generated by smoothing the CK18 image using a Gaussian low pass filter and an averaging filter
- segmented cytoplasm e.g., CK18
- a new image of intensity valleys and peaks minimumma and maxima
- a watershed transform is applied over the new image to obtain watershed lines of separations.
- the watershed image is binarized.
- the segmented cytoplasm (e.g., CK18) binary mask and watershed binarized image are merged.
- missing epithelial units from the segmented cytoplasm (e.g., CK18) binary mask arc searched for and retained using one or more logical operations between the binarized watershed image and the segmented cytoplasm (e.g., CK18) binary mask.
- a logical OR operation may first be used to merge all separations that are marked for elimination, and the binarized watershed based image and the segmented cytoplasm mask may be merged.
- the image is labeled (e.g., labeled using connected components) and separation boundaries and/or regions are extracted from the labeled image, for example, by subtracting the separations marked for elimination from initial separations obtained from the watershed segmentation.
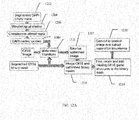
- FIG. 12B is a flowchart of illustrative stages involved in epithelial unit separation refinement according to some embodiments of the present invention.
- this process utilizes initialization of a watershed algorithm from the interior or marker centers.
- the process of FIG. 12B removes false separations using image criteria such as, for example, the derivative, standard deviation, mean intensity, and/or marker contact criteria.
- an intensity e.g., mean intensity
- standard deviation thereof e.g., standard deviation of mean intensity
- the standard deviation of, for example, mean intensity is computed on individual separations on a gradient of the cytoplasm (e.g., CK18) image.
- separations that touch any nuclei e.g., DAPI
- stage 1228 based on a threshold criterion (e.g., obtained by dividing the lumen area by the segmented cytoplasm area), potentially false separation boundaries are eliminated (e.g., these separation boundaries may not lie in the epithelial cytoplasm gaps).
- stage 1230 final or refined separation boundaries are extracted.
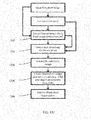
- FIG. 12C is a flowchart of illustrative stages involved in enhancing ridges in tissue images according to some embodiments of the present invention.
- the dark, low-contrast linear ridges formed by the visible cytoplasm membranes around the outer boundary of touching or almost touching cytoplasm (e.g., CK18) areas may be enhanced.
- such a process may include the use of a fast-marching process to propagate the initial cytoplasm (e.g., CK18) border.
- CK18 initial cytoplasm
- the resultant image may include high values far from the borders, and low values along edges reachable by rapid propagation.
- implementation of such a process may be in C++.
- a speed image may be created, which includes the CK18 edge + ridge strength.
- the speed image may have values in the range 0-1, with propagation speed proportional to grey level, and distance (difference between neighboring fast marching output pixels) proportional to (1/grey level).
- the speed image may be designed to promote propagation along dark valleys between bright epithelial units and also along the outside (dark side) of bright borders of epithelial units.
- a Fast Marching edge strength propagation method is performed using the speed image, initialized from the CK18 borders, to create a distance map, which is then inverted at stage 1236.
- a watershed segmentation is performed of the inverted distance map and watershed separations are extracted at stage 1240.
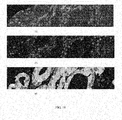
- FIG. 13 shows images demonstrating separation of touching epithelial units according to some embodiments of the present invention.
- Image (a) is an input CK18 image.
- Image (b) is a CK18 segmentation image.
- Image (c) is a combined edge and ridge strength image.
- Image (d) shows the results of fast marching initialized from image (b) propagating with speed from (c).
- Image (e) shows watershed separation.
- Image (f) shows a larger example with borders of certain ones of the newly identified segments being circled. In the original image (f) (included in color with above-incorporated U.S. Provisional Application No. 61/456,009, filed October 28, 2010 ), the borders of new segments were overlaid in red.
- Image (f) is presented in black and white herein for ease of reproduction.
- processes for separating epithelial units may be the same or similar for various different types of tissue images including, for example, H&E images, IF images, IHC images, and/or other images resulting from other types of staining.
- H&E images prior to the separation an H&E image segmentation process may be used to segment the H&E image.
- the rest of the processing stages may be the same as those used for, for example, epithelial unit separation in IF images.
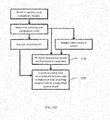
- FIGS. 12D-E are flowcharts of illustrative stages involved in lumen generation (e.g., creation of a lumen mask image) according to some embodiments of the present invention.
- a lumen mask image generated according to the process(es) of FIG. 12D and/or FIG. 12E may be used to facilitate further processing of tissue images after, for example, segmentation of nucleus and cytoplasm images as described above in connection with process 500 ( FIG. 5 ) and/or process 600 ( FIG. 6A ).
- areas of the background in the cytoplasm mask obtained from cytoplasm segmentation are either lumen or stroma.
- the correct classification of lumen and stroma regions may be important in constructing predictive morphologic features and/or subsequent tissue image processing stages including, for example, separating epithelial units according to the processes of FIGS. 12A-C .
- an initial lumens mask image and an intermediate lumens mask image may be generated from cytoplasm and nucleus mask images generated by, for example, process 500 ( FIG. 5 ) and/or process 600 ( FIG. 6A ).
- the initial lumens mask may be generated by extracting holes in the cytoplasm mask, selecting compact shaped regions (e.g., regions with aspect ratio less than 0.10), and/or determining that there arc very few internal nuclei (e.g., none, or less than 5 internal nuclei). While few lumens may be missed in this initial process, many of the lumens may be misclassified.
- the intermediate lumen mask image may be used as an input to one or more of the processes of, for example, FIGS. 12A , 12B , and/or 12C (e.g., an input to stage 1232) to separate the cytoplasm mask into individual epithelial units.
- final lumen generation may be accomplished by combining the initial lumens and epithelial unit separations to form a combined lumen mask.
- image filling may include filling one or more (e.g., all) holes (e.g., lumens or other holes in stroma). This may be the first step towards extracting lumens from the cytoplasm mask.
- Logical operation(s) may include, for example, an XOR logical operation of the newly filled and original cytoplasm mask, although other logical operation(s) can also be used in other embodiments.
- Morphological reconstruction may include, for example, repeated dilation performed between the XOR output image and the filled image in order to extract the lumens or other holes in the stroma.
- one or more shape statistics are measured for each lumen including, for example, one or more (e.g., all) of lumen perimeter, area, eccentricity, roundness, and extent.
- a shape threshold is determined. For example, one shape statistic (e.g., eccentricity) may be multiplied with a complement of one or more additional statistics (e.g., roundness, perimeter, area, and/or extent) to obtain a shape threshold having a range, for example, that can be between 0-1 only.
- a certain value of the threshold parameter e.g. 0.15 shape threshold value
- epithelial unit separation e.g., according to one or more of the processes of FIGS. 12A , 12B , and/or 12C
- a lumen mask e.g., the intermediate lumen mask resulting from the process of FIG. 12D
- nuclei and cytoplasm masks e.g., resulting from processes 500 ( FIG. 5 ) and/or 600 ( FIG. 6A )
- a combined (e.g., final) lumen mask is generated by combining the initial lumens mask (e.g., generated as described above) and the epithelial unit separations.
- the initial lumens mask e.g., generated as described above
- the epithelial unit separations e.g., the epithelial unit separations.
- lumens in the combined lumen mask that touch separations in the cytoplasm mask may be removed, and/or holes touching the image edges or pathology mask may be eliminated, with the resulting image being the final lumen mask.
- FIG. 12F shows an example output according to the process of FIGS. 12D-E according to some embodiments of the present invention.
- lumens were shown in green and separations were shown in yellow, although the image has been provided in black and white herein for case of reproduction.
- one of the lumens has been circled and one of the separations has been encased by a square.
- FIG. 12G is a flowchart of illustrative stages involved in ring segmentation by a graph process based upon clustering a triangulation of epithelial nuclei according to some embodiments of the present invention.
- Some embodiments of the present invention operate based on the principle that a key geometric property of a "ring" of points, possibly including some interior points not on the ring boundary is that the points are more closely spaced around the boundary than in the interior or exterior of the ring.
- a suitably initialized watershed process on a graph captures this property.
- the triangle connectivity graph is the Voronoi diagram.
- a "depth" is assigned to each triangle, for example, equal to the length of the longest side.
- a sort by depth is performed, and then starting from the deepest triangles, neighboring regions (e.g., 3 neighboring regions) are examined and regions are merged if the length of the common side is at least, for example, 90% of the depth of the neighbor, and if both regions touch the same epithelial units.
- a merging step reduces over-fragmentation to complete the partitioning of the image into polygonal rings.
- an advantage of a graph-based watershed method over a pixel-based algorithm is that it is more convenient to track region statistics within the algorithm and to apply fine-tuned region merging criteria.
- FIG. 14 shows images of segmentation of epithelial nuclei into labeled gland rings according to some embodiments of the present invention. These images arc provided in black/white herein for ease of reproduction. Color images are provided in above-incorporated U.S. Provisional Application No. 61/456,009, filed October 28, 2010 .
- Image (a) shows an input nuclear DAPI image.
- Image (b) shows a CK18 image overlaid with epithelial unit borders (shown in color image in white) and DAPI nuclei borders (shown in color image in blue).
- Image (c) shows a Voronoi diagram from epithelial nuclei centers, colored by watershed segmentation labels.
- Image (d) shows polygonal regions classified as gland ring (shown in color image in red), gland non-ring (shown in color image in green), stromal (shown in color image in black), and confused/undefined (shown in color image in blue).
- Image (e) is a larger example.
- rings are polygonal regions of tissue that are identified and output by a segmentation process (e.g., the ring segmentation process described above).
- the goal of ring classification according to some embodiments of the present invetnion is to classify the rings into, for example, one or more (e.g., all) of five different types: (1) gland rings; (2) epithelial non-rings; (3) stroma regions; (4) under-segmented regions; and/or (5) incomplete regions.
- gland rings may be rings characterized by a ring of nuclei with a central clearing possibly containing a lumen.
- Epithelial non-rings may be characterized by dense fields of nuclei not in rings, isolated fragments of nuclei or nuclei on the outside of a ring sandwiched between neighboring rings or sandwiched between a ring and stroma.
- Stroma regions may be rings bordered by epithelial nuclei in different epithelial units or rings which border concavity of stroma in the same epithelial unit.
- Under-segmented regions may be rings with both stroma and epithelium which cannot be classified into any of the other categories. Incomplete regions may be rings bisected by image edges or a pathology mask.
- polygonal areas resulting from ring segmentation may be classified into one or more (e.g., all) of the five types/classes, including gland rings, epithelial non-rings, stroma regions, under-segmented regions and/or incomplete regions using, for example, the criteria identified above. Additional details regarding how to classify the polygonal areas according to some embodiments of the present invention are provided below.
- ring features there may be three levels/types of ring features: (i) basic ring metrics, (ii) features for classification of ring types, and (iii) features for prognosis.
- Table 2 below describes basic ring metrics according to some embodiments of the present invention, which are also illustrated in FIG. 18A .
- a '+' in the "Dir" column indicates that a larger value is better for patient outcome, or at least not worse.
- the border density feature, d/b at low values, detects poor ring segmentations as well as small rings with widely spaced nuclei (as shown in green rings in the original colored image corresponding to FIG. 17 ).
- Table 3 below describes illustrative ring classification features that may be used to classify rings into, for example, the five classes listed above.
- additional ring features may be provided for use in prognosis (e.g., Table 4 below - Ring Feature Statistics) by, for example, one or more predictive models.
- any one or more (e.g,. all) of the features in, for example, Tables 2,3, and/or 4 may be used for prognosis within a predictive model alone or in combination with one or more additional features (e.g., clinical, molecular, and/or morphological features).
- adjacencies and connectivities of one or more basic ring metrics may be used to construct a more detailed set of one or more features (e.g., Table 3) for the purpose of classifying rings into the five types or classes.
- a concavity is formed where the region edge (the straight line connecting adjacent nuclei) crosses the cytoplasm border.
- apparatus, methods, and computer-readable media are provided that utilize features based on connectivity of cytoplasm within rings with corrections for concavities where lumen or stroma crosses the ring boundary.
- embodiments of the present invention may detect small concavities and ignore these in calculating blob connectivities. This procedure may be useful, for example, whenever connectivities of overlapping blobs are analyzed, especially blobs with holes and concave borders.
- FIG. 15 is a flowchart 1500 of illustrative stages involved in localizing and quantifying biomarker signal according to some embodiments of the present invention.
- Applicants have determined that this process works well for, for example, tissue images having poor signal-to-noise ratios (SNR) and other images.
- SNR signal-to-noise ratios
- biopsy tissues, surgical resection specimens, and cell aspirates frequently suffer through variations in tissue handling and processing including mechanical shear during tissue sectioning.
- Tissue micro arrays are often constructed using standardized protocols intended to mitigate tissue history effects by allowing for the evaluation of all tissue images at the same time under similar conditions.
- process 1500 may be utilized to improve image analysis of TMA and/or biopsy tissues that can have, for example, low SNR.
- process 1500 may be performed on a tissue image (e.g., DAPI and/or CK18) that has already been preprocessed according to process 200 ( FIGS. 2A-2C ) to remove non-uniform intensity variations, and/or binarized according to process 500 ( FIG. 5 ) or process 600 ( FIGS. 6A-6D ) to extract from an image the portions of the image corresponding to tissue foreground or positive signal, and/or processed according to process 700 ( FIG. 7 ) to separate touching or connected components of positive or foreground signal in the tissue image, and/or processed according to processes 800 ( FIG. 8 ) and/or 900 ( FIG. 9 ) above.
- a tissue image e.g., DAPI and/or CK18
- processing before utilization of process may include, for example, classifying nuclei in a tissue image into epithetical nuclei (DAPI+/CK18+) and/or stromal nuclei (DAPI+/CK18-) using a colocalization process and/or identification of cytoplasm glands and glandular objects.
- Process 1500 may be preceded by other processing in other embodiments.
- one or more bright objects having a size below a threshold are removed from an image of tissue (e.g., nuclei image) as being indicative of and characterized as speckle noise.
- tissue e.g., nuclei image
- two thresholds are utilized, one for size and one for brightness.
- the size threshold may be utilized to remove small artifacts (e.g., nucleus and cytoplasm fragments generated during tissue process), while the brightness threshold may be utilized to remove speckles (e.g., point speckles created during the staining process).
- speckles e.g., point speckles created during the staining process.
- relative signal intensity in a biomarker image is indicative of a targeted biological process and/or attribute for which the biomarker is designed to capture.
- Absolute intensity of a biomarker signal in one image relative to another may be influenced by strong nonspecific binding as a result of tissue history (e.g. extraction, processing and storage steps) as well as impurities in labeling reagents. This non-specific binding constitutes background noise in the image.
- biomarker quantitation may be limited to segmented objects (e.g., nuclei and/or cytoplasm and/or glandular objects).
- segmented objects e.g., nuclei and/or cytoplasm and/or glandular objects.
- the amount of speckle noise that is allowed in each object is limited using an experimentally determined threshold (e.g., determined automatically or based on review by a pathologist of image processing results using multiple threshold values).
- b are valid nuclei biomarker object pixels (e.g., nuclei pixels)
- ⁇ is the speckle noise threshold
- m is the total number of object pixels
- n is the total number of nuclei in the image.
- a threshold may be determined for distinguishing between background and real signal intensity for each object (e.g., nucleus).
- each object e.g., nuclei
- each of a plurality of sub-compartments e.g., epithelia and stroma
- the signal intensity threshold T may be determined as a function of biomarker background characteristics.
- objects e.g., nuclei
- background colored objects B b e.g., with ⁇ b , ( ⁇ b , and ⁇ -th percentiles q b, ⁇ ).
- non-linear modeling may be used.
- the threshold T may change according to the properties of each image.
- indirect linear regression analysis via concordance index (CI) optimization may be used to determine ⁇ . For example, a set of images may be selected for training the model. For each image: a) objects B c and B b may be identified; b) background features may be extracted; and c) CI may be computed. The value of ⁇ that optimizes the CI may be selected as optimal.
- sub-compartment histogram generation (stage 1506) and feature extraction (stage 1508) may be performed.
- histograms e.g., epithelial and stroma histograms H E and H S
- the binning could also involve using compartments such as, for example, peri-epithelium and sub-compartments of the stroma.
- the histograms may be analyzed separately to obtain relative intensity features such as, for example, cumulative expressions at each ⁇ -th percentile. Alternatively or additionally, the histograms may be analyzed in relation to each other to obtain features related to the relative expression of, for example, epithelia and stroma nuclei at each ⁇ position.
- FIG. 16 shows typical AR biomarker expression histograms for progressive cancer (top left) and dormant prostate cancer (top right) according to some embodiments of the present invention.
- FIG. 16 also shows typical Ki67 biomarker expression histograms for progressive cancer (bottom left) and dormant prostate cancer (bottom right) according to some embodiments of the present invention.
- apparatus, methods, and computer-readable media are provided for reducing the influence of segmentation errors while averaging biomarker positive objects by excluding no/poor signal regions (e.g. by avoiding zero pixel elements).
- the output of a segmentation of the nuclei image may be received.
- One or more (e.g., all) objects in the nuclei labeled image may be filled with its corresponding intensity in original nuclei image (e.g., DAPI image). For each filled nuclei label object, pixels below an intensity threshold (e.g., fixed threshold, e.g., zero) may be eliminated.
- intensity threshold e.g., fixed threshold, e.g., zero
- a size threshold e.g., fixed size threshold, e.g., 20 pixels
- the average intensity of the pixels may be calculated.
- the original nuclei labels may be filled with the corresponding average intensity values calculated.
- apparatus, methods, and computer-readable media are provided for estimating and correcting for the noisy background of a biomarker image by sampling the signal in a band (or strip) region bordering a sub compartment (e.g., the cytoplasm).
- a biomarker image e.g., AR image
- a cytoplasm mask may be received.
- the cytoplasm mask may be dilated, for example, by a fixed size (e.g., 10 pixels).
- the original cytoplasm mask may be subtracted from the dilated mask to create a band.
- the biomarker image values may be sampled within the band and its average values may be calculated (e.g., after excluding pixels less than a fixed threshold, e.g., zero).
- the intensity of regions of the original biomarker image above a fixed intensity value (e.g., 5000) may be reduced by the calculated threshold value.
- predictive features for use in predictive models are provided.
- Predictive models may be configured for use in treating, diagnosing, and/or predicting, for example, the occurrence (e.g., recurrence) of a medical condition (e.g., cancer) in a patient.
- a medical condition e.g., cancer
- one or more of the features described herein may be utilized within a predictive model that includes one or more morphometric features and/or one or more molecular features.
- such predictive models may include one or more clinical features. Examples of suitable types of clinical, molecular, and morphometric features are described in, for example, commonly-owned U.S. Appln. No. 12/584,048, filed on August 31, 2009 , which is hereby incorporated by reference herein in its entirety.
- one or more of the features described herein may be extracted from images processed (e.g., pre-processed, segmented, and/or post-processed) according to some or all of the teachings set forth herein (e.g., according to FIGS. 1-16 and their corresponding descriptions).
- images processed e.g., pre-processed, segmented, and/or post-processed
- FIGS. 1-16 and their corresponding descriptions e.g., according to FIGS. 1-16 and their corresponding descriptions.
- Illustrative systems and methods for, for example, generating predictive models based on one or more features and having various endpoints e.g., prediction of disease progression or recurrence, likelihood of favorable pathology/indolent disease, automated Gleason grading of tissue images, etc.
- endpoints e.g., prediction of disease progression or recurrence, likelihood of favorable pathology/indolent disease, automated Gleason grading of tissue images, etc.
- one or more of the features described herein may be used within a predictive model predictive of one of these endpoints, or another endpoint.
- one or more of the features described herein may be extracted from a tissue image including segmentations of bright-field images, dark-field images, or other images.
- feature(s) described herein may be extracted from tissue images resulting from Hematoxylin and Eosin (H&E) staining, immunofluorescence (IF) detection, immunohistochemistry (IHC), similar and/or related staining processes, and/or other processes.
- H&E Hematoxylin and Eosin
- IF immunofluorescence
- IHC immunohistochemistry
- predictive features of glandular objects such as rings are provided.
- these features are generated without using initial lumen segmentation. Rather, such rings may be detected based on nuclei geometry.
- a segmentation of nuclei of a cellular region into individually contiguous (or labeled) regions may be provided.
- the centroid of each nuclei region may be extracted and each image may then be partitioned into polygonal regions with epithelial nuclei at the vertices, for example, as described above with regard to Ring Segmentation and Ring Classification.
- FIG. 17 shows an example of ring segmentation on a dark-field image, which has been provided in black and white for ease of reproduction.
- prognostic ring features arc combined and/or averaged over, for example, part of an image or an entire image to create a family of image features.
- This family of image features may be parameterized in, for example, one or more of four ways:
- Table 4 below describes statistics that may be used to generate ring features according to some embodiments of the present invention.
- Table 5 below describes regions
- Table 6 below describes weight variables
- Table 7 below describes ring feature variables that may be used to generate ring features according to some embodiments of the present invention.
- Table 8 below describes examples of the features that may be generated for use within a predictive model in some embodiments of the present invention. In Table 8, a '+' in the "Dir" column means that a larger value is better for patient outcome.
- Table 9 below shows how ring prognostic features generated according to some embodiments of the present invention are associated with many aspects of the Gleason grading system such as, for example, the fusion of multiple rings in one epithelial unit, the degree to which rings touch lumen and stoma, the formation of epithelial sheets with and without cribriform rings, and the fragmentation of glands.
- the Gleason grading system is the gold standard for morphological analysis of H&E stained tissue images of the prostate.
- FIGS. 18B-D are images of gland rings detected on Gleason patterns 3,4 and 5 in tissue according to some embodiments of the present invention.
- fused rings with less than 50% of border touching stroma were shown in yellow, however, the images have been included in black and white herein for ease of reproduction.
- Table 10 below provides additional information regarding the correspondence between features described above and gland architecture. For example, it demonstrates how aspects of glandular architecture including fused rings, lumens or clearings in rings, Cribriform, ring size, Non-ring nuclei clusters, Cytoplasm fragmentation, Cytoplasm border, Nuclei spacing, Ring Shape, Ring dimensionality, Ring spacing, Ring arrangement, and Stroma Nuclei are represented by the features.
- the 'CI per case' in Table 10 refers to the concordance index value calculated from the average feature values for each patient (e.g., by using the median feature values for each patient regardless of the number of images available for that patient).
- the 'Approx CI per image' refers to the concordance index values calculated from all the feature values of all the patients.
- the outcome parameter consisted of a binary grouping of all the 'event' cases regardless of time into one group and all the 'non-event' cases regardless of censoring into another group.
- epithelial units may be generated from the process described above in connection with FIGS. 12A-D .
- one or more epithelial unit features may be constructed from basic measurements such as, for example, area or nuclei density.
- one or more epithelial unit features may be constructed from the ring characterization processes described above in connection with the Ring Features.
- one or more epithelial unit features may be constructed using the weighted averaging method described above in Table 4.
- biomarker feature generation may begin with the segmentation of individual cellular objects (cell nuclei and cytoplasm) and sub-compartments (epithelia and stroma). Biomarker feature generation may include two steps: sub-compartment histogram generation and feature extraction. Histograms (e.g., epithelial and stroma histograms H E and H S ) may be extracted by binning actual signal colored objects (e.g., nuclei B r ), for example, in each sub-compartment separately.
- Histograms e.g., epithelial and stroma histograms H E and H S
- H E and H S may be extracted by binning actual signal colored objects (e.g., nuclei B r ), for example, in each sub-compartment separately.
- Epithelia and stroma histograms may be analyzed separately to obtain relative intensity features such as, for example, cumulative expressions at each ⁇ -th percentile. Alternatively or additionally, the histograms also may be analyzed together to obtain features related to the relative expression of objects (e.g., epithelia and stroma nuclei), for example, at each ⁇ position. In some embodiments, fractional positive percentiles may be calculated.
- FIG. 19 shows an illustrative AR segmentation (image c) obtained from gray-scale AR (image b) and DAPI (image a) expression images.
- FIG. 20 shows an illustrative Ki67 segmentation (image c) derived from gray-scale DAPI (image a) and Ki67(image b) images.
- FIGS. 19 and 20 were originally in color but have been provided in black and white herein for ease of reproduction.
- Table 11 below includes descriptions, according to some embodiments of the present invention, feature classes for AR (and Ki67) nuclei biomarkers with their favorable value indication and concordance index (CI) on a subset of 309 patients whose 980 biopsy images were studied.
- Table 11 Descriptions of feature classes for AR (and Ki67) nuclei biomarkers Feature Name Description Favorable value CI on MV06 AR_EpithDiffN The difference between the fraction of epithelial nuclei whose intensity is greater than N% of the maximum nuclei intensity (positivity) and the fraction of stroma nuclei whose intensity is greater than N% of the maximum positivity Low 0.33 AR_EpithRatioN The ratio of the fraction of epithelial nuclei with intensity values greater than N% of maximum positivity to all nuclei (epithelial and stroma) above N% positivity Low 0.31 AR_StromValueN The fraction of stroma nuclei with intensity values lies between N% and (N+25)% of
- Table 12 below shows four examples of cases demonstrating relative values of certain AR features according to some embodiments of the present invention. Cases 1 and 2 had favorable outcomes while cases 3 and 4 had unfavorable outcomes.
- image processing and feature extraction as described herein can be applied to tissue samples obtained from biopsy or tissue micro array sections as it is robust to variability in image quality and heterogeneity in staining conditions. Advantageously, it may automate traditional methods of "normalizing" signal intensity by relative, objective appearance.
- features constructed from the relative analysis of multi-compartment histograms as described herein are robust to tissue variations. Table 12: Four examples cases demonstrating relative values of AR features (Cases 1 and 2 were favorable while cases 3 and 4 were unfavorable).
- texture features may be obtained by analyzing the texture of nuclei (e.g., DAPI nuclei). As a disease progresses (example, from Gleason pattern 3 to 4), the texture of DAPI nuclei becomes coarser, making it advantageous to analyze textural differences.
- nuclei e.g., DAPI nuclei
- FIG. 21 is a flowchart 2100 of illustrative stages involved in extracting texture features from a tissue image according to some embodiments of the present invention.
- nuclei may be extracted (e.g., DAPI nuclei from a DAPI image) by forcing background to zero based on a segmented nuclei labeled mask.
- epithelial nuclei may be separated using a cytoplasm segmentation mask or masks.
- one or more texture features including, for example, homogeneity and correlation may be computed.
- homogeneity may be defined as: ⁇ i , j p i ⁇ j 1 + i - j
- correlation may be defined as: ⁇ i , j i - ⁇ ⁇ i ⁇ j - ⁇ ⁇ j ⁇ p i ⁇ j ⁇ i ⁇ ⁇ j where, p(i,j) is obtained from a gray-level co-occurrence matrix that calculates how often a pixel with gray-level (grayscale intensity) value i occurs horizontally adjacent to a pixel with the value j .
- a histogram may be plotted based on the homogeneity and the correlation of the individual nuclei and, for example, the histogram may be normalized by dividing by the total sum (y-axis). In some embodiments, the histogram may also be stretched between 0 to 1 (x-axis).
- a polynomial curve may be fit to the histogram to minimize or get rid of fluctuations in the count.
- each bin for the fitted curve of the histogram may become a feature.
- FIG. 22A shows histogram plots and corresponding polynomial curves fit of homogeneity and correlation, wherein counts may be obtained from the curve for 80 bins that form 80 features for each category. In some embodiments, these features may be based on epithelial nuclei only (ho_epixx, cr_epixx).
- stromal nuclei may be extracted from the nuclei (e.g., DAPI) image and the histogram may be plotted using the same or a similar process as described above.
- the epithelial histogram of homogeneity and correlation may be divided by their respective stromal histograms. This may normalize the histogram between various images.
- a polynomial curve may be fit to the new histogram (e.g., ratio of epithelial and stromal histograms) to obtain a new set of features (ho_epistromxx, cr_epistromxx).
- the first and second histograms e.g., epithelial and stromal histograms
- a histogram normalization process may be used, for example, as an alternative or in addition to polynomial fitting.
- a suitable histogram normalization process according to some embodiments of the present invention is described in, for example, above-incorporated Gonzalez R. C and Woods R. E. Digital Image Processing, Second Edition, Prentice-Hall Inc, 2002 .
- Table 13 Feature definitions Feature Description S-touch Proportion of ring border touching stroma EpiNucRing Proportion of epithelial nuclei in gland rings (red) EpiNucGreen Proportion of epithelial nuclei in glandular non-rings (green) EpiNucMidRed Proportion of epithelial nuclei in gland rings (red) with S-touch > 0.4 RatioRed (# gland rings) / (# gland rings (red) + # glandular non-rings (green)) OguWigu5x Morphological lumen-based H&E feature for comparison: Proportion of epithelial nuclei in symmetrical gland-unit areas around lumens
- the "EpiNucRing” feature is analogous to the H&E “OguWigu5x” feature, which is described in Donovan et al., "Personalized Prediction of Tumor Response and Cancer Progression from the Prostate Needle Biopsy," Journal of Urology, 2009, 182:1, 125-132 , which is hereby incorporated by reference herein in its entirety.
- the "EpiNucGreen” feature is almost the inverse of the "EpiNucRing” feature. Since few epithelial nuclei occur in fragments within stromal areas, they are generally classified as either gland ring or non-ring. This is borne out in the cross-correlation between these two features of -0.91, Table 14.
- Table 14 Feature cross correlations in the range -1 to 1, comparing the proposed IF features to a H&E gland-unit feature (OguWigu5x) F2 F3 F4 F5 F1:OguWigu5x 0.52 -0.3 0.32 0.08 F2:EpiNucMidRed 1 -0.48 0.44 0.06 F3:EpiNucGreen -0.48 1 -0.91 -0.77 F4:EpiNucRing 0.44 -0.91 1 0.79 F5:RatioRed 0.06 -0.77 0.79 1
- the IF feature with the highest correlation to OguWigu5x, 0.52, is EpiNucMidRed, which is a filtered version of EpiNucRing excluding rings which do not touch stroma for at least 40% of their boundary. This has the effect of reducing the gland ring nuclear proportion for areas of densely merged epithelial units, such as cribriform sheets.
- CIs Concordance indices in Table 15 below are calculated comparing feature values to the time elapsed between when the biopsy was performed and the occurrence of significant disease progression (metastasis or death as a result of prostate cancer).
- EpiNucMidRed is correlated to and more stable than the H&E "OguWigu5x" feature described above. The correlation is related to the correlation between the touching stroma and the touching lumens present in good rings. All the features except EpiNucGreen correlate positively with outcome, having CIs greater than 0.5, meaning that a higher value of the feature is better for the patient. This interpretation corresponds with the clinical and pathological correlation of glandular objects with disease progression.
- Ratio_AreaEN_Ring_SoftStG40_DeG15 The updated version of this feature is named Ratio_AreaEN_Ring_SoftStG40_DeG15, as shown in Table 8 above.
- Table 15 Univariate concordance indices comparing the proposed IF features to a H&E gland-unit feature (OguWigu5x) Feature CI w/out CK18 Separation CI with CK18 Separation OguWigu5x 0.63 n/a EpiNucMidRed 0.64 0.70 EpiNucGreen 0.40 0.33 EpiNucRing 0.63 0.64 RatioRed 0.61 0.65
- Two multivariate models were also trained in the context of a systems pathology paradigm.
- disparate information from patient's clinical (e.g., age), histological (via image features extracted from hematoxylin and eosin-stained tissue specimens, and molecular (via features measuring the expression of protein biomarkers) profiles were combined in a supervised learning framework to predict cancer recurrence.
- One of the models utilized features from a previous method while the other utilized features described herein. Analysis show a 0.04 improvement in the predictive power (CI) of the model based on the new features.
- Androgen receptor (AR) and Ki67 biomarker expression in prostate biopsy samples were quantified and extracted histogram features were shown to be associated with disease progression in a univariate analysis. It manifested improved performance over prior systems. The features were also selected in a multivariate model integrating other clinical and histological features, proving their independent prognostic value. The utility of this integrated approach to biomarker quantification was demonstrated by predicting prostate cancer disease progression within eight years after a radical prostatectomy.
- predictive features are provided that are combinations of other features, for example, biomarker features with gland morphology features.
- the combined features may adapt the prognostic weight of other features with particular morphological architecture of the tissue image.
- AR biomarker intensity values are generated and combined with ring features for each ring in an image. The combined AR biomarker and ring values for each ring are then aggregated over, for example, the entire tissue image using a Na ⁇ ve Bayes probability or other method.
- features may be localized per ring.
- features may be multiplied by one or more features within a morphologic parameter set (e.g., Gleason triangle components).
- the features may be combined by, for example, multiplying the feature values (e.g., first converting the feature values into probability values and then combining them by multiplying their Na ⁇ ve Bayes probability values).
- this approach may involve calculating the value of a feature at each ring in an image.
- the process of calculating the feature value at each ring may take into account information from the all or some part of the tissue image (e.g., the average epithelial value, the maximum stroma value, and the image intensity value).
- Example 1 Per Gland Relative Rise AR value at 70% (ARRR70) is calculated from the value of the 70% of the histogram of AR values per ring and the value of the 70% of the histogram of AR value in all of the stroma. It is further normalized by a ratio, N, which is a function of the number of nuclei in the ring.
- ARRR ⁇ 70 AR 70 % rise in ring / AR 70 % rise in stroma ⁇ Sqrt ⁇ N / N - 1
- Ki67PR Per Gland Ki67 Positive Ratio
- morphologic parameters provide a partial classification of a ring into two or more morphologic categories, where the sum of the partial classification values obtained equals 1.
- the morphologic parameter "Gleason triangle” includes (e.g., consists of) three components: “pattern 3", “pattern 4 fragmented” and “pattern 4 sheet” as shown in Table 17 below. These components characterize different aspects of the morphology of the glandular region. Each ring classified using the Gleason triangle may have three component classification values which sum to 1. Two examples are shown in the table. In the first example the region has "s" partial classification value in the range 0 to 1 (alternatively, has “s” partial membership) to the "pattern 3" component of the Gleason triangle. It also has "1-s" partial classification value to the "pattern 4 sheet” component and "0" classification value to the "pattern 4 fragmented” component.
- the second region has "0", "s”, and "1-s” partial classification values to "pattern 3", "pattern 4 fragmented” and “partial 4 sheet” components, respectively.
- Isolated rings may have a high “s” value while fused rings or sheets may have a low “s” value.
- "s” could be the 'stouch', 'ltouch', or similar feature value described above in connection with the Ring Features.
- Table 17 - Description of Gleason triangle features Pattern 3 Pattern 4 fragmented Pattern 4 sheet Region Type s3 s4f s4s 1 s 0 1-s 2 0 s 1-s
- Combining features in some embodiments of the present invention, according to this approach there may be one or more (e.g., four) different schemes for combination of feature values, as illustrated below in connection with Table 18. These may include: localization per gland, localization per image, na ⁇ ve Bayes per ring, and na ⁇ ve Bayes per image.
- the schemes may make use of a technique that converts a prognostic feature into an approximate event probability by a least squares linear fit of the feature to 0 (non-event) or 1 (event).
- An alternative scheme may replace 0 and 1 by the event time. When the event time is unknown or censored, an iterative scheme can update the event times subject to the censoring constraints to optimize the outcome probability.
- this linear rescaling of the feature does not change the concordance index (CI) or the prognostic value of the feature, but allows the feature to be treated as a probability value.
- Example 1 Localizing per ring ARRR70. This involves multiplying the ring values of ARRR70, by each of the three morphology components (s3, s4f, and s4s). A weighted average of the resultant AR components is then taken over the image as shown in Table 4 - "Ring Feature Statistics", using the nuclei area as a weight function and normalizing over region types 1 and 2. A least squares fit of these three components to 0 (non-event) or 1 (event) creates a probability score which is the output feature value.
- Example 2 Localizing per image ARRR70. This involves calculating the weighted average of the ARRR70 per ring feature over the entire image, and the weighted average of the Gleason triangle components per ring over the entire image.
- the weighting method here uses nuclei area as a weight and normalizes over region types 1 and 2.
- the weighted average of ARRR70 and each of the three morphology components are multiplied to obtain three values.
- Example 4 Na ⁇ ve Bayes per image ARRR70. This involves calculating the weighted average of the ARRR70 per ring feature over the entire image, and the weighted average of the Gleason triangle components per ring over the entire image as in Example 2. The weighted average of ARRR70 and each of the three Gleason components are multiplied to obtain three values which are separately converted into three probability scores (p3, p4f, p4s). The three probability scores are then combined assuming the non-event probabilities are independent as in Example 3.
- Example 5 Localizing per image 'minimum spanning tree (MST) proportional edge 3' feature which is described in above-incorporated Donovan et al., "Personalized Prediction of Tumor Response and Cancer Progression from the Prostate Needle Biopsy," Journal of Urology, 2009, 182:1, 125-132 .
- This involves calculating the weighted average of the 'MST proportional edge 3 features' per ring over the entire image, and the weighted average of the Gleason triangle components per ring over the entire image.
- the weighting method here uses nuclei area as a weight and normalizes over region types 1 and 2.
- the weighted average of 'MST proportional edge 3' feature and each of the three morphology components are multiplied to obtain three values.
- Example 6 Localizing per image energy feature which is described above in connection with FIG. 6C . This involves calculating the weighted average of the energy features per ring over the entire image, and the weighted average of the Gleason triangle components per ring over the entire image.
- the weighting method here uses nuclei area as a weight and normalizes over region types 1 and 2.
- the weighted average of the energy feature and each of the three morphology components are multiplied to obtain three values.
- Example 7 Localizing per image a high molecular weight cytokeratin (HMWCK) feature.
- HMWCK is a biomarker whose absence in epithelial units defines invasive cancer. This involves calculating the weighted average of the HMWCK feature per ring over the entire image, and the weighted average of the Gleason triangle components per ring over the entire image.
- the weighting method here uses nuclei area as a weight and normalizes over region types 1 and 2.
- the weighted average of the HMWCK feature and each of the three morphology components are multiplied to obtain three values.
- the triple ["s", “b”, “sb”] (where “s” is a morphological component and “b” is a biomarker or other feature and “sb” is their product) could be used.
- This morphological parameter set can be utilized with the four schemes described above.
- the "Localized per image” scheme creates a bilinear interpolation of "s" and "b” probability scores. This is shown in FIG. 22B , which shows an example of bilinear feature combination.
- FIG. 22B has been included herein in black and white for ease of reproduction. Differing prognostic values of the biomarker at low and high values of the morphological feature can be seen as different slopes of the surface at low and high values.
- FIG. 23A is a flowchart 2300 of illustrative stages involved in assessing the performance of one or more segmentation algorithms according to some embodiments of the present invention.
- process 2300 may operate without the use of ground-truth images. This is in contrast to prior approaches for segmentation evaluation, which usually involve evaluating a segmentation result using one-to-one segmentation object comparison to manually-obtained, known ground-truth, and which assume that the ground-truth images are accurate, reliable and representative of the entire image set. These assumptions frequently are not met in applications such as image cytometry where ground-truth delineation is tedious and only a handful of ground-truth images are used in practice.
- images e.g., tissue images
- stability analysis may be used to select predictive or prognosis features for use in, for example, a predictive model.
- An input image may be received at stage 2302 (e.g., an input image resulting from preprocessing according to process 200 ( FIG. 2 )).
- one or more perturbed variants of an image of tissue are generated by applying a perturbation (e.g., slight linear blur) to the image.
- a perturbation e.g., slight linear blur
- FIG. 24 shows an original image (top, left) and a phantom image (bottom, left) having different blur and variance parameters.
- the original and perturbed (e.g., slightly blurred) images are then segmented using one or more segmentation processes.
- statistical stability analysis may be applied to multiple, different segmentation processes under consideration to rank the stability of such segmentation approaches.
- the most stable segmentation approach is selected for use in the development of predictive models and/or evaluation of tissue images for new patients to be evaluated by existing models.
- a match between the segmentation output of the original image to the segmentation output of each of its slightly perturbed variants is then evaluated to assess stability and produce one or more match metrics.
- 48 realistic phantom images obtained from actual biopsy prostate cancer tissue were utilized. The images contained only cancer tissue as all non-cancerous regions were previously masked out.
- Table 19 below provides a comparison of the approach for segmentation evaluation according to some embodiments of the present invention to traditional ground truth based validation.
- Embodiments of the present approach arise from, for example, the observation that segmentation errors can be classed as statistical or structural. Statistical errors reflect failure to account for random variations in pixel values while structural errors result from inadequate image description models. Observations show that statistical errors predominate image analysis, for example, in cytometry.
- Ground-truth images were created for each of 48 phantom images using the process shown in FIG. 23D .
- Four different segmentation approaches with varying, and large, performance differences were evaluated. The purpose was to see how well the statistical perturbation method would distinguish the performance of these approaches using their segmentations of the phantom images.
- For each segmentation approach-image pair a ground truth match score and four different statistical validation scores were obtained. Analysis of the results of this showed that statistical validation and ground-truth validation scores correlate in over 96% of cases.
- the statistical validation approach reduces segmentation review time and effort by over 99% and enables assessment of segmentation quality long after an algorithm has been deployed.
- DAPI and CK18 emission images were captured using a Nuance multispectral camera at 20X by 10X resolution.
- Non-cancer tissue regions of the DAPI-CK18 images were digitally masked out by a pathologist.
- three gray levels were present in the images: the masked area (black), tissue background (dark gray), and tissue foreground (bright regions representing the nuclei or cytoplasm).
- Three ground truth images were created from each of the 16 DAPI-CK18 images using a semi-automatic labeling tool. The generated ground truth was reviewed by two senior pathologists.
- Ground truth generation The ground truth images were obtained using a semi-automatic procedure that involves manual delineation of the boundaries of cells using a border tracing tool. It allows selection of points along the boundary of interest that approximate its spline control points which it uses to calculate the best B-spline approximation of the closed curve. The user can edit the curve by adding or deleting points.
- the shape of the cells in the phantom images were traced from actual prostate cancer cells using the semi-automated tracing tool.
- the texture of the nuclei, cytoplasm and background were sampled from the actual images and registered to the ground truth images. Care was taken replicate any texture variations along the border of the actual images on the phantoms.
- FIG. 24 shows the actual images, labeled ground truth mask and two of the three phantom images generated from the texture of the actual images and the ground truth mask.
- the top, left image is of actual prostate cancer tissue used to generate the phantom images.
- the top, right image is a labeled ground truth mask obtained by tracing nuclei from the actual prostate cancer image.
- the bottom right and left images are phantom images obtained from the images above, respectively.
- the phantom images have different blur and variance parameters.
- FIGS. 25A-25D show four different image processing and cellular segmentation approaches according to some embodiments of the present invention. These approaches included modular components for binarization (of the nucleus image), binarization (of the cytoplasm image), seed-detection (of the nucleus image), size estimation (of the nucleus image), segmentation (of the nucleus image), segmentation (of the cytoplasm image), edge-refinement (of the cytoplasm image), pre-processing (of the nucleus image), hole-filling (of the cytoplasm image), and artifact removal (of the nucleus image) using, for example, the corresponding processes for these modular components described above (e.g., pre-processing as set forth in process 200 ( FIG. 2 )).
- pre-processing as set forth in process 200 ( FIG. 2 )
- the approach shown in FIG. 25A was the simplest including (e.g., consisting of) binarization, seed-detection, size estimation and segmentation of the nucleus image and parallel binarization, edge-refinement and segmentation of the cytoplasm image.
- the approach shown in FIG. 25B has in addition a pre-processing step including (e.g., consisting of) non-uniformity correction of the original DAPI image (described in detail above according to some embodiments).
- the approach shown in FIG. 25C does not utilize the pre-processing step but uses the nucleus mask to fill holes in the cytoplasm mask.
- the approach shown in FIG. 25D contains all the foregoing steps, which are described above according to various embodiments.
- FIGS. 25E-F show another image processing and cellular segmentation approach according to another embodiment of the present invention, which includes an iterative size estimation process.
- the nuclei e.g., DAPI
- the nuclei segmentation and the binarized and edge-refined cytoplasm (e.g., CK18) image are used to fill holes in the cytoplasm mask. Cytoplasm segmentation may use a watershed algorithm.
- the cytoplasm mask may be used to detect candidate nuclei objects that may be artifacts in the nuclei mask.
- Learned characteristics of these objects may be used in artifact detection. Illustrative stages involved in the iterative process are shown in FIG. 25F .
- an input nucleus image e.g., DAPI image
- an initial estimate of the nuclei seeds contained in a seed image is used in a size estimation process that produces, for example, an estimate of the size of each nucleus. This estimate may be used in a clustering process to produce an initial estimate of the nucleus boundaries.
- a stability analysis process e.g., shown in FIG. 23B ) creates a measure of the stability of each nucleus boundary, for example, in the form of an error mask.
- a decision process assesses the error mask and adjusts the nucleus boundaries until, for example, an acceptable partitioning as described by the values in the error mask is achieved.
- the output of the process is a nucleus segmentation mask and an error mask.
- an input image may be perturbed to create one or more variants.
- the input image and all its variants may be segmented by a segmentation process.
- the output obtained from segmenting each of the variants may be compared to the output obtained from segmenting the input image using a match metric (e.g. Dice similarity coefficient). Mismatches created in this comparison stage are output, for example, in the form of an error image.
- Partition stability approach Illustrative stages of the process are shown in FIG. 23C .
- an input image may be segmented and/or partitioned by a partitioning system.
- the partitioning system may perform morphological operations such as, for example, morphological erosion and/or morphological dilation, to create one or more of a foreground, foreground band and a background.
- the texture feature used may be energy, for example, defined as: ⁇ i , j p ⁇ i ⁇ j 2 where, p(i,j) is obtained from the gray-level co-occurrence matrix that calculates how often a pixel with gray-level (grayscale intensity) value i occurs horizontally adjacent to a pixel with the value j .
- One or more arithmetic operations e.g., division or subtraction
- the resulting texture metrics in two or more partitions may be compared and the output of this comparison may be utilized as a measure of stability.
- Partition Stability Validation Metrics In some embodiments of the present invention, one or more of the metrics may be used to rank segmented images.
- a background texture metric for example, background texture of epithelial cytoplasm objects per image, may be
- a band texture metric for example, average texture of the band around each epithelial cytoplasm object per image, may be used to rank segmented images. In some embodiments, this metric may be computed as follows:
- a band texture metric for example, average texture of the band around each epithelial cytoplasm object per image, may be used to rank segmented images. In some embodiments, this metric may be computed as follows:
- a background ratio texture metric for example, the ratio of background texture of the original cytoplasm (e.g., CK18) background divided by the dilated (e.g,, CK18) background, may be used to rank segmented images.
- this metric may be computed as follows:
- Results Analysis For each of the 48-by-4 image-algorithm pairs, a ground-truth match metric (using the classic Dice metric) and four stability validation metrics (described above) were calculated. The correlation between each of the 48-by-4 ground truth scores for each image-algorithm pair to the corresponding stability validation score were also calculated for each metric. Using 48 images and 4 algorithms, it was determined whether the stability-based validation method could pick the better of every algorithm pair for every image, as judged by accuracy-based validation. Results showed this to be true in over 96% of cases. It exaggerated the accuracy difference in segmentation results judged similar by ground-truth validation in 4% of cases. The method reduced segmentation review effort and time by over 99% and consistently detected poor segmentation outputs.
- FIG. 26A shows images subject to stability analysis according to some embodiments of the present invention.
- segmentation scoring was performed and the image on the left has a good segmentation with a high stability score, whereas the image on the right has poor segmentation that resulted in a low statistical stability score.
- the metrics described in connection with Table 20 were used to score these images.
- bug detection was performed and the effect of a statistical estimation bug in one of the segmentation approaches yielded the image on the left which had a poor score, whereas the image on the right was created with the same segmentation approach after the estimation bug was fixed and it received a correspondingly higher validation score.
- the images in FIG. 26A were originally generated in color but have been provided herein in black and white for ease of reproduction.
- FIG. 26A were originally generated in color but have been provided herein in black and white for ease of reproduction.
- FIG. 26B illustrates examples of several overlapping nuclei (on right) and few overlaps (on left), where the DAPI, CK18, and segmentation outputs are shown from top to bottom.
- FIG. 26C illustrates a good segmentation output corresponding to a case with a high stability score (right column), and a poor segmentation result producing a low stability score, where the DAPI, CK18, and segmentation outputs are shown from top to bottom.
- the average statistics of the statistical stability metric 1 and the three partition stability metrics were calculated for biopsy and prostatectomy tissue images and shown in Table 22 below. Due to laboratory process differences, prostatectomy tissue images had higher background noise than biopsy tissue images. This corresponded to lower mean metric values. Further, the standard deviations of values for the biopsy images were lower than those of the prostatectomy images, indicating their segmentation was superior on average.
- S-DSC stability-based Dice correlation coefficient
- BGT background texture
- BNT band texture
- BGRT the ratio of background texture to combined texture of the foreground and band, in other words, the texture in the background of original versus dilated cytoplasm backgrounds.
- Table 23 below illustrates the improvement in nuclei features obtained when, for example, the lower 30% of images with low statistical stability scores are pruned (eliminated) from the dataset.
- Table 23 shows the concordance index of minimum spanning tree nuclei features obtained from 926 prostate biopsy images before and after such pruning.
- Table 23 Mean Length Proportional Edge 1 Proportional Edge 2 Proportional Edge 3 Before pruning 0.56 0.68 0.69 0.67 After pruning 0.58 0.72 0.74 0.69
- one or both of statistical and partition stability can be applied to the task of ranking images by segmentation.
- Table 22 above shows average values of statistical and partition stability metrics in the biopsy and prostatectomy sets.
- the computer system may be any suitable apparatus, system or device.
- the computer system may be a programmable data processing apparatus, a general purpose computer, a Digital Signal Processor or a microprocessor.
- the computer program may be embodied as source code and undergo compilation for implementation on a computer, or may be embodied as object code, for example.
- the computer program can be stored on a carrier medium in computer usable form, such as a non-transitory computer readable storage medium, which is also envisaged as an aspect of the present invention.
- the carrier medium may be solid-state memory, optical or magneto-optical memory such as a readable and/or writable disk for example a compact disk (CD) or a digital versatile disk (DVD), or magnetic memory such as disc or tape, and the computer system can utilize the program to configure it for operation.
- the computer program may also be supplied from a remote source embodied in a carrier medium such as an electronic signal, including a radio frequency carrier wave or an optical carrier wave.
- Patent No. 6,995,020, issued February 7, 2006 a continuation-in-part of U.S. Patent Application No. 10/991,240, filed November 17, 2004 , which claims priority from U.S. Provisional Patent Application No. 60/520,939 filed November 18,2003 ; and claims priority from U.S. Provisional Patent Application Nos. 60/552,497, filed March 12, 2004 , 60/577,051, filed June 4, 2004 , 60/600,764, filed August 11, 2004 , 60/620,514, filed October 20, 2004 , 60/645,158, filed January 18, 2005 , and 60/651, 779, filed February 9, 2005 . Also incorporated herein by reference are Ajemba et al., "Integrated segmentation of cellular structures," Proc.
Landscapes
- Engineering & Computer Science (AREA)
- Physics & Mathematics (AREA)
- Theoretical Computer Science (AREA)
- General Physics & Mathematics (AREA)
- Computer Vision & Pattern Recognition (AREA)
- Health & Medical Sciences (AREA)
- General Health & Medical Sciences (AREA)
- Quality & Reliability (AREA)
- Nuclear Medicine, Radiotherapy & Molecular Imaging (AREA)
- Radiology & Medical Imaging (AREA)
- Medical Informatics (AREA)
- Computing Systems (AREA)
- Mathematical Physics (AREA)
- Probability & Statistics with Applications (AREA)
- Life Sciences & Earth Sciences (AREA)
- Biomedical Technology (AREA)
- Molecular Biology (AREA)
- Multimedia (AREA)
- Image Analysis (AREA)
- Image Processing (AREA)
- Investigating Or Analysing Biological Materials (AREA)
Applications Claiming Priority (6)
| Application Number | Priority Date | Filing Date | Title |
|---|---|---|---|
| US40065710P | 2010-07-30 | 2010-07-30 | |
| US40064210P | 2010-07-30 | 2010-07-30 | |
| US45598810P | 2010-10-28 | 2010-10-28 | |
| US45600910P | 2010-10-28 | 2010-10-28 | |
| PCT/US2011/046149 WO2012016242A2 (en) | 2010-07-30 | 2011-08-01 | Systems and methods for segmentation and processing of tissue images and feature extraction from same for treating, diagnosing, or predicting medical conditions |
| EP11749618.2A EP2599055A2 (de) | 2010-07-30 | 2011-08-01 | Systeme und verfahren zur segmentierung und verarbeitung von gewebebildern und merkmalsextraktion daraus zur behandlung, diagnose oder vorhersagge von erkrankungen |
Related Parent Applications (1)
| Application Number | Title | Priority Date | Filing Date |
|---|---|---|---|
| EP11749618.2A Division EP2599055A2 (de) | 2010-07-30 | 2011-08-01 | Systeme und verfahren zur segmentierung und verarbeitung von gewebebildern und merkmalsextraktion daraus zur behandlung, diagnose oder vorhersagge von erkrankungen |
Publications (3)
| Publication Number | Publication Date |
|---|---|
| EP2779089A2 true EP2779089A2 (de) | 2014-09-17 |
| EP2779089A3 EP2779089A3 (de) | 2014-12-31 |
| EP2779089B1 EP2779089B1 (de) | 2018-11-14 |
Family
ID=44533139
Family Applications (2)
| Application Number | Title | Priority Date | Filing Date |
|---|---|---|---|
| EP14160371.2A Active EP2779089B1 (de) | 2010-07-30 | 2011-08-01 | Systeme und Verfahren zur Segmentierung und Verarbeitung von Gewebebildern und Merkmalsextraktion daraus zur Behandlung, Diagnose oder Vorhersage von Erkrankungen |
| EP11749618.2A Withdrawn EP2599055A2 (de) | 2010-07-30 | 2011-08-01 | Systeme und verfahren zur segmentierung und verarbeitung von gewebebildern und merkmalsextraktion daraus zur behandlung, diagnose oder vorhersagge von erkrankungen |
Family Applications After (1)
| Application Number | Title | Priority Date | Filing Date |
|---|---|---|---|
| EP11749618.2A Withdrawn EP2599055A2 (de) | 2010-07-30 | 2011-08-01 | Systeme und verfahren zur segmentierung und verarbeitung von gewebebildern und merkmalsextraktion daraus zur behandlung, diagnose oder vorhersagge von erkrankungen |
Country Status (6)
| Country | Link |
|---|---|
| US (3) | US9286505B2 (de) |
| EP (2) | EP2779089B1 (de) |
| CA (3) | CA2807144C (de) |
| ES (1) | ES2711196T3 (de) |
| PT (1) | PT2779089T (de) |
| WO (1) | WO2012016242A2 (de) |
Cited By (4)
| Publication number | Priority date | Publication date | Assignee | Title |
|---|---|---|---|---|
| CN107465771A (zh) * | 2017-09-20 | 2017-12-12 | 广东工业大学 | 一种网络地址段划分方法及系统 |
| WO2018186789A1 (en) * | 2017-04-06 | 2018-10-11 | Cadess Medical Ab | Segmentation of histological tissue images into glandular structures for prostate cancer tissue classification |
| EP3477586A4 (de) * | 2016-06-23 | 2019-05-01 | Konica Minolta, Inc. | Bildverarbeitungsvorrichtung, bildverarbeitungsverfahren und bildverarbeitungsprogramm |
| CN110298811A (zh) * | 2018-03-21 | 2019-10-01 | 北京大学 | 图像的预处理方法、装置、终端以及计算机可读存储介质 |
Families Citing this family (115)
| Publication number | Priority date | Publication date | Assignee | Title |
|---|---|---|---|---|
| US9773307B2 (en) * | 2010-01-25 | 2017-09-26 | Amcad Biomed Corporation | Quantification and imaging methods and system of the echo texture feature |
| JP5665655B2 (ja) * | 2011-05-24 | 2015-02-04 | 株式会社日立製作所 | 画像処理装置及び方法 |
| US9192354B2 (en) * | 2011-06-07 | 2015-11-24 | Konica Minolta, Inc. | Ultrasound diagnostic apparatus and ultrasound diagnostic method |
| RU2476932C1 (ru) * | 2012-03-30 | 2013-02-27 | Федеральное государственное бюджетное учреждение науки Вычислительный центр им. А.А. Дородницына Российской академии наук | Автоматизированная система анализа биомедицинских микроизображений для обнаружения и характеризации информативных объектов заданных классов на неоднородном фоне |
| WO2013161155A1 (ja) * | 2012-04-23 | 2013-10-31 | 日本電気株式会社 | 画像計測装置、画像計測方法、および、画像計測用プログラム |
| US9036888B2 (en) * | 2012-04-30 | 2015-05-19 | General Electric Company | Systems and methods for performing quality review scoring of biomarkers and image analysis methods for biological tissue |
| EP2845139A2 (de) * | 2012-04-30 | 2015-03-11 | General Electric Company | Systeme und verfahren zur durchführung einer korrelationsanalyse klinischer ergebnisse und der eigenschaften von biologischem gewebe |
| US20140064596A1 (en) * | 2012-08-29 | 2014-03-06 | Micron Technology, Inc. | Descriptor guided fast marching method for analyzing images and systems using the same |
| US10262330B2 (en) * | 2013-01-04 | 2019-04-16 | PlaceIQ, Inc. | Location-based analytic platform and methods |
| RU2533876C2 (ru) * | 2013-01-23 | 2014-11-20 | Олег Владимирович Чикало | Способ бинаризации медицинских изображений |
| US9235890B2 (en) | 2013-03-15 | 2016-01-12 | Yahoo! Inc. | Identifying regions characterized by labeled measurements |
| US11080318B2 (en) * | 2013-06-27 | 2021-08-03 | Kodak Alaris Inc. | Method for ranking and selecting events in media collections |
| CN105409207A (zh) * | 2013-07-15 | 2016-03-16 | 微软技术许可有限责任公司 | 基于特征的图像集合压缩 |
| CN104346801B (zh) * | 2013-08-02 | 2018-07-20 | 佳能株式会社 | 图像构图评估装置、信息处理装置及其方法 |
| TWI496112B (zh) * | 2013-09-13 | 2015-08-11 | Univ Nat Cheng Kung | 細胞影像分割方法以及核質比評估方法 |
| WO2015054295A1 (en) * | 2013-10-07 | 2015-04-16 | Arizona Board Of Regents On Behalf Of Arizona State University | Kidney glomeruli measurement systems and methods |
| US9002085B1 (en) * | 2013-10-22 | 2015-04-07 | Eyenuk, Inc. | Systems and methods for automatically generating descriptions of retinal images |
| US9412005B2 (en) * | 2013-10-25 | 2016-08-09 | Gooch & Housego Plc | Use of error image for unmixing artifact removal in linear spectral unmixing |
| CN103530887B (zh) * | 2013-10-29 | 2016-02-03 | 重庆大学 | 一种基于多特征融合的河面图像区域分割方法 |
| US9626583B2 (en) * | 2013-12-12 | 2017-04-18 | University of Pittsburg—Of the Commonwealth System of Higher Education | Automated epithelial nuclei segmentation for computational disease detection algorithms |
| JP5804220B1 (ja) * | 2014-03-27 | 2015-11-04 | コニカミノルタ株式会社 | 画像処理装置および画像処理プログラム |
| EP3127084B1 (de) * | 2014-04-03 | 2020-07-15 | Koninklijke Philips N.V. | Vorrichtung zur bildbearbeitung- and analyse |
| WO2015189264A1 (en) | 2014-06-10 | 2015-12-17 | Ventana Medical Systems, Inc. | Predicting breast cancer recurrence directly from image features computed from digitized immunohistopathology tissue slides |
| US10152789B2 (en) * | 2014-07-25 | 2018-12-11 | Covidien Lp | Augmented surgical reality environment |
| EP2985719A1 (de) * | 2014-08-15 | 2016-02-17 | IMEC vzw | System und Verfahren für Zellerkennung |
| WO2016029208A1 (en) * | 2014-08-22 | 2016-02-25 | University Of South Florida | System and method for automated stereology of cancer |
| WO2016075096A1 (en) * | 2014-11-10 | 2016-05-19 | Ventana Medical Systems, Inc. | Classifying nuclei in histology images |
| US10943350B2 (en) * | 2015-02-25 | 2021-03-09 | London Health Science Center Research Inc. | Automated segmentation of histological sections for vasculature quantification |
| EP3286337A4 (de) | 2015-04-23 | 2018-12-12 | Cedars-Sinai Medical Center | Automatische abgrenzung von kernen zum dreidimensionalen (3d) high-content-screening |
| AU2016313775A1 (en) * | 2015-09-02 | 2018-02-08 | Ventana Medical Systems, Inc. | Automated analysis of cellular samples having intermixing of analytically distinct patterns of analyte staining |
| US9779499B2 (en) * | 2015-09-18 | 2017-10-03 | Definiens Ag | Grading of glandular tissue cancer by detailed image analysis of stained tissue slices |
| US9613254B1 (en) | 2015-09-30 | 2017-04-04 | General Electric Company | Quantitative in situ characterization of heterogeneity in biological samples |
| US10019796B2 (en) * | 2015-10-16 | 2018-07-10 | General Electric Company | System and method for blood vessel analysis and quantification in highly multiplexed fluorescence imaging |
| US20170119316A1 (en) * | 2015-10-30 | 2017-05-04 | Orthosensor Inc | Orthopedic measurement and tracking system |
| CN108352069B (zh) * | 2015-12-15 | 2022-11-25 | 徕卡生物系统公司 | 自动核分割 |
| CN106910180B (zh) * | 2015-12-22 | 2019-08-20 | 成都理想境界科技有限公司 | 一种图像质量评估方法及装置 |
| EP3408796A4 (de) * | 2016-01-28 | 2019-10-16 | Letterie, Gerard | Automatisierte bildanalyse zur beurteilung des reproduktionspotenzials von menschlichen oozyten und pronukleären embryonen |
| US10846509B2 (en) * | 2016-06-10 | 2020-11-24 | Luminex Corporation | Method to combine brightfield and fluorescent channels for cell image segmentation and morphological analysis using images obtained from imaging flow cytometer (IFC) |
| US20180053297A1 (en) * | 2016-08-18 | 2018-02-22 | Ohio University | Methods and Apparatuses for Detection of Abnormalities in Low-Contrast Images |
| WO2018049064A1 (en) | 2016-09-08 | 2018-03-15 | Abbott Laboratories | Automated body fluid analysis |
| US10430943B2 (en) * | 2016-10-07 | 2019-10-01 | Sony Corporation | Automated nuclei area/number estimation for IHC image analysis |
| JP6968177B2 (ja) | 2016-12-22 | 2021-11-17 | ベンタナ メディカル システムズ, インコーポレイテッド | 一次染色および免疫組織化学画像に基づくコンピュータ採点 |
| US10332252B2 (en) * | 2016-12-29 | 2019-06-25 | General Electric Company | Slope constrained cubic interpolation |
| KR102622542B1 (ko) * | 2017-02-21 | 2024-01-10 | 주식회사 고영테크놀러지 | 의료 이미징 디바이스에 의해 캡처된 조직학적 이미지를 프로세싱하기 위한 방법 및 장치 |
| WO2018209057A1 (en) | 2017-05-11 | 2018-11-15 | The Research Foundation For The State University Of New York | System and method associated with predicting segmentation quality of objects in analysis of copious image data |
| US10650929B1 (en) | 2017-06-06 | 2020-05-12 | PathAI, Inc. | Systems and methods for training a model to predict survival time for a patient |
| EP3662443A2 (de) | 2017-08-04 | 2020-06-10 | Ventana Medical Systems, Inc. | Automatisierte verfahren und systeme zur detektion von zellen auf bildern von gefärbten proben |
| JP2019058073A (ja) * | 2017-09-25 | 2019-04-18 | オリンパス株式会社 | 画像処理装置、細胞認識装置、細胞認識方法および細胞認識プログラム |
| US10803328B1 (en) * | 2017-11-15 | 2020-10-13 | Uatc, Llc | Semantic and instance segmentation |
| US10402623B2 (en) * | 2017-11-30 | 2019-09-03 | Metal Industries Research & Development Centre | Large scale cell image analysis method and system |
| KR101998397B1 (ko) * | 2017-12-22 | 2019-07-09 | 한국기술교육대학교 산학협력단 | 작업 공간 모델링에서 뎁스 이미지를 이용한 버텍스 최적화 방법 및 시스템 |
| CN109993750B (zh) * | 2017-12-29 | 2020-12-25 | 中国科学院深圳先进技术研究院 | 一种手腕骨的分割识别方法及系统、终端及可读存储介质 |
| JP7108715B2 (ja) * | 2018-01-25 | 2022-07-28 | パー ホール | 乳房障害の治療をモニターするための組成物および方法 |
| US11132801B2 (en) | 2018-02-02 | 2021-09-28 | Centerline Biomedical, Inc. | Segmentation of three-dimensional images containing anatomic structures |
| US10915729B2 (en) * | 2018-02-20 | 2021-02-09 | The Regents Of The University Of Michigan | Three-dimensional cell and tissue image analysis for cellular and sub-cellular morphological modeling and classification |
| CN108550129B (zh) * | 2018-04-20 | 2019-04-09 | 北京航天宏图信息技术股份有限公司 | 基于地理模板的匀色方法及装置 |
| CN108961208B (zh) * | 2018-05-21 | 2021-04-27 | 江苏康尚生物医疗科技有限公司 | 一种聚集白细胞分割计数系统及方法 |
| CN112368705B (zh) * | 2018-05-24 | 2024-07-12 | 匹兹堡大学高等教育联邦体系 | 从空间多参数细胞和亚细胞成像数据预测癌症复发 |
| IT201800005848A1 (it) | 2018-05-30 | 2019-11-30 | Metodo per segmentazione e classificazione automatica di oggetti rilevanti in un’immagine digitale di un campione di tessuto | |
| US11961211B2 (en) * | 2018-05-31 | 2024-04-16 | Deeplook, Inc. | Radiomic systems and methods |
| US11461916B2 (en) | 2018-06-15 | 2022-10-04 | Pixis Consulting, Llc | Methods and systems for recognizing geometric units in a computer image |
| US10430708B1 (en) * | 2018-08-17 | 2019-10-01 | Aivitae LLC | System and method for noise-based training of a prediction model |
| EP3629240B1 (de) * | 2018-09-07 | 2023-08-23 | Panasonic Intellectual Property Corporation of America | Generative adversariale netzwerke zur lokalen rauschentfernung aus einem bild |
| CN112823376B (zh) * | 2018-10-15 | 2025-09-05 | 文塔纳医疗系统公司 | 图像增强以实现改善的核检测和分割 |
| CN111161275B (zh) * | 2018-11-08 | 2022-12-23 | 腾讯科技(深圳)有限公司 | 医学图像中目标对象的分割方法、装置和电子设备 |
| US12260607B2 (en) | 2018-12-15 | 2025-03-25 | The Brigham And Women's Hospital, Inc. | Augmented digital microscopy for lesion analysis |
| CN109934812B (zh) * | 2019-03-08 | 2022-12-09 | 腾讯科技(深圳)有限公司 | 图像处理方法、装置、服务器及存储介质 |
| JP7450942B2 (ja) | 2019-03-26 | 2024-03-18 | 国立大学法人大阪大学 | 画像解析方法、画像解析プログラム、記録媒体、画像解析装置、画像解析システム |
| US11521316B1 (en) | 2019-04-03 | 2022-12-06 | Kentucky Imaging Technologies | Automatic extraction of interdental gingiva regions |
| WO2020198779A1 (en) | 2019-04-04 | 2020-10-08 | Presagen Pty Ltd | Method and system for selecting embryos |
| US12125209B2 (en) * | 2019-06-18 | 2024-10-22 | The Hong Kong Polytechnic University | Method and system for segmenting overlapping cytoplasm in medical image |
| JP7148462B2 (ja) * | 2019-07-19 | 2022-10-05 | 京セラ株式会社 | 画像認識評価プログラム、画像認識評価方法、評価装置及び評価システム |
| CN114846507B (zh) | 2019-09-25 | 2025-10-28 | 阿斯泰刻有限公司 | 用于使用人工智能(ai)模型进行非侵入性基因检测的方法和系统 |
| US11361574B2 (en) * | 2019-10-23 | 2022-06-14 | Bendix Commercial Vehicle Systems Llc | System and method for monitoring for driver presence and position using a driver facing camera |
| CN111062962B (zh) * | 2019-12-06 | 2022-09-27 | 昆明理工大学 | 一种基于差分搜索算法的多阈值超声图像分割方法 |
| CN111192251B (zh) * | 2019-12-30 | 2023-03-28 | 上海交通大学医学院附属国际和平妇幼保健院 | 基于水平集图像分割的卵泡超声处理方法和系统 |
| CN111340773B (zh) * | 2020-02-24 | 2022-11-22 | 齐鲁工业大学 | 一种视网膜图像血管分割方法 |
| TWI743693B (zh) * | 2020-02-27 | 2021-10-21 | 國立陽明交通大學 | 良性腫瘤發展趨勢評估系統、其伺服計算機裝置及計算機可讀取的儲存媒體 |
| CN111476881A (zh) * | 2020-03-18 | 2020-07-31 | 创业慧康科技股份有限公司 | 基于结构相似性水平集算法的人体组织器官三维重建方法 |
| CN111257348B (zh) * | 2020-03-27 | 2023-02-17 | 河海大学常州校区 | 一种基于机器视觉的led导光板缺陷检测方法 |
| CN111583175B (zh) * | 2020-03-30 | 2024-03-22 | 浪潮通用软件有限公司 | 一种红细胞图像检测方法及设备、介质 |
| CN111583189B (zh) * | 2020-04-16 | 2024-02-27 | 武汉联影智融医疗科技有限公司 | 大脑核团定位方法、装置、存储介质及计算机设备 |
| CN111582111B (zh) * | 2020-04-29 | 2022-04-29 | 电子科技大学 | 一种基于语义分割的细胞各成分分割方法 |
| CN113628157A (zh) * | 2020-05-06 | 2021-11-09 | 德克萨斯大学体系董事会 | 利用病理图像来表征肿瘤微环境的系统和方法 |
| EP3922980B1 (de) * | 2020-06-12 | 2022-08-10 | Sartorius Stedim Data Analytics AB | Computerimplementiertes verfahren, computerprogrammprodukt und system zur datenanalyse |
| US11922709B2 (en) * | 2020-08-24 | 2024-03-05 | Applied Materials, Inc. | Cell detection using segmentation based on nuclear staining and mFISH images |
| US11869125B2 (en) * | 2020-09-30 | 2024-01-09 | Adobe Inc. | Generating composite images with objects from different times |
| CN112330688B (zh) * | 2020-11-02 | 2025-04-15 | 腾讯科技(深圳)有限公司 | 基于人工智能的图像处理方法、装置和计算机设备 |
| KR102654891B1 (ko) * | 2020-12-28 | 2024-04-05 | 세메스 주식회사 | 이상 진단 시스템 및 이상 진단 방법 |
| JP7122017B2 (ja) * | 2020-12-28 | 2022-08-19 | 株式会社APSAM Imaging | 画像解析方法、推定装置、推定システム、制御プログラム、記録媒体 |
| CN112819788B (zh) * | 2021-02-01 | 2023-02-07 | 上海万物新生环保科技集团有限公司 | 一种图像稳定性检测方法及设备 |
| CN113034460B (zh) * | 2021-03-21 | 2022-09-09 | 湖南科迈森医疗科技有限公司 | 子宫内膜腺体密度预估方法 |
| US12299876B2 (en) * | 2021-03-23 | 2025-05-13 | Arizona Board Of Regents On Behalf Of Arizona State University | Deep learning based blob detection systems and methods |
| EP4064179A1 (de) * | 2021-03-24 | 2022-09-28 | Koninklijke Philips N.V. | Maskierung von unerwünschten pixeln in einem bild |
| CN113870182B (zh) * | 2021-08-27 | 2025-05-30 | 厦门理工学院 | 一种带掩膜的大津阈值化方法 |
| CN114037724B (zh) * | 2021-10-18 | 2024-04-09 | 哈尔滨工业大学 | 一种阈值法图像分割的异构并行计算系统、方法及电子设备 |
| CN114119645B (zh) * | 2021-11-25 | 2022-10-21 | 推想医疗科技股份有限公司 | 一种图像分割质量的确定方法、系统、设备及介质 |
| CN114283156B (zh) * | 2021-12-02 | 2024-03-05 | 珠海移科智能科技有限公司 | 一种用于去除文档图像颜色及手写笔迹的方法及装置 |
| CN114648464B (zh) * | 2022-04-05 | 2026-07-17 | 中国科学院上海技术物理研究所 | 图像的修复方法和干细胞图像的分割方法 |
| CN114862877B (zh) * | 2022-05-27 | 2024-03-22 | 四川大学华西医院 | 基于置信度评分的细胞粘连分割方法和装置 |
| CN115082529B (zh) * | 2022-06-30 | 2023-04-14 | 华东师范大学 | 一种大体组织多维信息采集和分析系统与方法 |
| CN116309243A (zh) * | 2022-09-07 | 2023-06-23 | 长沙矿冶研究院有限责任公司 | 选矿实时图像分析系统 |
| CN115761127B (zh) * | 2022-11-16 | 2026-03-10 | 华南农业大学 | 一种植物细胞三角剖分方法 |
| CN116485924B (zh) * | 2023-03-20 | 2023-09-29 | 西安电子科技大学 | 含伪影的光纤线包ct截面图像的二值化方法 |
| CN116580041B (zh) * | 2023-05-30 | 2024-06-18 | 山东第一医科大学附属眼科研究所(山东省眼科研究所、山东第一医科大学附属青岛眼科医院) | 基于voronoi图的角膜内皮细胞边界分割方法和装置 |
| CN116597389B (zh) * | 2023-07-18 | 2023-09-15 | 山东省地质测绘院 | 基于图像处理的地质灾害监测及预警方法 |
| CN116645382B (zh) * | 2023-07-26 | 2023-10-20 | 天津恒宇医疗科技有限公司 | 自适应的血管分割方法及系统 |
| ES3037026A1 (es) * | 2024-03-22 | 2025-09-26 | Sanchez Puebla Rodriguez Miguel Angel | Sistema experto para el analisis morfologico automatico de imagenes de celulas en la microglia de la retina |
| CN119323587B (zh) * | 2024-08-26 | 2025-11-18 | 科大讯飞华南人工智能研究院(广州)有限公司 | 一种医疗影像分割方法 |
| CN119151934B (zh) * | 2024-11-19 | 2025-01-28 | 山东衡昊信息技术有限公司 | 一种基于图像处理的心外术后监控系统及方法 |
| CN120047940B (zh) * | 2025-01-24 | 2026-01-30 | 钢研国际新材料创新中心(深圳)有限公司 | 一种用于金相图像中奥氏体晶粒的智能识别方法 |
| CN120182735B (zh) * | 2025-05-23 | 2025-07-18 | 陕西省人民医院(陕西省临床医学研究院) | 一种外周血细胞形态的全自动分类检测方法 |
| CN120876510B (zh) * | 2025-07-22 | 2026-05-05 | 普宁华侨医院 | 缺血性脑血管病血管造影图像分割分析方法 |
| CN120807494B (zh) * | 2025-09-08 | 2026-02-06 | 珠海行知生物科技有限公司 | 一种基于深度学习的肿瘤细胞图像提取方法及系统 |
| CN122023396B (zh) * | 2026-04-10 | 2026-07-17 | 陕西蔚蓝节能环境科技集团有限责任公司 | 一种基于图像分析的mbr曝气均匀性检测方法及系统 |
Citations (2)
| Publication number | Priority date | Publication date | Assignee | Title |
|---|---|---|---|---|
| US6995020B2 (en) | 2003-07-21 | 2006-02-07 | Aureon Laboratories, Inc. | Methods and compositions for the preparation and use of fixed-treated cell-lines and tissue in fluorescence in situ hybridization |
| US7321881B2 (en) | 2004-02-27 | 2008-01-22 | Aureon Laboratories, Inc. | Methods and systems for predicting occurrence of an event |
Family Cites Families (23)
| Publication number | Priority date | Publication date | Assignee | Title |
|---|---|---|---|---|
| US1059808A (en) | 1912-07-06 | 1913-04-22 | Triumph Voting Machine Co | Operating-lever lock for voting-machines. |
| US6227850B1 (en) | 1999-05-13 | 2001-05-08 | Align Technology, Inc. | Teeth viewing system |
| US6577762B1 (en) * | 1999-10-26 | 2003-06-10 | Xerox Corporation | Background surface thresholding |
| JP4320990B2 (ja) * | 2001-11-30 | 2009-08-26 | セイコーエプソン株式会社 | 画面欠陥検出方法及び装置並びに画面欠陥検出のためのプログラム |
| WO2003095986A1 (en) * | 2002-05-14 | 2003-11-20 | Amersham Biosciences Niagara, Inc. | System and methods for rapid and automated screening of cells |
| US6706605B1 (en) | 2003-03-31 | 2004-03-16 | Texas Instruments Incorporated | Transistor formed from stacked disposable sidewall spacer |
| US7580556B2 (en) * | 2004-01-26 | 2009-08-25 | Drvision Technologies Llc | Image region partitioning using pre-labeled regions |
| JP4949264B2 (ja) * | 2004-11-19 | 2012-06-06 | コーニンクレッカ フィリップス エレクトロニクス エヌ ヴィ | 医療画像データ内の腫瘍境界を自動的に検出及び区分するシステム及び方法 |
| EP1978486B1 (de) * | 2005-05-13 | 2016-12-21 | Tripath Imaging, Inc. | Verfahren zur Bildanalyse auf der Basis von Chromogenabspaltung |
| US8280132B2 (en) * | 2006-08-01 | 2012-10-02 | Rutgers, The State University Of New Jersey | Malignancy diagnosis using content-based image retreival of tissue histopathology |
| DE102007013971B4 (de) * | 2007-03-23 | 2011-07-14 | Fraunhofer-Gesellschaft zur Förderung der angewandten Forschung e.V., 80686 | Verfahren und Vorrichtung zur Ermittlung einer Zellkontur einer Zelle |
| US8417033B2 (en) * | 2007-04-27 | 2013-04-09 | Hewlett-Packard Development Company, L.P. | Gradient based background segmentation and enhancement of images |
| EP2107589B1 (de) | 2008-03-31 | 2012-05-16 | SMA Solar Technology AG | Schaltungsvorrichtung zur Erdung eines Wechselrichters |
| US8472683B2 (en) * | 2008-05-09 | 2013-06-25 | General Electric Company | Motion correction in tomographic images |
| EP2332087B1 (de) * | 2008-07-25 | 2020-04-22 | Fundação D. Anna Sommer Champalimaud E Dr. Carlos Montez Champalimaud | Systeme und verfahren zum behandeln, diagnostizieren und vorhersagen des auftretens eines medizines zustands |
| US9779213B2 (en) * | 2008-07-25 | 2017-10-03 | Fundacao D. Anna Sommer Champalimaud E Dr. Carlos Montez Champalimaud | System for evaluating a pathological stage of prostate cancer |
| US8718340B2 (en) * | 2008-09-03 | 2014-05-06 | Trustees Of The University Of Pennsylvania | System and method for accurate and rapid identification of diseased regions on biological images with applications to disease diagnosis and prognosis |
| EP2391887B1 (de) * | 2009-02-02 | 2020-06-17 | Rutgers, The State University Of New Jersey | Bildbasierte risikobewertung - ein prognostischer prädiktor für überlebensrate und ergebnisse aus digitaler histopathologie |
| KR101058726B1 (ko) * | 2009-11-11 | 2011-08-22 | 삼성전자주식회사 | 조명 성분을 제거하기 위한 이미지 보정 장치 및 방법 |
| US9779283B2 (en) * | 2011-01-05 | 2017-10-03 | The Board Of Trustees Of The University Of Illinois | Automated prostate tissue referencing for cancer detection and diagnosis |
| US9230063B2 (en) * | 2011-01-05 | 2016-01-05 | The Board Of Trustees Of The University Of Illinois | Automated prostate tissue referencing for cancer detection and diagnosis |
| US9235891B2 (en) * | 2011-01-10 | 2016-01-12 | Rutgers, The State University Of New Jersey | Boosted consensus classifier for large images using fields of view of various sizes |
| US9286672B2 (en) * | 2012-01-10 | 2016-03-15 | Rutgers, The State University Of New Jersey | Integrated multivariate image-based method for disease outcome predicition |
-
2011
- 2011-08-01 CA CA2807144A patent/CA2807144C/en active Active
- 2011-08-01 CA CA3010836A patent/CA3010836C/en active Active
- 2011-08-01 PT PT14160371T patent/PT2779089T/pt unknown
- 2011-08-01 ES ES14160371T patent/ES2711196T3/es active Active
- 2011-08-01 WO PCT/US2011/046149 patent/WO2012016242A2/en not_active Ceased
- 2011-08-01 EP EP14160371.2A patent/EP2779089B1/de active Active
- 2011-08-01 EP EP11749618.2A patent/EP2599055A2/de not_active Withdrawn
- 2011-08-01 CA CA3048769A patent/CA3048769A1/en not_active Abandoned
-
2013
- 2013-01-30 US US13/754,097 patent/US9286505B2/en active Active
-
2015
- 2015-12-28 US US14/981,352 patent/US9754152B2/en active Active
-
2017
- 2017-07-26 US US15/660,727 patent/US9971931B2/en active Active
Patent Citations (2)
| Publication number | Priority date | Publication date | Assignee | Title |
|---|---|---|---|---|
| US6995020B2 (en) | 2003-07-21 | 2006-02-07 | Aureon Laboratories, Inc. | Methods and compositions for the preparation and use of fixed-treated cell-lines and tissue in fluorescence in situ hybridization |
| US7321881B2 (en) | 2004-02-27 | 2008-01-22 | Aureon Laboratories, Inc. | Methods and systems for predicting occurrence of an event |
Non-Patent Citations (8)
| Title |
|---|
| AI-KOFAHI ET AL.: "Improved automatic detection and segmentation of cell nuclei in histopathology images", IEEE TRANSACTIONS ON BIOMEDICAL ENGINEERING, vol. 57, no. 4, 2010, XP011343206, DOI: doi:10.1109/TBME.2009.2035102 |
| AJEMBA ET AL.: "Integrated segmentation of cellular structures", PROC. OF THE SPIE MEDICAL IMAGING CONF., ORLANDO FL, vol. 7962, no. 17, 2011 |
| AJEMBA ET AL.: "Stability based validation of cellular segmentation algorithms", PROC. OF THE SPIE MEDICAL IMAGING CONFERENCE., ORLANDO FL, vol. 7962, no. 106, 2011 |
| AL-KOFAHI ET AL.: "Improved automatic detection and segmentation of cell nuclei in histopathology images", IEEE TRANSACTIONS ON BIOMEDICAL ENGINEERING, vol. 57, no. 4, 2010, XP011343206, DOI: doi:10.1109/TBME.2009.2035102 |
| AL-KOFAHI: "Algorithms and Framework for Cellular-Scale Mapping, Doctoral Desertation", 2009, RENSSEALAER POLYTECHNIC INSTITUTE |
| DONOVAN ET AL.: "Personalized Prediction of Tumor Response and Cancer Progression from the Prostate Needle Biopsy", JOURNAL OF UROLOGY, vol. 182, no. 1, 2009, pages 125 - 132 |
| GONZALEZ R. C; WOODS R. E.: "Digital Image Processing", 2002, PRENTICE-HALL INC |
| J.A. SETHIAN: "Level Set Methods and Fast Marching Methods", 1999, CAMBRIDGE UNIVERSITY PRESS |
Cited By (7)
| Publication number | Priority date | Publication date | Assignee | Title |
|---|---|---|---|---|
| EP3477586A4 (de) * | 2016-06-23 | 2019-05-01 | Konica Minolta, Inc. | Bildverarbeitungsvorrichtung, bildverarbeitungsverfahren und bildverarbeitungsprogramm |
| US10890576B2 (en) | 2016-06-23 | 2021-01-12 | Konica Minolta, Inc. | Image processing device, image processing method, and recording medium |
| WO2018186789A1 (en) * | 2017-04-06 | 2018-10-11 | Cadess Medical Ab | Segmentation of histological tissue images into glandular structures for prostate cancer tissue classification |
| CN107465771A (zh) * | 2017-09-20 | 2017-12-12 | 广东工业大学 | 一种网络地址段划分方法及系统 |
| CN107465771B (zh) * | 2017-09-20 | 2020-05-19 | 广东工业大学 | 一种网络地址段划分方法及系统 |
| CN110298811A (zh) * | 2018-03-21 | 2019-10-01 | 北京大学 | 图像的预处理方法、装置、终端以及计算机可读存储介质 |
| CN110298811B (zh) * | 2018-03-21 | 2021-10-26 | 北京大学 | 图像的预处理方法、装置、终端以及计算机可读存储介质 |
Also Published As
| Publication number | Publication date |
|---|---|
| WO2012016242A3 (en) | 2012-05-18 |
| CA2807144C (en) | 2019-05-28 |
| EP2599055A2 (de) | 2013-06-05 |
| US20180025212A1 (en) | 2018-01-25 |
| EP2779089B1 (de) | 2018-11-14 |
| CA3010836C (en) | 2020-09-08 |
| PT2779089T (pt) | 2019-02-19 |
| WO2012016242A2 (en) | 2012-02-02 |
| US9754152B2 (en) | 2017-09-05 |
| US9286505B2 (en) | 2016-03-15 |
| US20160188954A1 (en) | 2016-06-30 |
| CA2807144A1 (en) | 2012-02-02 |
| ES2711196T3 (es) | 2019-04-30 |
| EP2779089A3 (de) | 2014-12-31 |
| CA3048769A1 (en) | 2012-02-02 |
| US20130230230A1 (en) | 2013-09-05 |
| CA3010836A1 (en) | 2012-02-02 |
| US9971931B2 (en) | 2018-05-15 |
Similar Documents
| Publication | Publication Date | Title |
|---|---|---|
| US9971931B2 (en) | Systems and methods for segmentation and processing of tissue images and feature extraction from same for treating, diagnosing, or predicting medical conditions | |
| Veta et al. | Automatic nuclei segmentation in H&E stained breast cancer histopathology images | |
| US8488863B2 (en) | Combinational pixel-by-pixel and object-level classifying, segmenting, and agglomerating in performing quantitative image analysis that distinguishes between healthy non-cancerous and cancerous cell nuclei and delineates nuclear, cytoplasm, and stromal material objects from stained biological tissue materials | |
| US8712142B2 (en) | Method and apparatus for analysis of histopathology images and its application to cancer diagnosis and grading | |
| US8139831B2 (en) | System and method for unsupervised detection and gleason grading of prostate cancer whole mounts using NIR fluorscence | |
| EP3175389B1 (de) | Automatische glanduläre und tubulusdetektion bei histologischem grading von brustkrebs | |
| Kuo et al. | Automatic lung nodule detection system using image processing techniques in computed tomography | |
| Gandomkar et al. | Computer-based image analysis in breast pathology | |
| WO2019048954A1 (en) | DETERMINATION OF COLORING QUALITY OF FABRIC | |
| Goceri et al. | Quantitative validation of anti‐PTBP1 antibody for diagnostic neuropathology use: Image analysis approach | |
| Jothi et al. | Effective segmentation and classification of thyroid histopathology images | |
| Saxena et al. | Study of computerized segmentation & classification techniques: an application to histopathological imagery | |
| Song et al. | New morphological features for grading pancreatic ductal adenocarcinomas | |
| WO2014006421A1 (en) | Identification of mitotic cells within a tumor region | |
| Łowicki et al. | Towards sustainable health-detection of tumor changes in breast histopathological images using deep learning | |
| Veta | Breast cancer histopathology image analysis | |
| Safa'a et al. | Histopathological prostate tissue glands segmentation for automated diagnosis | |
| Alomari et al. | Local binary patterns for stromal area removal in histology images | |
| Ajemba et al. | Iterative approach to joint segmentation of cellular structures | |
| Ajemba et al. | Integrated segmentation of cellular structures | |
| Rmili et al. | Nuclei segmentation approach for digestive neuroendocrine tumors analysis using optimized color space conversion | |
| Shu | Immunohistochemistry image analysis: protein, nuclei and gland | |
| Xu et al. | Automatic classification of prostate cancer gleason scores from digitized whole slide tissue biopsies | |
| Barrera et al. | An Automatic Segmentation of Gland | |
| SHU | IMAGE ANALYSIS: PROTEIN, NUCLEI AND GLAND |
Legal Events
| Date | Code | Title | Description |
|---|---|---|---|
| 17P | Request for examination filed |
Effective date: 20140317 |
|
| AC | Divisional application: reference to earlier application |
Ref document number: 2599055 Country of ref document: EP Kind code of ref document: P |
|
| AK | Designated contracting states |
Kind code of ref document: A2 Designated state(s): AL AT BE BG CH CY CZ DE DK EE ES FI FR GB GR HR HU IE IS IT LI LT LU LV MC MK MT NL NO PL PT RO RS SE SI SK SM TR |
|
| PUAI | Public reference made under article 153(3) epc to a published international application that has entered the european phase |
Free format text: ORIGINAL CODE: 0009012 |
|
| RIN1 | Information on inventor provided before grant (corrected) |
Inventor name: ZEINEH, JACK Inventor name: LIU, QIUHUA Inventor name: DONOVAN, MICHAEL Inventor name: FERNANDEZ, GERARDO Inventor name: AJEMBA, PETER Inventor name: KHAN, FAISAL Inventor name: RAMACHANDRAN, JANAKIRAMANAN Inventor name: SCOTT, RICHARD |
|
| PUAL | Search report despatched |
Free format text: ORIGINAL CODE: 0009013 |
|
| AK | Designated contracting states |
Kind code of ref document: A3 Designated state(s): AL AT BE BG CH CY CZ DE DK EE ES FI FR GB GR HR HU IE IS IT LI LT LU LV MC MK MT NL NO PL PT RO RS SE SI SK SM TR |
|
| RIC1 | Information provided on ipc code assigned before grant |
Ipc: G06T 5/30 20060101AFI20141127BHEP Ipc: G06T 7/00 20060101ALI20141127BHEP |
|
| R17P | Request for examination filed (corrected) |
Effective date: 20150630 |
|
| RBV | Designated contracting states (corrected) |
Designated state(s): AL AT BE BG CH CY CZ DE DK EE ES FI FR GB GR HR HU IE IS IT LI LT LU LV MC MK MT NL NO PL PT RO RS SE SI SK SM TR |
|
| STAA | Information on the status of an ep patent application or granted ep patent |
Free format text: STATUS: EXAMINATION IS IN PROGRESS |
|
| 17Q | First examination report despatched |
Effective date: 20171201 |
|
| GRAP | Despatch of communication of intention to grant a patent |
Free format text: ORIGINAL CODE: EPIDOSNIGR1 |
|
| STAA | Information on the status of an ep patent application or granted ep patent |
Free format text: STATUS: GRANT OF PATENT IS INTENDED |
|
| INTG | Intention to grant announced |
Effective date: 20180525 |
|
| GRAS | Grant fee paid |
Free format text: ORIGINAL CODE: EPIDOSNIGR3 |
|
| GRAA | (expected) grant |
Free format text: ORIGINAL CODE: 0009210 |
|
| STAA | Information on the status of an ep patent application or granted ep patent |
Free format text: STATUS: THE PATENT HAS BEEN GRANTED |
|
| AC | Divisional application: reference to earlier application |
Ref document number: 2599055 Country of ref document: EP Kind code of ref document: P |
|
| AK | Designated contracting states |
Kind code of ref document: B1 Designated state(s): AL AT BE BG CH CY CZ DE DK EE ES FI FR GB GR HR HU IE IS IT LI LT LU LV MC MK MT NL NO PL PT RO RS SE SI SK SM TR |
|
| REG | Reference to a national code |
Ref country code: CH Ref legal event code: EP Ref country code: AT Ref legal event code: REF Ref document number: 1065741 Country of ref document: AT Kind code of ref document: T Effective date: 20181115 |
|
| REG | Reference to a national code |
Ref country code: DE Ref legal event code: R096 Ref document number: 602011053993 Country of ref document: DE |
|
| REG | Reference to a national code |
Ref country code: IE Ref legal event code: FG4D |
|
| REG | Reference to a national code |
Ref country code: PT Ref legal event code: SC4A Ref document number: 2779089 Country of ref document: PT Date of ref document: 20190219 Kind code of ref document: T Free format text: AVAILABILITY OF NATIONAL TRANSLATION Effective date: 20190212 |
|
| REG | Reference to a national code |
Ref country code: CH Ref legal event code: NV Representative=s name: STOLMAR AND PARTNER INTELLECTUAL PROPERTY S.A., CH |
|
| REG | Reference to a national code |
Ref country code: NL Ref legal event code: FP |
|
| REG | Reference to a national code |
Ref country code: LT Ref legal event code: MG4D |
|
| REG | Reference to a national code |
Ref country code: AT Ref legal event code: MK05 Ref document number: 1065741 Country of ref document: AT Kind code of ref document: T Effective date: 20181114 |
|
| PG25 | Lapsed in a contracting state [announced via postgrant information from national office to epo] |
Ref country code: LV Free format text: LAPSE BECAUSE OF FAILURE TO SUBMIT A TRANSLATION OF THE DESCRIPTION OR TO PAY THE FEE WITHIN THE PRESCRIBED TIME-LIMIT Effective date: 20181114 Ref country code: LT Free format text: LAPSE BECAUSE OF FAILURE TO SUBMIT A TRANSLATION OF THE DESCRIPTION OR TO PAY THE FEE WITHIN THE PRESCRIBED TIME-LIMIT Effective date: 20181114 Ref country code: IS Free format text: LAPSE BECAUSE OF FAILURE TO SUBMIT A TRANSLATION OF THE DESCRIPTION OR TO PAY THE FEE WITHIN THE PRESCRIBED TIME-LIMIT Effective date: 20190314 Ref country code: NO Free format text: LAPSE BECAUSE OF FAILURE TO SUBMIT A TRANSLATION OF THE DESCRIPTION OR TO PAY THE FEE WITHIN THE PRESCRIBED TIME-LIMIT Effective date: 20190214 Ref country code: AT Free format text: LAPSE BECAUSE OF FAILURE TO SUBMIT A TRANSLATION OF THE DESCRIPTION OR TO PAY THE FEE WITHIN THE PRESCRIBED TIME-LIMIT Effective date: 20181114 Ref country code: FI Free format text: LAPSE BECAUSE OF FAILURE TO SUBMIT A TRANSLATION OF THE DESCRIPTION OR TO PAY THE FEE WITHIN THE PRESCRIBED TIME-LIMIT Effective date: 20181114 Ref country code: BG Free format text: LAPSE BECAUSE OF FAILURE TO SUBMIT A TRANSLATION OF THE DESCRIPTION OR TO PAY THE FEE WITHIN THE PRESCRIBED TIME-LIMIT Effective date: 20190214 Ref country code: HR Free format text: LAPSE BECAUSE OF FAILURE TO SUBMIT A TRANSLATION OF THE DESCRIPTION OR TO PAY THE FEE WITHIN THE PRESCRIBED TIME-LIMIT Effective date: 20181114 |
|
| REG | Reference to a national code |
Ref country code: ES Ref legal event code: FG2A Ref document number: 2711196 Country of ref document: ES Kind code of ref document: T3 Effective date: 20190430 |
|
| PG25 | Lapsed in a contracting state [announced via postgrant information from national office to epo] |
Ref country code: SE Free format text: LAPSE BECAUSE OF FAILURE TO SUBMIT A TRANSLATION OF THE DESCRIPTION OR TO PAY THE FEE WITHIN THE PRESCRIBED TIME-LIMIT Effective date: 20181114 Ref country code: AL Free format text: LAPSE BECAUSE OF FAILURE TO SUBMIT A TRANSLATION OF THE DESCRIPTION OR TO PAY THE FEE WITHIN THE PRESCRIBED TIME-LIMIT Effective date: 20181114 Ref country code: RS Free format text: LAPSE BECAUSE OF FAILURE TO SUBMIT A TRANSLATION OF THE DESCRIPTION OR TO PAY THE FEE WITHIN THE PRESCRIBED TIME-LIMIT Effective date: 20181114 Ref country code: GR Free format text: LAPSE BECAUSE OF FAILURE TO SUBMIT A TRANSLATION OF THE DESCRIPTION OR TO PAY THE FEE WITHIN THE PRESCRIBED TIME-LIMIT Effective date: 20190215 |
|
| PG25 | Lapsed in a contracting state [announced via postgrant information from national office to epo] |
Ref country code: PL Free format text: LAPSE BECAUSE OF FAILURE TO SUBMIT A TRANSLATION OF THE DESCRIPTION OR TO PAY THE FEE WITHIN THE PRESCRIBED TIME-LIMIT Effective date: 20181114 Ref country code: DK Free format text: LAPSE BECAUSE OF FAILURE TO SUBMIT A TRANSLATION OF THE DESCRIPTION OR TO PAY THE FEE WITHIN THE PRESCRIBED TIME-LIMIT Effective date: 20181114 Ref country code: CZ Free format text: LAPSE BECAUSE OF FAILURE TO SUBMIT A TRANSLATION OF THE DESCRIPTION OR TO PAY THE FEE WITHIN THE PRESCRIBED TIME-LIMIT Effective date: 20181114 |
|
| REG | Reference to a national code |
Ref country code: DE Ref legal event code: R097 Ref document number: 602011053993 Country of ref document: DE |
|
| PG25 | Lapsed in a contracting state [announced via postgrant information from national office to epo] |
Ref country code: RO Free format text: LAPSE BECAUSE OF FAILURE TO SUBMIT A TRANSLATION OF THE DESCRIPTION OR TO PAY THE FEE WITHIN THE PRESCRIBED TIME-LIMIT Effective date: 20181114 Ref country code: EE Free format text: LAPSE BECAUSE OF FAILURE TO SUBMIT A TRANSLATION OF THE DESCRIPTION OR TO PAY THE FEE WITHIN THE PRESCRIBED TIME-LIMIT Effective date: 20181114 Ref country code: SM Free format text: LAPSE BECAUSE OF FAILURE TO SUBMIT A TRANSLATION OF THE DESCRIPTION OR TO PAY THE FEE WITHIN THE PRESCRIBED TIME-LIMIT Effective date: 20181114 Ref country code: SK Free format text: LAPSE BECAUSE OF FAILURE TO SUBMIT A TRANSLATION OF THE DESCRIPTION OR TO PAY THE FEE WITHIN THE PRESCRIBED TIME-LIMIT Effective date: 20181114 |
|
| PLBE | No opposition filed within time limit |
Free format text: ORIGINAL CODE: 0009261 |
|
| STAA | Information on the status of an ep patent application or granted ep patent |
Free format text: STATUS: NO OPPOSITION FILED WITHIN TIME LIMIT |
|
| PGFP | Annual fee paid to national office [announced via postgrant information from national office to epo] |
Ref country code: NL Payment date: 20190809 Year of fee payment: 9 Ref country code: LU Payment date: 20190828 Year of fee payment: 9 |
|
| 26N | No opposition filed |
Effective date: 20190815 |
|
| PG25 | Lapsed in a contracting state [announced via postgrant information from national office to epo] |
Ref country code: SI Free format text: LAPSE BECAUSE OF FAILURE TO SUBMIT A TRANSLATION OF THE DESCRIPTION OR TO PAY THE FEE WITHIN THE PRESCRIBED TIME-LIMIT Effective date: 20181114 |
|
| PGFP | Annual fee paid to national office [announced via postgrant information from national office to epo] |
Ref country code: IT Payment date: 20190819 Year of fee payment: 9 |
|
| PG25 | Lapsed in a contracting state [announced via postgrant information from national office to epo] |
Ref country code: TR Free format text: LAPSE BECAUSE OF FAILURE TO SUBMIT A TRANSLATION OF THE DESCRIPTION OR TO PAY THE FEE WITHIN THE PRESCRIBED TIME-LIMIT Effective date: 20181114 |
|
| PG25 | Lapsed in a contracting state [announced via postgrant information from national office to epo] |
Ref country code: MC Free format text: LAPSE BECAUSE OF FAILURE TO SUBMIT A TRANSLATION OF THE DESCRIPTION OR TO PAY THE FEE WITHIN THE PRESCRIBED TIME-LIMIT Effective date: 20181114 |
|
| REG | Reference to a national code |
Ref country code: BE Ref legal event code: MM Effective date: 20190831 |
|
| PG25 | Lapsed in a contracting state [announced via postgrant information from national office to epo] |
Ref country code: IE Free format text: LAPSE BECAUSE OF NON-PAYMENT OF DUE FEES Effective date: 20190801 |
|
| PG25 | Lapsed in a contracting state [announced via postgrant information from national office to epo] |
Ref country code: BE Free format text: LAPSE BECAUSE OF NON-PAYMENT OF DUE FEES Effective date: 20190831 |
|
| REG | Reference to a national code |
Ref country code: NL Ref legal event code: MM Effective date: 20200901 |
|
| PG25 | Lapsed in a contracting state [announced via postgrant information from national office to epo] |
Ref country code: LU Free format text: LAPSE BECAUSE OF NON-PAYMENT OF DUE FEES Effective date: 20200801 |
|
| PG25 | Lapsed in a contracting state [announced via postgrant information from national office to epo] |
Ref country code: CY Free format text: LAPSE BECAUSE OF FAILURE TO SUBMIT A TRANSLATION OF THE DESCRIPTION OR TO PAY THE FEE WITHIN THE PRESCRIBED TIME-LIMIT Effective date: 20181114 |
|
| PG25 | Lapsed in a contracting state [announced via postgrant information from national office to epo] |
Ref country code: HU Free format text: LAPSE BECAUSE OF FAILURE TO SUBMIT A TRANSLATION OF THE DESCRIPTION OR TO PAY THE FEE WITHIN THE PRESCRIBED TIME-LIMIT; INVALID AB INITIO Effective date: 20110801 Ref country code: MT Free format text: LAPSE BECAUSE OF FAILURE TO SUBMIT A TRANSLATION OF THE DESCRIPTION OR TO PAY THE FEE WITHIN THE PRESCRIBED TIME-LIMIT Effective date: 20181114 Ref country code: IT Free format text: LAPSE BECAUSE OF NON-PAYMENT OF DUE FEES Effective date: 20200801 |
|
| PG25 | Lapsed in a contracting state [announced via postgrant information from national office to epo] |
Ref country code: NL Free format text: LAPSE BECAUSE OF NON-PAYMENT OF DUE FEES Effective date: 20200901 |
|
| PGFP | Annual fee paid to national office [announced via postgrant information from national office to epo] |
Ref country code: CH Payment date: 20210831 Year of fee payment: 11 |
|
| PG25 | Lapsed in a contracting state [announced via postgrant information from national office to epo] |
Ref country code: MK Free format text: LAPSE BECAUSE OF FAILURE TO SUBMIT A TRANSLATION OF THE DESCRIPTION OR TO PAY THE FEE WITHIN THE PRESCRIBED TIME-LIMIT Effective date: 20181114 |
|
| REG | Reference to a national code |
Ref country code: CH Ref legal event code: PL |
|
| PG25 | Lapsed in a contracting state [announced via postgrant information from national office to epo] |
Ref country code: LI Free format text: LAPSE BECAUSE OF NON-PAYMENT OF DUE FEES Effective date: 20220831 Ref country code: CH Free format text: LAPSE BECAUSE OF NON-PAYMENT OF DUE FEES Effective date: 20220831 |
|
| P01 | Opt-out of the competence of the unified patent court (upc) registered |
Effective date: 20230517 |
|
| PGFP | Annual fee paid to national office [announced via postgrant information from national office to epo] |
Ref country code: ES Payment date: 20250901 Year of fee payment: 15 Ref country code: PT Payment date: 20250721 Year of fee payment: 15 |
|
| PGFP | Annual fee paid to national office [announced via postgrant information from national office to epo] |
Ref country code: DE Payment date: 20250827 Year of fee payment: 15 |
|
| PGFP | Annual fee paid to national office [announced via postgrant information from national office to epo] |
Ref country code: GB Payment date: 20250827 Year of fee payment: 15 |
|
| PGFP | Annual fee paid to national office [announced via postgrant information from national office to epo] |
Ref country code: FR Payment date: 20250825 Year of fee payment: 15 |