EP2804119A2 - Système d'analyse et procédé de support commercial de santé - Google Patents
Système d'analyse et procédé de support commercial de santé Download PDFInfo
- Publication number
- EP2804119A2 EP2804119A2 EP14168538.8A EP14168538A EP2804119A2 EP 2804119 A2 EP2804119 A2 EP 2804119A2 EP 14168538 A EP14168538 A EP 14168538A EP 2804119 A2 EP2804119 A2 EP 2804119A2
- Authority
- EP
- European Patent Office
- Prior art keywords
- medical
- information
- probability
- node
- nodes
- Prior art date
- Legal status (The legal status is an assumption and is not a legal conclusion. Google has not performed a legal analysis and makes no representation as to the accuracy of the status listed.)
- Ceased
Links
Images













Classifications
-
- G—PHYSICS
- G16—INFORMATION AND COMMUNICATION TECHNOLOGY [ICT] SPECIALLY ADAPTED FOR SPECIFIC APPLICATION FIELDS
- G16H—HEALTHCARE INFORMATICS, i.e. INFORMATION AND COMMUNICATION TECHNOLOGY [ICT] SPECIALLY ADAPTED FOR THE HANDLING OR PROCESSING OF MEDICAL OR HEALTHCARE DATA
- G16H40/00—ICT specially adapted for the management or administration of healthcare resources or facilities; ICT specially adapted for the management or operation of medical equipment or devices
- G16H40/20—ICT specially adapted for the management or administration of healthcare resources or facilities; ICT specially adapted for the management or operation of medical equipment or devices for the management or administration of healthcare resources or facilities, e.g. managing hospital staff or surgery rooms
-
- G—PHYSICS
- G16—INFORMATION AND COMMUNICATION TECHNOLOGY [ICT] SPECIALLY ADAPTED FOR SPECIFIC APPLICATION FIELDS
- G16H—HEALTHCARE INFORMATICS, i.e. INFORMATION AND COMMUNICATION TECHNOLOGY [ICT] SPECIALLY ADAPTED FOR THE HANDLING OR PROCESSING OF MEDICAL OR HEALTHCARE DATA
- G16H10/00—ICT specially adapted for the handling or processing of patient-related medical or healthcare data
- G16H10/60—ICT specially adapted for the handling or processing of patient-related medical or healthcare data for patient-specific data, e.g. for electronic patient records
-
- G—PHYSICS
- G16—INFORMATION AND COMMUNICATION TECHNOLOGY [ICT] SPECIALLY ADAPTED FOR SPECIFIC APPLICATION FIELDS
- G16H—HEALTHCARE INFORMATICS, i.e. INFORMATION AND COMMUNICATION TECHNOLOGY [ICT] SPECIALLY ADAPTED FOR THE HANDLING OR PROCESSING OF MEDICAL OR HEALTHCARE DATA
- G16H50/00—ICT specially adapted for medical diagnosis, medical simulation or medical data mining; ICT specially adapted for detecting, monitoring or modelling epidemics or pandemics
- G16H50/20—ICT specially adapted for medical diagnosis, medical simulation or medical data mining; ICT specially adapted for detecting, monitoring or modelling epidemics or pandemics for computer-aided diagnosis, e.g. based on medical expert systems
-
- G—PHYSICS
- G06—COMPUTING OR CALCULATING; COUNTING
- G06Q—INFORMATION AND COMMUNICATION TECHNOLOGY [ICT] SPECIALLY ADAPTED FOR ADMINISTRATIVE, COMMERCIAL, FINANCIAL, MANAGERIAL OR SUPERVISORY PURPOSES; SYSTEMS OR METHODS SPECIALLY ADAPTED FOR ADMINISTRATIVE, COMMERCIAL, FINANCIAL, MANAGERIAL OR SUPERVISORY PURPOSES, NOT OTHERWISE PROVIDED FOR
- G06Q10/00—Administration; Management
- G06Q10/10—Office automation; Time management
Definitions
- This invention relates to a data analysis technology, and more particularly, to a system for analyzing medical data, to thereby support a healthcare business.
- a health insurance society operates an insurance business, a healthcare guidance system, for providing healthcare guidances for preventing lifestyle diseases, and preventing severity thereof from increasing in order to reduce medical cost.
- resources such as public health nurses employed for the healthcare guidance and a cost for the healthcare guidances are limited. Therefore, a system for supporting an operation of effective and efficient insurance business is desired.
- Japanese Patent Application Laid-open No. 2012-128670 A there is described a healthcare business support system for selecting people subject to a healthcare guidance based on healthcare cost information, health checkup information, and healthcare guidance information.
- the healthcare business support system includes a medical cost model generation unit for generating a medical cost model representing an estimated medical cost for each of severities and test values of an insured person to a health insurance, a test value improvement model generation unit for generating a test value improvement model representing an improvement amount for each of the severities and the test values, an estimated medical cost reduction effect calculation unit for calculating an estimated medical cost reduction amount by a healthcare guidance for each of the severities and the test values, and a subject person selection unit for selecting an insured person to the health insurance belonging to a severity and a test value high in estimated medical cost reduction amount as a healthcare guidance subject person.
- the future medical cost is estimated based on the current severity and test value. For example, a future severity of diabetes is estimated based on current severity and blood sugar level of diabetes, and an average medical cost corresponding to the severity is considered as an estimated medical cost.
- an analysis system comprising a processor configured to execute a program and a memory configured to store the program.
- the analysis system executes the program to analyze medical data.
- the analysis system is capable of making access to a database storing medical information including an injury and illness name of an insured person and a medical action performed on the insured person and health checkup information including a test value obtained by a health checkup on the insured person.
- the analysis system further comprises; a causation/transition structure calculating unit configured to control the processor to generate a graph structure including a node corresponding to an item defined by a plural of or the medical information or the health checkup information and a probability variable relating to the item, and a probabilistic dependency defined by one of a directed link or an undirected link between the nodes, and to store the generated graph structure in the database; a node generating unit configured to control the processor to generate an event space of the nodes based on the medical information and the health checkup information, and to store the generated event space in the database; a probability calculating unit configured to control the processor to calculate a conditional probability of the graph structure based on the medical information, the health checkup information and the event space, and to store the calculated conditional probability in the database; a state transition model reconstructing unit configured to control the processor to reconstruct a state transition model with a graph structure, an event space and a conditional probability including specified probability variables based on a state transition model constructed from the graph structure, the event space and
- a related future event can be accurately estimated based on various kinds of data. Objects, configurations, and effects other than those described above are readily apparent from the following description of embodiments.
- a first embodiment of this invention describes an example of a medical data analysis system that selects a person to be subjected to healthcare guidance, proposes a healthcare guidance approach, and estimates a healthcare guidance effect for prevention of disease onset and transition to a critical state thereof based on medical data (e.g., healthcare cost information, health checkup information, and medical inquiry information).
- medical data e.g., healthcare cost information, health checkup information, and medical inquiry information.
- the healthcare cost information is information recording names of injury and illness when a health insurance insured person visits a medical institute for consultation, a prescribed medicine, a clinical action performed, and a medical costs (points).
- An example of the healthcare cost information is described later referring to FIG. 6 .
- a prescribed medicine and a performed clinical action are generally referred to as "medical action”.
- Health checkup information stores a test value when an insured person has had a health checkup. An example of the health checkup information is described later referring to FIG. 7 .
- Medical inquiry information stores the results of medical inquiry on lifestyle habit, an anamnestic history, a subjective symptom, etc. when an insured person has had a health checkup. An example of the health checkup information is described later referring to FIG. 8 .
- a causal relation of a disease and disease state transition structure are modelized based on medical data.
- the first embodiment provides various functions such as selection of a person to be subjected to healthcare guidance, proposal of a healthcare guidance approach, and estimation of a healthcare guidance effect based on this model.
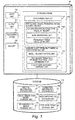
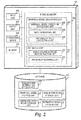
- FIG. 1 is a block diagram illustrating the configuration of a medical data analysis system according to the first embodiment.
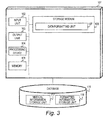
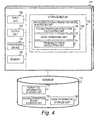
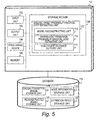
- FIGS. 3 to 5 are block diagrams illustrating other configurations of the medical data analysis system according to the first embodiment.
- the medical data analysis apparatus 101 includes an input unit 102, an output unit 103, a processing device 104, a memory 105, and a storage medium 106.
- the input unit 102 is a human interface such as a mouse and a keyboard, and receives an input to the medical data analysis apparatus 101.
- the output unit 103 includes a display and a printer for outputting an arithmetic operation result by the medical data analysis system.
- the storage medium 106 is a storage apparatus for storing various programs for realizing medical data analysis processing by the medical data analysis system, an execution result of the medical data analysis processing, and the like, and is, for example, a non-volatile storage medium (such as a magnetic disk drive and non-volatile memory).
- the programs stored in the storage medium 106 are extended on the memory 105.
- the processing device 104 is an arithmetic operation apparatus for executing a program loaded on the memory 105, and is, for example, a CPU, a GPU, or the like. Processing and arithmetic operation described later are carried out by the processing device 104.
- the medical data analysis system may be a computer system including a single computer, or a computer system including a server and client terminals.
- a data formatting unit 107, a disease causation/transition model generating unit 108, and a disease onset probability/medical cost estimating unit 112 of the medical data analysis apparatus 101 may be configured as separate apparatus as illustrated in FIGS. 3 , 4 , and 5 .
- the apparatus illustrated in FIGS. 3 and 4 generate a model based on medical data.
- the apparatus illustrated in FIG. 5 provides a healthcare guidance supporting function to generate information for performing various kinds of healthcare guidance based on the generated model.
- a user uses the apparatus illustrated in FIG. 5 . Because the apparatus illustrated in FIG. 5 used by the user need not hold medical data based on which the model has been generated, the apparatus is effective for concealment of personal information and prevention of leakage of personal information.
- the medical data analysis system is a computer system configured on a single computer, or on a plurality of computers logically or physically constructed, and may operate on separate threads on the same computer or operate on virtual computers configured on a plurality of physical computer resources.
- a medical information storage unit 117 stores the medical data input to the input unit 102.
- the medical data includes the healthcare cost information, the health checkup information, and the medical inquiry information.
- the healthcare cost information includes healthcare cost basic information, injury and illness name information, clinical action information, medicine information, injury and illness name classification information, clinical action classification information, and medicine classification information.
- FIG. 6 is an explanatory diagram illustrating healthcare cost basic information 601.
- the healthcare cost basic information 601 is information holding relationships between a healthcare cost and an insured person.
- the healthcare cost basic information 601 includes search numbers 602, insured person IDs 603, sex 604, ages 605, months and years of clinical action 606, and total points 607.
- the search number 602 is an identifier for uniquely identifying a healthcare cost record.
- the insured person ID 603 is an identifier for uniquely identifying an insured person to the health insurance.
- the sex 604 is information representing a sex of the insured person.
- the age 605 is information representing an age of the insured person.
- the month and year of clinical action 606 is a month and a year when the insured person visits a medical institute.
- the total point 607 is information representing a total point of one healthcare cost record. It should be noted that a medical cost (in yen) is calculated by multiplying the total point by "10". If a plurality of injury and illness names are registered to one search number in injury and illness name information 901 illustrated in FIG. 9 , a total point of the medical action for the plurality of injuries/diseases is registered to the total point 607.
- FIG. 9 is an explanatory diagram illustrating the injury and illness name information 901.
- the injury and illness name information 901 includes search numbers 602, injury and illness codes 902, and injury and illness names 903.
- the search number 602 is an identifier for uniquely identifying a healthcare cost record, and uses the same number as the search number ( FIG. 6 ) of the healthcare cost basic information 601.
- the injury and illness code 902 is an injury and illness code described in the healthcare cost record.
- the injury and illness name 902 is an injury and illness name corresponding to the injury and illness code.
- injury and illness names 903 of entries having "11" in the search number 602 are "diabetes” and “hypertension” in the injury and illness name information 901 illustrated in FIG. 9
- the injury and illness names, which are diabetes and hypertension are described in the healthcare cost records having "11" in the search number.
- FIG. 10 is an explanatory diagram illustrating injury and illness name classification information.
- Traum and illness name classification information 1001 is information for associating injury and illness classification with injury and illness names belonging to the injury and illness classification with each other, and includes an injury and illness classification 1002, an injury and illness code 902, an injury and illness name 903, and a complication 1003.
- the injury and illness classification 1002 is the classification to which an injury and illness in question belongs.
- the injury and illness code 902 is an injury and illness code described in the healthcare cost record, and uses the same numbers as used in the injury and illness code 902 of the injury and illness name information 901 illustrated in FIG. 9 .
- the injury and illness name 903 is the name of an injury and illness corresponding to this injury and illness code, and uses the same names as used in the injury and illness name 903 of the injury and illness name information 901 illustrated in FIG. 9 .
- the complication absence/presence 1003 indicates whether this injury and illness is the name of a complication
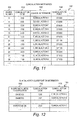
- FIG. 11 is an explanatory diagram illustrating the clinical action information.
- Clinical action information 1101 includes search numbers 602, clinical action codes 1102, clinical action names 1103, and clinical action points 1104.
- the search number 602 is an identifier for uniquely identifying a healthcare cost record, and uses the same number as the search number ( FIG. 6 ) of the healthcare cost basic information 601.
- the clinical action code 1102 is an identifier for identifying a clinical action described in the healthcare cost record.
- the clinical action name 1103 is a name of the clinical action described in the healthcare cost record.
- the clinical action point 1104 is a point relating to the clinical action.
- FIG. 12 is an explanatory diagram illustrating the clinical action classification information.
- Clinical action classification information 1201 includes injury and illness classifications 1002, clinical action codes 1102, and clinical action names 1103.
- the injury and illness classification 1002 uses the same classification as the injury and illness classification 1002 ( FIG. 10 ) of the injury and illness name classification information 1001.
- the clinical action code 1102 is a clinical action code for identifying a clinical action practiced for the injury and illness in the injury and illness classification 1002, and uses the same code as the clinical action code 1102 ( FIG. 11 ) of the clinical action information 1101.
- the clinical action name 1103 is a name of the clinical action corresponding to the clinical action code, and uses the same code as the clinical action name 1103 ( FIG. 11 ) of the clinical action information 1101.
- FIG. 13 is an explanatory diagram illustrating the medicine information.
- Medicine information 1301 includes search numbers 602, medicine codes 1302, medicine names 1303, and medicine points 1304.
- the search number 602 is an identifier for uniquely identifying a healthcare cost record, and uses the same number as the search number 602 ( FIG. 6 ) of the healthcare cost basic information 601.
- the medicine code 1302 is a medicine code for identifying the medicine described in the healthcare cost record.
- the medicine name 1303 is a name of a medicine described in the healthcare cost record.
- the medicine point 1304 is an insurance point of the medicine.
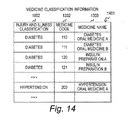
- FIG. 14 is an explanatory diagram illustrating the medicine classification information.
- Medicine classification information 1401 includes injury and illness classifications 1002, medicine codes 1302, and medicine names 1303.
- the injury and illness classification 1002 uses the same classification as the injury and illness classification 1002 ( FIG. 10 ) of the injury and illness name classification information 1001.
- the medicine code 1302 is a medicine code for identifying a medicine prescribed in the classification registered to the injury and illness classification 1002, and uses the same code as the medicine code 1302 ( FIG. 13 ) of the medicine information 1301.
- the medicine name 1303 is a name of a medicine corresponding to the medicine code, and uses the same name as the medicine name 1301 ( FIG. 13 ) of the medicine information 1303.
- clinical action information 1101 illustrated in FIG. 11 and the medicine information illustrated in FIG. 13 are generally referred to as medical action information.
- clinical action classification information 1201 illustrated in FIG. 12 and the medicine classification information illustrated in FIG. 14 are generally referred to as medical action classification information.
- FIG. 7 is an explanatory diagram illustrating the health checkup information.
- Health checkup information 701 is information for managing health checkup information on a plurality of insured persons for a plurality of years, and includes insured person IDs 603, health checkup dates 702, and various test values (such as BMIs 703, abdominal circumferences 704, fasting blood sugars 705, systolic blood pressures 706, and neutral fats 707) in the health checkup.
- the insured person ID 603 is an identifier of an insured person to the health insurance who has had the health checkup, and uses the same identifier as the insured person ID 603 ( FIG. 6 ) of the healthcare cost basic information 601.
- the health checkup date 702 is the date of the health checkup.
- the BMI 703 to the neutral fat 707 are results of tests in the health checkup.
- data in the health checkup information may be absent.
- the items of a test received in 2004 of an insured person having an insured person ID "K0004" lack data for the systolic blood pressure 706.
- FIG. 8 is an explanatory diagram illustrating the medical inquiry information.
- Medical inquiry information 801 is information for managing medical inquiry information on a plurality of insured persons for a plurality of years, and includes insured person IDs 603, medical inquiry dates 802, and answers of the medical inquiry (such as smoking 803, drinking 804, and walking 805.
- the medical inquiry may include a life style, health history, a constitution such as allergy, and subjective symptoms.
- the insured person ID 603 is an identifier of an insured person to the health insurance who has had the medical inquiry, and uses the same identifier as the insured person ID 603 ( FIG. 6 ) of the healthcare cost basic information 601.
- the medical inquiry date 802 is the date of the medical inquiry.
- the smoking 803 to the walking 805 are results of the medical inquiry.
- the smoking 803 represents an average number of cigarettes smoked per day if the insured person has the smoking habit, and is "none" if the insured person does not smoke.
- the drinking 804 represents an average amount (unit: ml) of alcoholic beverages drunk per day if the insured person has the drinking habit, and is "none" if the insured person does not have the drinking habit.
- the walking 805 is an average period (unit: minute) of walking per day.
- Detailed information such as the number of steps in the walking, the amount of drinking, and the number of smoked cigarettes may not be acquired from the medical inquiry. Not a specific amount of drinking, but a corresponding frequency out of frequencies classified in advance in a questionnaire may be responded. For example, if information only on absence/presence of habits of smoking and drinking are acquired, the frequency of drinking may be divided into a certain number of degrees (such as (1) none, (2) once to twice per week, (3) three times or more per week), and the frequency may be responded. In this case, the value in the medical inquiry information is the number without a quantitative meaning.
- data on the medical inquiry may be absent.
- the items of a medical inquiry received in 2004 by an insured person having an insured person ID "K0003" lack data for the walking 805.
- the data formatting unit 107 sums/unifies and formats in a tabular form the healthcare cost information, the health checkup information, and the medical inquiry information for each of the insured persons and each period from the medical data stored in the medical information storage unit 117.
- the data formatting unit 107 sums/unifies and formats in a tabular form the healthcare cost information, the health checkup information, and the medical inquiry information for each of the insured persons and each period from the medical data stored in the medical information storage unit 117.
- a description is given while assuming one period is one year, but the one period may be another period such as half a year, two years, and three years.
- FIG. 15 is an explanatory diagram illustrating an example of formatted information 1501. Referring to FIG. 15 , a description is given of the processing by the data formatting unit 107.
- the formatted information 1501 includes healthcare cost formatted information acquired by formatting the healthcare cost information in the year of 2004. Each row of the formatted information 1501 represents data summed for one insured person ID for one year.
- An insured person ID 603, a sex 604, an age 605, and a total point 607 are the same as the insured person ID 603, the sex 604, the age 605, and the total point 607 ( FIG. 6 ) of the healthcare cost basic information 601.
- a data year 1502 is a year of source data from which the formatted information is generated.
- the injury and illness code 10 (1503) is the number of healthcare cost records having "10" in the injury and illness code out of the healthcare cost records for the insured person ID.
- the injury and illness code 20 (1504) is similarly the number of healthcare cost records having "20" in the injury and illness code out of the healthcare cost records for the insured person ID.
- the clinical action code 1000 (1505) is the number of healthcare cost records for which a clinical action having 1000 in the clinical action code has been performed out of the healthcare cost records for the insured person ID.
- the medicine code 110 (1506) is the number of healthcare cost record s for which a medicine having the medicine code of " 110" has been prescribed out of the healthcare cost records for the insured person ID.
- the data formatting unit 107 acquires search numbers of healthcare cost records for the insured person ID having 2004 in the month and year of clinical action from the healthcare cost basic information 601. Then, the data formatting unit 107 refers to the injury and illness name information 901, and counts, for each injury and illness code, the number of healthcare cost records having the injury and illness code described thereon. As a result, the number of healthcare cost records for each of the injury and illness codes is acquired. Similarly, the data formatting unit 107 refers to the clinical action information 1101, counts the number of healthcare cost records for each of the clinical action codes, refers to the medicine information 1301, and counts the number of healthcare cost records for each of the medicine codes. As a result, a data row for the year of 2004 is generated for the selected insured person ID. This processing is carried out for all combinations of each of insured person IDs and each of the years subject to the analysis.
- search numbers "11", “12”, and “13” can be acquired from the healthcare cost basic information 601 for the data of the insured person ID "K0001" in the first row in 2004 in the formatted information 1501 illustrated in FIG. 15 .
- the number of healthcare cost records having "10" in the injury and illness code is two corresponding to the search numbers "11” and "13” out of the three healthcare cost records.
- 2 is registered to the column of the injury and illness code 10 in the first row of the formatted information 1501.
- the formatted information 1501 illustrated in FIG. 15 includes health checkup formatted information formatted from the health checkup information. Each row includes sums of data corresponding to a single insured person ID.
- a value of each of the items is a value of the health checkup data of an insured person and a year respectively corresponding to the insured person ID 603 and the data year 1502.
- the health checkup data can be acquired from the health checkup information 701. If the health checkup information 701 includes a plurality of pieces of health checkup data corresponding to the same insured person ID and the same year, data on any one of dates of health checkup or an average of health checkup results of the plurality of times for the year may be used. If the data on one health checkup date is used, it is preferred to use data on a simultaneous health checkup day practiced at approximately the same time of every year. Moreover, data small in amount of deficiency may be selected.
- a numerical value defined in advance for representing the deficiency is used for the deficient data.
- -1 is used. It should be noted that all values for an insured person who does not have the health checkup information are treated as the values of the deficient data.
- the formatted information 1501 illustrated in FIG. 15 includes medical inquiry formatted information formatted from the medical inquiry information. Each row includes sums of data corresponding to a single insured person ID.
- a value of each of the items is a value of the medical inquiry data of an insured person and a year respectively corresponding to the insured person ID 603 and the data year 1502.
- the medical inquiry data can be acquired from the medical inquiry information 801. If the medical inquiry information 801 includes a plurality of pieces of medical inquiry data corresponding to the same insured person ID and the same year, data on any one of the dates of medical inquiry or an average of medical inquiry results of the plurality of times for the year may be used. If the data on one health checkup date is used, it is preferred to use data on a simultaneous health checkup day practiced every year at approximately the same time of every year. Alternatively, data small in amount of deficiency may be selected. A numerical value defined in advance for representing the deficiency is used for the deficient data. In the example illustrated in FIG. 15 , -1 is used. It should be noted that all values for an insured person who does not have the medical inquiry information are treated as the values of the deficient data.
- Similar items may be summarized, thereby unifying the plurality of items. For example, if functions of the oral antidiabetic A and functions of the oral antidiabetic B out of the items of the medicines are similar, the oral medicines A and B may be summarized, and may be treated as one item. On this occasion, a sum of the number of prescriptions of the oral antidiabetic A and the number of prescriptions of the oral antidiabetic B in the same year is used as a value of the item newly summarized. Criteria for determining whether items are similar or not are described below. Clinical action names belonging to the same injury and illness classification in the clinical action classification information 1201 are considered as similar items. Moreover, medicine names belonging to the same injury and illness classification in the medicine classification information 1401 are considered as similar items. Moreover, similar item information is manually generated in advance.
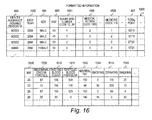
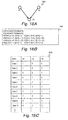
- FIG. 16 is an explanatory diagram illustrating an example of the formatted information 1501 acquired by unifying the injury and illness code 10 and the injury and illness 20 of the healthcare cost formatted information.
- the value of an injury and illness code 1601 is a sum of the value of the injury and illness code 1503 and the value of the injury and illness code 1504 in FIG. 15 , and is a sum of the number of healthcare cost records having "10" in the injury and illness code and the number of healthcare cost records having "20" in the injury and illness code.
- the generated healthcare cost formatted information, health checkup formatted information, and medical inquiry formatted information shown in FIGS. 15 and 16 are stored in the formatted information storage unit 118 of the database 116.
- the formatted information 1501 is numerical data in a tabular form.
- the value in the healthcare cost formatted information is acquired by summing the number of healthcare cost records, namely the number of prescriptions, but the value may be information representing whether the prescriptions exist or not.
- the number of prescriptions is equal to or more than 1 (prescription exists) is summarized as 1, and a case where the number of prescriptions is 0 (no prescription) is set to 0, resulting in a binary representation.
- the number of prescriptions may be considered to represent the severity
- the value of the healthcare cost formatted information may be a value representing a level as a result of classification of the number of prescription.
- a case where the number of prescriptions is 0 is set to 0, a case where the number of prescriptions is 1 to 4 is set to 1, and a case where the number of prescriptions is equal to or more than 5 is set to 2, resulting in a representation as the three stages.
- the healthcare cost formatted information, health checkup formatted information, and medical inquiry formatted information are summarized in a period of one year.
- the period may be set to a different period of two years, three years, or the like.
- a description is given of a case where the period for the summarizing is one year.
- the disease causation/transition model generating unit 108 includes a causation/transition structure calculating unit 109, a node generating unit 110, and a probability table calculating unit 111.
- the disease causation/transition model generating unit 108 generates a model representing a cause of a disease and disease state transition based on a graphical model by using formatted information stored in the formatted information storage unit 118.
- an estimated value for a medical cost of a year (X+ n ) after a certain year (year X) can be calculated from personal health checkup data, medical inquiry data, and healthcare cost data of the certain year, to thereby estimate a disease onset probability.
- an estimated value for a medical cost of the next year for a group in a specific state in year X e.g., group whose blood sugar levels lie within a certain range
- the estimation may be made for a different period such as two years later or three years later.
- the following description is given on the assumption that pieces of medical data acquired in years separated by n years are stored in the medical information storage unit 117, and formatted information generated from the medical data by the data formatting unit 107 is stored in the formatted information storage unit 118.
- the disease causation/transition model generating unit 108 generates a model representing the cause of a disease and disease state transition by using the formatted information stored in the formatted information storage unit 118.
- the graphical model is formed by nodes and edges.
- the node represents a probability variable
- the edge represents the dependency relation between nodes (between probability variables).
- the edges have two types: a directed link and an undirected link.
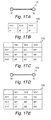
- a structure 1701 illustrated in FIG. 17A shows the two probability variables X1 and X2 by circles, and a link directed to X2 from X1 by an arrow.
- the directed link indicates that the probability of the probability variable X2 taking each state depends on the state of the probability variable X1.
- the probability of each state of the probability variable X2 is given by a conditional probability P(X2
- the probability variable X1 is referred to as a parent of the probability variable X2, and the probability variable X2 is referred to as a child of the probability variable X1.
- X1) are expressed by a probability table 1702 and a probability table 1703, respectively, shown in FIGS. 17B and 17C .
- a structure 1704 illustrated in FIG. 17D shows an undirected link connected by two probability variables X1 and X2.
- the undirected link indicates that the probability variables are not independent.
- the probability table 1702 indicates that P(X1, X2) ⁇ P(X1)P(X2).
- This probability distribution is expressed by a probability table 1705 shown in FIG. 17E .
- a node (probability variable) is selected from items in formatted information of year X and items in formatted information of year X+ n .
- a node for example, an injury and illness code 10 in year X, BMI in year X, smoking in year X, an injury and illness code 10 in year X+ n , BMI in year X+ n , smoking in year X+ n , and so forth in FIG. 15 become nodes.
- Those nodes correspond to items in healthcare cost information, health checkup information, and medical inquiry information, or a unified item obtained by unifying a plurality of items in healthcare cost information.
- the number of those items is, for example, several hundred to several thousand in consideration of the healthcare cost, health checkup, and medical inquiry when items in healthcare cost information are limited to those related to diabetes, and is several hundred thousand in consideration of all the items in healthcare cost information, all the items of health checkup, and all the items of medical inquiry.
- the number of nodes ranges from several hundred to as large as several hundred thousand.
- the disease causation/transition model generating unit 108 uses formatted information generated from past healthcare cost information, health checkup information, and medical inquiry information to generate a model for estimating the disease onset probability and medical cost of a disease of an insured person n years after a certain year based on the healthcare cost information, health checkup information, and medical inquiry information for the insured person in the certain year.
- pieces of past formatted information of at least n years are needed.
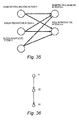
- FIG. 35 is an explanatory diagram illustrating a simplified model directed to diabetes.
- the model illustrated in FIG. 35 is for estimating a oral antidiabetic prescribing state and an insulin prescribing state in year X+ n based on a oral antidiabetic prescribing state, an insulin prescribing state, and a blood sugar level in year X.
- the oral antidiabetic prescribing state in year X+ n is given by a conditional probability of the oral antidiabetic prescribing state, the insulin prescribing state, and the blood sugar level in year X.
- the disease causation/transition model generating unit 108 automatically generates an edge and a conditional probability based on the formatted information.
- the causation/transition structure calculating unit 109 forms an edge based on the dependency between those nodes.
- the node generating unit 110 generates space (event space) taken by the value of each node.
- the probability table calculating unit 111 calculates a conditional probability.
- the causation/transition structure calculating unit 109 forms an edge (dependency relation) between those nodes (probability variables) from the data. The formation is described referring to a simple example.
- the system has a probability variable X3 which takes two statuses of normal and abnormal, respectively expressed by "0" and "1".
- a structure 1801 in FIG. 18A When the structure 1801 and a probability table 1802 are given, observation data obtained therefrom is expressed by, for example, a table 1803. Each row in the table 1803 represents a single piece of observation data.
- each sensor shows an abnormal status, it is likely that the system is abnormal.
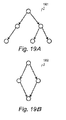
- the Bayesian network is a structure where every edge is a directed link, and there are no plurality of routes directed from a variable X1 to a variable X2 passing along directed links.
- a structure 1901 illustrated in FIG. 19A is a Bayesian network, but a structure 1902 illustrated in FIG. 19B is not a Bayesian network.
- the graphical model structure calculating unit 208 first defines the causation/transition relation between nodes as edges based on the features of the individual items of the healthcare cost, health checkup, and medical inquiry. Next, the graphical model structure calculating unit 208 calculates the dependency between nodes based on two dependencies, namely the quantitative dependency and co-occurrence dependency. Then, the graphical model structure calculating unit 208 deletes the edge between low-dependency nodes.
- two types of edges namely an edge expressing the pathologic cause and effect and an edge expressing a disease state transition, are taken into account.
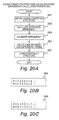
- the following describes the process executed by the causation/ transition structure calculating unit 109 referring to FIGS. 20A to 20C .
- causation/transition structure defining step 2001 in FIG. 20A nodes are classified based on the features of the individual items of the healthcare cost, health checkup, and medical inquiry, and a causation/transition relation is defined as an edge between the classified nodes. It is an object of the model of the first embodiment to describe a cause and effect of a disease and estimate a disease state transition (disease onset). Accordingly, items are classified to items related to an injury and illness name, a medical action, a test value, a lifestyle habit, and basic information.
- the injury and illness names are the items in the injury and illness codes 1503 and 1504 of healthcare cost formatted information
- the medical actions are the items in the clinical action code 1505 and the medicine code 1506 of the healthcare cost formatted information.
- the test value represents the items of a test value obtained by health checkup formatted information.
- the lifestyle habits are the items on the lifestyle habit and subjective symptom found by medical inquiry and obtained from the medical inquiry formatted information.
- the basic information represents the age and sex.
- Nodes are classified based on the above-mentioned classifications of items.
- the nodes are classified to the classifications to which the items belong, and when nodes correspond to a unified item obtained by unifying a plurality of items, the nodes are classified to the classification to which the unified item belongs.
- the nodes are classified into an injury and illness name, a medical action, a test value, a lifestyle habit, and basic information.
- an injury and illness code 10 (injury and illness name), a medicine code 110 (medical action), a medicine code 120 (medical action), a blood sugar level (test value), etc. are treated as nodes (probability variables). What is presented within the parentheses represents classifications to which nodes belong.
- nodes such as the medicine code 120 (medical action) are replaced with words, such as "oral antidiabetic (medical action)", that help understand the nodes more easily.
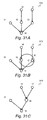
- the situations of this year's medical actions seem to be helpful information in the estimation of the next year's medical actions. Therefore, edges from the items of this year to items of the next year are generated between the nodes of this year's medical actions and the nodes of the next year's medical actions as seen from a structure 2101 illustrated in FIG. 21A .
- the structure 2101 illustrated in FIG. 21A The structure 2101 illustrated in FIG.
- 21A shows that the probability of prescription for insulin next year depends on the probability of prescription for a oral antidiabetic, and the probability of prescription for insulin, and the probability of prescription for dialysis this year.
- the medical actions are prescribed in the order of oral medicines, insulin, and dialysis.
- conditional probability for this model can be calculated by using data of two years of healthcare cost formatted information as shown in a table 2102 of FIG. 21B and a table 2106 of FIG. 21C . This makes it possible to calculate the probability that a person who has been given prescriptions only for oral medicines this year will be given a prescription for insulin or a prescription for dialysis next year.
- Such a dependency relation of the same classification items over a plurality of years is referred to as "transition”, and other relations are referred to as "cause and effect”.
- the probability of transition varies depending on the test value and lifestyle habits of individual persons. For example, the probability that a person who is given a prescription for a oral antidiabetic this year will be given a prescription for insulin next year is expected to be higher for a person having a higher blood sugar level. Hence, acquisition of more detailed personal information can provide a more rigorous probability of transition.
- a medical cost is calculated based on a medical action, and hence, when the medical cost is to be estimated, a directed link from the medical action of this year to the total points (medical cost) of the next year is defined. Further, in order to improve the accuracy of the medical cost, a directed link from this year's total points to the next year's total points is defined. Those definitions are illustrated in a structure 2202 in FIG. 22B .
- FIG. 23A The above-mentioned edges of the causation/transition relations are organized in a table 2301 shown in FIG. 23A .
- the table 2301 shows parents in rows and children in columns, and describes "transition" or "cause and effect” when there is an edge between a parent and a child, and shows a blank field when there is not such an edge.
- This model estimates the next year's medical actions from this year's test value, lifestyle habit, and medical actions, and estimates the next year's medical cost from this year's medical actions, the result of the estimation of the next year's medical actions, and this year's medical cost.
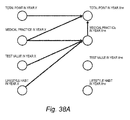
- FIG. 38A illustrates a node belonging to each classification by a single circle to schematically illustrate an edge between classifications.
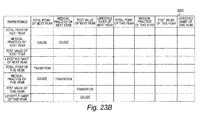
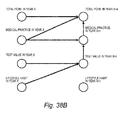
- FIGS. 23B and 23C Other definitions of the causation/transition relations are illustrated in FIGS. 23B and 23C .
- a model expressed by a table 2302 illustrated in FIG. 23B estimates the next year's test value from this year's test value and this year's lifestyle habit, and estimates the next year's medical actions based on the next year's test value.
- a model expressed by a table 2303 illustrated in FIG. 23C is a hybrid type combining the models expressed by the table 2301 and the table 2302, and estimates the next year's test value from this year's lifestyle habit and this year's test value. The model also estimates the next year's medical actions from this year's test value, this year's medical actions, and the next year's test value estimated.
- FIGS. 38B and 38C schematically show edges between classifications corresponding to the causation/transition relations illustrated in FIGS. 23B and 23C , respectively.
- an edge is defined to be directed from a lifestyle habit to a test value. This represents that the result of the lifestyle habit affects the test value.
- an edge is defined to be directed from a lifestyle habit to a medical action, and from a lifestyle habit to total points. This represents that the result of the lifestyle habit affects the medical action and the total points.
- an edge is defined to be directed from a test value to a medical action, and from a test value to total points. This represents that the result of the test value affects the medical action and the total points.
- an edge is defined to be directed from a medical action to total points. This represents that the medical action affects the total points.
- an edge is defined to be directed from a classification of year X to a classification of year X+ n .
- each of the age and the sex may be divided to generate different models. For example, a model may be generated with the age divided by every five years for male and female separately. When different models are not generated for different sex according to the age, but only a single model is generated, a directed link from this year's basic information to every item of the next year is defined. Any item other than the medical action, test value, lifestyle habit, and total points is excluded from a model, or a directed link from that item of this year to every item of the next year is defined.
- a directed link is defined to be directed from a node belonging to the classification of test values of year X to a node belonging to the classification of a medical action of year X+ n .
- an edge from a node belonging to the classification of a lifestyle habit of year X to a node belonging to the classification of a lifestyle habit of year X+ n is not defined.
- nodes with different periods are treated as nodes belonging to different classifications.
- the classification of test values of year X is treated as different from the classification of test values of year X+ n .
- Inter-node dependency calculating step 2002 the dependency between nodes (probability variables) is calculated.
- individual nodes have values of different properties.
- a test value such as BMI or fasting blood sugar
- the item "medical action" in healthcare cost formatted information is an integer value representing the number of prescriptions.
- the answer number for a subjective symptom for example, as a medical inquiry item is a value which does not have a quantitative meaning. Further, there is a missing value. Under such a circumstance, a method of comparing dependencies of variables of different properties with one another is needed.
- the first embodiment shows an example of calculating the dependency between nodes using two references, namely, the quantitative dependency reference and the co-occurrence dependency reference.
- the quantitative dependency reference is a reference for calculating the similarity between values that have quantitative meanings
- the co-occurrence dependency reference is a reference for calculating the similarity between values that do not have quantitative meanings or between a value that has a quantitative meaning and a value that does not have a quantitative meaning.
- the dependency between two probability variables X1 and X2 is calculated.
- x1 (x11, x12, ..., x1 n )
- the quantitative dependency to be described below is example based on the coefficient of correlation when x1 and x2 are considered as vectors.
- the quantitative dependency in this case is set to 0, and quantitative dependencies in the other cases are set as
- the quantitative dependency is effective in comparing pieces of data having quantitative values.
- the co-occurrence dependency is needed as an index to measure the degree of co-occurrence of values.
- a method of calculating the co-occurrence dependency is described by way of example where dependency between two probability variables X1 and X2 is calculated.
- the co-occurrence dependency to be described below is an example based on the entropies of x1 and x2.
- vectors with missing values eliminated are set as v1 and v2.
- the number of the elements of S is m .
- p (p1, p2)
- the number of the elements of S equal to p is given by np.
- the number of different elements of S is given by L.
- the entropy of a pair of v1 and v2 normalized with L is given by the following equation.
- e v ⁇ 1 , v ⁇ 2 ⁇ ⁇ - np / m ⁇ log ⁇ - np / m / L
- E is the sum of all the elements p of S.
- e(w1, w2) is calculated for randomized w1 and w2.
- e(v1, v2) is a positive value which becomes smaller as the degree of co-occurrence of v1 and v2 get larger. Accordingly, when the random and normalized e(v1, v2)/e(w1, w2) is larger than 1, it can be determined that v1 and v2 do not have a dependency relation.
- e(v1, v2)/e(w1, w2) is a value equal to or larger than 0. Accordingly, the co-occurrence dependency when e(v1, v2)/e(w1, w2) is larger than 1 is set to 0, and the co-occurrence dependency in the other cases is set to 1-e(v1, v2)/e(w1, w2).
- the quantitative dependency and the co-occurrence dependency which are defined in the above-mentioned manner are values equal to or larger than 0 and equal to or less than 1, and each dependency becomes greater as the value becomes larger.
- the dependencies are calculated for every pair of probability variables having edges defined in the causation/transition structure defining step 2001.
- the quantitative dependency is expressed as Q
- the co-occurrence dependency is expressed as C.
- a correction function f is expressed by f(C).
- f may be a linear function, or may be a more complex function.
- a method of determining parameters for f is described below.
- the value of the quantitative dependency Q(x1, x2) of x1 and x2 of the example 2005 be close to the value of the co-occurrence dependency C(x1, x2) of the example 2006. Therefore, a plurality of combinations of the vectors x1 and x2 having various quantitative dependencies are prepared to calculate Q(x1, x2), and x2 whose values are changed to random values are prepared to calculate C(x1, x2).
- x2 in the example 2006 is obtained by converting the value of x2 in the example 2005 from 0 to 1, from 1 to 0, from 2 to 3, and from 3 to 2.
- inter-node edge deleting step 2004, of the edges determined in the causation/transition structure defining step 2001 an edge located between nodes having D smaller than a predetermined threshold is deleted.
- the direction and the presence/absence of an edge between nodes belonging to different classifications are defined.
- the edge defined in the causation/transition structure defining step 2001 is defined between the node N1 and the node N2. Otherwise, an edge is not defined between the node N1 and the node N2.
- Constraint structure learning step 2007, a final inter-node edge structure is determined. Three examples are described hereinbelow.
- first example is described.
- only an edge between nodes that belong to different classifications defined by the processes up to Low-dependency inter-node edge deleting step 2004 and whose dependency is equal to or larger than the threshold is treated as an edge of a final disease causation/transition model.
- an edge between nodes that have the same period and belong to the same classification is not defined.
- a second example is described. Between nodes that belong to different classifications, the method of the first example is used for definition, and the structure of an edge between nodes that belong to the same classification is learned using an existing structure learning method.
- the edge structure can be efficiently learned by limiting the edge structure that is constructed as a result of the learning to, for example, the structure of a Bayesian network. Accordingly, the presence or absence of an edge is defined between nodes belonging to the same classification, and the direction of the edge is further defined when the edge is directed.
- the structure of an edge between nodes belonging to different classifications has already been defined.
- the edge structure formed through the above-mentioned processing may not be a Bayesian network structure as a whole even when the structure between nodes belonging to the same classification is a Bayesian network structure.
- a third example is described.
- the presence/absence and the direction of an edge between nodes that belong to different classifications are restricted based on edges that are defined by the processes up to Low-dependency inter-node edge deleting step 2004.
- restrictions are made to the two cases of the case where an edge is not present between nodes, or the case where an edge in the same direction is present.
- a restriction that an edge is not present between nodes is made. Under this restriction, the edge structure of the entire nodes is learned using the existing structure learning method.
- a method of performing discretization based on the ratio of the number of persons, which is described later in the description of a node generating unit 209 may be used.
- the node generating unit 110 defines event spaces for nodes and consolidates the nodes.
- a node has a sequential value like a test value.
- the estimation accuracy becomes low if the granularity of the number of prescriptions is small. Accordingly, discretization is preferred to be performed with an adequate granularity.
- the individual numbers of prescriptions are treated separately, the number of events for each number of prescriptions becomes small, which may undesirably reduce the accuracy of the probability table or may make generation of the probability table difficult.
- the event space may be manually defined beforehand.
- the weight may be expressed in divided ranks of 5 kilograms, and the event spaces for the corresponding nodes may be set to ⁇ ..., 50 to 54, 55 to 59, ... ⁇ .
- a collection of weight values from 50 kilograms to 54 kilograms is treated as a single event.
- event space is defined by a uniform method that does not depend on nodes. Specifically, the scale is divided by every k%, and sub scales from the lower p % to ( p + k )% are grouped into one.
- Nodes may not be consolidated.
- the process proceeds to the process of the probability table calculating unit 111.
- the number of cases for calculating a conditional probability become 0 in some circumstances. In this case, a process of estimating the conditional probability is needed, and this process is described later.
- the event space of a node defines the state (value) a probability variable takes, and is generated by discretizing value space of a corresponding item.
- discretization of a node is performed using two references.
- the first reference serves to achieve discretization in such a way that a sufficient number of cases for each state of the node after discretization are acquired. A sufficient number of cases are acquired when the discretization is rough, and hence a statistically reliable probability table can be generated.
- the second reference serves to achieve discretization in such a way that the expression of the dependency of the conditional probability distribution of a child node with respect to the state of this node after discretization is not lost.
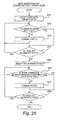
- FIG. 25 is a flowchart for the process of discretizing a node. The following describes an example of the process of discretizing a node without losing the expression of the dependency of probability of a child node while giving priority to the number of cases.
- Generation of a model requires generation of a probability table 1702 for X1 and a probability table 1703 for X2.
- the granularity of X1 is fine, the number of cases becomes few, and 0 depending on a situation. An insufficient number of cases raise a problem in that the probability value cannot be estimated or the reliability of the probability value is reduced. It is therefore necessary to perform discretization to provide an adequate granularity.
- a case number 2401 illustrated in FIG. 24 represents the number of cases for each state of X1.
- the values in the case number 2401 which represent the individual states become larger from left to right.
- a test value or the like is a sequential value for its meaning, but can be expressed in the illustrated manner because a test value is expressed discretely if divided finely to the granularity of effective digits.
- the leftmost field in 2401 represents the number of cases for 0.00 to 0.01
- the second field from the left in 2401 represents the number of cases for 0.01 to 0.02, and so forth.
- a case number 2402 represents the number of cases for each state of X2 when X1 is in a state expressed by a minimum value.
- the values in the case number 2402 become larger from left to right similarly to the values in the case number 2401.
- a case number 2403 represents the number of cases for each state of X2 when X1 takes a state larger than the minimum value by " 1".
- the currently selected state is S.
- the initial state of S is a state expressed by the minimum value of X1.
- Step 2504 S is regarded as a completed state, and it is checked in Step 2504 if there is an uncompleted state (next state on the right) (Step 2504).
- this state is set as S, and the process then returns to Step 2502.
- the process proceeds to Step 2505.
- This process can carry out discretization in such a way that each state has a stable number of cases, as shown in a case number 2407 of FIG. 24 .
- Step 2505 a state "0" at the left end of the case number 2407 and an adjoining state “1" are selected (Step 2505), and when two probability distributions, P(X2
- X1 0) and P(X2
- X1 1), do not have a significant difference (NO in Step 2506), the state "0" and the state "1" are combined (Step 2507). This process is repeated until the probability distributions have a difference. Then, a next state in X1 on the right is targeted (YES in Step 2508), and states are combined by a similar method.
- Step 2501 two minimum states after combination, namely the left end state and an adjoining state in the example of the case number 2407, are selected in Step 2501.
- the selected states are set as S1 and S2, respectively.
- Step 2506 the difference between P(X2
- X1 S1) and P(X2
- X1 S2) is determined in the above-mentioned manner in Step 2506.
- Step 2507 the state S1 and the state S2 are combined, and the combined state is newly set as S1, after which the process proceeds to Step 2508.
- Step 2506 when the two probability distributions do not have a significant difference in Step 2506, the state S2 is newly set as S1, after which the process proceeds to Step 2508.
- Step 2508 when there is a state next to S1 on the right, the state is set as S2, and the process proceeds to Step 2506.
- the process is terminated.
- the above-mentioned process can perform discretization of X1 with the child node X2 discretized.
- discretization is performed on the nodes in order starting with a leaf node which does not have a child node.
- the total-point node becomes a leaf node.
- the total-point node is discretized beforehand so that the granularity needed for estimation is provided.
- a node relating to a medical action becomes a leaf node.
- This discretization method is predetermined.
- discretization is performed based on two states of 0 and at least 1.
- discretization is performed based on three states of, for example, 0, 1 to 5, and at least 6.
- the above process achieves recursive discretization from a leaf node to a root node (node which does not have a parent) in order.
- the node generating unit 209 consolidates nodes.
- the probability table needs a case for the combination of the states of the probability variables of all of the parent nodes.
- X4 has three parent nodes X1, X2, and X3.
- a case is needed for the combination of all the states of X1, X2, and X3.
- the parent nodes are consolidated, and the states of the consolidated nodes are combined, as illustrated in FIG. 26B .
- FIG. 27 is a flowchart for a process of consolidating nodes.
- Step 2701 it is determined whether there are cases equal to or larger in number than a predetermined number for the combination of all the states of a parent node. When the number of cases is sufficient, this process is terminated.
- Maximum dependency pair consolidating step 2702 the dependency of parent nodes is calculated in the same way as used in Inter-node dependency calculating step 2002 to select a pair of nodes having a maximum dependency. It is considered that similar nodes having high dependencies give similar influences on child nodes. In this respect, two nodes having high dependencies are consolidated into a new node. When the numbers of states of the original two nodes are n1 and n2, the number of states of the new node is n1 ⁇ n2 which is the combination of the states of the two nodes.
- a structure 2602 shows a state where the node X2 and the node X3 are combined with the node X5 ( FIG. 26B ).
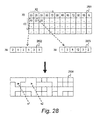
- State combining step 2703. A process of combining the states of the consolidated nodes is described referring to FIGS. 28 and 29 .
- FIG. 28 illustrates the states of nodes. Unlike FIG. 24 , however, FIG. 28 illustrates the states of X5, which is the combination of X2 and X3, two dimensionally as seen in a state 2801. The numbers of cases are arranged in such a way that the values of X2 become larger from left to right, and the values of X3 become larger from top to bottom.
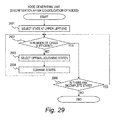
- a state at the upper left end is selected in Upper-left-end state selecting step 2901.
- the state is a combination that permits both X2 and X3 to take minimum values.
- a selected state is expressed by S.
- S is the state at the upper left end.
- Step 2905 the state 2801 is searched downward from the top row and from the left end to the right end in each row for any uncompleted state, and the first uncompleted state found is set as S, after which the process returns to Step 2902.
- an optimal adjoining state to be combined is selected in Optimal-adjoining-state selecting step 2903.
- the adjoining states are uncompleted states adjoining a currently selected state above, below, to the left, and to the right. Among those four adjoining states, a state that less influences the conditional probability distribution of the child node X4 when combined is an optimal state to be combined.
- an optimal state is selected from adjoining completed states, and is combined with the currently selected state.
- the combined state is newly set as S, after which the process returns to Step 2902.
- a state 2804 schematically shows how the two-dimensional combination is achieved.
- the state 2804 is illustrated with lines between combined states deleted.
- This process is recursively repeated from a leaf node toward a root node to complete consolidation of the nodes. This overcomes the problem such that combining the number of states of a parent node reduces the number of cases, which otherwise makes estimation difficult or reduces the estimation accuracy.
- the node generating unit 110 generates a causation/transition structure after consolidation of the nodes.
- the node generating unit 110 deletes nodes to be consolidated, and inserts the consolidated node which is newly generated by the consolidation.
- all the parent nodes of the nodes to be consolidated are set as parent nodes of the consolidated node. For example, as illustrated in FIGS. 31A to 31C , X2 and X3 are consolidated ( FIG. 31B ) from an original structure 3101 ( FIG. 31A ), yielding a structure 3103 which is newly inserted as X5 ( FIG. 31C ).
- the node generating unit 110 stores information on this structure in a causation/transition model storage unit 119, and information on the consolidation of the nodes and the combination of the states in a node information storage unit 120.
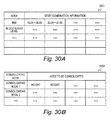
- FIG. 32 illustrates an example of the information stored in the causation/transition model storage unit 119.
- a table 3201 represents the information on the structure 3103, and shows the parent nodes of each node.
- FIG. 30 illustrates an example of the information stored in the node information storage unit 120.
- State combination information 3001 indicates the combination of the states of each node, and is generated by the discretization process ( FIG. 25 ). The state combination information 3001 shows that the values of BMI within a range from 18.01 to 20.00 form a single state.
- To-be-consolidated node information 3002 is a table showing consolidated nodes and nodes to be consolidated.
- the to-be-consolidated node information 3002 shows that a consolidated node 1 is the combination of a height node and a weight node.
- the state combination information of a consolidated node is the same as the state combination information 3001.
- the probability table calculating unit 111 generates a conditional probability table with the structure that is generated by the node generating unit 110 and is stored in the causation/transition model storage unit 119. This is the calculation of P(X
- X6 represents the blood sugar level in year X
- X7 represents the presence or absence of a prescription for oral antidiabetic in year X
- X5 represents the presence or absence of a prescription for insulin preparation in year X+ n
- "1" represents the presence of a prescription.
- a uniform distribution for example, may substitute for the conditional probability.
- the probability table calculating unit 111 calculates this probability for all the nodes, and stores the generated probability table in the causation/transition model storage unit 119.
- the disease onset probability/medical cost estimating unit 112 includes a model reconstructing unit 113, a disease state transition probability/ medical cost estimating unit 114, and a healthcare guidance supporting unit 115.
- the model reconstructing unit 113 reconstructs a model matching the user's intention from a causation/transition model stored in the causation/transition model storage unit 119 in response to a request from the healthcare guidance supporting unit 115.
- the reconstructed model is stored in a reconstructed model storage unit 121.
- the disease state transition probability/medical cost estimating unit 114 estimates disease onset probability and a medical cost by using the reconstructed model generated by the model reconstructing unit 113.
- the result of the estimation is stored in an estimation result storage unit 122.
- the model generated by the disease causation/transition model generating unit 108 is a large-scale model where a large number of nodes are related to one another. However, users are often interested in a part of this model. Therefore, the model reconstructing unit 113 provides a function of reconstructing only a model related to nodes necessary for a user. This not only can reduce the amount of calculation but also provides a model which is easy for a user to handle.
- the model reconstructing unit 113 reconstructs a model matching the user's intention in response to a request from the healthcare guidance supporting unit 115.
- the model reconstructing unit 113 constructs a model relating to the nodes.
- the node list includes nodes before consolidation.
- the nodes correspond to items in formatted information. For example, when a pathologic cause and effect and disease state transition which are related to diabetes are of interest, items, test values, and medical inquiry results that relate to associated medical actions are set up into a node list.
- N1, N2, ..., N k are selected.
- an edge structure is set in such a way that in the model generated by the disease causation/transition model generating unit 108, when there is a route moving through an edge directed from N i to N j , an edge directed from N i to N j is set, and when there is a route moving through an edge directed from N j to N i , an edge directed from N j to N i is set. Otherwise, an edge is not set.
- a conditional probability that is defined by the edge structure is acquired by marginalization of nodes that are not included in the list.
- a model illustrated in FIG. 36 is the original model, and X1 and X3 are given as a list of nodes.
- X1) is given by marginalization of X2 from the original model.
- P(X3 s3
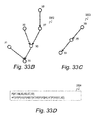
- a structure 3301 is a model which is generated by the disease causation/transition model generating unit 108, and is stored in the causation/transition model storage unit 119.
- X2 and X3 are consolidated to be X5.
- X3, X4, and X8 are given as a list of nodes.
- Given nodes and a node obtained by consolidating the given nodes, namely, X5, X4, and X8 in the structure 113, are selected from the model stored in the causation/transition model storage unit 119 as nodes of a reconstructed model.
- the model reconstructing unit 113 reconstructs a model including only X5, X4, and X8. At this time, when there is a route connecting the nodes selected as the nodes of the reconstructed model, a directed link is formed between the nodes even in the reconstructed model.
- a structure 3302 becomes a structure 3303.
- conditional probability is calculated to complete the reconstructed model.
- X5) is described instead of the description of the process.
- X5) can be calculated by ⁇ P(X4
- X1 s, X5), where ⁇ is the sum of all the states of X1.
- the conditional probability can also be acquired from the model stored in the causation/transition model storage unit 119.
- the above-mentioned process reconstructs a model which is constructed from nodes selected as a list of nodes when there is consolidation of nodes, and from a node after consolidation when nodes are consolidated.
- the definition of an edge and the calculation of the conditional probability that follow the reconstruction of the model are the same as those when there is no node consolidation.
- the model reconstructing unit 113 need not perform model reconstruction, and hence the model generated by the disease causation/transition model generating unit 108 is used. Further, the model generated by the disease causation/transition model generating unit 108 may be used for the model that is used by the disease state transition probability/medical cost estimating unit 114 in the estimation, and the model reconstructing unit 113 may form only a network chart to be displayed on a display apparatus in the healthcare guidance supporting unit 115 into a reconstructed model. The network chart and the probability table in this case are based on the above-mentioned reconstructed model.
- the disease state transition probability/medical cost estimating unit 114 estimates the disease onset probability of a disease and the medical cost thereof by using the model reconstructed by the model reconstructing unit 113, or the model generated by the disease causation/transition model generating unit 108 and stored in the causation/transition model storage unit 119.
- X5 is an item relating to the number of prescriptions for insulin next year
- the probability indicates a probability that the number of prescriptions for insulin becomes a number specified by s.
- the joint distribution of X1, X4, X5, X6, X7, and X8 is given by the following expression.
- This calculation can be executed by using the probability table that is generated by the probability table calculating unit 111 and is stored in the causation/transition model storage unit 119.
- This is equivalent to, for example, a case of estimating the next year's medical actions and medical cost while the state of an obtained test value of this year's health checkup as a node is fixed.
- the above-mentioned processing can ensure estimation of the states of nodes equivalent to the next year's medical action and medical cost with this year's information obtained.
- P(X) is acquired with the medical cost node being denoted by X
- estimated probability values are acquired for the individual points of the medical cost.
- the next year's medical cost can be estimated as the expected value.
- the above-mentioned expression calculates the sum of all the states, and hence it takes a considerable time for the calculation.
- Algorithms that efficiently acquire the sum have been proposed. Examples of the algorithms include the message passing algorithm and the junction tree algorithm.
- the disease state transition probability/medical cost estimating unit 114 may use those algorithms.
- the healthcare guidance supporting unit 115 provides a function of supporting healthcare guidance for preventing future disease onset.
- the following describes two functions including a support function of supporting a health insurance business operator in preparing a healthcare guidance plan, and a function of supporting a person responsible for healthcare guidance or a subject person.
- a health insurance business operator wants to select subject persons who get a high prevention effect brought by healthcare guidance by priority within the budget of healthcare guidance, and to perform guidance suitable for each subject person.
- There are a plurality of healthcare guidance services (healthcare guidance service 1, healthcare guidance service 2, etc.) that can be provided by a health insurance business operator.
- the healthcare guidance service 1 is a guidance to mainly reduce the BMI value
- the healthcare guidance service 2 is a guidance to drop the cholesterol value.
- FIG. 34A is a flowchart of the process for the support function for a health insurance business operator.
- a target disease for the process is set.
- the model reconstructing unit 113 reconstructs a model by using items in medical actions, items in health checkup, and medical inquiry items corresponding to diabetes, lipid abnormality, and hypertension among items in healthcare cost formatted information.
- the model generated by the disease causation/transition model generating unit 108 and stored in the causation/transition model storage unit 119 is used.
- next Healthcare guidance service setting step 3402 the types of healthcare guidance services and assumed effects of the individual healthcare guidance services are set.
- the assumed effects of the healthcare guidance service 1 include a weight reduction of 5 kilograms.
- next Healthcare-guidance effect estimating step 3403 the effect of reducing the medical cost is estimated for all combinations of the healthcare guidance services and the subject candidates for the healthcare guidance.
- the next year's medical cost for the healthcare-guidance subject candidate 1 when the healthcare guidance service is not provided is estimated. Based on the healthcare cost, and the values of the health checkup and medical inquiry for the healthcare-guidance subject candidate 1 this year, the states of nodes corresponding to the items of this year are set, and the disease state transition probability/medical cost estimating unit 114 estimates the medical cost (C1). Next, values of test values that are improved by the healthcare guidance service are set in this year's values of the healthcare-guidance subject candidate 1, and the disease state transition probability/medical cost estimating unit 114 estimates the next year's medical cost (C2).
- one of all the combinations of the healthcare guidance services and the healthcare-guidance subject candidates which provides a greatest cost effectiveness for reducing the medical cost is selected. Then, the selected healthcare-guidance subject candidate is treated as selected. Then, one of the combinations of the healthcare guidance services for unselected healthcare-guidance subject candidates and the unselected healthcare-guidance subject candidates which provides a greatest cost effectiveness for reducing the medical cost is selected. Then, the selected healthcare-guidance subject candidate is treated as selected. In this manner, the combinations of the healthcare guidance services for healthcare-guidance subject candidates and the healthcare-guidance subject candidates can be selected in descending order of the effect. Finally, the combinations that provide a large effect are selected within the range of the budget of healthcare guidance to set a healthcare-guidance subject candidate and the contents of healthcare guidance therefor.
- Effect estimating step 3405 the values of the cost effectiveness for reducing the medical cost of the combinations selected in Healthcare guidance contents designing step 3404 are summed up, and a value obtained by subtracting the healthcare guidance cost from the effect of reducing the medical cost is output as an effect.
- FIG. 34B is a flowchart of the process for the support function for a person responsible for healthcare guidance and a subject person.
- a target disease for the process is set.
- the model reconstructing unit 113 reconstructs a model by using items in medical actions, items in health checkup, and medical inquiry items corresponding to diabetes, lipid abnormality, and hypertension among items in healthcare cost information.
- the model generated by the disease causation/transition model generating unit 108 and stored in the causation/ transition model storage unit 119 is used.
- Subject disease setting step 3401 Another example of the process of Subject disease setting step 3401 is described.
- a subject person or a person responsible for healthcare guidance selects a disease to be treated. In other words, an item corresponding to a certain medical action is selected. Then, the dependencies of this item with respect to all of the other items are calculated by methods similar to those of Steps 2002 and 2003. Then, those items which each have at least a certain level of dependency to the selected item are extracted, and the model reconstructed by the model reconstructing unit 113 based on a list of the selected item and the extracted items is used.
- the disease state transition probability/medical cost estimating unit 114 estimates the next year's disease state transition probability and medical cost of each of the diseases.
- the disease state transition probability of each disease can be acquired as a probability that the next year's number of prescriptions for nodes relating the medical action corresponding to this disease is at least one. This can be considered as the average disease probability of the disease. Then, based on the healthcare cost, and the values of the health checkup and medical inquiry for the subject person of this year, the states of nodes corresponding to the items of this year are set, and the disease state transition probability/medical cost estimating unit 114 estimates the next year's disease state transition probability and medical cost for each disease.
- the disease probability of each disease at this point of time is the disease probability of the disease of the subject person. Accordingly, for each disease, the disease probability of the disease of the subject person is divided by the average disease probability of the disease to calculate how many times the average disease probability higher the risk of developing disease of the subject person is.
- High-risk disease presenting step 3407 a disease whose risk of developing disease is higher than the average disease probability by at least a predetermined threshold, and the risk of developing disease are presented. Accordingly, the subject person or the person responsible for healthcare guidance can know the risk of developing disease of the subject person.
- Item-to-be-improved presenting step 3408 a test value that has at least a certain level of dependency to the medical action node corresponding to the high-risk disease calculated in High-risk disease presenting step 3407 is presented.
- the dependency is calculated by methods similar to those of Steps 2002 and 2003 of FIG. 20A .
- Step 3409 of allowing the user to input a target value (Target value user inputting step 3409)
- the user is prompted to input an improving target value (e.g., the target value of weight) for a test item presented in Item-to-be-improved presenting step 3408.
- an improving target value e.g., the target value of weight
- the test item input in Target value user inputting step 3409 is updated with the target value
- the disease probability of the disease after the target is achieved is estimated by a method similar to the one used for Step 3406, and a change in the risk of developing disease is presented. Viewing a change in the risk of developing disease, the user can set the improving target, and make good use of the change in self-management.
- the healthcare guidance supporting unit 115 may display a model to be used in analysis as a network chart.
- the healthcare guidance supporting unit 115 may also display the risk of developing disease in the vicinity of an edge. Accordingly, the user can easily grasp how the state of the disease changes and the factor that affects the change. This feature is effective at the time of preparing the contents of healthcare guidance and setting the target to be improved by the healthcare guidance.
- the disease causation/transition model generating unit 108 constructs a graphical model constructed by nodes based on items in healthcare cost information, health checkup information, and medical inquiry information. Then, the model reconstructing unit 113 reconstructs a graphical model of an adequate scale matching the purpose.
- This configuration can ensure estimation using a compact model, and fast estimation. It is not necessary to handle a large-scale model including nodes which do not match the purpose, helping the user understand the structure of a model. This improves the readability and facilitates an analysis.
- the causation/transition structure calculating unit 109 restricts the direction of an edge between nodes representing a medical cost, a medical action, a test value, and a lifestyle habit. This signifies that a lifestyle habit influences a test value, a test value influences a medical action, a medical action influences a medical cost, and those past states influence the states in future.
- Such restriction to the direction of an edge between nodes can reduce the amount of calculation for learning a structure, and can provide a model which is intuitively easy to understand.
- the node generating unit 110 consolidate nodes to define event space from two viewpoints: to secure the number of cases at the time of generating a conditional probability table and to maintain the dependency of the probability distribution of a child node to a parent node. Accordingly, a statistically reliable conditional probability table can be generated, and the estimation accuracy can be increased. Further, the event space of a node (probability variable) can be made small, which is advantageous from the viewpoint of the amount of calculation.
- the healthcare guidance supporting unit 115 estimates a future state of a disease and a future medical cost by using a reconstructed model.
- the model of the first embodiment considers various factors, and hence it is possible to achieve accurate estimation.
- an intervention effect originating from healthcare guidance can be estimated by performing estimation with the current test value of an insured person replaced with a value representing an expected improvement originating from healthcare guidance.
- displaying a model which is used in those analyses in the form of a network chart enables a user to grasp the influence originating from a change in state of a disease, and is effective in preparing the contents of healthcare guidance and setting a target to be improved by the healthcare guidance.
- This model is a reconstructed model, and is a chart formed by nodes to which a user pays attention, and hence the user is likely to show an interest in the model.
- a future disease probability and a future medical cost can be estimated accurately based on medical data such as healthcare cost information, health checkup information, and medical inquiry information. Factors effective for estimation can be automatically selected based on data, thus ensuring estimation in view of multiple factors. Further, diseases included in healthcare cost information can be analyzed, and hence a healthcare-guidance subject and the contents of healthcare guidance which show high cost effectiveness can be selected for various diseases.
- the analysis system configured to include the model generating function (causation/transition structure calculating unit 109) and the model reconstructing function (model reconstructing unit 113) can achieve fast estimation for various diseases with high concealment of personal information.
- the model generating function generates an extremely and large-scale model designed for all diseases (all items in the healthcare cost record, and health checkup items), and the model reconstructing function reconstructs a compact model matching the purpose.
- the model generating function alone increases the scale of a model and increases the amount of calculation for estimation, and hence the model is difficult to use.
- a model including an irrelevant disease as well is difficult to use.
- a model designed for each purpose may be generated as another approach, but this approach requires a significant amount of calculation in order to construct a model, undesirably making it necessary to hold original data (healthcare cost information, and health checkup information).
- the model generating function generates an extremely and large-scale model designed for all diseases, and a model matching the purpose is reconstructed from the generated model.
- the amount of calculation for reconstructing a model is not huge, and hence a model can be reconstructed easily. Further, the reconstructed model is compact, and hence the calculation cost for estimation is small.
- the model generated by the model generating function is held, original data is unnecessary, and hence confidential information (personal information) need not be held at the time of performing estimation. This ensures effective and efficient use of a large amount of data.
- the nodes are generated from a graphical model including the states of the nodes as the values of the items and the probability dependencies between the nodes serving as edges. Accordingly, the state of a child node depends on the state of a parent node, and can be given by the conditional probability of the parent node.
- the edges of the graphical model are characterized by the transition and a cause and effect.
- the current lifestyle habit and the current test value have a causal relation therebetween
- the current test value and the current clinical action have a causal relation therebetween
- the current clinical action and a future clinical action have a transitional relation therebetween
- a future clinical action and a future medical cost have a transitional relation therebetween.
- the current lifestyle habit and the current test value have a causal relation therebetween
- the current test value and a future test value have a transitional relation therebetween
- a future test value and a future clinical action have a causal relation therebetween
- a future clinical action and a future medical cost have a transitional relation therebetween.
- the current medical cost and a future medical cost have a transitional relation therebetween.
- the increase in the scale of a model may suffer an insufficient number of cases for defining the conditional probabilities of the parent nodes of the individual nodes.
- the probability distribution of the states of a child node is given by the combinations of the states of the parent node, requiring a sufficient number of cases for all the combinations of the states of the parent node. Accordingly, it is preferred that the resolution of the states of a parent node and the number of parent nodes be small. When the resolution of the states of a parent node and the number of parent nodes are small, however, the accuracy of a generated model drops.
- the node generating unit 110 performs consolidation and discretization of parent nodes in such a way as to reduce the influence on the probability distribution of child nodes and provide a sufficient number of cases. This process is carried out in order from a leaf node toward a root node.
- model generating function generates a model for each of items that are always distinguished, i.e., for each age range and each sex of insured persons, making it possible to construct a highly usable model.
- the healthcare guidance supporting unit selects a list of all or some of the probability variables of diabetes, hypertension, and lipid abnormality, and hence lifestyle-related diseases which are major causes to increase medical costs can be analyzed.
- a graphical model is constructed based on tabular information formed from items and data entries.
- the following describes an example of an analysis system that estimates an unknown value of newly acquired data based on the constructed model.
- FIG. 2 is a block diagram illustrating the configuration of an analysis system according to the second embodiment.
- the analysis system includes a data analysis apparatus 201 and a database 214.
- the data analysis apparatus 201 includes an input unit 202, an output unit 203, an processing device 204, a memory 205, and a storage medium 206.
- the configurations and functions of those components are identical to those of the input unit 102, the output unit 103, the processing device 104, the memory 105, and the storage medium 106 of the first embodiment, respectively.
- the data that is handled in the second embodiment is tabular data 3701 shown in FIG. 37A showing X1, X2, and so forth as item names with a single data entry shown in a single row. Each column has the values of data entries for a single item stored therein.
- This tabular data 3701 is stored in a tabular information storage unit 215.
- a graphical model having items X1, X2, so forth as nodes (probability variables) is constructed.
- Nodes are hereinafter expressed by Xi representing item names.
- Each row corresponds to an insured person of the first embodiment, and respective items correspond to items in healthcare cost information, health checkup information, and medical inquiry information of the first embodiment.
- a graphical model generating unit 207 constructs a graphical model having the items X1, X2, so forth as nodes.
- a graphical model structure calculating unit 208 defines an edge between items. With prior knowledge given, the presence/absence of a node, and the type of a node may be restricted. Assuming that a structure is a Bayesian network, then there is an efficient algorithm that learns edge structures. At this time, the dependency between items may be calculated by a method similar to the one used by the causation/transition structure calculating unit 109, and when the dependency is equal to or less than a threshold, the structure may be learned with a restriction made to indicate absence of an edge. The generated edge structure is stored in a graphical model storage unit 216.
- the node generating unit 209 performs a process similar to that of the node generating unit 110 according to the first embodiment.
- the generated node information is stored in a node information storage unit 217.
- a probability table calculating unit 210 performs a process similar to that of the probability table calculating unit 111 according to the first embodiment.
- the generated probability table is stored in a graphical model storage unit 216.
- An estimating unit 211 estimates an unknown value included in a new data entry made.
- data 3702 shown in FIG. 37B is given, for example, the values of items X4 and X5 in the data 3702 are unknown. Accordingly, the values of the items X4 and X5 are estimated based on known values in the data 3702 and the model constructed by the graphical model generating unit 207.
- the known values correspond to the values of this year's healthcare cost information, health checkup information, and medical inquiry information according to the first embodiment, whereas the unknown values correspond to the values of the next year's healthcare cost information, health checkup information, and medical inquiry information according to the first embodiment.
- a simple graphical model reconstructing unit 212 reconstructs a model constructed from a list of specified nodes.
- the simple graphical model reconstructing unit 212 performs a process similar to that of the model reconstructing unit 113 according to the first embodiment.
- the reconstructed model is stored in a reconstructed model storage unit 218.
- a probability inferring unit 213 specifies a list of nodes needed depending on the purpose for the simple graphical model reconstructing unit 212 to reconstruct a model. Further, the probability inferring unit 213 estimates unknown values in data input from the input unit 202 by using the model reconstructed by the simple graphical model reconstructing unit 212. The results of the estimation are stored in an estimation result storage unit 219.
- the analysis system according to the second embodiment may be a computer system including a single computer, or a computer system including a server and client terminals.
- the graphical model generating unit 207 and the estimating unit 211 of the analysis apparatus 201 may be configured as separate apparatus.
- the analysis system is a computer system configured on a single computer, or a plurality of computers logically or physically constructed, and may operate on separate threads on the same computer or may operate on virtual computers configured on a plurality of physical computer resources.
- Each server is provided with a program that is executed by the processing device 204 through a removable medium (CD-ROM, flash memory, or the like) or over a network, and is stored in a non-volatile storage apparatus which is a non-transitory storage medium. Therefore, it is preferred that the computer system include an interface that ensures reading from a removable medium.
- the above-described configurations, functions, processing modules, and processing means, for all or a part of them, may be implemented by hardware: for example, by designing an integrated circuit.
- the above-described configurations and functions may be implemented by software, which means that a processor interprets and executes programs providing the functions.
- the information of programs, tables, and files to implement the functions may be stored in a storage device such as a memory, a hard disk drive, or an SSD (a Solid State Drive), or a storage medium such as an IC card, or an SD card.
- the drawings shows control lines and information lines as considered necessary for explanation but do not show all control lines or information lines in the products. It can be considered that almost of all components are actually interconnected.
Landscapes
- Engineering & Computer Science (AREA)
- Health & Medical Sciences (AREA)
- Medical Informatics (AREA)
- Public Health (AREA)
- Biomedical Technology (AREA)
- Epidemiology (AREA)
- Primary Health Care (AREA)
- General Health & Medical Sciences (AREA)
- General Business, Economics & Management (AREA)
- Business, Economics & Management (AREA)
- Pathology (AREA)
- Databases & Information Systems (AREA)
- Data Mining & Analysis (AREA)
- Medical Treatment And Welfare Office Work (AREA)
- Information Retrieval, Db Structures And Fs Structures Therefor (AREA)
- Management, Administration, Business Operations System, And Electronic Commerce (AREA)
Applications Claiming Priority (1)
| Application Number | Priority Date | Filing Date | Title |
|---|---|---|---|
| JP2013104664A JP6066826B2 (ja) | 2013-05-17 | 2013-05-17 | 分析システム及び保健事業支援方法 |
Publications (2)
| Publication Number | Publication Date |
|---|---|
| EP2804119A2 true EP2804119A2 (fr) | 2014-11-19 |
| EP2804119A3 EP2804119A3 (fr) | 2015-03-11 |
Family
ID=50735917
Family Applications (1)
| Application Number | Title | Priority Date | Filing Date |
|---|---|---|---|
| EP14168538.8A Ceased EP2804119A3 (fr) | 2013-05-17 | 2014-05-15 | Système d'analyse et procédé de support commercial de santé |
Country Status (4)
| Country | Link |
|---|---|
| US (1) | US20140343965A1 (fr) |
| EP (1) | EP2804119A3 (fr) |
| JP (1) | JP6066826B2 (fr) |
| CN (1) | CN104166667B (fr) |
Cited By (3)
| Publication number | Priority date | Publication date | Assignee | Title |
|---|---|---|---|---|
| CN109063940A (zh) * | 2018-02-05 | 2018-12-21 | 重庆邮电大学 | 基于变结构贝叶斯网络的智能车辆威胁估计系统及方法 |
| EP3467762A4 (fr) * | 2016-05-23 | 2020-01-22 | NEC Solution Innovators, Ltd. | Dispositif de prédiction d'état de santé, procédé de prédiction d'état de santé et support d'enregistrement lisible par ordinateur |
| US20210217097A1 (en) * | 2015-09-30 | 2021-07-15 | Sensormatic Electronics, LLC | Sensor based system and method for augmenting underwriting of insurance policies |
Families Citing this family (34)
| Publication number | Priority date | Publication date | Assignee | Title |
|---|---|---|---|---|
| JP6220310B2 (ja) * | 2014-04-24 | 2017-10-25 | 株式会社日立製作所 | 医用画像情報システム、医用画像情報処理方法及びプログラム |
| WO2016120986A1 (fr) * | 2015-01-27 | 2016-08-04 | 株式会社日立製作所 | Système d'analyse, et procédé d'assistance pour les métiers de la santé |
| WO2016126994A1 (fr) * | 2015-02-06 | 2016-08-11 | Quorum.Ai Inc. | Système et procédé pour utiliser l'intelligence artificielle lors de la prise de décisions |
| JP6301853B2 (ja) * | 2015-02-18 | 2018-03-28 | 株式会社日立製作所 | 経年変化予測システム |
| US20180004903A1 (en) * | 2015-05-12 | 2018-01-04 | Hitachi, Ltd. | Analysis system and analysis method |
| US10991053B2 (en) * | 2015-07-02 | 2021-04-27 | DZee Solutions, Inc. | Long-term healthcare cost predictions using future trajectories and machine learning |
| WO2017013712A1 (fr) * | 2015-07-17 | 2017-01-26 | 株式会社日立製作所 | Système et procédé de service d'informations d'assurance |
| JP6468652B2 (ja) * | 2015-07-21 | 2019-02-13 | Kddi株式会社 | 医療データ解析装置 |
| JP2017037489A (ja) * | 2015-08-10 | 2017-02-16 | 株式会社リコー | 情報処理システム、情報処理装置及び情報処理方法 |
| JP6593231B2 (ja) * | 2016-03-14 | 2019-10-23 | 富士通株式会社 | レセプト電算ファイル作成プログラム、レセプト電算ファイル作成装置及びレセプト電算ファイル作成方法 |
| WO2018042606A1 (fr) * | 2016-09-01 | 2018-03-08 | 株式会社日立製作所 | Dispositif d'analyse, support d'analyse et procédé d'analyse |
| JP6567484B2 (ja) * | 2016-09-29 | 2019-08-28 | 株式会社日立製作所 | 推計モデル構築システム、推計モデル構築方法及びプログラム |
| US20190311810A1 (en) * | 2016-12-12 | 2019-10-10 | Koninklijke Philips N.V. | System and method for facilitating computational analysis of a health condition |
| JP6203440B1 (ja) * | 2017-02-02 | 2017-09-27 | 株式会社アルム | 情報処理装置、及び情報処理システム |
| US11023817B2 (en) | 2017-04-20 | 2021-06-01 | International Business Machines Corporation | Probabilistic estimation of node values |
| JP6537121B1 (ja) * | 2017-12-19 | 2019-07-03 | 学校法人産業医科大学 | 傷病別医療費推計装置および方法並びにプログラム |
| KR102153161B1 (ko) * | 2017-12-21 | 2020-09-08 | 한국과학기술원 | 확률 그래프 기반의 서열 데이터 연관성 학습 방법 및 시스템 |
| JP6531241B1 (ja) * | 2018-03-14 | 2019-06-19 | メドケア株式会社 | 効率化支援システム及び医療効率化支援方法 |
| US11281995B2 (en) | 2018-05-21 | 2022-03-22 | International Business Machines Corporation | Finding optimal surface for hierarchical classification task on an ontology |
| EP3837693A1 (fr) * | 2018-10-11 | 2021-06-23 | Siemens Healthcare GmbH | Réseau de soins de santé |
| KR101944100B1 (ko) * | 2018-10-16 | 2019-01-30 | 장봉석 | 행위패턴인식을 이용한 관리시스템 |
| CN109308793A (zh) * | 2018-10-22 | 2019-02-05 | 平安医疗健康管理股份有限公司 | 基于数据处理的药品费用超标预警方法及装置 |
| CN111383123A (zh) * | 2018-12-29 | 2020-07-07 | 天津幸福生命科技有限公司 | 临床医疗开销的统计方法、装置、存储介质及电子设备 |
| US11676043B2 (en) | 2019-03-04 | 2023-06-13 | International Business Machines Corporation | Optimizing hierarchical classification with adaptive node collapses |
| US11531908B2 (en) * | 2019-03-12 | 2022-12-20 | Ebay Inc. | Enhancement of machine learning-based anomaly detection using knowledge graphs |
| JP7191800B2 (ja) * | 2019-10-23 | 2022-12-19 | 株式会社東芝 | 健康支援システム、プログラム及び方法 |
| JP7359345B2 (ja) * | 2020-02-14 | 2023-10-11 | 株式会社メガ・テクノロジー | 安全情報管理システムおよびその方法 |
| US12045282B2 (en) * | 2020-03-27 | 2024-07-23 | International Business Machines Corporation | Fault localization and alert aggregation |
| WO2021211804A1 (fr) * | 2020-04-15 | 2021-10-21 | Healthpointe Solutions, Inc. | Suivi d'une maladie infectieuse à l'aide d'un profil de risque clinique complet et réalisation d'actions en temps réel par l'intermédiaire d'un portail clinique |
| CN112017743B (zh) * | 2020-08-20 | 2024-02-20 | 姚香怡 | 一种疾病风险评测报告自动生成平台及应用 |
| KR102241399B1 (ko) * | 2020-08-25 | 2021-04-16 | 주식회사 쓰리빌리언 | 증상의 질병 특이도 측정 시스템 |
| CN112331355B (zh) * | 2020-11-26 | 2024-03-19 | 微医云(杭州)控股有限公司 | 病种评估表的生成方法、装置、电子设备及存储介质 |
| JP7707015B2 (ja) * | 2021-09-29 | 2025-07-14 | 株式会社日立製作所 | 知識管理装置および知識管理方法 |
| CN119968683A (zh) * | 2022-11-30 | 2025-05-09 | 一般财团法人Lhs研究所 | 健康管理支援系统、健康管理支援方法以及程序 |
Citations (1)
| Publication number | Priority date | Publication date | Assignee | Title |
|---|---|---|---|---|
| JP2012128670A (ja) | 2010-12-15 | 2012-07-05 | Hitachi Ltd | 保健事業支援システム、保険事業支援装置、及び保険事業支援プログラム |
Family Cites Families (10)
| Publication number | Priority date | Publication date | Assignee | Title |
|---|---|---|---|---|
| US6601055B1 (en) * | 1996-12-27 | 2003-07-29 | Linda M. Roberts | Explanation generation system for a diagnosis support tool employing an inference system |
| US6687685B1 (en) * | 2000-04-07 | 2004-02-03 | Dr. Red Duke, Inc. | Automated medical decision making utilizing bayesian network knowledge domain modeling |
| WO2006026383A2 (fr) * | 2004-08-26 | 2006-03-09 | Strategic Health Decisions, Inc. | Systeme pour optimiser les strategies de traitement au moyen d'un systeme d'evaluation specifique du patient |
| US8122012B2 (en) * | 2005-01-14 | 2012-02-21 | International Business Machines Corporation | Abstract record timeline rendering/display |
| JP5038671B2 (ja) * | 2006-09-25 | 2012-10-03 | 株式会社東芝 | 検査項目選定装置、検査項目選定方法、及び検査項目選定プログラム |
| US8676598B2 (en) * | 2009-03-31 | 2014-03-18 | Jacob George Kuriyan | Chronic population based cost model to compare effectiveness of preventive care programs |
| US11562323B2 (en) * | 2009-10-01 | 2023-01-24 | DecisionQ Corporation | Application of bayesian networks to patient screening and treatment |
| US9934361B2 (en) * | 2011-09-30 | 2018-04-03 | Univfy Inc. | Method for generating healthcare-related validated prediction models from multiple sources |
| US20130116999A1 (en) * | 2011-11-04 | 2013-05-09 | The Regents Of The University Of Michigan | Patient-Specific Modeling and Forecasting of Disease Progression |
| US8732096B1 (en) * | 2011-12-17 | 2014-05-20 | Vacslav Glukhov | Method and computer system for making optimal medical decisions |
-
2013
- 2013-05-17 JP JP2013104664A patent/JP6066826B2/ja not_active Expired - Fee Related
-
2014
- 2014-05-15 US US14/278,154 patent/US20140343965A1/en not_active Abandoned
- 2014-05-15 EP EP14168538.8A patent/EP2804119A3/fr not_active Ceased
- 2014-05-16 CN CN201410208444.4A patent/CN104166667B/zh active Active
Patent Citations (1)
| Publication number | Priority date | Publication date | Assignee | Title |
|---|---|---|---|---|
| JP2012128670A (ja) | 2010-12-15 | 2012-07-05 | Hitachi Ltd | 保健事業支援システム、保険事業支援装置、及び保険事業支援プログラム |
Cited By (4)
| Publication number | Priority date | Publication date | Assignee | Title |
|---|---|---|---|---|
| US20210217097A1 (en) * | 2015-09-30 | 2021-07-15 | Sensormatic Electronics, LLC | Sensor based system and method for augmenting underwriting of insurance policies |
| EP3467762A4 (fr) * | 2016-05-23 | 2020-01-22 | NEC Solution Innovators, Ltd. | Dispositif de prédiction d'état de santé, procédé de prédiction d'état de santé et support d'enregistrement lisible par ordinateur |
| CN109063940A (zh) * | 2018-02-05 | 2018-12-21 | 重庆邮电大学 | 基于变结构贝叶斯网络的智能车辆威胁估计系统及方法 |
| CN109063940B (zh) * | 2018-02-05 | 2024-01-26 | 重庆邮电大学 | 基于变结构贝叶斯网络的智能车辆威胁估计系统及方法 |
Also Published As
| Publication number | Publication date |
|---|---|
| JP6066826B2 (ja) | 2017-01-25 |
| CN104166667B (zh) | 2018-04-20 |
| CN104166667A (zh) | 2014-11-26 |
| US20140343965A1 (en) | 2014-11-20 |
| JP2014225176A (ja) | 2014-12-04 |
| EP2804119A3 (fr) | 2015-03-11 |
Similar Documents
| Publication | Publication Date | Title |
|---|---|---|
| EP2804119A2 (fr) | Système d'analyse et procédé de support commercial de santé | |
| Petersen et al. | Longitudinal relationship between loneliness and social isolation in older adults: Results from the cardiovascular health study | |
| Klompas et al. | Automated detection and classification of type 1 versus type 2 diabetes using electronic health record data | |
| Kang et al. | Utilizing home healthcare electronic health records for telehomecare patients with heart failure: a decision tree approach to detect associations with rehospitalizations | |
| US7584166B2 (en) | Expert knowledge combination process based medical risk stratifying method and system | |
| EP2804121A2 (fr) | Système d'analyse et procédé de support commercial de santé | |
| KR101897080B1 (ko) | 의료 기록 문서에서의 의료 단어의 연관 규칙 생성 방법 및 그 장치 | |
| US20190147988A1 (en) | Hospital matching of de-identified healthcare databases without obvious quasi-identifiers | |
| Junqueira et al. | A machine learning model for predicting ICU readmissions and key risk factors: analysis from a longitudinal health records | |
| WO2015071968A1 (fr) | Système d'analyse | |
| Zaman et al. | A review on the significance of body temperature interpretation for early infectious disease diagnosis | |
| Stival et al. | A Bayesian approach to model local and temporal heterogeneity in repeated cross-sectional health surveys | |
| CN110517779B (zh) | 数据处理方法、装置、电子设备及可读存储介质 | |
| US20240071623A1 (en) | Patient health platform | |
| Hug | Predicting the risk and trajectory of intensive care patients using survival models | |
| Cheng et al. | Improving personalized clinical risk prediction based on causality-based association rules | |
| Wei et al. | Genetic and Survey Data Improves Performance of Machine Learning Model for Long COVID | |
| KR102895541B1 (ko) | 당뇨병 환자의 우울증 확률 예측 시스템, 당뇨병 환자의 우울증 확률 예측 방법 및 기록 매체에 저장된 프로그램 | |
| EP2685407A1 (fr) | Système informatique, procédé et programme pour quantifier la fourniture de qualité de service | |
| Bose et al. | Female Diabetic Prediction in India Using Different Learning Algorithms | |
| Ghosh et al. | Markov logic networks in health informatics | |
| Welch | Implementation, evaluation and application of multiple imputation for missing data in longitudinal electronic health record research | |
| Gorbach et al. | Pattern Mixture Sensitivity Analyses via Multiple Imputations for Non‐Ignorable Dropout in Joint Modeling of Cognition and Risk of Dementia | |
| Wagstaff et al. | The 2018 Health Equity and Financial Protection Indicators Database | |
| Broszczak | Combining Biclustering with Probabilistic Predictive Models to Develop Personalised Sets for the Famous Faces Test |
Legal Events
| Date | Code | Title | Description |
|---|---|---|---|
| PUAI | Public reference made under article 153(3) epc to a published international application that has entered the european phase |
Free format text: ORIGINAL CODE: 0009012 |
|
| 17P | Request for examination filed |
Effective date: 20140603 |
|
| AK | Designated contracting states |
Kind code of ref document: A2 Designated state(s): AL AT BE BG CH CY CZ DE DK EE ES FI FR GB GR HR HU IE IS IT LI LT LU LV MC MK MT NL NO PL PT RO RS SE SI SK SM TR |
|
| AX | Request for extension of the european patent |
Extension state: BA ME |
|
| PUAL | Search report despatched |
Free format text: ORIGINAL CODE: 0009013 |
|
| AK | Designated contracting states |
Kind code of ref document: A3 Designated state(s): AL AT BE BG CH CY CZ DE DK EE ES FI FR GB GR HR HU IE IS IT LI LT LU LV MC MK MT NL NO PL PT RO RS SE SI SK SM TR |
|
| AX | Request for extension of the european patent |
Extension state: BA ME |
|
| RIC1 | Information provided on ipc code assigned before grant |
Ipc: G06F 19/00 20110101AFI20150202BHEP |
|
| 17Q | First examination report despatched |
Effective date: 20150915 |
|
| STAA | Information on the status of an ep patent application or granted ep patent |
Free format text: STATUS: THE APPLICATION HAS BEEN REFUSED |
|
| 18R | Application refused |
Effective date: 20161121 |