EP2808815A2 - Identifizierung von biologisch und klinisch essentiellen Genen und Genpaaren sowie Verfahren zur Anwendung der identifizierten Gene und Genpaare - Google Patents
Identifizierung von biologisch und klinisch essentiellen Genen und Genpaaren sowie Verfahren zur Anwendung der identifizierten Gene und Genpaare Download PDFInfo
- Publication number
- EP2808815A2 EP2808815A2 EP14174952.3A EP14174952A EP2808815A2 EP 2808815 A2 EP2808815 A2 EP 2808815A2 EP 14174952 A EP14174952 A EP 14174952A EP 2808815 A2 EP2808815 A2 EP 2808815A2
- Authority
- EP
- European Patent Office
- Prior art keywords
- genes
- gene
- survival
- expression
- subjects
- Prior art date
- Legal status (The legal status is an assumption and is not a legal conclusion. Google has not performed a legal analysis and makes no representation as to the accuracy of the status listed.)
- Withdrawn
Links
- 108090000623 proteins and genes Proteins 0.000 title claims abstract description 305
- 238000000034 method Methods 0.000 title abstract description 115
- 108700039887 Essential Genes Proteins 0.000 title description 2
- 230000014509 gene expression Effects 0.000 claims abstract description 127
- 102100021922 Low-density lipoprotein receptor-related protein 2 Human genes 0.000 claims description 26
- 102100032832 Integrin alpha-7 Human genes 0.000 claims description 22
- 108010024084 integrin alpha7 Proteins 0.000 claims description 22
- 102100033211 Centromere protein W Human genes 0.000 claims description 20
- 101000944447 Homo sapiens Centromere protein W Proteins 0.000 claims description 20
- 101001043562 Homo sapiens Low-density lipoprotein receptor-related protein 2 Proteins 0.000 claims description 20
- 102100024299 Maternal embryonic leucine zipper kinase Human genes 0.000 claims description 17
- 101710154611 Maternal embryonic leucine zipper kinase Proteins 0.000 claims description 17
- 101000744394 Homo sapiens Oxidized purine nucleoside triphosphate hydrolase Proteins 0.000 claims description 16
- 102100039792 Oxidized purine nucleoside triphosphate hydrolase Human genes 0.000 claims description 16
- 101000619112 Homo sapiens Proline-rich protein 11 Proteins 0.000 claims description 13
- 102100022566 Proline-rich protein 11 Human genes 0.000 claims description 13
- 102100032311 Aurora kinase A Human genes 0.000 claims description 11
- 101000798300 Homo sapiens Aurora kinase A Proteins 0.000 claims description 11
- 102100032951 Condensin complex subunit 2 Human genes 0.000 claims description 10
- 101000942617 Homo sapiens Condensin complex subunit 2 Proteins 0.000 claims description 10
- 108010015372 Low Density Lipoprotein Receptor-Related Protein-2 Proteins 0.000 claims description 8
- 238000002493 microarray Methods 0.000 claims description 8
- 230000004083 survival effect Effects 0.000 abstract description 120
- 238000012360 testing method Methods 0.000 abstract description 8
- 238000000638 solvent extraction Methods 0.000 abstract description 4
- 238000000926 separation method Methods 0.000 abstract description 3
- 230000000875 corresponding effect Effects 0.000 description 55
- 206010006187 Breast cancer Diseases 0.000 description 43
- 208000026310 Breast neoplasm Diseases 0.000 description 42
- 206010028980 Neoplasm Diseases 0.000 description 41
- 230000006870 function Effects 0.000 description 27
- 238000004458 analytical method Methods 0.000 description 25
- 238000004393 prognosis Methods 0.000 description 25
- 230000002195 synergetic effect Effects 0.000 description 18
- 102000004169 proteins and genes Human genes 0.000 description 17
- 206010027476 Metastases Diseases 0.000 description 16
- 201000011510 cancer Diseases 0.000 description 16
- 210000004027 cell Anatomy 0.000 description 16
- 230000009401 metastasis Effects 0.000 description 16
- 108010021512 neuromedin U Proteins 0.000 description 16
- 238000012549 training Methods 0.000 description 16
- 238000009826 distribution Methods 0.000 description 15
- 230000002068 genetic effect Effects 0.000 description 15
- 101150096316 5 gene Proteins 0.000 description 13
- 208000037265 diseases, disorders, signs and symptoms Diseases 0.000 description 13
- 102100024486 Borealin Human genes 0.000 description 12
- 238000013459 approach Methods 0.000 description 12
- 201000010099 disease Diseases 0.000 description 12
- 239000000523 sample Substances 0.000 description 12
- 101000988651 Homo sapiens Humanin-like 1 Proteins 0.000 description 11
- 101001050286 Homo sapiens Jupiter microtubule associated homolog 1 Proteins 0.000 description 11
- 102100023133 Jupiter microtubule associated homolog 1 Human genes 0.000 description 11
- 210000000349 chromosome Anatomy 0.000 description 11
- 230000002596 correlated effect Effects 0.000 description 11
- 102100035185 DNA excision repair protein ERCC-6-like Human genes 0.000 description 10
- 101000876524 Homo sapiens DNA excision repair protein ERCC-6-like Proteins 0.000 description 10
- 102100038813 Neuromedin-U Human genes 0.000 description 10
- 230000011278 mitosis Effects 0.000 description 10
- 230000037361 pathway Effects 0.000 description 10
- 230000022131 cell cycle Effects 0.000 description 9
- 108020004707 nucleic acids Proteins 0.000 description 9
- 102000039446 nucleic acids Human genes 0.000 description 9
- 150000007523 nucleic acids Chemical class 0.000 description 9
- 230000001105 regulatory effect Effects 0.000 description 9
- 101000762405 Homo sapiens Borealin Proteins 0.000 description 8
- 101000618133 Homo sapiens Sperm-associated antigen 5 Proteins 0.000 description 8
- 230000004547 gene signature Effects 0.000 description 8
- 230000000394 mitotic effect Effects 0.000 description 8
- 101000867817 Homo sapiens Voltage-dependent L-type calcium channel subunit alpha-1D Proteins 0.000 description 7
- 102100021915 Sperm-associated antigen 5 Human genes 0.000 description 7
- 230000000052 comparative effect Effects 0.000 description 7
- 102000014816 CACNA1D Human genes 0.000 description 6
- 101000694802 Homo sapiens Receptor-type tyrosine-protein phosphatase T Proteins 0.000 description 6
- 102100028645 Receptor-type tyrosine-protein phosphatase T Human genes 0.000 description 6
- 238000004422 calculation algorithm Methods 0.000 description 6
- 108091000080 Phosphotransferase Proteins 0.000 description 5
- 230000033228 biological regulation Effects 0.000 description 5
- 238000005192 partition Methods 0.000 description 5
- 102000020233 phosphotransferase Human genes 0.000 description 5
- 101710168078 Borealin Proteins 0.000 description 4
- 102100038446 Claudin-5 Human genes 0.000 description 4
- 101000882896 Homo sapiens Claudin-5 Proteins 0.000 description 4
- 108091022875 Microtubule Proteins 0.000 description 4
- 102000029749 Microtubule Human genes 0.000 description 4
- 238000001772 Wald test Methods 0.000 description 4
- 230000031018 biological processes and functions Effects 0.000 description 4
- 238000012937 correction Methods 0.000 description 4
- 230000000694 effects Effects 0.000 description 4
- 238000002474 experimental method Methods 0.000 description 4
- 230000016507 interphase Effects 0.000 description 4
- 210000004688 microtubule Anatomy 0.000 description 4
- 230000004557 prognostic gene signature Effects 0.000 description 4
- 101150101112 7 gene Proteins 0.000 description 3
- 102100025064 Cellular tumor antigen p53 Human genes 0.000 description 3
- 108020004414 DNA Proteins 0.000 description 3
- 102100021238 Dynamin-2 Human genes 0.000 description 3
- 102100037854 G1/S-specific cyclin-E2 Human genes 0.000 description 3
- 101000817607 Homo sapiens Dynamin-2 Proteins 0.000 description 3
- 101000738575 Homo sapiens G1/S-specific cyclin-E2 Proteins 0.000 description 3
- 206010058467 Lung neoplasm malignant Diseases 0.000 description 3
- 230000015572 biosynthetic process Effects 0.000 description 3
- 210000000481 breast Anatomy 0.000 description 3
- 230000024321 chromosome segregation Effects 0.000 description 3
- 108010057108 condensin complexes Proteins 0.000 description 3
- 230000018109 developmental process Effects 0.000 description 3
- 238000009396 hybridization Methods 0.000 description 3
- -1 nucleoside triphosphates Chemical class 0.000 description 3
- 239000002773 nucleotide Substances 0.000 description 3
- 102000009310 vitamin D receptors Human genes 0.000 description 3
- 108050000156 vitamin D receptors Proteins 0.000 description 3
- 102100028845 Biogenesis of lysosome-related organelles complex 1 subunit 2 Human genes 0.000 description 2
- 208000003174 Brain Neoplasms Diseases 0.000 description 2
- 208000005623 Carcinogenesis Diseases 0.000 description 2
- 108010077544 Chromatin Proteins 0.000 description 2
- 102100025191 Cyclin-A2 Human genes 0.000 description 2
- 108090000133 DNA helicases Proteins 0.000 description 2
- 102000003844 DNA helicases Human genes 0.000 description 2
- 230000004543 DNA replication Effects 0.000 description 2
- 101000935458 Homo sapiens Biogenesis of lysosome-related organelles complex 1 subunit 2 Proteins 0.000 description 2
- 101001012157 Homo sapiens Receptor tyrosine-protein kinase erbB-2 Proteins 0.000 description 2
- 108010029485 Protein Isoforms Proteins 0.000 description 2
- 102000001708 Protein Isoforms Human genes 0.000 description 2
- 102000001253 Protein Kinase Human genes 0.000 description 2
- 102100030086 Receptor tyrosine-protein kinase erbB-2 Human genes 0.000 description 2
- 230000001093 anti-cancer Effects 0.000 description 2
- 239000002246 antineoplastic agent Substances 0.000 description 2
- 229940041181 antineoplastic drug Drugs 0.000 description 2
- 239000000090 biomarker Substances 0.000 description 2
- 230000036952 cancer formation Effects 0.000 description 2
- 231100000504 carcinogenesis Toxicity 0.000 description 2
- 108700021031 cdc Genes Proteins 0.000 description 2
- 230000004663 cell proliferation Effects 0.000 description 2
- 210000003483 chromatin Anatomy 0.000 description 2
- 230000004186 co-expression Effects 0.000 description 2
- 238000004590 computer program Methods 0.000 description 2
- 238000009833 condensation Methods 0.000 description 2
- 230000005494 condensation Effects 0.000 description 2
- 230000001186 cumulative effect Effects 0.000 description 2
- 230000034994 death Effects 0.000 description 2
- 238000011161 development Methods 0.000 description 2
- 238000010586 diagram Methods 0.000 description 2
- 230000001747 exhibiting effect Effects 0.000 description 2
- 230000002962 histologic effect Effects 0.000 description 2
- 238000010348 incorporation Methods 0.000 description 2
- 210000002415 kinetochore Anatomy 0.000 description 2
- 208000026535 luminal A breast carcinoma Diseases 0.000 description 2
- 208000026534 luminal B breast carcinoma Diseases 0.000 description 2
- 201000005202 lung cancer Diseases 0.000 description 2
- 208000020816 lung neoplasm Diseases 0.000 description 2
- 238000005259 measurement Methods 0.000 description 2
- 230000004060 metabolic process Effects 0.000 description 2
- 230000004879 molecular function Effects 0.000 description 2
- 239000002777 nucleoside Substances 0.000 description 2
- 125000003729 nucleotide group Chemical group 0.000 description 2
- 238000005457 optimization Methods 0.000 description 2
- 230000008569 process Effects 0.000 description 2
- 239000000092 prognostic biomarker Substances 0.000 description 2
- 230000035755 proliferation Effects 0.000 description 2
- 108060006633 protein kinase Proteins 0.000 description 2
- 102000005962 receptors Human genes 0.000 description 2
- 108020003175 receptors Proteins 0.000 description 2
- 230000019491 signal transduction Effects 0.000 description 2
- 230000006641 stabilisation Effects 0.000 description 2
- 238000011105 stabilization Methods 0.000 description 2
- 230000009466 transformation Effects 0.000 description 2
- 239000001226 triphosphate Substances 0.000 description 2
- 235000011178 triphosphate Nutrition 0.000 description 2
- 238000010200 validation analysis Methods 0.000 description 2
- 108700026220 vif Genes Proteins 0.000 description 2
- UOACBPRDWRDEHJ-KVQBGUIXSA-N 2-hydroxy-dATP Chemical compound C1=NC=2C(N)=NC(=O)NC=2N1[C@H]1C[C@H](O)[C@@H](COP(O)(=O)OP(O)(=O)OP(O)(O)=O)O1 UOACBPRDWRDEHJ-KVQBGUIXSA-N 0.000 description 1
- BUZOGVVQWCXXDP-VPENINKCSA-N 8-oxo-dGTP Chemical compound O=C1NC=2C(=O)NC(N)=NC=2N1[C@H]1C[C@H](O)[C@@H](COP(O)(=O)OP(O)(=O)OP(O)(O)=O)O1 BUZOGVVQWCXXDP-VPENINKCSA-N 0.000 description 1
- 108700028369 Alleles Proteins 0.000 description 1
- 206010003571 Astrocytoma Diseases 0.000 description 1
- 102000004000 Aurora Kinase A Human genes 0.000 description 1
- 108090000461 Aurora Kinase A Proteins 0.000 description 1
- 102100021663 Baculoviral IAP repeat-containing protein 5 Human genes 0.000 description 1
- 206010006895 Cachexia Diseases 0.000 description 1
- 101000879203 Caenorhabditis elegans Small ubiquitin-related modifier Proteins 0.000 description 1
- 102000047934 Caspase-3/7 Human genes 0.000 description 1
- 108700037887 Caspase-3/7 Proteins 0.000 description 1
- 108020005197 Catenated DNA Proteins 0.000 description 1
- 102000012289 Corticotropin-Releasing Hormone Human genes 0.000 description 1
- 108010022152 Corticotropin-Releasing Hormone Proteins 0.000 description 1
- 239000000055 Corticotropin-Releasing Hormone Substances 0.000 description 1
- 108010068192 Cyclin A Proteins 0.000 description 1
- 108010060273 Cyclin A2 Proteins 0.000 description 1
- 102000003915 DNA Topoisomerases Human genes 0.000 description 1
- 108090000323 DNA Topoisomerases Proteins 0.000 description 1
- 238000012270 DNA recombination Methods 0.000 description 1
- 230000033616 DNA repair Effects 0.000 description 1
- 206010061818 Disease progression Diseases 0.000 description 1
- 102100038912 E3 SUMO-protein ligase RanBP2 Human genes 0.000 description 1
- 101710198453 E3 SUMO-protein ligase RanBP2 Proteins 0.000 description 1
- 102100030013 Endoribonuclease Human genes 0.000 description 1
- 101710199605 Endoribonuclease Proteins 0.000 description 1
- 102000004190 Enzymes Human genes 0.000 description 1
- 108090000790 Enzymes Proteins 0.000 description 1
- 101710185850 Exodeoxyribonuclease Proteins 0.000 description 1
- 230000010337 G2 phase Effects 0.000 description 1
- 101000624631 Homo sapiens M-phase inducer phosphatase 2 Proteins 0.000 description 1
- 101001000302 Homo sapiens Max-interacting protein 1 Proteins 0.000 description 1
- 101000957259 Homo sapiens Mitotic spindle assembly checkpoint protein MAD2A Proteins 0.000 description 1
- 101001024391 Homo sapiens Neuromedin-U receptor 1 Proteins 0.000 description 1
- 101000684503 Homo sapiens Sentrin-specific protease 3 Proteins 0.000 description 1
- 101710085971 Jupiter microtubule associated homolog 1 Proteins 0.000 description 1
- OUYCCCASQSFEME-QMMMGPOBSA-N L-tyrosine Chemical compound OC(=O)[C@@H](N)CC1=CC=C(O)C=C1 OUYCCCASQSFEME-QMMMGPOBSA-N 0.000 description 1
- 101150034901 LRP2 gene Proteins 0.000 description 1
- 102100023325 M-phase inducer phosphatase 2 Human genes 0.000 description 1
- 108060004795 Methyltransferase Proteins 0.000 description 1
- 102100038792 Mitotic spindle assembly checkpoint protein MAD2A Human genes 0.000 description 1
- 102100035314 Neuromedin-U receptor 1 Human genes 0.000 description 1
- 102000007999 Nuclear Proteins Human genes 0.000 description 1
- 108010089610 Nuclear Proteins Proteins 0.000 description 1
- 101710163270 Nuclease Proteins 0.000 description 1
- 208000008589 Obesity Diseases 0.000 description 1
- 206010033307 Overweight Diseases 0.000 description 1
- 208000018737 Parkinson disease Diseases 0.000 description 1
- 108010064218 Poly (ADP-Ribose) Polymerase-1 Proteins 0.000 description 1
- 102100023712 Poly [ADP-ribose] polymerase 1 Human genes 0.000 description 1
- 102000004245 Proteasome Endopeptidase Complex Human genes 0.000 description 1
- 108090000708 Proteasome Endopeptidase Complex Proteins 0.000 description 1
- 108091008109 Pseudogenes Proteins 0.000 description 1
- 241000219492 Quercus Species 0.000 description 1
- 235000016976 Quercus macrolepis Nutrition 0.000 description 1
- 108700005075 Regulator Genes Proteins 0.000 description 1
- 108010017324 STAT3 Transcription Factor Proteins 0.000 description 1
- 102000051619 SUMO-1 Human genes 0.000 description 1
- 102100023645 Sentrin-specific protease 3 Human genes 0.000 description 1
- MTCFGRXMJLQNBG-UHFFFAOYSA-N Serine Natural products OCC(N)C(O)=O MTCFGRXMJLQNBG-UHFFFAOYSA-N 0.000 description 1
- 101710113029 Serine/threonine-protein kinase Proteins 0.000 description 1
- 102100024040 Signal transducer and activator of transcription 3 Human genes 0.000 description 1
- 108010002687 Survivin Proteins 0.000 description 1
- 101150050863 T gene Proteins 0.000 description 1
- 108090000848 Ubiquitin Proteins 0.000 description 1
- 102000044159 Ubiquitin Human genes 0.000 description 1
- 208000007097 Urinary Bladder Neoplasms Diseases 0.000 description 1
- 102100032575 Voltage-dependent L-type calcium channel subunit alpha-1D Human genes 0.000 description 1
- 230000004913 activation Effects 0.000 description 1
- 239000012190 activator Substances 0.000 description 1
- 238000009098 adjuvant therapy Methods 0.000 description 1
- 150000001413 amino acids Chemical class 0.000 description 1
- 230000031016 anaphase Effects 0.000 description 1
- 230000006907 apoptotic process Effects 0.000 description 1
- 238000003491 array Methods 0.000 description 1
- 238000003556 assay Methods 0.000 description 1
- 230000003305 autocrine Effects 0.000 description 1
- 230000006399 behavior Effects 0.000 description 1
- 230000008901 benefit Effects 0.000 description 1
- 230000008236 biological pathway Effects 0.000 description 1
- 230000001925 catabolic effect Effects 0.000 description 1
- 108010046616 cdc25 Phosphatases Proteins 0.000 description 1
- 102000007588 cdc25 Phosphatases Human genes 0.000 description 1
- 230000033366 cell cycle process Effects 0.000 description 1
- 230000011712 cell development Effects 0.000 description 1
- 230000024245 cell differentiation Effects 0.000 description 1
- 230000010261 cell growth Effects 0.000 description 1
- 230000012292 cell migration Effects 0.000 description 1
- 210000002230 centromere Anatomy 0.000 description 1
- 210000003793 centrosome Anatomy 0.000 description 1
- 230000008859 change Effects 0.000 description 1
- 238000006243 chemical reaction Methods 0.000 description 1
- 230000002759 chromosomal effect Effects 0.000 description 1
- 230000021572 chromosome movement towards spindle pole Effects 0.000 description 1
- 239000002131 composite material Substances 0.000 description 1
- 230000001276 controlling effect Effects 0.000 description 1
- 229940041967 corticotropin-releasing hormone Drugs 0.000 description 1
- KLVRDXBAMSPYKH-RKYZNNDCSA-N corticotropin-releasing hormone (human) Chemical compound C([C@@H](C(=O)N[C@@H](CO)C(=O)N[C@@H](CC(N)=O)C(=O)N[C@@H](CCCNC(N)=N)C(=O)N[C@@H](CCCCN)C(=O)N[C@@H](CC(C)C)C(=O)N[C@@H](CCSC)C(=O)N[C@@H](CCC(O)=O)C(=O)N[C@H](C(=O)N[C@@H]([C@@H](C)CC)C(N)=O)[C@@H](C)CC)NC(=O)[C@H](C)NC(=O)[C@H](CCC(N)=O)NC(=O)[C@H](CCC(N)=O)NC(=O)[C@H](C)NC(=O)[C@H](CC(C)C)NC(=O)[C@H](CCC(N)=O)NC(=O)[C@H](CCC(O)=O)NC(=O)[C@H](C)NC(=O)[C@H](CCCNC(N)=N)NC(=O)[C@H](C)NC(=O)[C@H](CCSC)NC(=O)[C@H](CCC(O)=O)NC(=O)[C@H](CC(C)C)NC(=O)[C@@H](NC(=O)[C@H](CCC(O)=O)NC(=O)[C@H](CCCNC(N)=N)NC(=O)[C@H](CC(C)C)NC(=O)[C@H](CC(C)C)NC(=O)[C@H](CC=1N=CNC=1)NC(=O)[C@H](CC=1C=CC=CC=1)NC(=O)[C@@H](NC(=O)[C@H](CC(C)C)NC(=O)[C@H](CC(O)=O)NC(=O)[C@H](CC(C)C)NC(=O)[C@H](CO)NC(=O)[C@@H](NC(=O)[C@H]1N(CCC1)C(=O)[C@H]1N(CCC1)C(=O)[C@H](CCC(O)=O)NC(=O)[C@H](CCC(O)=O)NC(=O)[C@@H](N)CO)[C@@H](C)CC)C(C)C)C(C)C)C1=CNC=N1 KLVRDXBAMSPYKH-RKYZNNDCSA-N 0.000 description 1
- 230000021953 cytokinesis Effects 0.000 description 1
- 210000000805 cytoplasm Anatomy 0.000 description 1
- 230000007423 decrease Effects 0.000 description 1
- 238000001514 detection method Methods 0.000 description 1
- 235000014113 dietary fatty acids Nutrition 0.000 description 1
- 230000004069 differentiation Effects 0.000 description 1
- 230000005750 disease progression Effects 0.000 description 1
- 238000005315 distribution function Methods 0.000 description 1
- 238000007876 drug discovery Methods 0.000 description 1
- 230000008030 elimination Effects 0.000 description 1
- 238000003379 elimination reaction Methods 0.000 description 1
- 230000013020 embryo development Effects 0.000 description 1
- 230000002121 endocytic effect Effects 0.000 description 1
- 210000002919 epithelial cell Anatomy 0.000 description 1
- 229940011871 estrogen Drugs 0.000 description 1
- 239000000262 estrogen Substances 0.000 description 1
- 238000011156 evaluation Methods 0.000 description 1
- 229930195729 fatty acid Natural products 0.000 description 1
- 239000000194 fatty acid Substances 0.000 description 1
- 230000004129 fatty acid metabolism Effects 0.000 description 1
- 150000004665 fatty acids Chemical class 0.000 description 1
- 230000004634 feeding behavior Effects 0.000 description 1
- 229940014144 folate Drugs 0.000 description 1
- OVBPIULPVIDEAO-LBPRGKRZSA-N folic acid Chemical compound C=1N=C2NC(N)=NC(=O)C2=NC=1CNC1=CC=C(C(=O)N[C@@H](CCC(O)=O)C(O)=O)C=C1 OVBPIULPVIDEAO-LBPRGKRZSA-N 0.000 description 1
- 235000019152 folic acid Nutrition 0.000 description 1
- 239000011724 folic acid Substances 0.000 description 1
- 238000001415 gene therapy Methods 0.000 description 1
- 230000012010 growth Effects 0.000 description 1
- 201000010759 hypertrophy of breast Diseases 0.000 description 1
- 238000000338 in vitro Methods 0.000 description 1
- 230000005764 inhibitory process Effects 0.000 description 1
- 230000003993 interaction Effects 0.000 description 1
- 230000037356 lipid metabolism Effects 0.000 description 1
- 150000002632 lipids Chemical class 0.000 description 1
- 230000004807 localization Effects 0.000 description 1
- 238000011551 log transformation method Methods 0.000 description 1
- 210000004072 lung Anatomy 0.000 description 1
- 201000005296 lung carcinoma Diseases 0.000 description 1
- 230000036210 malignancy Effects 0.000 description 1
- 210000000415 mammalian chromosome Anatomy 0.000 description 1
- 230000004748 mammary carcinogenesis Effects 0.000 description 1
- 210000005075 mammary gland Anatomy 0.000 description 1
- 238000004519 manufacturing process Methods 0.000 description 1
- 239000011159 matrix material Substances 0.000 description 1
- 230000001404 mediated effect Effects 0.000 description 1
- 230000021121 meiosis Effects 0.000 description 1
- 239000012528 membrane Substances 0.000 description 1
- 230000003847 mesoderm development Effects 0.000 description 1
- 238000010208 microarray analysis Methods 0.000 description 1
- 102000021160 microtubule binding proteins Human genes 0.000 description 1
- 108091011150 microtubule binding proteins Proteins 0.000 description 1
- 210000003470 mitochondria Anatomy 0.000 description 1
- 230000002438 mitochondrial effect Effects 0.000 description 1
- 230000035773 mitosis phase Effects 0.000 description 1
- 230000017205 mitotic cell cycle checkpoint Effects 0.000 description 1
- 210000000479 mitotic spindle apparatus Anatomy 0.000 description 1
- 238000001823 molecular biology technique Methods 0.000 description 1
- 238000010369 molecular cloning Methods 0.000 description 1
- 238000012544 monitoring process Methods 0.000 description 1
- 239000000178 monomer Substances 0.000 description 1
- 150000004712 monophosphates Chemical class 0.000 description 1
- 230000004899 motility Effects 0.000 description 1
- 230000035772 mutation Effects 0.000 description 1
- 208000025113 myeloid leukemia Diseases 0.000 description 1
- 230000004770 neurodegeneration Effects 0.000 description 1
- 238000010606 normalization Methods 0.000 description 1
- 239000000101 novel biomarker Substances 0.000 description 1
- 150000003833 nucleoside derivatives Chemical class 0.000 description 1
- 235000020824 obesity Nutrition 0.000 description 1
- 230000002018 overexpression Effects 0.000 description 1
- 201000008129 pancreatic ductal adenocarcinoma Diseases 0.000 description 1
- 230000003076 paracrine Effects 0.000 description 1
- 230000026731 phosphorylation Effects 0.000 description 1
- 238000006366 phosphorylation reaction Methods 0.000 description 1
- 102000054765 polymorphisms of proteins Human genes 0.000 description 1
- 238000010837 poor prognosis Methods 0.000 description 1
- 239000013641 positive control Substances 0.000 description 1
- 238000007781 pre-processing Methods 0.000 description 1
- 230000000861 pro-apoptotic effect Effects 0.000 description 1
- 108091008077 processed pseudogenes Proteins 0.000 description 1
- 230000002062 proliferating effect Effects 0.000 description 1
- 230000026447 protein localization Effects 0.000 description 1
- 230000009145 protein modification Effects 0.000 description 1
- 230000009822 protein phosphorylation Effects 0.000 description 1
- 230000018883 protein targeting Effects 0.000 description 1
- 239000002212 purine nucleoside Substances 0.000 description 1
- 238000003753 real-time PCR Methods 0.000 description 1
- 230000022983 regulation of cell cycle Effects 0.000 description 1
- 230000026267 regulation of growth Effects 0.000 description 1
- 230000008439 repair process Effects 0.000 description 1
- 230000010076 replication Effects 0.000 description 1
- 238000002271 resection Methods 0.000 description 1
- 230000004044 response Effects 0.000 description 1
- 238000003757 reverse transcription PCR Methods 0.000 description 1
- 238000011012 sanitization Methods 0.000 description 1
- 238000005204 segregation Methods 0.000 description 1
- 238000010187 selection method Methods 0.000 description 1
- 230000035945 sensitivity Effects 0.000 description 1
- 230000024355 spindle assembly checkpoint Effects 0.000 description 1
- 230000007046 spindle assembly involved in mitosis Effects 0.000 description 1
- 230000012391 spindle elongation Effects 0.000 description 1
- 238000013179 statistical model Methods 0.000 description 1
- 210000000130 stem cell Anatomy 0.000 description 1
- 230000037359 steroid metabolism Effects 0.000 description 1
- 238000003860 storage Methods 0.000 description 1
- 239000000758 substrate Substances 0.000 description 1
- 208000011580 syndromic disease Diseases 0.000 description 1
- 210000001519 tissue Anatomy 0.000 description 1
- 238000013518 transcription Methods 0.000 description 1
- 230000035897 transcription Effects 0.000 description 1
- 230000007704 transition Effects 0.000 description 1
- 230000005748 tumor development Effects 0.000 description 1
- 230000005740 tumor formation Effects 0.000 description 1
- 230000005751 tumor progression Effects 0.000 description 1
- OUYCCCASQSFEME-UHFFFAOYSA-N tyrosine Natural products OC(=O)C(N)CC1=CC=C(O)C=C1 OUYCCCASQSFEME-UHFFFAOYSA-N 0.000 description 1
- 230000006663 ubiquitin-proteasome pathway Effects 0.000 description 1
- 238000011179 visual inspection Methods 0.000 description 1
Images





Classifications
-
- C—CHEMISTRY; METALLURGY
- C12—BIOCHEMISTRY; BEER; SPIRITS; WINE; VINEGAR; MICROBIOLOGY; ENZYMOLOGY; MUTATION OR GENETIC ENGINEERING
- C12Q—MEASURING OR TESTING PROCESSES INVOLVING ENZYMES, NUCLEIC ACIDS OR MICROORGANISMS; COMPOSITIONS OR TEST PAPERS THEREFOR; PROCESSES OF PREPARING SUCH COMPOSITIONS; CONDITION-RESPONSIVE CONTROL IN MICROBIOLOGICAL OR ENZYMOLOGICAL PROCESSES
- C12Q1/00—Measuring or testing processes involving enzymes, nucleic acids or microorganisms; Compositions therefor; Processes of preparing such compositions
- C12Q1/68—Measuring or testing processes involving enzymes, nucleic acids or microorganisms; Compositions therefor; Processes of preparing such compositions involving nucleic acids
- C12Q1/6813—Hybridisation assays
- C12Q1/6834—Enzymatic or biochemical coupling of nucleic acids to a solid phase
- C12Q1/6837—Enzymatic or biochemical coupling of nucleic acids to a solid phase using probe arrays or probe chips
-
- C—CHEMISTRY; METALLURGY
- C12—BIOCHEMISTRY; BEER; SPIRITS; WINE; VINEGAR; MICROBIOLOGY; ENZYMOLOGY; MUTATION OR GENETIC ENGINEERING
- C12Q—MEASURING OR TESTING PROCESSES INVOLVING ENZYMES, NUCLEIC ACIDS OR MICROORGANISMS; COMPOSITIONS OR TEST PAPERS THEREFOR; PROCESSES OF PREPARING SUCH COMPOSITIONS; CONDITION-RESPONSIVE CONTROL IN MICROBIOLOGICAL OR ENZYMOLOGICAL PROCESSES
- C12Q1/00—Measuring or testing processes involving enzymes, nucleic acids or microorganisms; Compositions therefor; Processes of preparing such compositions
- C12Q1/68—Measuring or testing processes involving enzymes, nucleic acids or microorganisms; Compositions therefor; Processes of preparing such compositions involving nucleic acids
- C12Q1/6876—Nucleic acid products used in the analysis of nucleic acids, e.g. primers or probes
- C12Q1/6883—Nucleic acid products used in the analysis of nucleic acids, e.g. primers or probes for diseases caused by alterations of genetic material
- C12Q1/6886—Nucleic acid products used in the analysis of nucleic acids, e.g. primers or probes for diseases caused by alterations of genetic material for cancer
-
- G—PHYSICS
- G16—INFORMATION AND COMMUNICATION TECHNOLOGY [ICT] SPECIALLY ADAPTED FOR SPECIFIC APPLICATION FIELDS
- G16B—BIOINFORMATICS, i.e. INFORMATION AND COMMUNICATION TECHNOLOGY [ICT] SPECIALLY ADAPTED FOR GENETIC OR PROTEIN-RELATED DATA PROCESSING IN COMPUTATIONAL MOLECULAR BIOLOGY
- G16B20/00—ICT specially adapted for functional genomics or proteomics, e.g. genotype-phenotype associations
- G16B20/20—Allele or variant detection, e.g. single nucleotide polymorphism [SNP] detection
-
- G—PHYSICS
- G16—INFORMATION AND COMMUNICATION TECHNOLOGY [ICT] SPECIALLY ADAPTED FOR SPECIFIC APPLICATION FIELDS
- G16B—BIOINFORMATICS, i.e. INFORMATION AND COMMUNICATION TECHNOLOGY [ICT] SPECIALLY ADAPTED FOR GENETIC OR PROTEIN-RELATED DATA PROCESSING IN COMPUTATIONAL MOLECULAR BIOLOGY
- G16B25/00—ICT specially adapted for hybridisation; ICT specially adapted for gene or protein expression
- G16B25/10—Gene or protein expression profiling; Expression-ratio estimation or normalisation
-
- G—PHYSICS
- G16—INFORMATION AND COMMUNICATION TECHNOLOGY [ICT] SPECIALLY ADAPTED FOR SPECIFIC APPLICATION FIELDS
- G16B—BIOINFORMATICS, i.e. INFORMATION AND COMMUNICATION TECHNOLOGY [ICT] SPECIALLY ADAPTED FOR GENETIC OR PROTEIN-RELATED DATA PROCESSING IN COMPUTATIONAL MOLECULAR BIOLOGY
- G16B40/00—ICT specially adapted for biostatistics; ICT specially adapted for bioinformatics-related machine learning or data mining, e.g. knowledge discovery or pattern finding
-
- G—PHYSICS
- G16—INFORMATION AND COMMUNICATION TECHNOLOGY [ICT] SPECIALLY ADAPTED FOR SPECIFIC APPLICATION FIELDS
- G16B—BIOINFORMATICS, i.e. INFORMATION AND COMMUNICATION TECHNOLOGY [ICT] SPECIALLY ADAPTED FOR GENETIC OR PROTEIN-RELATED DATA PROCESSING IN COMPUTATIONAL MOLECULAR BIOLOGY
- G16B40/00—ICT specially adapted for biostatistics; ICT specially adapted for bioinformatics-related machine learning or data mining, e.g. knowledge discovery or pattern finding
- G16B40/30—Unsupervised data analysis
-
- C—CHEMISTRY; METALLURGY
- C12—BIOCHEMISTRY; BEER; SPIRITS; WINE; VINEGAR; MICROBIOLOGY; ENZYMOLOGY; MUTATION OR GENETIC ENGINEERING
- C12Q—MEASURING OR TESTING PROCESSES INVOLVING ENZYMES, NUCLEIC ACIDS OR MICROORGANISMS; COMPOSITIONS OR TEST PAPERS THEREFOR; PROCESSES OF PREPARING SUCH COMPOSITIONS; CONDITION-RESPONSIVE CONTROL IN MICROBIOLOGICAL OR ENZYMOLOGICAL PROCESSES
- C12Q2600/00—Oligonucleotides characterized by their use
- C12Q2600/118—Prognosis of disease development
-
- G—PHYSICS
- G16—INFORMATION AND COMMUNICATION TECHNOLOGY [ICT] SPECIALLY ADAPTED FOR SPECIFIC APPLICATION FIELDS
- G16B—BIOINFORMATICS, i.e. INFORMATION AND COMMUNICATION TECHNOLOGY [ICT] SPECIALLY ADAPTED FOR GENETIC OR PROTEIN-RELATED DATA PROCESSING IN COMPUTATIONAL MOLECULAR BIOLOGY
- G16B20/00—ICT specially adapted for functional genomics or proteomics, e.g. genotype-phenotype associations
-
- G—PHYSICS
- G16—INFORMATION AND COMMUNICATION TECHNOLOGY [ICT] SPECIALLY ADAPTED FOR SPECIFIC APPLICATION FIELDS
- G16B—BIOINFORMATICS, i.e. INFORMATION AND COMMUNICATION TECHNOLOGY [ICT] SPECIALLY ADAPTED FOR GENETIC OR PROTEIN-RELATED DATA PROCESSING IN COMPUTATIONAL MOLECULAR BIOLOGY
- G16B25/00—ICT specially adapted for hybridisation; ICT specially adapted for gene or protein expression
Definitions
- the present invention relates to identification of clinically distinct sub-groups of patients and corresponding genes and/or pairs of genes for which the respective gene expression values in a subject and clinical status are statistically significant in relation to a medical condition, for example cancer progression, or more particularly breast cancer patient's survival.
- the gene expression values may for example be indicative of the susceptibility of the individual subject to the medical condition (in context of time survival or/and disease progression), or the prognosis of a subject who exhibits the medical condition.
- the invention further relates to methods employing the identified patient survival significant genes and gene pairs.
- Global gene expression profiles of subjects are often used to obtain information about those subjects, such as their susceptibility to certain medical condition, or, in the case of subjects exhibiting medical conditions, their prognosis. For example, having determined that a particular gene is important, the level in which that gene is expressed in a subject can be used to classify the individual into one of a plurality of classes, each class being associated with a different susceptibility or prognosis.
- the class comparison analysis leads to a better understanding of the disease process by identifying gene expression in primary tumours associated with subject survival outcomes (Kuznetsov et al., 2006).
- T the patient's survival time.
- T is a continuous non-negative random variable which can take values t, t ⁇ [0, ⁇ ) .
- F t ⁇ 0 t f t ⁇ ⁇ dt ⁇ .
- F t ⁇ 0 t f t ⁇ ⁇ dt ⁇ .
- the hazard function assesses the instantaneous risk of death at time t, conditional on survival up to that time.
- survival distributions and hazard functions can be generated for any distribution defined for t ⁇ [0, ⁇ ).
- W distributed in ( ⁇ ,- ⁇ )
- we can generate a family of survival distributions by introducing location ( ⁇ ) and scale ( ⁇ ) changes of the form log T ⁇ + ⁇ W .
- the popularity of this model lies in the fact that it leaves the baseline hazard function ⁇ ( t ) (which we may alternatively designate as log h 0 ( t )) unspecified (no distribution assumed). It can be estimated iteratively by the method of partial likelihood of Cox (1972).
- the Cox proportional hazards model is semi-parametric because while the baseline hazard can take any form, the covariates enter the model linearly.
- Cox (1972) showed that the ⁇ coefficient can be estimated efficiently by the Cox partial likelihood function.
- a certain nominal (i.e. yes/no) clinical event has occurred (e.g. whether there has been metastasis).
- This knowledge is denoted e k .
- e k may be 0 if the event has not occurred by time t k (e.g. no tumour metastasis at time t k ) and 1 if the event has occurred (e.g. tumour metastasis at time t k ).
- the likelihood (2) is minimized by Newton-Raphson optimization method for finding successively better approximations to the zeroes (or roots) of a real-valued function (Press et al., 1992), with a very simple elimination algorithm to invert and solve the simultaneous equations.
- a disease free survival time t k (in this work DFS time), a nominal clinical event e k taking values 0 in the absence of an event until DFS time t k or 1 in the presence of the event at DFS time t k (DFS event) and a discrete gradual characteristic (histologic grade).
- DFS event disease free survival time
- e k nominal clinical event taking values 0 in the absence of an event until DFS time t k or 1 in the presence of the event at DFS time t k
- a discrete gradual characteristic a discrete gradual characteristic
- Additional information includes patients' age (continuous variable ranging from 28 to 93 years old), tumor size (in milimeters), breast cancer subtype (Basal, ERBB2, Luminal A, Luminal B, No subtype, normal-like), patients' ER status (ER+ and ER-) and distant metastasis (a binary variable indicating the presence or absence of distant metastasis).
- cut-off value c i that separates the low-risk from the high-risk patients.
- the simplest cut-off basis is the mean of the individual gene expression values within samples (Kuznetsov, 2006), although other choices (e.g. median, trimmed mean, etc) could be also applied.
- Two problems, associated with such cut-offs are: 1) they are suboptimal cut-off values that often provide low classification accuracy or even miss existing groups; 2) the search for prognostic significance is carried out for each gene independently, thus ignoring the significance and the impact of genes' co-expression on the patient' survival.
- the present invention proposes in general terms that a cut-off expression value should be selected so as to maximise the separation of the respective survival curves of the two groups of patients. From another point of view, this means that the cut-off expression value is selected such that the partition of subjects which it implies is of maximal statistical significance. This overcomes a possible problem in the known method described above: that if the cut-off expression values are not well-chosen they may provide low classification accuracy even for genes which are very statistically significant for certain ranges of expression value.
- a specific expression of the first aspect of the invention is a computerized method for optimising, for each gene i of a set of N genes, a corresponding cut-off expression value c i . for partitioning subjects according to the expression level of the corresponding gene, the method employing medical data which, for each subject k of a set of K* subjects suffering from the medical condition, indicates (i) the survival time of subject k, and (ii) for each gene i, a corresponding gene expression value y i,k of subject k; the method comprising, for each gene i,
- the cut-off expression value y i,k here may be a logarithm of the measured expression intensity of gene i in patient k (as in the background section above, and in following description of specific embodiments). However, the expression value y i,k may alternatively be any other transformation of the measured expression insensity, or indeed the raw intensity itself.
- the invention proposes in general terms that pairs of genes are selected. For each gene pair, we generate a plurality of models, each of which represents a way of partitioning a set of subjects based on the expression values of the pair of genes. We then identify those gene pairs for which one of the models has a high prognostic significance. This overcomes a problem of the known method described above that the search for prognostic significance is carried out for each gene independently, thus neglecting any significance of genes' co-expression on patient survival.
- a specific expression of the second aspect of the invention is a computerized method for identifying one or more pairs of genes, selected from a set of N genes, which are statistically associated with prognosis of a potentially-fatal medical condition, the method employing medical data which, for each subject k of a set of K* subjects suffering from the medical condition, indicates (i) the survival time of subject k, and (ii) for each gene i, a corresponding gene expression value y i,k of subject k ; the method comprising:
- the first and second aspects of the invention may be used in combination. That is, cut-off expression values for individual genes derived according to the first aspect of the invention may be employed in a method according to the second aspect of the invention.
- expression values may be the direct outputs of expression value measurements, but more preferably are the logarithms (e.g. natural logarithms) of such measurements, and optionally may have been subject to a normalisation operation.
- the medical data preferably includes nominal data which indicates for each patient, whether one or more clinical events have occurred.
- the nominal data may indicate whether tumour metastasis had occurred by the survival time.
- the significance value may be calculated using a formula which incorporates the nominal data. Alternatively or additionally, it can be used to select a subset of the patients, such that the clinical data for that subset of patients is used in the method.
- the survival time may be an actual survival time (i.e. a time taken to die) or a time spent in a certain state associated with the medical condition, e.g. a time until metastasis of a cancer occurs.
- the K* subjects may be a subset of a larger dataset of K (K > K* ) subjects.
- the data for K* subjects can be used as training data, and the rest used for validation.
- a plurality of subsets of the K subjects can be defined, and the method defined above is carried out independently for each of the subsets.
- Each of these subsets of the K subjects is a respective "cohort" of the subjects; if the cohorts do not overlap, they are independent training datasets.
- K* denotes the number of subjects in that cohort, which may be different from the number of subjects in other of the cohorts. After this, there is a step of discovering which pairs of genes were found to be significant for all the cohorts.
- genes, or pairs of significant genes are identified by a method according to either of the above aspects of the invention, they can be used to obtain useful information in relation to a certain subject (typically not one of the cohort(s) of subjects) using a statistical model which takes as an input the ratio(s) of the expression values of the corresponding identified pair(s) of genes.
- the information may for example be susceptibility to the medical condition, the or prognosis (e.g. relating to recurrence or death) of a subject suffering from the condition.
- the invention proposes a kit, such as a microarray, for detecting the expression level of a set of genes, the set having no more than 1000 members, or no more than 100 members, or no more than 20 members, and including
- the invention may be expressed, as above, in terms of a method implemented using a computer, or alternatively as a computer system programmed to implement the method, or alternatively as a computer program product (e.g. embodied in a tangible storage medium) including program instructions which are operable by the computer to perform the method.
- the computer system may in principle be any general computer, such as a personal computer, although in practice it is more likely typically to be a workstation or a mainframe supercomputer.
- Array or "microarray,” as used herein, comprises a surface with an array, preferably an ordered array, of putative binding (e.g., by hybridization) sites for a sample which often has undetermined characteristics.
- An array can provide a medium for matching known and unknown nucleic acid molecules based on base-pairing rules and automating the process of identifying the unknowns.
- An array experiment can make use of common assay systems such as microplates or standard blotting membranes, and can be worked manually, or make use of robotics to deposit the sample.
- the array can be a macro-array (containing nucleic acid spots of about 250 microns or larger) or a micro-array (typically containing nucleic acid spots of less than about 250 microns).
- cut-off expression value represented by c (followed with the proper superscript; e.g. c i ) refers to a value of the expression level of a particular nucleic acid molecule (or gene) in a subject.
- the cut-off expression value is used to partition the subjects into classes, according to whether the expression level of the corresponding gene is below or above the cut-off expression value. Note that it makes no difference whether all subjects for which the expression value is actually equal to the cut-off value are classified as being in one class or alternatively in the other.
- gene refers to a nucleic acid molecule that encodes, and/or expresses in a detectable manner, a discrete product, whether RNA or protein. It is appreciated that more than one nucleic acid molecule may be capable of encoding a discrete product.
- the term includes alleles and polymorphisms of a gene that encodes the same product or an analog thereof.
- the gene expression level may be determined at the transcript level, or at the protein level, or both.
- the nucleic acid molecule or probe may be immobilized on a support, for example, on an array or a microarray.
- the detection may be manual or automated. Standard molecular biology techniques known in the art and not specifically described may be employed as described in Sambrook and Russel, Molecular Cloning: A Laboratory Manual, Cold Springs Harbor Laboratory, New York (2001).
- Gene expression may be determined from sample(s) isolated from the subject(s).
- the clinical characteristics of the subjects and the tumour samples of Uppsala and Sweden cohorts have been summarised in Ivshina et al., 2006.
- DFS disease free survival time
- FIG. 1 shows the distribution of DFS survival time (below, we refer to the DFS survival time for the k-th subject as t k ) for the Sweden cohort ( Fig. 1A ) and the Uppasla cohort ( Fig. 1 B) .
- tumor metastasis typically occurs at a short time (in years) after the beginning of the experiment, whereas the frequency of the occurrence decreases as time increases.
- Figure 1 shows that our data consists of two different distribution of survival times (one for patients without tumor metastasis and one with patients with metastasis). The data that do not agree with this observation are considered as outliers or data from non-typical patients.
- the present embodiments used only the "typical" data as training data. In other words, there was a pre-processing of the data to identify only typical patients: data from subjects who satisfy the above Event and t k relationship. Then we apply our methods on the typical (or training) data only (data from responders that satisfy the above Event and t k relationship), estimate a cutoff value for each gene by (1) and use these estimates to the whole set of patients to infer about prognostic significance by (2).
- the number of patients in the training set is denoted K* which is less than K , the total number of patients about whom data existed.
- the DFS survival time for the k -th subject is referred to as t k
- e k whether or not tumour metastatis has occurred.
- Each of the embodiments, and the comparative example involve fitting a set of survival times to an equation such as Eqn. (4). The fitting to Eqn.
- Equation (3) was used to generate a set of values x k i , and from this a set of corresponding values ⁇ i was generated by fitting Equation (4).
- the prognostic significance of gene i was evaluated by reporting the p-value of the estimated ⁇ i .
- the genes with significantly small p-values (p ⁇ 0.05 or p ⁇ 0.01) were selected.
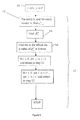
- the first embodiment is explained with reference to Fig. 2 .
- the distribution of the K* signal intensity values y i , k was computed, and 10 th quantile q 10 i and the 90 th quantile q 90 i were derived (step 1).
- step 2 of Fig. 2 the following sub-steps were performed:
- step 3 the "optimal" cut-off expression value for each i is the taken as the one with the minimum ⁇ i z p-value, provided that the sample size of each group is sufficiently large (formally above 30) and model defined by Eqn. (4) is plausible. Note that here ⁇ i is substituted by ⁇ i z indicating that the search was for the ⁇ i that leads to the best cut-off expression value.
- BCa Bias-Corrected accelerated
- the gene expression profiles were correlated with clinical outcome (disease free survival time; DFS) in the two cohorts with the intention of identifying specific genes that predict survival. It was found that a large fraction of the genes had some correlation with survival, and could be used to predict survival.
- Figure 3 shows the results of the comparative example and first embodiment for the LRP2 and ITGA7 prognostic genes in (a) Swedish cohort and (b) Uppsala cohort.
- the dashed line indicates the log (p-value) corresponding to the Data driven grouping (DDg) cut-off expression value obtained by the method of Fig. 2 .
- This cut-off expression value is marked by a cross on the dashed line.
- the dotted line in each of the graphs indicates the log (p-value) corresponding to a MBg cut-off found by method of section 4.1, and this is cut-off is marked by a cross on the dotted line.
- Figure 3 suggests that the data-driven grouping improves prediction of subjects' survival compared to the mean based approach.
- BCa CI's Bias-Corrected accelerated confidence intervals
- 118 and 145 probesets were predicted by MBg and DDg methods, respectively, as survival significant probesets.
- the 99% BCa CI's found 118 significant probesets with 38 Wald-only positives and 2 Wald-only negatives.
- FIG. 4 A second embodiment of the invention is explained with reference to Figures 4 and 5 .
- the approach resembles the idea of Statistically Weighted Syndromes algorithm (Kuznetsov et al., 2006).
- a given gene pair i, j, i ⁇ j , and respective individual cut-off expression values c i and c j we define seven "models", each of which is a possible way in which the expression levels of the two genes might be significant. Then we test the data to see if any of the seven models are in fact statistically significant.
- the models are defined using the concept of Figure 4 , which shows how a 2-D area having y i,k , y j,k as axes.
- the 2-D area is divided into four regions A, B, C and D, defined as follows: A : y i , k ⁇ c i and y j , k ⁇ c j B : y i , k ⁇ c i and y j , k ⁇ c j C : y i , k ⁇ c i and y j , k ⁇ c j D : y i , k ⁇ c i and y j , k ⁇ c j
- Each of the seven models is then defined as a respective selection from among the four regions:
- model 6 is equivalent to asking only whether the subject's expression level of gene 1 is below of above c 1 (i.e. it assumes that the expression value of gene 2 is not important).
- Model 7 is equivalent to asking only whether the subject's expression for gene 2 is above or below c 2 (it assumes that the expression value of gene 1 is not important).
- models 1-5 are referred to as “synergetic” (1 - 5), and the models 6 and 7 as "independent”.
- the algorithm of the second embodiment evaluates the significance of all possible gene pairs i , j as follows (see Figure 5 ):
- Fig. 6A and 6C respectively show clinical data for the LRP2-ITAG7 combination, the crosses representing subjects with DFS time ⁇ 3 (indicator of "high-risk") and the circles representing subjects with DFS time > 3 (indicator of "low-risk”).
- the horizontal and vertical lines within the graph indicate the respective cut-off expression values for LRP2 and ITAG7 selected by MBg ( Fig. 6A ) and DDg ( Fig. 6B ).
- MMg gives a cut-off expression value of about 6.61 with a p-value of 9.8x10 -4
- DDg the method of Fig. 1
- the ITGA7 cut-off expression value was 7.7 with a p-value of 1.9x10 -3 (7.6 in MBg).
- the CCNA2 DDg cut-off expression value was 5.95 with a p-value of 1.8x10 -5 (6.04 in MBg) and the PTPRT cut-off expression value was 7.25 with a p-value of 1.4x10 -5 (7.52 in MBg).
- the method of Fig. 5 when practiced for the gene pair LRP2-ITAG7 using the cut-off expression values for LRP2 and ITGA7 obtained by MBg, selected model 4, and then produced a p-value for the synergy of 1.6x10 -4 .
- the method of Fig. 4 was practiced with the optimized cut-off expression values for LRP2 and ITGA7 from the method of Fig. 1 (e.g. for gene LRP2, the cut-off expression value of 6.38), the method still selected model 4, but the consequent p-value was 2.5x10 -6 .
- the subjects in A region are identified as "low-risk” subjects, whereas the B, C and D subjects ("high-risk” subjects) while for the CCNA2-PTPRT case the A, C and D (“high-risk”) subjects were separated from the B subjects ("low-risk”).
- the subjects at A region were separated from the B, C and D subjects ("high-risk” subjects) while for the CCNA2-PTPRT case the A, C and D (“high-risk") subjects were separated from the B subjects ("low-risk”).
- Fig. 6B and 6D are corresponding Kaplan-Meier curves (Kaplan and Meier, 1958). The solid lines correspond to "low-risk” subjects and the dotted lines to "high-risk” subjects.
- Fig. 6B shows the two Kaplan-Meier curves for each of (i) for LRP2 using the cut-offs from MBg, (ii) for ITGA7 using the cut-offs from MBg, and (iii) for model 4 using Eqn. (7) and the two cut-off values from MBg..
- 6D shows the two Kaplan-Meier curves for each of (i) for LRP2 using the cut-offs from DDg, (ii) for ITGA7 using the cut-offs from DDg, and (iii) for model 4 using Eqn. (7) and the two cut-off values from DDg.
- the DDg method separates the "low-risk” from the "high-risk” subjects more accurately as shown by the respective Kaplan-Meier curves.
- the the Wald p-values were derived by Eqns. (4) and (5).
- DDg found 195 probesets (191 prognostic gene signatures) and MBg found 131 probesets (127 prognostic gene signatures).
- Figure 7 presents the individual and synergetic prognostic results for the LRP2-ITGA7 and CCNA2-PTPRT genes pairs.
- the significance of Figs. 7A to 7E corresponds to that of Figs. 6D, 6B , 6E, 6F and 6G respectively.
- Gene pairing with DDg was clearly the best choice in our analysis, since the two "synergy" curves of Fig. 7A and 7C are by far the best separated. High reproducibility on the findings of the two cohorts, not only for these particular pairs but also for the whole set of important gene pairs identified in Sweden and Uppsala was observed.
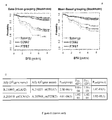
- Figure 8 shows the capability of the 5-genes signature of Ivshina et al., 2006 for predicting subjects' survival outcome for the Uppsala cohort. This figure shows that the survival curves for subjects of joined grade 1 and grade 1-like group are significantly different from the survival curve of subjects of joined grade 3 and grade 3-like group. Using this 5-gene signature we applied the SWS classification method Kuznetsov et al., 2006 and found that the two groups could be discriminated with ⁇ 7% errors, which suggests that the grouped tumours are different biological entities.
- tumours in grade 1&1-like group exhibit mostly “normal-like” and “luminal-A” sub-types, while tumours in 3&3-like group exhibit “luminal-B", “ERBB2+” and “basal” subtypes.
- SWS signature and clinical sub-typing provide similar classification.
- the survival curve of group of grades 1 & 1-like subjects contains a fraction of subjects with DFS of less than 5 years. This observation suggests the existence of a distinct subgroup of subjects with relatively poor clinical outcome.
- standard unsupervised techniques e.g., hierarchical clustering
- the large difference in the number of significant genes identified by the two methods shows that the DDg method can find interesting genes not located by the MBg method (or any other grouping method based on a single point estimate of y i expression levels). This feature indicates that the DDg method may be particularly appealing for prognostic gene identification.
- the grouping scheme analysis was repeated for the full data set of 44928 probesets.
- the DDg method identified 7473 prognostic significant genes by the Wald test. With Bonferroni correction, the number was 90 prognostic significant genes.
- the respective numbers were 5545 by the Wald test and 55 after Bonferroni correction.
- 3152 common prognostic genes were identified by the Wald-based DDg test while the MBg method identified 559 ( ⁇ 18% of DDg). This further supports that the DDg method is able to identify many statistically significant and biologically meaningful prognostic and predictive genes.
- Table 2 presents the top 7 gene pairs in terms of the Criteria 1 and 2. These pairs exhibit high synergetic effect in both cohorts and their synergy produces significantly stronger effect than individual grouping (as indicated by the respective p-values in Table 2). Table 2. Top 7 gene pairs in Sweden and Uppsala cohorts. P-values of common synergetic genes (and model) of Swiss (S) and Uppsala (U) cohorts (columns 3-4); P-values of independent grouping (columns 5-8). ** Breast cancer associated genes; * cancer associated genes.
- the semi-parametric Cox proportional hazard regression model was used to estimate predictive significance of genes for disease outcome as indicated by patient survival times.
- the optimal partition (cut-off expression value) of its expression domain was estimated by maximising the separation of survival curves related to the high- and low-risk of disease behaviour, as indicated by the Wald statistic derived from the corresponding univariate Cox partial likelihood function.
- the top-level genes having the largest Wald statistic were selected for further confirmatory GO- analysis and inclusion into gene signatures.
- a similar selection procedure was also developed in order to construct two-genes signatures exhibiting synergetic influence on patient survival.
- This approach was applied to analyse Affymetrix U133 data sets of two large breast cancer cohorts to identify genes and genes pairs related to genetic breast cancer grade signature (Ivshina et al., 2006). The genes that were most significantly correlated with the disease free survival time of breast cancer patients were selected. These genes could be subsequently used as an input in reconstruction analysis of biological programs/pathways associated with aggressiveness of breast cancer (Ivshina et al., 2006).
- _BRRN1 encodes a member of the barr gene family and a regulatory subunit of the condensin complex. This complex is required for the conversion of interphase chromatin into condensed chromosomes.
- the protein encoded by this gene is associated with mitotic chromosomes, except during the early phase of chromosome condensation. During interphase, the protein has a distinct punctate nucleolar localization.
- the protein encoded by STK6 is a cell cycle-regulated kinase that appears to be involved in microtubule formation and/or stabilization at the spindle pole during chromosome segregation.
- the encoded protein is found at the centrosome in interphase cells and at the spindle poles in mitosis. This gene may play a role in tumor development and progression.
- a processed pseudogene of this gene has been found on chromosome 1, and an unprocessed pseudogene has been found on chromosome 10. Multiple transcript variants encoding the same protein have been found for this gene.
- MELK is known to have a critical role in the proliferation of brain tumors, including their stem cells, and suggest that MELK may be a compelling molecular target for treatment of high-grade brain tumors.
- Maternal embryonic leucine zipper kinase transcript abundance correlates with malignancy grade in astrocytomas 3.
- the kinase activity of MELK is likely to affect mammary carcinogenesis through inhibition of the pro-apoptotic function of Bcl-GL 4.
- pEg3 is a potential regulator of the G2/M progression and may act antagonistically to the CDC25B phosphatase
- pEg3 kinase is able to specifically phosphorylate CDC25B in vitro.
- One phosphorylation site was identified and corresponded to serine 323.
- genes itself or in pairs or in larger number groups with other genes represent biologically and clinically important survival significant gene signature.
- FIG. 6E and 6F show an example of a highly significant partition of breast cancer patients by survival (DFS) based on one of cell cycle gene pairs - CCNA2-PTPRT.
- CCNA2 Cyclin-A2 or Cyclin A
- G1/S start
- G2/M mitosis
- CCNA2 The paired partner of CCNA2 is a receptor protein tyrosine phosphatise T gene, PRPRT, which regulates cell growth, proliferation and may be important for the STAT3 signalling pathway and development of some cancers.
- PRPRT receptor protein tyrosine phosphatise T gene
- the present survival analysis suggests that this pair of regulatory genes could be involved with other cell cycle genes (see, for example, Table 2) in the control of breast cancer cell development.
- CCNA2 has second synergistic gene partner, it is CENPE.
- CENPE Certrosome-associated protein E
- CENPE Certrosome-associated protein E
- CENPE Certrosome-associated protein E
- CDCA8 Synergestic survival significant partner of CENPE.
- CDCA8 is a component of a chromosomal passenger complex required for stability of the bipolar mitotic spindle. CDCA8 play regulatory role in SUMO pathway including RanBP2 and SENP3.
- Mitotic regulator Survivin binds as a monomer to its functional interactor Borealin.
- CENPE and CDCA8 could be physically co-localized in vicinity of centromeric and spindle regions of mitotic cells and form a functional module controlling key biological processes of cell mitosis.
- Our goodness-off split survival (DDg) analysis suggests that the both genes could be essential for survival of breast cancer patients.
- ERCC6L is DNA helicase that acts as an essential component of the spindle assembly checkpoint.
- gene pairs SPAG5-ERCC6L, CENPE-CCNE2, CDCA8-CLDN5 consist of a novel breast cancer associated synergistic survival significant gene pairs playing a important role in dynamics of chromosomes during cell mitosis. Together with the 5-gene genetic grade signature genes they form an integrative functional module essential for breast cancer prognosis and prediction.
- LRP2 megalin
- IGA7 itnergrin alpha 7
- the megalin gene contributes to the endocytic uptake of 25(OH)D3-DBP and activation of the vitamin D receptor (VDR) pathway.
- VDR vitamin D receptor
- the VDR pathway is normally expressed in mammary gland, where it functions to oppose estrogen-driven proliferation and maintain differentiation.
- LRP2 can be highly expressed in some breast cancer cells. The above suggest that LRP2 participates in negative growth regulation of mammary epithelial cells. Associations of expression of integrin alpha 7 with breast cancer and breast cancer patient survival have not been reported. Megalin and integrin alpha 7 have also not been reported as molecular partners in anti-cancer regulation.
- HN1-CACNA1D pair Hematological and neurological expressed 1 protein is a protein that in humans is encoded by the HN1 gene.
- CACNA1D is a calcium channel, voltage-dependent, L type, alpha 1 D subunit. The roles of these genes in breast cancer have been not studied yet.
- NUDT1 (synonym MTH1) is an enzyme that hydrolyzes oxidized purine nucleoside triphosphates, such as 8-oxo-dGTP, 8-oxo-dATP, 2-hydroxy-dATP, and 2-hydroxy rATP, to monophosphates, thereby preventing mis-incorporation.
- the encoded protein is localized mainly in the cytoplasm, with some in the mitochondria, suggesting that it is involved in the sanitization of nucleotide pools both for nuclear and mitochondrial genomes.
- NUDT1 plays an important role in protecting cells against H(2)O(2)-induced apoptosis via a Noxa- and caspase-3/7-mediated signaling pathway. Elevated levels of NUDT1 protein is associated non-smal cell lung carcinomas. This gene provides synergistic survival effect together with gene neuromedin U (NMU).
- NMU gene neuromedin U
- NMU may be involved in the HGF-c-Met paracrine loop regulating cell migration, invasiveness and dissemination of pancreatic ductal adenocarcinoma.
- NMU and its cancer-specific receptors, as well as its target genes, are frequently overexpressed in clinical samples of lung cancer and in cell lines, and that those gene products play indispensable roles in the growth and progression of lung cancer cells.
- NmU expression is related to Myb and that the NmU/NMU1R axis constitutes a previously unknown growth-promoting autocrine loop in myeloid leukemia cells.
- NMU plays a role in feeding behavior and catabolic functions via corticotropin-releasing hormone. Amino acid variants in NMU associate with overweight and obesity, suggesting that NMU is involved in energy regulation in humans.
- the methods can be extended up to any number of genes. We can check only the "all possible pairs" of the statistically significant individual genes or generally all possible pairs of genes in our study. The number of genes to be used is purely a matter of the researcher's choice. Table 4 indicates the SEQ ID NO. and the corresponding gene and GenBank reference in the sequence listing. Where more than one transcript variant exists, the invention may be practiced with any one of the transcript variants, any of several of the transcript variants or all of the transcript variants.
Landscapes
- Life Sciences & Earth Sciences (AREA)
- Health & Medical Sciences (AREA)
- Engineering & Computer Science (AREA)
- Chemical & Material Sciences (AREA)
- Physics & Mathematics (AREA)
- Bioinformatics & Cheminformatics (AREA)
- Organic Chemistry (AREA)
- Proteomics, Peptides & Aminoacids (AREA)
- Biophysics (AREA)
- Biotechnology (AREA)
- Genetics & Genomics (AREA)
- General Health & Medical Sciences (AREA)
- Medical Informatics (AREA)
- Wood Science & Technology (AREA)
- Zoology (AREA)
- Molecular Biology (AREA)
- Analytical Chemistry (AREA)
- Theoretical Computer Science (AREA)
- Spectroscopy & Molecular Physics (AREA)
- Evolutionary Biology (AREA)
- Bioinformatics & Computational Biology (AREA)
- Immunology (AREA)
- Data Mining & Analysis (AREA)
- General Engineering & Computer Science (AREA)
- Biochemistry (AREA)
- Microbiology (AREA)
- Epidemiology (AREA)
- Bioethics (AREA)
- Computer Vision & Pattern Recognition (AREA)
- Databases & Information Systems (AREA)
- Artificial Intelligence (AREA)
- Evolutionary Computation (AREA)
- Public Health (AREA)
- Software Systems (AREA)
- Pathology (AREA)
- Hospice & Palliative Care (AREA)
- Oncology (AREA)
- Measuring Or Testing Involving Enzymes Or Micro-Organisms (AREA)
- Apparatus Associated With Microorganisms And Enzymes (AREA)
Applications Claiming Priority (2)
| Application Number | Priority Date | Filing Date | Title |
|---|---|---|---|
| US15894809P | 2009-03-10 | 2009-03-10 | |
| EP10751103.2A EP2406730A4 (de) | 2009-03-10 | 2010-03-10 | Identifizierung von biologisch und klinisch essentiellen genen und genpaaren sowie verfahren zur anwendung der identifizierten gene und genpaare |
Related Parent Applications (1)
| Application Number | Title | Priority Date | Filing Date |
|---|---|---|---|
| EP10751103.2A Division EP2406730A4 (de) | 2009-03-10 | 2010-03-10 | Identifizierung von biologisch und klinisch essentiellen genen und genpaaren sowie verfahren zur anwendung der identifizierten gene und genpaare |
Publications (2)
| Publication Number | Publication Date |
|---|---|
| EP2808815A2 true EP2808815A2 (de) | 2014-12-03 |
| EP2808815A3 EP2808815A3 (de) | 2015-03-25 |
Family
ID=42728581
Family Applications (3)
| Application Number | Title | Priority Date | Filing Date |
|---|---|---|---|
| EP10751102.4A Not-in-force EP2406729B1 (de) | 2009-03-10 | 2010-03-10 | Verfahren, system und computerprogrammprodukt für die systematische beurteilung der prognostischen eigenschaften von genpaaren für krankheitszustände. |
| EP10751103.2A Withdrawn EP2406730A4 (de) | 2009-03-10 | 2010-03-10 | Identifizierung von biologisch und klinisch essentiellen genen und genpaaren sowie verfahren zur anwendung der identifizierten gene und genpaare |
| EP14174952.3A Withdrawn EP2808815A3 (de) | 2009-03-10 | 2010-03-10 | Identifizierung von biologisch und klinisch essentiellen Genen und Genpaaren sowie Verfahren zur Anwendung der identifizierten Gene und Genpaare |
Family Applications Before (2)
| Application Number | Title | Priority Date | Filing Date |
|---|---|---|---|
| EP10751102.4A Not-in-force EP2406729B1 (de) | 2009-03-10 | 2010-03-10 | Verfahren, system und computerprogrammprodukt für die systematische beurteilung der prognostischen eigenschaften von genpaaren für krankheitszustände. |
| EP10751103.2A Withdrawn EP2406730A4 (de) | 2009-03-10 | 2010-03-10 | Identifizierung von biologisch und klinisch essentiellen genen und genpaaren sowie verfahren zur anwendung der identifizierten gene und genpaare |
Country Status (4)
| Country | Link |
|---|---|
| US (3) | US20120117018A1 (de) |
| EP (3) | EP2406729B1 (de) |
| SG (4) | SG10201403064QA (de) |
| WO (2) | WO2010104473A1 (de) |
Families Citing this family (7)
| Publication number | Priority date | Publication date | Assignee | Title |
|---|---|---|---|---|
| WO2015179868A2 (en) | 2014-05-23 | 2015-11-26 | Dacadoo Ag | Automated health data acquisition, processing and communication system |
| SG2013079173A (en) * | 2013-10-18 | 2015-05-28 | Agency Science Tech & Res | Sense-antisense gene pairs for patient stratification, prognosis, and therapeutic biomarkers identification |
| US10424404B2 (en) | 2013-11-13 | 2019-09-24 | Dacadoo Ag | Automated health data acquisition, processing and communication system and method |
| CN108320806B (zh) * | 2018-05-09 | 2022-04-12 | 中国科学院昆明动物研究所 | 一种基于多基因表达特征谱的结肠癌个性化预后评估方法 |
| CN108648826B (zh) * | 2018-05-09 | 2022-04-15 | 中国科学院昆明动物研究所 | 一种基于多基因表达特征谱的胰腺癌个性化预后评估方法 |
| CN108630317B (zh) * | 2018-05-09 | 2022-04-15 | 中国科学院昆明动物研究所 | 一种基于多基因表达特征谱的肝癌个性化预后评估方法 |
| CN108694991B (zh) * | 2018-05-14 | 2021-01-01 | 武汉大学中南医院 | 一种基于多个转录组数据集整合与药物靶标信息的重定位药物发现方法 |
Family Cites Families (4)
| Publication number | Priority date | Publication date | Assignee | Title |
|---|---|---|---|---|
| US20040002067A1 (en) * | 2001-12-21 | 2004-01-01 | Erlander Mark G. | Breast cancer progression signatures |
| US8445198B2 (en) * | 2005-12-01 | 2013-05-21 | Medical Prognosis Institute | Methods, kits and devices for identifying biomarkers of treatment response and use thereof to predict treatment efficacy |
| JP2010524456A (ja) * | 2007-04-16 | 2010-07-22 | イプソゲン | 乳癌に罹患している雌哺乳動物に対する臨床転帰の傾向を評価する方法 |
| US20100204058A1 (en) * | 2009-01-28 | 2010-08-12 | Howard Yuan-Hao Chang | Profiling for Determination of Response to Treatment for Inflammatory Disease |
-
2010
- 2010-03-10 EP EP10751102.4A patent/EP2406729B1/de not_active Not-in-force
- 2010-03-10 EP EP10751103.2A patent/EP2406730A4/de not_active Withdrawn
- 2010-03-10 WO PCT/SG2010/000079 patent/WO2010104473A1/en not_active Ceased
- 2010-03-10 SG SG10201403064QA patent/SG10201403064QA/en unknown
- 2010-03-10 WO PCT/SG2010/000080 patent/WO2010104474A1/en not_active Ceased
- 2010-03-10 SG SG2011065406A patent/SG174333A1/en unknown
- 2010-03-10 US US13/255,490 patent/US20120117018A1/en not_active Abandoned
- 2010-03-10 US US13/255,898 patent/US20120004135A1/en not_active Abandoned
- 2010-03-10 SG SG2011057700A patent/SG173635A1/en unknown
- 2010-03-10 EP EP14174952.3A patent/EP2808815A3/de not_active Withdrawn
- 2010-03-10 SG SG10201403038SA patent/SG10201403038SA/en unknown
-
2014
- 2014-06-10 US US14/301,296 patent/US20160040221A1/en not_active Abandoned
Non-Patent Citations (19)
| Title |
|---|
| BRESLOW, N.E.: "Covariance analysis of censored survival data", BIOMETRICS, vol. 30, 1974, pages 89 - 99 |
| COX DR: "Regression Models and Life Tables (with Discussion", JOURNAL OF THE ROYAL STATISTICAL SOCIETY SERIES B, vol. 34, 1972, pages 187 - 220 |
| COX R.D.; OAKES, D.: "Analysis of Survival Data", 1984, CHAPMAN AND HALL |
| COX, D.R.; SNELL, E.J.: "A general definition of residuals (with discussion", JOURNAL OF THE ROYAL STATISTICAL SOCIETY, SERIES B, vol. 30, 1968, pages 248 - 265 |
| EFRON, B.; TIBSHIRANI, R.J.: "An Introduction to the Bootstrap", 1994, CHAPMAN AND HALL |
| HORI T; AMANO M; SUZUKI A; BACKER CB; WELBURN JP; DONG Y; MCEWEN BF; SHANG WH; SUZUKI E; OKAWA K: "CCAN makes multiple contacts with centromeric DNA to provide distinct pathways to the outer kinetochore", CELL., vol. 135, no. 6, 12 December 2008 (2008-12-12), pages 1039 - 52 |
| IVSHINA ANNA V ET AL: "Genetic reclassification of histologic grade delineates new clinical subtypes of breast cancer", CANCER RESEARCH, AMERICAN ASSOCIATION FOR CANCER RESEARCH, US, vol. 66, no. 21, 1 November 2006 (2006-11-01), pages 10292 - 10301, XP002510499, ISSN: 0008-5472, DOI: 10.1158/0008-5472.CAN-05-4414 * |
| IVSHINA, A.V.; GEORGE, J.; SENKO, O ET AL.: "Genetic reclassification of histologic grade delineates new clinical subtypes of breast cancer", CANCER RESEARCH, vol. 66, 2006, pages 10292 - 10301 |
| KAPLAN, E. L.; MEIER, P.: "Nonparametric estimation from incomplete observations", JASA, vol. 53, 1958, pages 457 - 48 |
| KIM H; LEE M; LEE S; PARK B; KOH W; LEE DJ; LIM DS; LEE S: "Cancer-upregulated gene 2 (CUG2), a new component of centromere complex, is required for kinetochore function", MOL CELLS., vol. 27, no. 6, 12 June 2009 (2009-06-12), pages 697 - 701 |
| KUZNETSOV, V.A.; SENKO, O.V.; MILLER, L.D.; IVSHINA, A.: "Statistically Weighted Voting Analysis of Microarrays for Molecular Pattern Selection and Discovery Cancer Genotypes", INTERNATIONAL JOURNAL OF COMPUTER SCIENCE AND NETWORK SECURITY, vol. 6, 2006, pages 73 - 83 |
| LEE S; GANG J; JEON SB; CHOO SH; LEE B; KIM YG; LEE YS; JUNG J; SONG SY; KOH SS: "Molecular cloning and functional analysis of a novel oncogene, cancer-upregulated gene 2 (CUG2", BIOCHEM BIOPHYS RES COMMUN., vol. 360, no. 3, 28 June 2007 (2007-06-28), pages 633 - 9 |
| LOUGHIN, T.M.: "A residual bootstrap for regression parameters in proportional hazards model", J. OF STATISTICAL AND COMPUTATIONAL SIMULATIONS, vol. 52, 1995, pages 367 - 384 |
| MILLENAAR, F. F.; OKYERE, J.; MAY, S.T.; VAN ZANTEN, M.; VOESENEK, L.A.C.J.; PETERS, A.J.M.: "How to decide? Different methods of calculating gene expression from short oligonucleotide array data will give different results", BMC BIOINFORMATICS, vol. 7, no. 137, 2006 |
| MOTAKIS E; IVSHINA AV; KUZNETSOV VA: "Data-driven approach to predict survival of cancer patients: estimation of microarray genes' prediction significance by Cox proportional hazard regression model", IEEE ENG MED BIOL MAG., vol. 28, no. 4, July 2009 (2009-07-01), pages 58 - 66 |
| MOTAKIS, E.; NASON, G.P.; FRYZLEWICZ, P.; RUTTER, G.A.: "Variance stabilization and normalization for one-color microarray data using a data-driven multiscale approach", BIOINFORMATICS, vol. 22, 2006, pages 2547 - 2553 |
| PAWITAN, Y.; BJOHLE, J.; AMLER, L.: "Gene expression profiling spares early breast cancer patients from adjuvant therapy: derived and validated in two population-based cohorts", BREAST CANCER RESEARCH, vol. 7, 2005, pages R953 - R964 |
| PRESS, W.H.; FLANNERY, B.P.; TEUKOLSKY, S.A; VETTERLING, W.T.: "Numerical Recipes in C: The Art of Scientific Computing", 1992, CAMBRIDGE UNIVERSITY PRESS |
| SAMBROOK; RUSSEL: "Molecular Cloning: A Laboratory Manual", 2001, COLD SPRINGS HARBOR LABORATORY |
Also Published As
| Publication number | Publication date |
|---|---|
| SG10201403064QA (en) | 2014-10-30 |
| EP2406729A4 (de) | 2014-01-01 |
| WO2010104473A1 (en) | 2010-09-16 |
| EP2406730A1 (de) | 2012-01-18 |
| EP2406729A1 (de) | 2012-01-18 |
| US20120117018A1 (en) | 2012-05-10 |
| US20160040221A1 (en) | 2016-02-11 |
| SG174333A1 (en) | 2011-10-28 |
| US20120004135A1 (en) | 2012-01-05 |
| EP2406729B1 (de) | 2017-07-05 |
| EP2406730A4 (de) | 2014-01-01 |
| EP2808815A3 (de) | 2015-03-25 |
| WO2010104474A1 (en) | 2010-09-16 |
| SG10201403038SA (en) | 2014-10-30 |
| SG173635A1 (en) | 2011-09-29 |
Similar Documents
| Publication | Publication Date | Title |
|---|---|---|
| Sørlie et al. | Distinct molecular mechanisms underlying clinically relevant subtypes of breast cancer: gene expression analyses across three different platforms | |
| CN101356532B (zh) | 基于基因的算法型癌症预后 | |
| EP2982985B1 (de) | System zur vorhersage einer prognose von lokal fortgeschrittenem magenkrebs | |
| US20080275652A1 (en) | Gene-based algorithmic cancer prognosis | |
| CN104093859A (zh) | 多基因生物标志物的鉴定 | |
| US20160040221A1 (en) | Identification of biologically and clinically essential genes and gene pairs, and methods employing the identified genes and gene pairs | |
| EP2419540B1 (de) | Verfahren und genexpressionssignaturen zur beurteilung der aktivität des ras-signalweges | |
| JP2010502227A (ja) | 生物学的経路の遺伝子発現分析を用いたリンパ節陰性の原発性乳がんの遠隔転移を予測する方法 | |
| EP2406728B1 (de) | Verfahren zur identifizierung, vorhersage und prognose von tumoraggressivität | |
| US9721067B2 (en) | Accelerated progression relapse test | |
| US10087489B2 (en) | Biomarkers and uses thereof in prognosis and treatment strategies for right-side colon cancer disease and left-side colon cancer disease | |
| US20110039723A1 (en) | Malignancy-risk signature from histologically normal breast tissue | |
| EP3207158B1 (de) | Glycosyltransferase-genexpressionsprofils zur identifizierung von mehreren krebsarten und -unterarten | |
| US9580756B2 (en) | Stratification of left-side and right-side colon cancer | |
| Toh et al. | A robust tool for discriminative analysis and feature selection in paired samples impacts the identification of the genes essential for reprogramming lung tissue to adenocarcinoma | |
| EP2655663A2 (de) | Biomarker und ihre verwendung für prognose- und behandlungsstrategien für rechtsseitiges und linksseitiges kolonkarzinom | |
| WO2013077859A1 (en) | Gene expression signature for the prognosis of epithelial cancer | |
| HK1127413A (en) | Gene-based algorithmic cancer prognosis | |
| NZ612471B2 (en) | Colon cancer gene expression signatures and methods of use |
Legal Events
| Date | Code | Title | Description |
|---|---|---|---|
| PUAI | Public reference made under article 153(3) epc to a published international application that has entered the european phase |
Free format text: ORIGINAL CODE: 0009012 |
|
| 17P | Request for examination filed |
Effective date: 20140630 |
|
| AC | Divisional application: reference to earlier application |
Ref document number: 2406730 Country of ref document: EP Kind code of ref document: P |
|
| AK | Designated contracting states |
Kind code of ref document: A2 Designated state(s): AT BE BG CH CY CZ DE DK EE ES FI FR GB GR HR HU IE IS IT LI LT LU LV MC MK MT NL NO PL PT RO SE SI SK SM TR |
|
| PUAL | Search report despatched |
Free format text: ORIGINAL CODE: 0009013 |
|
| AK | Designated contracting states |
Kind code of ref document: A3 Designated state(s): AT BE BG CH CY CZ DE DK EE ES FI FR GB GR HR HU IE IS IT LI LT LU LV MC MK MT NL NO PL PT RO SE SI SK SM TR |
|
| RIC1 | Information provided on ipc code assigned before grant |
Ipc: G06F 19/20 20110101ALI20150216BHEP Ipc: G06F 19/24 20110101AFI20150216BHEP |
|
| 17Q | First examination report despatched |
Effective date: 20160229 |
|
| STAA | Information on the status of an ep patent application or granted ep patent |
Free format text: STATUS: THE APPLICATION IS DEEMED TO BE WITHDRAWN |
|
| 18D | Application deemed to be withdrawn |
Effective date: 20181002 |