EP2851662A2 - Dispositif et procédé d'enregistrement d'une image hyperspectrale - Google Patents
Dispositif et procédé d'enregistrement d'une image hyperspectrale Download PDFInfo
- Publication number
- EP2851662A2 EP2851662A2 EP14180707.3A EP14180707A EP2851662A2 EP 2851662 A2 EP2851662 A2 EP 2851662A2 EP 14180707 A EP14180707 A EP 14180707A EP 2851662 A2 EP2851662 A2 EP 2851662A2
- Authority
- EP
- European Patent Office
- Prior art keywords
- image
- spectrometer
- spectra
- hyperspectral
- area
- Prior art date
- Legal status (The legal status is an assumption and is not a legal conclusion. Google has not performed a legal analysis and makes no representation as to the accuracy of the status listed.)
- Withdrawn
Links
Images


Classifications
-
- G—PHYSICS
- G01—MEASURING; TESTING
- G01J—MEASUREMENT OF INTENSITY, VELOCITY, SPECTRAL CONTENT, POLARISATION, PHASE OR PULSE CHARACTERISTICS OF INFRARED, VISIBLE OR ULTRAVIOLET LIGHT; COLORIMETRY; RADIATION PYROMETRY
- G01J3/00—Spectrometry; Spectrophotometry; Monochromators; Measuring colours
- G01J3/28—Investigating the spectrum
- G01J3/2823—Imaging spectrometer
-
- A—HUMAN NECESSITIES
- A61—MEDICAL OR VETERINARY SCIENCE; HYGIENE
- A61B—DIAGNOSIS; SURGERY; IDENTIFICATION
- A61B1/00—Instruments for performing medical examinations of the interior of cavities or tubes of the body by visual or photographical inspection, e.g. endoscopes; Illuminating arrangements therefor
- A61B1/00163—Optical arrangements
- A61B1/00172—Optical arrangements with means for scanning
-
- A—HUMAN NECESSITIES
- A61—MEDICAL OR VETERINARY SCIENCE; HYGIENE
- A61B—DIAGNOSIS; SURGERY; IDENTIFICATION
- A61B1/00—Instruments for performing medical examinations of the interior of cavities or tubes of the body by visual or photographical inspection, e.g. endoscopes; Illuminating arrangements therefor
- A61B1/00163—Optical arrangements
- A61B1/00186—Optical arrangements with imaging filters
-
- A—HUMAN NECESSITIES
- A61—MEDICAL OR VETERINARY SCIENCE; HYGIENE
- A61B—DIAGNOSIS; SURGERY; IDENTIFICATION
- A61B1/00—Instruments for performing medical examinations of the interior of cavities or tubes of the body by visual or photographical inspection, e.g. endoscopes; Illuminating arrangements therefor
- A61B1/04—Instruments for performing medical examinations of the interior of cavities or tubes of the body by visual or photographical inspection, e.g. endoscopes; Illuminating arrangements therefor combined with photographic or television appliances
-
- G—PHYSICS
- G01—MEASURING; TESTING
- G01J—MEASUREMENT OF INTENSITY, VELOCITY, SPECTRAL CONTENT, POLARISATION, PHASE OR PULSE CHARACTERISTICS OF INFRARED, VISIBLE OR ULTRAVIOLET LIGHT; COLORIMETRY; RADIATION PYROMETRY
- G01J3/00—Spectrometry; Spectrophotometry; Monochromators; Measuring colours
- G01J3/02—Details
- G01J3/0205—Optical elements not provided otherwise, e.g. optical manifolds, diffusers, windows
- G01J3/0237—Adjustable, e.g. focussing
-
- G—PHYSICS
- G01—MEASURING; TESTING
- G01J—MEASUREMENT OF INTENSITY, VELOCITY, SPECTRAL CONTENT, POLARISATION, PHASE OR PULSE CHARACTERISTICS OF INFRARED, VISIBLE OR ULTRAVIOLET LIGHT; COLORIMETRY; RADIATION PYROMETRY
- G01J3/00—Spectrometry; Spectrophotometry; Monochromators; Measuring colours
- G01J3/02—Details
- G01J3/0205—Optical elements not provided otherwise, e.g. optical manifolds, diffusers, windows
- G01J3/0248—Optical elements not provided otherwise, e.g. optical manifolds, diffusers, windows using a sighting port, e.g. camera or human eye
-
- G—PHYSICS
- G01—MEASURING; TESTING
- G01J—MEASUREMENT OF INTENSITY, VELOCITY, SPECTRAL CONTENT, POLARISATION, PHASE OR PULSE CHARACTERISTICS OF INFRARED, VISIBLE OR ULTRAVIOLET LIGHT; COLORIMETRY; RADIATION PYROMETRY
- G01J3/00—Spectrometry; Spectrophotometry; Monochromators; Measuring colours
- G01J3/02—Details
- G01J3/0264—Electrical interface; User interface
-
- G—PHYSICS
- G01—MEASURING; TESTING
- G01J—MEASUREMENT OF INTENSITY, VELOCITY, SPECTRAL CONTENT, POLARISATION, PHASE OR PULSE CHARACTERISTICS OF INFRARED, VISIBLE OR ULTRAVIOLET LIGHT; COLORIMETRY; RADIATION PYROMETRY
- G01J3/00—Spectrometry; Spectrophotometry; Monochromators; Measuring colours
- G01J3/02—Details
- G01J3/027—Control of working procedures of a spectrometer; Failure detection; Bandwidth calculation
-
- G—PHYSICS
- G01—MEASURING; TESTING
- G01J—MEASUREMENT OF INTENSITY, VELOCITY, SPECTRAL CONTENT, POLARISATION, PHASE OR PULSE CHARACTERISTICS OF INFRARED, VISIBLE OR ULTRAVIOLET LIGHT; COLORIMETRY; RADIATION PYROMETRY
- G01J3/00—Spectrometry; Spectrophotometry; Monochromators; Measuring colours
- G01J3/02—Details
- G01J3/0291—Housings; Spectrometer accessories; Spatial arrangement of elements, e.g. folded path arrangements
-
- G—PHYSICS
- G01—MEASURING; TESTING
- G01J—MEASUREMENT OF INTENSITY, VELOCITY, SPECTRAL CONTENT, POLARISATION, PHASE OR PULSE CHARACTERISTICS OF INFRARED, VISIBLE OR ULTRAVIOLET LIGHT; COLORIMETRY; RADIATION PYROMETRY
- G01J3/00—Spectrometry; Spectrophotometry; Monochromators; Measuring colours
- G01J3/02—Details
- G01J3/06—Scanning arrangements arrangements for order-selection
-
- G—PHYSICS
- G01—MEASURING; TESTING
- G01J—MEASUREMENT OF INTENSITY, VELOCITY, SPECTRAL CONTENT, POLARISATION, PHASE OR PULSE CHARACTERISTICS OF INFRARED, VISIBLE OR ULTRAVIOLET LIGHT; COLORIMETRY; RADIATION PYROMETRY
- G01J3/00—Spectrometry; Spectrophotometry; Monochromators; Measuring colours
- G01J3/28—Investigating the spectrum
Definitions
- the present application relates to a device for recording a hyperspectral image of an examination area of a body, comprising a light source for irradiating the examination area with light having a spectral distribution suitable for the desired spectroscopic analysis, an input objective for generating an image of the examination area in an image plane, a spectrometer a slit-shaped aperture arranged in the image plane for masking out a slit-shaped region of the image of the examination area, a dispersive element which is constructed and arranged in such a way that the dispersive fanning of the light passing through the aperture takes place in a direction different from the longitudinal direction of the aperture; and a camera sensor constructed and arranged to provide a diffraction pattern of the dispersive element with the longitudinal direction of the aperture in a first direction and the dispersive spectral fanning of the aperture Receiving light in the first different direction on its camera sensor surface, and a data processing device connected to the camera sensor, which is adapted to store the signals received from the camera sensor as
- the hyperspectral image can be imagined in principle as a three-dimensional vector space in which the spatial coordinates x, y span two dimensions and the wavelengths ⁇ span the third dimension. Due to the finite number of sensor elements on the camera sensor and the limited resolution of the location coordinate x along the longitudinal direction of the diaphragm and the ⁇ resolution and the finite spatial resolution in the location coordinate y by the stepwise scanning of the examination area in the Y direction is the hyperspectral image in practice, but not by a vector space, but by a set of 3-tuples (x i , y j , ⁇ k ).
- the invention further relates to a corresponding method for recording a hyperspectral image of an examination area of a body.
- spectral imaging In the scientific and technical field of spectroscopy, many applications have evolved over the past 20 years or so. The spatially resolved spectroscopy became increasingly important.
- the new systems and methods are known as spectral imaging, hyperspectral imaging, chemical imaging or hyperspectral cameras. Hyperspectral cameras are distinguished from spectral cameras in that they record a quasi-continuous spectrum which is split into many wavelength points, whereas (multi-) spectral cameras capture only a few spectral interpolation points, which can also lie spectrally separated from one another.
- Hyperspectral techniques provide users with essential and novel ways to analyze or diagnose image data. It would also be very important for a user to combine the color image information recognizable with his own eye with the invisible chemical information from the spectra or in images be superimposed. In medicine, this step is similar to the step from simple diagnostic imaging to computed tomography, in which the physician is provided with an additional dimension of the datasets.
- High-resolution camera systems of all color camera systems with continuous fast image generation, ie digital video systems, are widely used today and are state of the art. Such systems find versatile use, e.g. in automation technology, quality control, medical technology and microscopy. It is helpful to obtain spatially resolved spectral information that can be used to obtain chemical information spatially resolved in the study area. It is often important and useful to go beyond the spectral sensitivity range of the eye from 400 nm to 700 nm. In the UV and NIR spectral information is present, which are directly linked to the chemical properties of the body studied. Quantum-mechanically, the electron transitions in the electron shells of atoms and molecules are in the UV range. In the IR spectral region, there are vibrational transitions in the molecules.
- CMOS complementary metal-oxide-semiconductor
- CCD complementary metal-oxide-semiconductor
- the body to be examined is irradiated with UV light, and the longer-wavelength emitted fluorescent light is analyzed predominantly in the visible range and in the NIR spectral range.
- VNIR very near infrared range
- the penetration depths of the radiation into the body are higher due to the relatively low absorption cross-sections of organic molecules and especially of water than in longer-wave spectral ranges.
- chemical imbalances on the surface in this spectral region have a lower influence. Therefore, in medicine and biology, this spectral range is also referred to as an "optical window".
- Tunable filters work eg on liquid crystal basis and are also called “Liquid Crystal Tunable Filters” (LCTFs).
- LCTFs Liquid Crystal Tunable Filters
- An embodiment with such a filter construction is, for example, in US 6,992,809 B1 described.
- An example of a device with a tunable filter for fluorescence spectroscopy is shown in FIG US 2012/061586 A1 described.
- Hyperspectral camera devices based on imaging spectrometers are generally constructed with an imaging transmission or reflection spectrometer, which generates the corresponding spectra for a strip-shaped region of the image of the object.
- an imaging transmission or reflection spectrometer In order to build up a two-dimensional image from successive images of successive strip-shaped regions of the image of the investigation area, a passable mirror unit between the objective and the object is usually used, usually directly in the vicinity of the objective, or a mechanical feed of the object is realized in which the object to be examined Object is moved past the fixed spectrometer step by step.
- Such an imaging spectrometer is in US 2012/0105845 A1 described; This prior art forms the basis for the preambles of claim 1 and claim 11.
- the spectrometer has a slit-shaped aperture for masking out a slit-shaped region of the image of the examination area.
- the light from a slit-shaped area of the image of the examination area falling through the slit falls on a dispersive element, which may be formed as a prism or grid, which is constructed and arranged so that the dispersive fanning of the light passing through the slit-shaped aperture in one of the Longitudinal direction of the diaphragm in different directions, for example perpendicular to it, takes place.
- a camera sensor records the diffraction image, wherein in the diffraction image on the camera sensor surface, the longitudinal direction of the diaphragm is in a first direction and the dispersive spectral fanning of the light in the direction different from the first.
- the first direction now contains location information of the picture element along the longitudinal direction of the slot-shaped aperture, while in the second direction the Spectral fanning of the light of the associated picture element runs.
- the directions of the location information and the wavelength information may be perpendicular to each other, but skew coordinate systems may be used in which the location and wavelength information is later assigned by conversion.
- a data processing device connected to the camera sensor is set up to store the signals received by the camera sensor as a multiplicity of spectrums, each with assigned spatial coordinate x along the longitudinal direction X of the diaphragm.
- the device is adapted to receive successive slot-shaped regions of the image of the examination area with associated spatial coordinate y in the second direction Y in a second direction y different from the longitudinal direction X, the data processing device being configured to store the spectra in each case and to combine the recorded spectra with the associated location coordinates x, y into a hyperspectral image of the examination area.
- the successive recording of successive strip-shaped regions of the examination area is effected by moving the object to be examined along the second direction Y past the spectrometer, recording of a strip-shaped area of the examination area being carried out after each feed step of the drive and the feed step width being the width of the strip-shaped area equivalent.
- the present invention is directed to a hyperspectral camera apparatus and hyperspectral imaging method for use in medical technology.
- a typical field of application is the study of oxygen saturation in a study area of a body part of a patient.
- NIR spectroscopy is used to study oxygen saturation in blood and tissue.
- Oxygen saturation is one of the most important monitoring parameters, as a shortage Cells can lead to damage or death.
- the oxygen transport in the body takes place via the hemoglobin in the blood.
- Another important measurement parameter is the hemoglobin concentration in the blood, tissue or specific organ.
- Today, all these parameters are usually recorded with invasive blood sampling and a spectrometer-based blood gas analysis. Continuously and non-invasively, these parameters can be monitored by pulse oximeter (arterial oxygen saturation) or tissue oximeter.
- These oximeters use sensors that collect the data at points at a measuring point. Usual measuring points on the human body are fingers or the forehead.
- the recording should be continuous or quasicontinuierlich feasible, so that direct changes in certain therapies or surgical procedures can be tracked.
- tumor tissue can be differentiated from normal tissue in vivo by methods of hyperspectral imaging ( S. Panasyuk et al., "Medical Hyperspectral Imaging to Facilitate Residual Tumor Identification During Surgery, Cancer Biology & Therapy, 6: 3, pp. 439-446, March 2007 , and Akbari et al., "Hyperspectral Imaging and Quantitative Analysis for Prostate Cancer Detection", J. Biomed Opt. 2012 July, 17 (7 )).
- a complex requirement profile for a hyperspectral camera device arises in practice and in everyday clinical practice.
- a hyperspectral camera device must first be so compact that it can simply be positioned over the site of the patient to be examined and kept fixed there.
- typical maximum guideline values of 20 x 20 x 20 cm 3 and a weight of about 5 kg can be assumed, so that the device can be used on conventional equipment in the clinical area.
- These guide values refer to the overall device including lighting, lens, spectrometer, data processing equipment and housing.
- the image sequence must be recorded at short intervals. This is necessary in order to sharply adjust an image at one position on the one hand and to prevent the other part of the body to be examined from moving during the recording. Focusing requires a continuous sequence of at least 10 Hz. For this it would be advantageous, besides the hyperspectral Recording also to record an optical color camera image of the study area.
- the device and the method should be usable under everyday clinical conditions.
- the spectrometer is mounted in the image plane in the second direction y movable relative to the input lens.
- the device remains stationary or stationary relative to the body part above the examination area, while the spectrometer is moved successively in the image plane over the examination area.
- the second direction y of the movement of the spectrometer can be perpendicular to the first direction x (longitudinal direction of the slit-shaped diaphragm);
- non-perpendicular directions, different from the first direction x are also possible for the second direction y, wherein then, in the case of a non-perpendicular traversing direction y for the shape of the recorded image of the study area results in a parallelogram.
- the data processing device is set up to gradually move the spectrometer with the diaphragm in the image plane of the examination area along the image plane so as to successively record successive slit-shaped areas of the image of the examination area with spectra of the image elements each having associated location coordinates x, y and to the hyperspectral image reassemble.
- the measures according to the invention make it possible for the device to be held stationary or stationary over the examination area, while on the other hand the examination area can be scanned by successive stepwise movement of the spectrometer in the image plane of the input objective, the travel distance of the spectrometer being significantly smaller than is the longitudinal extent of the study area; This is because the extent of the image of the examination area in the image plane of the input lens is usually much smaller than the extent of the examination area itself, as is also known for conventional optical cameras in which the image of a macroscopic object is much smaller than that Object itself is.
- a beam splitter is arranged in the beam path between the input lens and the spectrometer, which divides the beams from the examination area behind the input lens and deflects the divided partial beams and directed to a second camera sensor, which is arranged in a second image plane to parallel to the hyperspectral image of the study area an optical To record an image of the study area and display it on a display device.
- the display of the optical image may be in parallel with displays to the hyperspectral image, or overlays between optical and hyperspectral images may be displayed.
- the data processing device is set up to adapt the spectra of the hyperspectral image to predetermined criteria, in particular characteristic spectral features of specific substances, such as e.g. Oxygen or hemoglobin, and to assign to each spectrum of a pixel, according to the result of the examination, an evaluation quantity (eg, a measure that evaluates the presence of oxygen) and a two-dimensional representation of the study area in which each pixel depends on the associated optical coding (for example, a color coding, which represents the presence of oxygen in a color gamut of 0 to 100%), and so to produce an optically encoded analysis image in a two-dimensional form (eg, the location-dissolved oxygen concentration) and on the display device to bring to the display.
- an evaluation quantity eg, a measure that evaluates the presence of oxygen
- a two-dimensional representation of the study area in which each pixel depends on the associated optical coding for example, a color coding, which represents the presence of oxygen in a color gamut of 0 to 100%
- the data processing device is further configured to display, in addition to one or more optically encoded forms of analysis images obtained from the hyperspectral image on the display device, a representation of the optical color image of the examination region recorded by the second camera sensor.
- the dispersive element of the spectrometer is a grating.
- a blazed grating optimized for dispersing the dispersed light in the wavelength range of 500 to 1000 nm concentrated in a predetermined angular range and that the blazed grating is a reflection or transmission grating with an asymmetric sawtooth shaped surface or a holographic grating.
- a VPH (Volume Phase Holographic Grating) grating as Blaze grating. The reason for the preferable use of blaze gratings is as follows.
- Blaze lattice Blaze gratings are optimized to bend the light only in a certain direction and thus for a given wavelength range mainly in a certain order. As a result, a camera sensor can be positioned in the optimized angular range and there only needs to cover a relatively small solid angle range.
- the first blazed gratings included reflection gratings with asymmetrical sawtooth surface shapes, with the sawtooth edges as individual mirrors each oriented to reflect the light in the direction of the desired diffraction order.
- VPH gratings are transmission gratings in which a transparent material is sandwiched between two glass or plastic disks. In the transparent material, a desired pattern of varying refractive index is produced, for example, by holographic exposure and structural changes of the material thereby effected.
- An example of such a blaze grating is in the article " Volume-Phase Holographic Gratings and the Efficienty of Free Simple Volume-Phase Holographic Gratings ", Samuel C.
- the device is set up so that the data processing device has access to pre-measured and stored spectra of pure chemical substances present in the body (eg oxygen, hemoglobin, fat etc.) and is set up according to a method of multivariate statistics to compose the measured spectra of a hyperspectral image from the portions of the stored spectra of the chemical substances and to determine therefrom information about chemical properties of picture elements.
- spectra of pure chemical substances present in the body eg oxygen, hemoglobin, fat etc.
- Many multivariate statistical analysis methods are known for analyzing spectral measurement data, for example, correlation, regression, analysis of variance, discriminant analysis, and principal component and factor analysis.
- the data processing device is preferably set up to work with the second derivatives of the recorded spectra.
- the second derivatives of the spectra show the characteristic features of the chemical to be investigated Substances are significantly more prominent, whereas uniform background or parasitic effects in the second derivatives are largely eliminated.
- the present invention provides a method for recording a hyperspectral image of an examination area of a body, in which the examination area is irradiated with a light source with light having a spectral distribution suitable for the desired spectroscopic analysis, with an input objective an image of the examination area in one Image plane is generated, with a spectrometer, which has a slot-shaped aperture arranged in the image plane to hide a slit-shaped area of the image of the study area, a dispersive element, preferably a grid, which is constructed and arranged so that the dispersive fanning of the through the aperture passing light through the grating in a direction different from the longitudinal direction of the shutter, and having a camera sensor which is constructed and arranged to form a diffraction pattern of the dispersive element with the longitudinal direction of the Aperture in a first direction and the dispersive spectral fanning of the light in a different direction from the first on its camera sensor surface is recorded, a plurality of spectra of pixels along the longitudinal
- This backlight is usually daylight, light from fluorescent lamps, halogen lamps or other eg on white light LED based lighting.
- This backlight needs to be considered precisely in two ways. On the one hand, it can vary during data acquisition and, on the other hand, it is usually different in its spectrum from the light source used to record the spectra. Thus, it is important that at least the individual spectra of a line of the hyperspectral image be captured in an exposure time in which the backlight does not change.
- calibration can be done by using image markers in the image, or by taking a dark image before and after the sequence recording to record the hyperspectral image. Furthermore, using the second derivative of the spectra for chemometric analysis, constant and linear spectral components of backlighting can be largely eliminated.
- CMOS image sensors for example, highly integrated megapixel CMOS image sensors can be used.
- CMOS image sensors are available in a color sensor and a monochrome design, which usually differ only by an additional color filter layer over the sensor array.
- the array structure and the entire electronic circuitry are equivalent in both embodiments. Since the geometric arrangement is the same, the data from the color image plane and the hyperspectral image plane can also be superimposed very well. This is especially true when the imaging optics of the imaging spectrometer unit provides a 1: 1 map, i. when the optical image taken by the second camera sensor and the hyperspectral image taken by the first camera sensor are the same size.
- grouping of pixels (binning) and skipping of pixels (skipping) can be activated.
- the spatial and spectral resolution of the hyperspectral image can be easily reduced, resulting in faster acquisition of the hyperspectral images and thus greatly increasing the generation frequency of the very large three-dimensional data arrays of the hyperspectral image.
- the resolution of the hyperspectral image in the direction Each axis can be reduced by a factor of 4, which reduces the amount of data by a factor of 64 and thus allows a large increase in the frequency.
- the intermediate areas to the high-resolution color image can be interpolated again at a reduced image resolution.
- the sensors often perform the analog amplification and also the A / D conversion of the signals with integrated circuits, the brightness of the color images and the hyperspectral images can be well adjusted by simple parameterization of the amplification and the exposure time.
- the diffraction pattern of the aperture is e.g. so on the camera sensor that the longitudinal extent of the aperture corresponds to the X direction and the dispersive fanning takes place perpendicular thereto.
- each column of the camera sensor corresponds to one pixel (or one aperture length element) of the light passing through the aperture, the spectrum of which extends in the Y direction along a column of the camera sensor.
- Each column then forms an independently measured spectrum.
- Each spectrum is assigned a location along the longitudinal extent of the aperture. In this way, a slot-shaped region of the image of the examination area defined by the diaphragm is recorded spectrally resolved.
- the dispersive fanning of the light passing through the aperture through the grating need not be perpendicular to the longitudinal direction of the aperture.
- any other angle different from 0 and 180 ° between the longitudinal direction and the direction of the spectral fanning may also be present; in this case stands the ⁇ -axis (direction of spectral fanning) at just this angle to the longitudinal direction of the aperture on the camera sensor.
- Each point on the camera sensor can then be unambiguously assigned a value pair in the (oblique) coordinate system of the ⁇ -axis and the location in the longitudinal direction of the diaphragm.
- diaphragm is to be understood here as meaning all optical means which hide the image except for an elongated, strip-shaped region of emergent light, wherein the strip-shaped region does not necessarily have to be continuous in the longitudinal direction, but is also composed of a row-shaped sequence of individual separate image elements can be. Also, the elongate strip-shaped area does not necessarily have to be linear.
- the spectra are used in the analysis in the form of their white-normalized raw absorption spectra and additionally their second derivatives.
- uptake is performed in relative bulk intensities.
- the formation of the second derivative of the spectra makes the recordings independent of device-specific influences, such as Illumination fluctuations or even non-specific broadband absorption differences that may be present in the body tissue of different people. Furthermore, the influence of specular surface reflections is minimized as they disappear in the second derivatives.
- the light source may be conventionally equipped with a thermal light source (eg halogen lamp). But preferred is a light source based on LEDs.
- a thermal light source eg halogen lamp
- Spectral range generates the required continuous radiation. It is important that the radiation is as intense as possible, broadband, temperature-stable and can be generated in the fastest possible pulses, so that only during the exposure time of the sensor light must be irradiated on the object. Since halogen lamps, apart from the broadband lighting, can meet these criteria only conditionally, the LED variants for the present invention are clearly preferable.
- the radiation input to the body in the study area must be kept as low as possible.
- the emission spectrum of the light source should be adapted as possible to the recording spectrum of the hyperspectral camera, ie the emission spectrum (a thermal radiator emits much more in the long-wave range) should match the efficiency curves of grid and camera sensor;
- the absorption curve of the body part for example skin, which absorbs a lot in the range 500-600 nm and little in the range 600-950 nm, can also be taken into account.
- the light source is preferably provided with optical elements that focus the light of the light source geometrically on the study area. Furthermore, other elements such as polarizers or filters can be used to optimize the illumination of the study area.
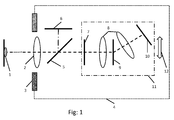
- Fig. 1 shows a schematic diagram of the structure of a device according to the invention.
- the body part or object to be examined is designated 1. This may be, for example, a human body part or organ, but in principle also any other object or material sample.
- the image of the study area is imaged with an input lens 2 in an image plane.
- the light sources 3 arranged on both sides of the input lens 2 generate light including the spectral range for a color camera and for absorption spectroscopy. In the specific case of fluorescence spectroscopy, the light sources must be tuned so that they can excite the fluorescence in the sample.
- the light sources 3 are preferably integrated in a light-tight housing 4 of the entire device.
- This beam splitter 5 can be, for example, a partially coated cutting disk or a prism. It is important that visible light to generate the color image on the second camera sensor 6 is coupled out of the beam path. It is useful to consider that advantageously only a small proportion of the radiation is coupled out by the beam splitter 5, since the spectrometer spectrally splits the available light and therefore a much higher proportion of radiation is required in the beam path to the imaging spectrometer unit.
- the second, not decoupled or direct beam path hits in the spectrometer 11, first on a slit-shaped aperture 7, which can pass an elongated, strip-shaped area of the light.
- This slit-shaped diaphragm 7 is arranged exactly like the second camera sensor 6 in the image plane of the input lens 2.
- the slit-shaped diaphragm is arranged so that its longitudinal direction in the illustration of Fig. 1 is perpendicular to the figure plane.
- a slot-shaped region is selected from the image of the examination region generated by the input objective 2.
- the strip-shaped region selected by the diaphragm 7 is thrown onto a grating 9 via an imaging optical element (eg lens or achromat) 8.
- an imaging optical element eg lens or achromat
- This grating 9 is constructed and arranged such that the dispersive, wavelength-dependent fanning out of the diffracted light takes place in a direction which is different from the longitudinal extent of the diaphragm 7 and preferably perpendicular thereto.
- Via a further imaging optical element 8 the diffraction image of the diaphragm is then thrown onto a camera sensor 10.
- each camera sensor row then corresponds to one picture element along the longitudinal direction of the slit-shaped aperture, and the spectral fanning of this picture element is present along the camera sensor line.
- the successive camera sensor lines detect a successive sequence of spectra which correspond to a sequence of picture elements along the longitudinal extent of the slit-shaped aperture 7 and thus to the picture elements of the image of the input objective on a strip.
- the slit-shaped diaphragm in the image plane of the input objective 2 can sequentially scan the examination region and thus acquire the data for the hyperspectral image. Since the image of the input objective is very small and corresponds to the edge length of the camera sensor 6, the imaging spectrometer 11 has to be traversed overall only over a very short path length, which is indicated by the double arrow 12. Since the spectrometer 11 thus only has to be moved by a very short path length in each step, only slight mechanical accelerations are associated therewith.
- the controlled method of the spectrometer 11 is performed by a drive means with conventional miniaturized electric motors and controls for these, which in turn are controlled by a data processing device.
- the slit-shaped diaphragm selects, for example, a 15-30 ⁇ m wide band from the image of the examination area.
- the spectrometer may, for example, comprise two objectives or achromatic arrays 8.
- the first objective 8 in the spectrometer forms the slit-shaped aperture 7 at infinity.
- Behind the input lens 2 is the grating 9, which causes a dispersive splitting of the light in the direction, for example, perpendicular to the longitudinal extent of the slit-shaped aperture.
- the second lens 8 of the spectrometer makes again the image of the infinite on the real image, which is now spectrally fanned out by the intervening grid and is recorded by the camera sensor 10.
- the camera sensors 6 and 10 are preferably high-resolution, two-dimensional CMOS digital camera sensors.
- the second camera sensor 6 is provided as a color camera sensor with a color filter array, while the camera sensor 10 is a monochrome sensor.
- Each of the spectra then corresponds to the spectrum of a picture element of the aperture, i. one can think of the slit-shaped aperture 7 divided into 1,000 picture elements along its length, the light of each of these picture elements being then imaged by the grating onto a line of the camera sensor.
- the camera sensor can repeat the image acquisition with full sensor utilization about 50 times per second.
- the generation of a maximum resolved spectral image would take about 20 seconds.
- only small spectral ranges are used for the analysis. This can be exploited by using the partial image recording possible with the camera sensors in order to accelerate the recording.
- regions of interest ROI
- the inland or skipping method can reduce the resolution, allowing hyperspectral images to be captured in 1 second or less recording times.
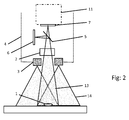
- Fig. 2 shows a partial view of the device Fig. 1 in a schematic schematic diagram. Shown here are additionally the schematic beam paths for the illumination and the imaging.
- the lighting unit is constructed with light sources 3 so that the light sources are arranged around the lens 2. Depending on the opening angle (lens with fixed focal length) or opening angle range (zoom lens), the lighting unit is provided with light sources optically beam-forming elements, so that the study area is illuminated as homogeneously as possible (illumination area 14).
- the object or the body 1 is imaged in the imaging area 13 via the input lens 2 with the image plane onto the color camera sensor 6 and the diaphragm 7 of the spectrometer 11 such that the image of the examination area 13 covers the entire color camera sensor 6 and the camera sensor 10 (FIG. Fig. 1 ) covered.
- Fig. 3 shows a block diagram of a preferred embodiment of the device.
- a data processing device takes over the entire control, data synchronization and data readout and buffering.
- the data processing device adopts the parameterization of the color camera sensor 6, the digital data acquisition of the color camera sensor 6, the parameterization of the monochrome camera sensor (6) of the hyperspectral recording device (parameterization is here used to set the registers of the camera sensor, gain, skipping, binning, exposure time, ROI, pixel rate etc.), the data acquisition of the camera sensor 6, the synchronized control of the mechanical drive device and the control of the light sources 3.
- the data processing device can optionally also perform a data reduction, data buffering or data preprocessing.
- the data received by the camera sensor 10 and the second camera sensor 6 are collected and stored by the data processing device. Further, the data processing device is adapted to drive means to drive the spectrometer 11 after each recording of a the diaphragm 7 selected to move slit-shaped area of the image of the study area by a distance corresponding to the slit width of the diaphragm.
- the spectrometer can be suspended on a linear guide or mounted on rails.
- the drive devices can be realized by servomotors or other controllable actuators.
- the data processing device is set up to actuate this drive device after each recording of a slit-shaped region of the image of the examination region in order to displace the spectrometer by a distance in the second direction different from the longitudinal direction of the diaphragm, which can correspond, for example, to the slit width of the diaphragm 7 (the step size can also be smaller than the gap width and correspond to the pixel size).
- the data processing device stores the relative position in the direction y in which the spectrometer has moved in the image plane, so that each spectrum is assigned a pair of spatial coordinates x, y of the image of the examination region.
- a data preprocessing of the hyperspectral images is carried out and a chemometry-based evaluation of the hyperspectral images takes place. Due to the very high data flow, it may be useful to provide in the data processing device in addition to conventional units such as microprocessors and a PC additional, possibly integrated into the PC unit special processors (eg graphics processors) in the specific processes such as graphics generation, coordinate transformations, forming strains, and Chemometric algorithms and the like are outsourced. Furthermore, a work-up and optimization of the color images can be done. These image data records can then be displayed on a monitor, stored on a storage medium or transferred to another via another external data connection Systems are passed.
- the data processing device does not have to be combined in one unit, but can also be implemented by distributed processors and computers.
- the images may be displayed, for example, in such a way that, in addition to the colored representation of the examination area, the optical color camera sensor records one or more analysis representations obtained from the hyperspectral image.
- analysis representations may e.g. be two-dimensional representations of the study area, in which the concentrations of certain chemical substances encoded are shown spatially resolved, e.g. the concentration of a particular chemical substance encodes in a color scale of 0 to 100% over the study area.
- Fig. 4 shows the single spectra of pure, oxygenated hemoglobin, deoxygenated hemoglobin, water, the skin pigment melanin, fat and typical scattering properties of human tissue.
- the plot of absorption in the Y-axis is logarithmic. The presentation should mainly show the typical curves of the absorption curves and the characteristic absorption bands. Since the concentrations in hyperspectral images of the individual chemical components can vary by orders of magnitude and unknown substances contribute to the spectra, in practice a combined chemometric evaluation is based on the adsorption spectra and on the second derivatives of the spectra d 2 (I ( ⁇ ) / I in (FIG. ⁇ )) / d ⁇ 2 makes sense in practice.
- Specific spectra of pure substances can be adapted beforehand to the measured spectra, the adaptation to the spectra itself being able to take place in their second derivatives or combined both in spectra and in their second derivatives.
- a multivariate statistical analysis method is used, In order to determine the contributions of the individual substances to the recorded spectra and in particular to determine the relative contribution of oxygenated hemoglobin to deoxygenated hemoglobin (oxygenation), the total hemoglobin concentration and concentrations of the other substances.
- the measured spectrum is represented as a linear combination of the individual spectra of the pure substances, and the coefficients of the individual spectra are determined in that linear combination of the individual spectra which provides the best match with the measured spectrum.
- the individual spectra of all substances which may be relevant in the wavelength range investigated should be measured and stored in advance.
- the second derivatives of the spectra it is only necessary to consider those substances whose spectra in the second derivative are different in the wavelength range in question.
- melanin and tissue scattering need not be considered in the spectral range of 500 nm to 850 nm, which is preferably considered here, since they have no significant slope changes in the spectra and are therefore approximately 0 in the second derivative of the spectra.
- the temperature dependency of the water spectrum must be taken into account, ie the individual spectra should be recorded at a temperature corresponding to the body temperature.
- Fig. 5 shows an exemplary emission spectrum of a broadband LED.
- This emission spectrum was optimized according to the following criteria.
- the spectrum must contain the spectral ranges for color imaging (460 nm blue, 530 nm green and 620 nm red).
- the emission spectrum was designed opposite to the typical absorption of the skin. So much radiation is emitted in the spectral range from 500 to 600 nm, where the absorption by the melanin of the skin and hemoglobin are very high. So finds an optimized illumination of the study area of a human body part for taking a Hyperspectral image instead.
Landscapes
- Physics & Mathematics (AREA)
- Spectroscopy & Molecular Physics (AREA)
- Health & Medical Sciences (AREA)
- Life Sciences & Earth Sciences (AREA)
- General Physics & Mathematics (AREA)
- Surgery (AREA)
- Engineering & Computer Science (AREA)
- Pathology (AREA)
- Heart & Thoracic Surgery (AREA)
- Optics & Photonics (AREA)
- Biophysics (AREA)
- Radiology & Medical Imaging (AREA)
- Veterinary Medicine (AREA)
- Biomedical Technology (AREA)
- Nuclear Medicine, Radiotherapy & Molecular Imaging (AREA)
- Medical Informatics (AREA)
- Molecular Biology (AREA)
- Animal Behavior & Ethology (AREA)
- General Health & Medical Sciences (AREA)
- Public Health (AREA)
- Human Computer Interaction (AREA)
- Investigating Or Analysing Materials By Optical Means (AREA)
- Spectrometry And Color Measurement (AREA)
Applications Claiming Priority (1)
| Application Number | Priority Date | Filing Date | Title |
|---|---|---|---|
| DE102013217379.2A DE102013217379A1 (de) | 2013-08-30 | 2013-08-30 | Vorrichtung und Verfahren zur Aufnahme eines Hyperspektralbildes |
Publications (2)
| Publication Number | Publication Date |
|---|---|
| EP2851662A2 true EP2851662A2 (fr) | 2015-03-25 |
| EP2851662A3 EP2851662A3 (fr) | 2015-07-08 |
Family
ID=51352407
Family Applications (1)
| Application Number | Title | Priority Date | Filing Date |
|---|---|---|---|
| EP14180707.3A Withdrawn EP2851662A3 (fr) | 2013-08-30 | 2014-08-12 | Dispositif et procédé d'enregistrement d'une image hyperspectrale |
Country Status (2)
| Country | Link |
|---|---|
| EP (1) | EP2851662A3 (fr) |
| DE (2) | DE102013217379A1 (fr) |
Cited By (10)
| Publication number | Priority date | Publication date | Assignee | Title |
|---|---|---|---|---|
| WO2018010736A1 (fr) | 2016-07-15 | 2018-01-18 | Tailorlux Gmbh | Procédé d'acquisition et d'analyse d'une image hyperspectrale |
| CN111561999A (zh) * | 2019-02-14 | 2020-08-21 | 绍兴图聚光电科技有限公司 | 模块化快速显微高光谱成像检测仪技术领域 |
| CN113218628A (zh) * | 2021-04-21 | 2021-08-06 | 厦门大学 | 一种微型发光器件空间光色分布检测系统及其检测方法 |
| CN113532649A (zh) * | 2021-07-28 | 2021-10-22 | 北京印刷学院 | 一种印刷颜色测定系统及方法 |
| WO2021245374A1 (fr) | 2020-06-03 | 2021-12-09 | King's College London | Procédé et système conjoint de démosaïquage et d'estimation de signature spectrale |
| CN115356272A (zh) * | 2022-08-16 | 2022-11-18 | 杭州新叶光电工程技术有限公司 | 文物图像采集及评估装置、方法及标定方法 |
| EP4093018A1 (fr) | 2021-05-19 | 2022-11-23 | Karl Storz SE & Co. KG | Procédé d'imagerie médicale et dispositif d'imagerie médicale destiné |
| WO2023094351A1 (fr) * | 2021-11-24 | 2023-06-01 | Karl Storz Se & Co. Kg | Dispositif d'imagerie médicale et procédé d'étalonnage d'un dispositif d'imagerie médicale |
| CN119880820A (zh) * | 2025-01-06 | 2025-04-25 | 南京大学 | 基于针孔相机的非成像高光谱观测足迹定位与可视化方法 |
| CN120352026A (zh) * | 2025-06-24 | 2025-07-22 | 杭州光视精密技术有限公司 | 一种基于防护箱的光谱采集仪及视场自适应调节方法 |
Families Citing this family (29)
| Publication number | Priority date | Publication date | Assignee | Title |
|---|---|---|---|---|
| DE102015217091B4 (de) * | 2015-09-07 | 2017-05-11 | Fraunhofer-Gesellschaft zur Förderung der angewandten Forschung e.V | Anordnung zur Bestimmung der erreichbaren Haftfestigkeit vor Ausbildung einer stoffschlüssigen Verbindung an einer Oberfläche eines Fügepartners |
| DE102017215158B4 (de) * | 2017-08-30 | 2020-10-15 | Carl Zeiss Meditec Ag | Detektionssystem |
| DE102020201267A1 (de) | 2020-02-03 | 2021-08-05 | Robert Bosch Gesellschaft mit beschränkter Haftung | Akkuschnittstelle, Verbraucher mit einer Akkuschnittstelle und System aufweisend einen Verbraucher und einen Akkupack |
| DE102022114606A1 (de) | 2022-06-10 | 2023-12-21 | Karl Storz Se & Co. Kg | Medizinische Bildgebungsvorrichtung, Verfahren zum Betrieb einer solchen und Verfahren zur medizinischen Bildgebung |
| DE102022117578A1 (de) | 2022-07-14 | 2024-01-25 | Karl Storz Se & Co. Kg | Beleuchtungsvorrichtung und Bildgebungsvorrichtung mit einer Beleuchtungsvorrichtung |
| DE102022117580A1 (de) | 2022-07-27 | 2024-02-01 | Karl Storz Se & Co. Kg | Medizinische Bildgebungsvorrichtung, medizinisches Bildgebungssystem und Verfahren zum Betrieb einer medizinischen Bildgebungsvorrichtung |
| WO2024013303A1 (fr) | 2022-07-14 | 2024-01-18 | Karl Storz Se & Co. Kg | Dispositif d'éclairage, dispositif d'imagerie comprenant un dispositif d'éclairage, système d'imagerie, procédé de génération de lumière d'éclairage et procédé de fonctionnement d'un dispositif d'imagerie |
| DE102022117581A1 (de) | 2022-07-14 | 2024-01-25 | Karl Storz Se & Co. Kg | Beleuchtungsvorrichtung, Bildgebungsvorrichtung mit einer Beleuchtungsvorrichtung, Verfahren zur Erzeugung von Beleuchtungslicht und Verfahren zum Betrieb einer Bildgebungsvorrichtung |
| EP4581420A1 (fr) | 2022-08-31 | 2025-07-09 | Karl Storz SE & Co. KG | Dispositif d'endoscope, ensemble paire de correction, endoscope et système d'imagerie |
| DE102022123881A1 (de) | 2022-09-19 | 2024-03-21 | Karl Storz Se & Co. Kg | Medizinische Bildgebungsvorrichtung, medizinisches System und Verfahren zur Farbanpassung einer medizinischen Bildgebungsvorrichtung |
| DE102022125852A1 (de) | 2022-10-06 | 2024-04-11 | Karl Storz Se & Co. Kg | Medizinische Bildgebungsvorrichtung und Verfahren zur medizinischen Bildgebung |
| DE102022126995A1 (de) | 2022-10-14 | 2024-04-25 | Karl Storz Se & Co. Kg | Medizinische Bildgebungsvorrichtung und Verfahren zur medizinischen Bildgebung |
| DE102022129229B4 (de) | 2022-11-04 | 2024-09-12 | Karl Storz Se & Co. Kg | Strahlkombinierer und Beleuchtungsvorrichtung |
| DE102022129909A1 (de) | 2022-11-11 | 2024-05-16 | Karl Storz Se & Co. Kg | Beleuchtungsvorrichtung und Bildgebungsvorrichtung mit einer Beleuchtungsvorrichtung |
| DE102022133966A1 (de) | 2022-12-19 | 2024-06-20 | Karl Storz Se & Co. Kg | Beleuchtungsvorrichtung, Bildgebungsvorrichtung und Verfahren zum Betrieb dieser |
| DE102022135045A1 (de) * | 2022-12-30 | 2024-07-11 | Karl Storz Se & Co. Kg | Medizinisches Bildgebungssystem und Verfahren zum Betreiben eines medizinischen Bildgebungssystems |
| DE102023101965A1 (de) | 2023-01-26 | 2024-08-01 | Karl Storz Se & Co. Kg | Medizinische Bildgebungsvorrichtung, Endoskopvorrichtung, Endoskop und Verfahren zur Bildgebung |
| DE102023101964A1 (de) | 2023-01-26 | 2024-08-01 | Karl Storz Se & Co. Kg | Medizinische Bildgebungsvorrichtung, Endoskopvorrichtung, Endoskop und Verfahren zur Herstellung einer medizinischen Bildgebungsvorrichtung |
| DE102023103176A1 (de) | 2023-02-09 | 2024-08-14 | Karl Storz Se & Co. Kg | Medizinische Bildgebungsvorrichtung, Endoskopvorrichtung, Endoskop und Verfahren zur medizinischen Bildgebung |
| DE102023122118A1 (de) | 2023-08-17 | 2025-02-20 | Karl Storz Se & Co. Kg | Medizinische Bildgebungsvorrichtung, medizinisches Bildgebungsgerät, medizinisches System und Verfahren zur medizinischen Bildgebung |
| DE102023131464A1 (de) | 2023-11-13 | 2025-05-15 | Fluidect Gmbh | Detektionssystem und Verfahren zum Erfassen einer elektromagnetischen Emission von Mikropartikeln |
| DE102023133301A1 (de) | 2023-11-28 | 2025-05-28 | Karl Storz Se & Co. Kg | Beleuchtungsvorrichtung und System mit einer Beleuchtungsvorrichtung und einem Bildgebungsinstrument |
| DE102023134457A1 (de) | 2023-12-08 | 2025-06-12 | Karl Storz Se & Co. Kg | Bildgebungsvorrichtung, insbesondere endoskopische, exoskopische und/oder mikroskopische Bildgebungsvorrichtung |
| DE102023134893B3 (de) | 2023-12-13 | 2025-03-27 | Karl Storz Se & Co. Kg | Endoskopvorrichtung, Endoskop und medizinisches System zur medizinischen Bildgebung |
| DE102023135636A1 (de) | 2023-12-18 | 2025-06-18 | Karl Storz Se & Co. Kg | Bildgebungsvorrichtung, insbesondere endoskopische, exoskopische und/oder mikroskopische Bildgebungsvorrichtung |
| DE102024103171A1 (de) | 2024-02-05 | 2025-08-07 | Karl Storz Se & Co. Kg | Beleuchtungsvorrichtung, insbesondere für ein medizinisches Bildgebungsgerät wie ein Endoskop, Exoskop und/oder Mikroskop |
| DE102024105828A1 (de) | 2024-02-29 | 2025-09-04 | Karl Storz Se & Co. Kg | Beleuchtungsvorrichtung, insbesondere für ein medizinisches Bildgebungsgerät wie ein Endoskop, Exoskop und/oder Mikroskop |
| DE102024114647A1 (de) | 2024-05-24 | 2025-11-27 | Karl Storz Se & Co. Kg | Bildgebungsvorrichtung, System und Verfahren zur Bildgebung |
| DE102024125695A1 (de) | 2024-09-06 | 2026-03-12 | Karl Storz Se & Co. Kg | Beleuchtungsvorrichtung, insbesondere für ein medizinisches Bildgebungsgerät wie ein Endoskop, Exoskop und/oder Mikroskop |
Citations (5)
| Publication number | Priority date | Publication date | Assignee | Title |
|---|---|---|---|---|
| US6640132B1 (en) | 1999-11-17 | 2003-10-28 | Hypermed, Inc. | Forensic hyperspectral apparatus and method |
| US6992809B1 (en) | 2005-02-02 | 2006-01-31 | Chemimage Corporation | Multi-conjugate liquid crystal tunable filter |
| WO2008124542A1 (fr) * | 2007-04-03 | 2008-10-16 | Mutoh Industries Ltd. | Spectrophotomètre et procédé |
| US20120061586A1 (en) | 2010-09-10 | 2012-03-15 | Haibo Yao | Method and detection system for detection of aflatoxin in corn with fluorescence spectra |
| US20120105845A1 (en) | 2010-11-01 | 2012-05-03 | Specim, Spectral Imaging Oy Ltd | Imaging Spectrometer |
Family Cites Families (5)
| Publication number | Priority date | Publication date | Assignee | Title |
|---|---|---|---|---|
| GB2254417A (en) * | 1991-04-05 | 1992-10-07 | Bijan Jouza | Photodynamic laser detection for cancer diagnosis |
| US7127372B2 (en) * | 2005-02-24 | 2006-10-24 | Itt Manufacturing Enterprises, Inc. | Retro-regression residual remediation for spectral/signal identification |
| US20080285027A1 (en) * | 2007-05-17 | 2008-11-20 | Emerging Technologies, Llc (A Mississippi Company) | Hyperspectral / Multispectral Dispersive System with Scanning Entry Slit Moving Across Lens Focus Plane |
| JP5099262B2 (ja) * | 2009-05-29 | 2012-12-19 | トヨタ自動車株式会社 | スペクトル測定装置 |
| CN101813520B (zh) * | 2009-12-23 | 2013-01-09 | 杭州远方光电信息股份有限公司 | 一种二维光谱测量装置 |
-
2013
- 2013-08-30 DE DE102013217379.2A patent/DE102013217379A1/de not_active Withdrawn
-
2014
- 2014-08-12 DE DE202014010558.8U patent/DE202014010558U1/de not_active Expired - Lifetime
- 2014-08-12 EP EP14180707.3A patent/EP2851662A3/fr not_active Withdrawn
Patent Citations (5)
| Publication number | Priority date | Publication date | Assignee | Title |
|---|---|---|---|---|
| US6640132B1 (en) | 1999-11-17 | 2003-10-28 | Hypermed, Inc. | Forensic hyperspectral apparatus and method |
| US6992809B1 (en) | 2005-02-02 | 2006-01-31 | Chemimage Corporation | Multi-conjugate liquid crystal tunable filter |
| WO2008124542A1 (fr) * | 2007-04-03 | 2008-10-16 | Mutoh Industries Ltd. | Spectrophotomètre et procédé |
| US20120061586A1 (en) | 2010-09-10 | 2012-03-15 | Haibo Yao | Method and detection system for detection of aflatoxin in corn with fluorescence spectra |
| US20120105845A1 (en) | 2010-11-01 | 2012-05-03 | Specim, Spectral Imaging Oy Ltd | Imaging Spectrometer |
Non-Patent Citations (5)
| Title |
|---|
| H. AKBARI ET AL.: "Hyperspectral Imaging and Quantitative Analysis for Prostate Cancer Detection", J. BIOMED OPT., vol. 17, no. 7, July 2012 (2012-07-01) |
| M. SON E: "Fluorence Spectroscopy for Rapid Detection and Classification of Bacterial Pathogens", APPLIED SPECTROSCOPY, vol. 63, no. 11, 2009, pages 1251 - 1255, XP002576866 |
| S. PANASYUK ET AL.: "Medical Hyperspectral Imaging to Facilitate Residual Tumor Identification During Surgery", CANCER BIOLOGY & THERAPY, vol. 6, no. 3, March 2007 (2007-03-01), pages 439 - 446 |
| SAM UEL C. BARDEN ET AL.: "Volume-Phase Holographic Gratings and the Efficienty of Free Simple Volume-Phase Holographic Gratings", vol. 112, June 2000, OF THE ESTRONOMICAL SOCIETY OF THE PASSIFIC, pages: 809 - 820 |
| W. JON ET AL.: "Microbial Biofilm Detection on Food Contact Surfaces by Macro-Scale Fluorescence Imaging", JOURNAL OF FOOD ENGINEERING, vol. 99, 2010, pages 314 - 322, XP027013959 |
Cited By (16)
| Publication number | Priority date | Publication date | Assignee | Title |
|---|---|---|---|---|
| DE102016113102A1 (de) | 2016-07-15 | 2018-01-18 | Tailorlux Gmbh | Vorrichtung und Verfahren zur Aufnahme und Analyse eines Hyperspektralbildes |
| DE102016113102B4 (de) * | 2016-07-15 | 2021-03-18 | Tailorlux Gmbh | Verfahren zur Aufnahme und Analyse eines Hyperspektralbildes |
| WO2018010736A1 (fr) | 2016-07-15 | 2018-01-18 | Tailorlux Gmbh | Procédé d'acquisition et d'analyse d'une image hyperspectrale |
| CN111561999A (zh) * | 2019-02-14 | 2020-08-21 | 绍兴图聚光电科技有限公司 | 模块化快速显微高光谱成像检测仪技术领域 |
| WO2021245374A1 (fr) | 2020-06-03 | 2021-12-09 | King's College London | Procédé et système conjoint de démosaïquage et d'estimation de signature spectrale |
| CN113218628A (zh) * | 2021-04-21 | 2021-08-06 | 厦门大学 | 一种微型发光器件空间光色分布检测系统及其检测方法 |
| EP4093018A1 (fr) | 2021-05-19 | 2022-11-23 | Karl Storz SE & Co. KG | Procédé d'imagerie médicale et dispositif d'imagerie médicale destiné |
| DE102021112970A1 (de) | 2021-05-19 | 2022-11-24 | Karl Storz Se & Co. Kg | Verfahren zur medizinischen Bildgebung und medizinische Bildgebungsvorrichtung zur Ausführung dessen |
| EP4093018B1 (fr) * | 2021-05-19 | 2025-12-31 | Karl Storz SE & Co. KG | Procédé d'imagerie médicale et dispositif d'imagerie médicale destiné |
| CN113532649A (zh) * | 2021-07-28 | 2021-10-22 | 北京印刷学院 | 一种印刷颜色测定系统及方法 |
| CN113532649B (zh) * | 2021-07-28 | 2023-10-20 | 北京印刷学院 | 一种印刷颜色测定系统及方法 |
| WO2023094351A1 (fr) * | 2021-11-24 | 2023-06-01 | Karl Storz Se & Co. Kg | Dispositif d'imagerie médicale et procédé d'étalonnage d'un dispositif d'imagerie médicale |
| CN115356272A (zh) * | 2022-08-16 | 2022-11-18 | 杭州新叶光电工程技术有限公司 | 文物图像采集及评估装置、方法及标定方法 |
| CN119880820A (zh) * | 2025-01-06 | 2025-04-25 | 南京大学 | 基于针孔相机的非成像高光谱观测足迹定位与可视化方法 |
| CN119880820B (zh) * | 2025-01-06 | 2025-09-26 | 南京大学 | 基于针孔相机的非成像高光谱观测足迹定位与可视化方法 |
| CN120352026A (zh) * | 2025-06-24 | 2025-07-22 | 杭州光视精密技术有限公司 | 一种基于防护箱的光谱采集仪及视场自适应调节方法 |
Also Published As
| Publication number | Publication date |
|---|---|
| EP2851662A3 (fr) | 2015-07-08 |
| DE102013217379A1 (de) | 2015-03-05 |
| DE202014010558U1 (de) | 2015-12-22 |
Similar Documents
| Publication | Publication Date | Title |
|---|---|---|
| DE202014010558U1 (de) | Vorrichtung zur Aufnahme eines Hyperspektralbildes | |
| DE19850350C1 (de) | Verfahren und Vorrichtung zur Erzeugung von Daten für die Diagnose des Schädigungsgrades von Hautgewebe eines Patienten | |
| EP0555645B1 (fr) | Dispositif pour détecter la carie dentaire | |
| EP2584956B1 (fr) | Dispositif et procédé de reconnaissance et de surveillance de valeurs sanguines physiologiques | |
| EP2508841B1 (fr) | Procédé et système destinés à la tomographie de cohérence optique | |
| DE60014702T2 (de) | Tragbares system zur ermittlung von hautanomalien | |
| DE102015107148A1 (de) | Mikroskop zur molekülspektroskopischen Analyse | |
| EP4652490B1 (fr) | Ensemble de visualisation pour microchirurgie | |
| DE102022106599A1 (de) | Verfahren zur identifizierung der zusammensetzung eines anatomischen ziels | |
| DE102021130790B4 (de) | Medizinische Bildgebungsvorrichtung sowie Verfahren zum Kalibrieren einer medizinischen Bildgebungsvorrichtung | |
| EP2508843B1 (fr) | Procédé et système destinés à la tomographie de cohérence optique | |
| DE112016005019B4 (de) | Endoskopsystem | |
| DE69934519T2 (de) | Verfahren zur diagnose proliferierender regionen und vorrichtung zur durchführung desselben | |
| DE102011115717A1 (de) | Handgehaltenes Fernglas mit Spektrometer | |
| EP3741290B1 (fr) | Dispositif d'imagerie de lésions cutanées | |
| WO2021110531A1 (fr) | Procédé et dispositif de détermination sans contact de variations de couleur et d'intensité dans le temps dans des objets | |
| EP2382916B1 (fr) | Dispositif et procédé de détermination de la teneur en graisses du corps humain | |
| WO2009018953A2 (fr) | Procédé et dispositif de détermination des conditions d'état d'un objet à étudier et de mesure de fluorescence sur l'œil | |
| DE112020001271T5 (de) | Verfahren und Vorrichtung zur Bestimmung oder Klassifizierung der Oberflächenfarbe von zumindest teilweise lichtdurchlässigen Materialien | |
| WO2014139830A1 (fr) | Procédé et dispositif de surveillance de fonctions vitales | |
| EP2399509A1 (fr) | Dispositif et procédé de reconnaissance et de surveillance de valeurs sanguines physiologiques | |
| AT505523B1 (de) | Verfahren und anordnung zur status-erfassung von hautgewebe | |
| DE102023122118A1 (de) | Medizinische Bildgebungsvorrichtung, medizinisches Bildgebungsgerät, medizinisches System und Verfahren zur medizinischen Bildgebung | |
| DE102022132844A1 (de) | Messsystem und messverfahren | |
| DE102022119578A1 (de) | Optische baugruppe zur detektion der vom auge reflektierten laserstrahlung |
Legal Events
| Date | Code | Title | Description |
|---|---|---|---|
| PUAI | Public reference made under article 153(3) epc to a published international application that has entered the european phase |
Free format text: ORIGINAL CODE: 0009012 |
|
| 17P | Request for examination filed |
Effective date: 20140812 |
|
| AK | Designated contracting states |
Kind code of ref document: A2 Designated state(s): AL AT BE BG CH CY CZ DE DK EE ES FI FR GB GR HR HU IE IS IT LI LT LU LV MC MK MT NL NO PL PT RO RS SE SI SK SM TR |
|
| AX | Request for extension of the european patent |
Extension state: BA ME |
|
| PUAL | Search report despatched |
Free format text: ORIGINAL CODE: 0009013 |
|
| AK | Designated contracting states |
Kind code of ref document: A3 Designated state(s): AL AT BE BG CH CY CZ DE DK EE ES FI FR GB GR HR HU IE IS IT LI LT LU LV MC MK MT NL NO PL PT RO RS SE SI SK SM TR |
|
| AX | Request for extension of the european patent |
Extension state: BA ME |
|
| RIC1 | Information provided on ipc code assigned before grant |
Ipc: G01J 3/06 20060101ALI20150529BHEP Ipc: G01J 3/02 20060101AFI20150529BHEP Ipc: G01J 3/28 20060101ALI20150529BHEP |
|
| R17P | Request for examination filed (corrected) |
Effective date: 20151117 |
|
| RBV | Designated contracting states (corrected) |
Designated state(s): AL AT BE BG CH CY CZ DE DK EE ES FI FR GB GR HR HU IE IS IT LI LT LU LV MC MK MT NL NO PL PT RO RS SE SI SK SM TR |
|
| RAP1 | Party data changed (applicant data changed or rights of an application transferred) |
Owner name: DIASPECTIVE VISION GMBH |
|
| STAA | Information on the status of an ep patent application or granted ep patent |
Free format text: STATUS: EXAMINATION IS IN PROGRESS |
|
| 17Q | First examination report despatched |
Effective date: 20190515 |
|
| STAA | Information on the status of an ep patent application or granted ep patent |
Free format text: STATUS: THE APPLICATION IS DEEMED TO BE WITHDRAWN |
|
| 18D | Application deemed to be withdrawn |
Effective date: 20220608 |