EP2876434A1 - Procédé permettant d'améliorer la reproductibilité des spectres de masse et procédé d'analyse quantitative l'utilisant - Google Patents
Procédé permettant d'améliorer la reproductibilité des spectres de masse et procédé d'analyse quantitative l'utilisant Download PDFInfo
- Publication number
- EP2876434A1 EP2876434A1 EP13820231.2A EP13820231A EP2876434A1 EP 2876434 A1 EP2876434 A1 EP 2876434A1 EP 13820231 A EP13820231 A EP 13820231A EP 2876434 A1 EP2876434 A1 EP 2876434A1
- Authority
- EP
- European Patent Office
- Prior art keywords
- analyte
- matrix
- spectra
- laser
- ion
- Prior art date
- Legal status (The legal status is an assumption and is not a legal conclusion. Google has not performed a legal analysis and makes no representation as to the accuracy of the status listed.)
- Withdrawn
Links
Images


Classifications
-
- H—ELECTRICITY
- H01—ELECTRIC ELEMENTS
- H01J—ELECTRIC DISCHARGE TUBES OR DISCHARGE LAMPS
- H01J49/00—Particle spectrometers or separator tubes
- H01J49/0009—Calibration of the apparatus
-
- H—ELECTRICITY
- H01—ELECTRIC ELEMENTS
- H01J—ELECTRIC DISCHARGE TUBES OR DISCHARGE LAMPS
- H01J49/00—Particle spectrometers or separator tubes
- H01J49/0027—Methods for using particle spectrometers
-
- H—ELECTRICITY
- H01—ELECTRIC ELEMENTS
- H01J—ELECTRIC DISCHARGE TUBES OR DISCHARGE LAMPS
- H01J49/00—Particle spectrometers or separator tubes
- H01J49/02—Details
- H01J49/10—Ion sources; Ion guns
- H01J49/16—Ion sources; Ion guns using surface ionisation, e.g. field-, thermionic- or photo-emission
- H01J49/161—Ion sources; Ion guns using surface ionisation, e.g. field-, thermionic- or photo-emission using photoionisation, e.g. by laser
- H01J49/164—Laser desorption/ionisation, e.g. matrix-assisted laser desorption/ionisation [MALDI]
Definitions
- the present invention relates to a method for improving reproducibility of mass spectrum and quantitative analysis method using the same. More particularly, the present invention is directed to a method for a method for improving reproducibility of a mass spectrum of a chemical compound, wherein temperatures of an ion generation reaction are controlled to be the same with each other, or wherein spectra of which temperature of ion generation reaction are the same with each other are selected from mass spectra of a chemical compound. In addition, the present invention is to directed to a method for measuring an equilibrium constant of a proton transfer reaction between a matrix and an analyte at a certain temperature, a method for obtaining a calibration curve for quantitative analysis, and a method for quantitative analysis of an analyte by using mass spectra.
- MALDI matrix-assisted laser desorption/ionization
- TOF time-of-flight
- a relative quantitative analysis without an internal standard is a MALDI mass spectrometry that utilizes a classification algorithm, based on the fact that the relative signal intensity of each component in MALDI spectrum is constant, in order to analyze reproducibly a MALDI mass spectrum.
- profile analysis has drawbacks that the design and performance of experiments are difficult.
- a relative quantitative analysis with an internal standard is MALDI mass spectrometry that quantifies analytes by measuring the relative ratio of the peak height or area of each analyte to that of the internal standard from MALDI spectra of a sample containing the internal standard.
- MALDI mass spectrometry quantifies analytes by measuring the relative ratio of the peak height or area of each analyte to that of the internal standard from MALDI spectra of a sample containing the internal standard.
- the absolute amount of the analytes cannot be measured by the relative quantitative analysis with an internal standard.
- an absolute quantitative analysis is MALDI mass spectrometry that obtains the absolute amount of an analyte by determining a calibration curve from a plurality of samples containing an internal standard with changing the amount of the analyte and, then, substituting the calibration curve with the relative quantity of the analyte obtained by a relative quantitative analysis with an internal standard.
- the absolute quantitative analysis has a drawback to obtain a calibration curve for each analyte for analyzing a sample containing a plurality of analytes.
- an absolute quantitative analysis by standard addition is MALDI mass spectrometry that determines the absolute amount of an analyte by using calibration points obtained from MALDI spectra of each sample which is prepared by dividing each unknown sample into two or more portions and adding known amount(s) of the analyte to these portions.
- the absolute quantitative analysis by standard addition has drawbacks to prepare an additional analyte to be analyzed, and many samples in order to analyze one analyte.
- an internal standard especially an isotopically labeled analyte
- an internal standard especially an isotopically labeled analyte
- pretreatment of the analyte is not simple.
- MALDI spectral patterns are determined by the fragmentation patterns of AH + and MH + and the abundance (intensity) ratio of AH + and MH + .
- Ions generated by MALDI may decay inside the ion source (in-source decay, ISD) or outside the ion source (post-source decay, PSD).
- ISD in-source decay
- PSD post-source decay
- the reaction rate of ISD is fast and, thus, ISD terminates early.
- the reaction rate of PSD is slow.
- the present inventors presented for the first time the best systematic method for measuring the plume temperature ( J. Phys. Chem. B 2009, 108, 2405-2410 ).
- the present inventors succeeded in obtaining the reaction rate of ion fragmentation and the effective temperature by kinetic analysis of the time-resolved photodissociation spectra and the PSD spectra.
- the present inventors found out that the thus obtained temperature is the late plume temperature ( T late ).
- the present inventors determined the early plume temperature ( T early ) by analyzing ISD yields using the thus obtained reaction rate function.
- the present inventors discovered, surprisingly, that, although the early plume temperature ( T early ) changes with change of MALDI experimental conditions, the fragmentation patterns of each ion are the same, respectively, when observing the mass spectra where T early is the same, out of the spectra obtained at various experimental conditions.
- the present inventors also discovered that, although the temperature ( T early ) at which ions are generated changes with change of the reaction conditions of the ion generation in MALDI, the total ion count (TIC) of each spectrum is the same, respectively, when observing the mass spectra where T early is the same, out of the spectra obtained at various experimental conditions.
- mass spectra of the same T early can be selected by utilizing the factors for measuring T early , such as the ion fragmentation pattern and the total ion count in MALDI spectra.
- the present inventors have understood that, in MALDI-TOF mass spectrometry, early plume is nearly in an equilibrium state and the reaction quotient (Q) corresponds to the reaction constant (K) of the proton exchange reaction between the matrix and the analyte. Therefore, the present inventors have noted that the analyte-to-matrix ion intensity of MALDI-TOF mass spectra obtained at a certain temperature is proportional to the analyte-to-matrix mole ratio in a solid sample and, thereby, quantitative analysis can be performed.
- the present inventors have invented a method for measuring an equilibrium constant of a proton transfer reaction between a matrix and an analyte by measuring MALDI mass spectra with change of MALDI ionization reaction conditions, comparing fragmentation patterns of matrix ions, analyte ions or other additive's ions contained in MALDI samples, selecting spectra of which fragmentation patterns of these materials are the same, and measuring the ratio of the matrix ion signal intensity to the analyte ion signal intensity from the selected MALDI spectra.
- the present inventors have invented a method for obtaining a calibration curve according to change of concentration ratio of the matrix to the analyte at a certain temperature by utilizing the reaction constant between the matrix and the analyte.
- the present inventors have invented a method for quantitative analysis of an analyte in a sample from the moles of the analyte obtained by substituting the calibration curve with the matrix concentration and the ratio of the matrix ion signal intensity to the analyte ion signal intensity measured from MALDI mass spectra of the sample prepared by mixing the known amount of the matrix and the unknown amount of the anlyte.
- the present inventors have invented a method for improving accuracy of quantitative mass spectrometry by suppressing the matrix signal suppression effect through dilution of the anlyte when the matrix signal suppression effect is more than 70%, in order to solve the problem that makes an accurate quantitative analysis difficult due to decrease of the matrix ion signal intensity and other analyte ion signal intensity when the concentration of the anlyte in the sample is very high.
- the first object of the present invention is to provide a method for improving reproducibility of a mass spectrum of a chemical compound, wherein temperatures of an ion generation reaction are controlled to be the same with each other, or wherein spectra of which temperature of ion generation reaction are the same with each other are selected from mass spectra of a chemical compound.
- the second object of the present invention is to provide a method for measuring an equilibrium constant of a proton transfer reaction between a matrix and an analyte at a certain temperature, which comprises: (i) a step for selecting spectra of which fragmentation patterns of an analyte, a matrix or a third material are the same with each other, from a plurality of mass spectra obtained from ions generated by providing energy with a sample mixture comprising a matrix and an analyte, or a matrix, an analyte and a third material; and (ii) a step for obtaining an ion signal ratio calculated through dividing a signal intensity of an analyte ion shown in the spectra selected in the step (i) by a signal intensity of a matrix ion shown in the spectra selected in the step (i), wherein the equilibrium constant is obtained through dividing the ion signal ratio by a concentration ratio calculated through dividing an analyte concentration by a matrix concentration.
- the third object of the present invention is to provide a method for obtaining a calibration curve for quantitative analysis, which comprises: (i) a step for selecting spectra of which fragmentation patterns of an analyte, a matrix or a third material are the same with each other, from a plurality of mass spectra obtained from ions generated by providing energy with a sample mixture comprising a matrix and an analyte, or a matrix, an analyte and a third material; (ii) a step for obtaining an ion signal ratio calculated through dividing a signal intensity of an analyte ion shown in the spectra selected in the step (i) by a signal intensity of a matrix ion shown in the spectra selected in the step (i); and (iii) a step for plotting a curve of the ion signal ratio against change of a concentration ratio calculated through dividing the analyte concentration by the matrix concentration.
- the fourth object of the present invention is to provide a method for quantitative analysis of an analyte by using mass spectra, which comprises: (i) a step for selecting spectra of which fragmentation patterns of an analyte, a matrix or a third material are the same with each other, from a plurality of mass spectra obtained from ions generated by providing energy with a sample mixture comprising a known amount of a matrix and an unknown amount of an analyte, or a known amount of a matrix, an unknown amount of an analyte and the third material; (ii) a step for obtaining an ion signal ratio calculated through dividing a signal intensity of an analyte ion shown in the spectra selected in the step (i) by a signal intensity of a matrix ion shown in the spectra selected in the step (i); and (iii) a step of substituting the matrix concentration and the ion signal ratio measured in the step (ii) for the following equation (9) for calculating an
- the first object of the present invention can be accomplished by providing a method for improving reproducibility of a mass spectrum of a chemical compound, wherein temperatures of an ion generation reaction are controlled to be the same with each other, or wherein spectra of which temperature of ion generation reaction are the same with each other are selected from mass spectra of a chemical compound.
- the method for improving reproducibility of a mass spectrum of a chemical compound of the present invention may comprise a step for selecting mass spectra of which fragmentation patterns of a compound selected from the group consisting of a matrix, an analyte and a third material, are the same with each other.
- the method for improving reproducibility of a mass spectrum of a chemical compound of the present invention may comprise a step for selecting mass spectra of which total ion counts are the same with each other.
- the second object of the present invention can be accomplished by providing a method for measuring an equilibrium constant of a proton transfer reaction between a matrix and an analyte at a certain temperature, which comprises: (i) a step for selecting spectra of which fragmentation patterns of an analyte are the same with each other, from a plurality of mass spectra obtained from ions generated by providing energy with a sample mixture comprising a matrix and an analyte; and (ii) a step for obtaining an ion signal ratio calculated through dividing a signal intensity of an analyte ion shown in the spectra selected in the step (i) by a signal intensity of a matrix ion shown in the spectra selected in the step (i), wherein the equilibrium constant is obtained through dividing the ion signal ratio by a concentration ratio calculated through dividing an analyte concentration by a matrix concentration.
- the second object of the present invention can be accomplished by providing a method for measuring an equilibrium constant of a proton transfer reaction between a matrix and an analyte at a certain temperature, which comprises: (i) a step for selecting spectra of which fragmentation patterns of a matrix are the same with each other, from a plurality of mass spectra obtained from ions generated by providing energy with a sample mixture comprising a matrix and an analyte; and (ii) a step for obtaining an ion signal ratio calculated through dividing a signal intensity of an analyte ion shown in the spectra selected in the step (i) by a signal intensity of a matrix ion shown in the spectra selected in the step (i), wherein the equilibrium constant is obtained through dividing the ion signal ratio by a concentration ratio calculated through dividing an analyte concentration by a matrix concentration.
- the second object of the present invention can be accomplished by providing a method for measuring an equilibrium constant of a proton transfer reaction between a matrix and an analyte at a certain temperature, which comprises: (i) a step for selecting spectra of which fragmentation patterns of a third material are the same with each other, from a plurality of mass spectra obtained from ions generated by providing energy with a sample mixture comprising a matrix, an analyte and a third material; and (ii) a step for obtaining an ion signal ratio calculated through dividing a signal intensity of an analyte ion shown in the spectra selected in the step (i) by a signal intensity of a matrix ion shown in the spectra selected in the step (i), wherein the equilibrium constant is obtained through dividing the ion signal ratio by a concentration ratio calculated through dividing an analyte concentration by a matrix concentration.
- a means for providing the energy with the sample mixture may be a laser, or various types of electromagnetic waves including a particle beam, other radioactive rays, etc.
- the laser may be a nitrogen (N 2 ) laser or a Nd:YAG laser.
- the laser may be irradiated to a single spot on the sample mixture for a plurality of times.
- matrix refers to a material that absorbs energy from an energy source such as laser and, then, transfers the energy to an anslyte thereby causing heating and ionization of the analyte.
- Various materials such as CHCA ( ⁇ -cyano-4-hydroxycinnamic acid), DHB (2,5-dihydroxybenzoic acid), sinapinic acid (3,5-dimethoxy-4-hydroxycinnamic acid), 4-hydroxy-3-methoxycinnamic acid, picolinic acid, 3-hydroxypicolinic acid, etc. are known in the art.
- a means for providing the energy with the sample mixture is generally a laser, and may be various types of electromagnetic waves including particle beams, radioactive rays, etc.
- MALDI mass spectrometry In a typical MALDI mass spectrometry, a solid sample consisting of a matrix (M) and a trace of an analyte (A) is irradiated by laser pulses. The matrix absorbs the laser pulses, heats the solid sample and facilitates ionization of solid sample.
- MALDI mass spectra are the spectra of a mixture of matrix ions and analyte ions.
- total ion count means the total number of particles detected in the detector inside a mass spectrometer. Since a part of ions generated by MALDI becomes disassociated and lost, it is difficult to measure the total number of ions generated by MALDI. Hence, the total number of particles detected by the detector, which is equivalent to the total number of ions, is defined as a total ion count.
- plume refers to a vapor that is generated from a sample by irradiation of a laser on the sample. Plume contains gaseous matrix molecules, analyte molecules, matrix ions and analyte ions, most of which is the gaseous matrix ions.
- reaction quotient equals to the reaction constant.
- calibration curve or “calibration equation” refers to a curve that is experimentally obtained and illustrates a correlation between a concentration of a component and a specific property (for example, electric property, color, etc.).
- a calibration curve is used for quantifying an unknown material.
- the term "ion signal ratio” is defined as a ratio of a signal intensity of an analyte ion (I AH+ ) to a signal intensity of a matrix ion (I MH+ ), i.e., I AH+ ) I MH+ .
- concentration ratio is defined as a ration of moles of an analyte contained in a sample to moles of a matrix in the sample ([A]/[M]).
- MALDI mass spectral pattern is determined by a fragmentation pattern of AH + and MH + , and an analyte ion-to-matrix ion abundance ratio.
- the present inventors disclosed a method for determining an early plume temperature ( T early ) in MALDI ( Bae, Y. J.; Moon, J. H.; Kim, M. S., J. Am. Soc. Mass Spectrom. 2011, 22, 1070-1078 ; Yoon, S. H.; Moon J. H.; Kim, M. S., J. Am. Soc. Mass Spectrom. 2010, 21, 1876-1883 ).
- the present inventors discovered that all of the three factors are determined when T early is specified.
- the disclosures of these prior documents are incorporated herein by reference in their entirety.
- the reproducibility of ion fragmentation pattern in MALDI mass spectra is accomplished by measuring several times MALDI mass spectra with change of MALDI ionization reaction conditions, comparing fragmentation patterns of matrix ions, analyte ions or a third material ions contained in MALDI samples, and selecting spectra of which fragmentation patterns of these materials are the same, that is, the temperature at which ions are generated are the same.
- the temperature ( T early ) at which ions are generated changes, but when selecting spectra of which ion generation temperatures are the same with each other, from a plurality of mass spectra obtained at various experimental conditions, the total ion count (TIC) of each spectrum is the same with each other.
- MALDI spectrum includes an analyte ion, a matrix ion and their fragmented products, and it is possible to obtain reproducible MALDI spectra in which relative and absolute ion intensity of each ion is the same regardless of experimental conditions when selecting MALDI spectra having a specific T early .
- TIC is the same when T early is the same, regardless of identities, concentrations and number of analytes contained in a sample.
- the MALDI mass spectral reproducibility is secured by measuring MALDI spectra several time with changing MALDI ionization conditions, and selecting MALDI spectra with the same total ion count (TIC) from each spectrum set.
- T early of MALDI spectra obtained by irradiation of laser pulses on a sample gradually decreases. This is because the thermal conduction from the irradiated sample to a plate on which the sample is placed occurs efficiently as the thickness of the sample gets thinner ( Anal. Chem. 2012, 84, 7107-7111 ). This decrease of T early is one the main reasons to damage the shot-to-shot reproducibility of MALDI spectra.
- a circular neutral density filter is used to adjust the laser pulse energy.
- the laser pulse energy is adjusted by rotating the filter to a desired angle, which is mounted on a step motor.
- the feedback control of the laser pulse energy may be performed as follows. First, the TIC at which the laser pulse energy corresponding to 2 times the threshold energy is used may be set as a reference value. After obtaining MALDI spectra by irradiation of laser pulses, TIC corresponding to the MALDI spectra is calculated. Then, the rotational direction and angle for the circular neutral density filter are determined by calculating the discrepancy between the TIC and the reference TIC. Such feedback control is terminated when the laser pulse energy becomes three times the threshold. MALDI spectra are obtained by repetition of this procedure on each irradiated spot.
- the reaction quotient of the reaction (1) is defined as the following equation (2).
- the value of [M]/[A] can be directly obtained from the concentrations of the matrix and analyte used for preparation of a sample.
- [AH + ]/[MH + ] is the value calculated by dividing the concentration of the analyte-derived ions by the concentration of the matrix-derived ions, and is the same as the value (ion signal ratio) calculated by dividing the signal intensity of the analyte-derived ions by the signal intensity of the matrix-derived ions, which is obtained in the (ii) step of the method for measuring an reaction quotient of a proton transfer (exchange) reaction according to the present invention, i.e., I AH+ /I MH+ .
- the equation (2) can be rewritten as follows.
- Q M / A / l AH + / l MH +
- the analyte ion ([A + H] + ) is produced by proton transfer (equation (1)) from the matrix ion ([M + H] + ).
- matrix ion signals decrease and other analyte(s) ion signals also decrease.
- matrix signal suppression effect refers to a phenomenon that matrix ion signals decrease when the concentration of an analyte in a sample is very high.
- analyte signal suppression effect refers to a phenomenon that, when the concentration of an analyte in the sample is very high, other analyte ion signals in a sample decrease.
- the total number of matrix-derived ions generated in MALDI is the sum of them. Furthermore, the number of matrix ions generated in MALDI is proportional to the number of MH + shown in a MALDI spectrum. Thus, the number of MH + shown in MALDI spectrum is used in the present invention, instead of the total number of matrix ions.
- I 0 is defined as the ion signal intensity of MH + in a MALDI spectrum of a pure matrix
- I is defined as the ion signal intensity of MH + in a MALDI spectrum of a matrix-analyte mixture.
- S matrix signal suppression effect
- results of measurement of many analytes show that deviation from linearity occurs when the matrix signal suppression effect is larger than 70%.
- This can be utilized as a guideline for quantitative analysis of a sample. That is, the present inventors obtained MALDI spectra of a sample and, then, calculated the matrix signal suppression effect. When the matrix signal suppression is 70% or lower, the mass spectra can be used for quantitative analysis of an analyte.
- S 1 and S 2 denote the matrix signal suppression effects when concentrations of an analyte 1 and an analyte 2 are c 1 and c 2 , respectively.
- the analyte of the sample may be diluted by a factor of 2, preferably a factor of several to several hundreds.
- the third object of the present invention can be accomplished by providing a method for obtaining a calibration curve for quantitative analysis, which comprises: (i) a step for selecting spectra of which fragmentation patterns of an analyte are the same with each other, from a plurality of mass spectra obtained from ions generated by providing energy with a sample mixture comprising a matrix and an analyte; (ii) a step for obtaining an ion signal ratio calculated through dividing a signal intensity of an analyte ion shown in the spectra selected in the step (i) by a signal intensity of a matrix ion shown in the spectra selected in the step (i); and (iii) a step for plotting a curve of said ion signal ratio against change of a concentration ratio calculated through dividing said analyte concentration by said matrix concentration.
- the third object of the present invention can be accomplished by providing a method for obtaining a calibration curve for a quantitative analysis, which comprises: (i) a step for selecting spectra of which fragmentation patterns of a matrix are the same with each other, from a plurality of mass spectra obtained from ions generated by providing energy with a sample mixture comprising a matrix and an analyte; (ii) a step for obtaining an ion signal ratio calculated through dividing a signal intensity of an analyte ion shown in the spectra selected in the step (i) by a signal intensity of a matrix ion shown in the spectra selected in the step (i); and (iii) a step for plotting a curve of said ion signal ratio against change of a concentration ratio calculated through dividing said analyte concentration by said matrix concentration.
- the third object of the present invention can be accomplished by providing a method for obtaining a calibration curve for quantitative analysis, which comprises: (i) a step for selecting spectra of which fragmentation patterns of a third material are the same with each other, from a plurality of mass spectra obtained from ions generated by providing energy with a sample mixture comprising a matrix, an analyte and the third material; (ii) a step for obtaining an ion signal ratio calculated through dividing a signal intensity of an analyte ion shown in the spectra selected in the step (i) by a signal intensity of a matrix ion shown in the spectra selected in the step (i); and (iii) a step for plotting a curve of said ion signal ratio against change of a concentration ratio calculated through dividing said analyte concentration by said matrix concentration.
- a means for providing the energy with the sample mixture may be a laser, or various types of electromagnetic waves including a particle beam, other radioactive rays, etc.
- the laser may be a nitrogen (N 2 ) laser or a Nd:YAG laser.
- the laser may be irradiated to a single spot on the sample mixture for a plurality of times.
- a calibration curve for MALDI quantitative analysis may be obtained by linear regression of the ion signal ratio versus the concentration ratio which is obtained by repetition of the (i) step to the (iii) step with change of the analyte concentration and with the matrix concentration fixed.
- the fact that the analyte-to-matrix ion signal ratio is determined by T early indicates that the proton exchange reaction is in an equilibrium state. Whether or not the reaction (1) is in a thermal equilibrium state may be confirmed by check whether or not the reaction quotient (Q) for a sample with different concentration of an analyte at the same T early changes with the concentration of the analyte.
- the present inventors obtained spectra in which T early is the same but the composition of a sample is different, by obtaining MALDI spectra through repetitive irradiation of laser pulses on many samples with different analyte concentrations, followed by selecting spectra having a specific T early .
- the present inventors measured intensities of ions derived from the matrix and the analyte.
- reaction quotient was obtained by substituting the equation (3) with the ion signal ratio (the value obtained by dividing the analyte ion signal intensity by the matrix ion signal intensity) and the concentrations of the matrix and the analyte in the sample, the present inventors discovered that, when T early is the same, the reaction quotient remains constant, even though the concentration of the analyte in the sample is different. Such results indicate that the reaction (1) is in an equilibrium state.
- a slope of the calibration curve i.e., a reaction constant can be calculated by the equation (8), from only one measured I AH+ /I MH+ value and one [A]/[M] value.
- a reaction constant i.e., the slope of the equation (8) can be calculated by statistical treatment, i.e., linear regression of a plurality of measured I AH+ /I MH+ values and [A]/[M] values.
- a straight line with a slope of K can be obtained by setting I AH+ /I MH+ (i.e., [AH + ]/[MH + ]) to be the longitudinal axis and by setting [A]/[M] to be the horizontal axis.
- This straight line is the calibration curve (or calibration equation) for MALDI quantitative analysis.
- the analyte of the sample may be diluted by a factor of 2, preferably a factor of several to several hundreds.
- a means for providing the energy with the sample mixture may be a laser, or various types of electromagnetic waves including a particle beam, other radioactive rays, etc.
- the laser may be a nitrogen (N 2 ) laser or a Nd:YAG laser.
- the laser may be irradiated to a single spot on the sample mixture for a plurality of times.
- I AH+ /I MH+ is proportional to [A]/[M], which means that an analyte in a solid sample can be measured by measuring I AH+ /I MH+ in MALDI mass spectrum.
- the equation (8) is modified to the following equation (9).
- equation (9) can be utilized to obtain the absolute quantity of the analyte in quantitive analysis using MALDI mass spectrometry.
- the concentration of the analyte, [A] can be calculated from the calibration curve (the equation (9)) obtained by a method for obtaining a calibration curve for MALDI quantitative analysis by using the ratio of the analyte ion signal intensity to the matrix ion signal intensity obtained in the step (iii) of the method for quantitative analysis of an analyte by using mass spectra according to the present invention, i.e., I AH+ /I MH+ , and the known concentration of the matrix, [M].
- the equation (9) may be applicable to other components in the matrix plume. That is, even in the case that the sample or the analyte is severely contaminated, quantitative analysis of the analyte in the specific sample is possible through the method of the present invention utilizing MALDI-TOF mass spectra. Therefore, according to the present invention, it is possible to quantify various components in the mixture containing various materials, simultaneously.
- the analyte of the sample may be diluted by a factor of 2, preferably a factor of several to several hundreds.
- a quantitative analysis of extremely small amount of an analyte can be performed inexpensively, accurately and rapidly by obtaining the analyte-to-matrix ion ratio from MALDI mass spectra and, from this, plotting a calibration curve for quantitative analysis.
- the analyte to be analyzed is one component in a mixture or an anlyte is severely contaminated, it is possible to accurately and reproducibly perform a rapid and simple quantitative analysis by using MALDI mass spectra.
- the MALDI-TOF instrument manufactured by the present inventors was used ( Bae, Y. J.; Shin, Y. S.; Moon, J. H.; Kim. M. S. J. Am. Soc. Mass Spectrom. in press ; Bae, Y. J.; Yoon, S. H.; Moon, J. H.; Kim, M. S. Bull. Korean Chem. Soc. 2010, 31, 92-99 ; Yoon, S. H.; Moon, J. H.; Choi, K. M.; Kim, M. S. Rapid Commun. Mass Spectrom. 2006, 20, 2201-2208 ).
- One of the key features of the instrument is the installation of a reflectron with linear-plus-quadratic potential inside ( Oh, J.
- the threshold laser pulse energy, or threshold, for CHCA-MALDI of peptides at 337 nm was 0.50 ⁇ J/pulse. This was a little smaller than 0.75 ⁇ J/pulse reported previously ( Bae, Y. J.; Shin, Y. S.; Moon, J. H.; Kim. M. S. J. Am. Soc. Mass Spectrom. in press ; Moon, J. H.; Shin, Y. S.; Bae, Y. J.; Kim, M. S. J. Am. Soc. Mass Spectrom. 2012, 23, 162-170 ), due to a better beam shaping.
- the threshold at 355 nm was around 0.40 ⁇ J/pulse.
- Aqueous stock solution of each peptide was diluted to a desired concentration and mixed with water/acetonitrile solution of CHCA. 1 ⁇ L of each mixture was loaded on the target and vacuum-dried.
- a sample contained 1 or 3 pmol of a peptide in 25 nmol of CHCA.
- k(E) of a peptide ion is needed to estimate its early plume temperature by the kinetic method.
- RRKM Root-Ramsperger-Kassel-Marcus rate-energy relation (k(E)) calculated with the above E 0 and ⁇ S ⁇ was used to determine the early plume temperature under various experimental conditions.
- MALDI spectra were integrated in the shot number ranges of (a) 1-20, (b) 41-60, (c) 81-100, (d) 141-160, and (e) 181-200.
- ISD product ions appear in the spectra such as the immonium ion Y from the peptide ion, and [CHCA + H - H 2 O] + and [CHCA + H - CO 2 ] + from the matrix ion.
- the matrix dimer ion, [2CHCA + H] + also appears (PSD peaks are marked with *).
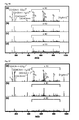
- Fig. 3 illustrates MALDI spectra where a spot on a sample with 3 pmol of Y 5 K in 25 nmol of CHCA was irradiated repetitively at 337 nm laser pulses with six times the threshold pulse energy, and each spectrum was integrated in the shot number ranges of (a) 1-20, (b) 41-60, (c) 81-100, (d) 141-160 and (e) 181-200.
- Immonium ion Y was the major ISD product of [Y 5 K + H] + , and [CHCA + H-H 2 O] + and [CHCA + H - CO 2 ] + were the ISD products of [CHCA + H] + (PSD peaks are marked with *).
- FIG. 4 illustrates MALDI spectra where a spot on a sample with 3 pmol of angiotensin II (DRVYIHPF) in 25 nmol of CHCA was irradiated repetitively at 337 nm laser pulses with six times the threshold pulse energy, and each spectrum was integrated in the shot number ranges of (a) 1-20, (b) 41-60, (c) 81-100, (d) 141-160 and (e) 181-200.
- DUVYIHPF angiotensin II
- Immonium ion, P, V, H, Y are the major ISD products of [DRVYIHPF + H] + , and [CHCA + H - H 2 O] + and [CHCA + H - CO 2 ] + were the ISD products of [CHCA + H] + (PSD peaks are marked with *).
- T early was estimated from S in .
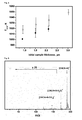
- T early vs. initial sample thickness plot shown in Fig. 5 (bare stainless steel surface: •; fluorocarbon layer: ⁇ ) is consistent with the hypothesis that thermal conduction is more efficient in a thinner sample.
- T early for samples loaded on the fluorocarbon layer was higher than that on the bare metal plate, suggesting that the fluorocarbon layer played an insulator to the heat flow. Consequently, T early can be determined from the peptide ion dissociation yield and the temperature goes down as the shot continues.
- Fig. 8 illustrates MALDI spectra of samples of Y 5 K:CHCA (peptide-to-matrix ratio) of 1 : 8300 with T early near 968 K, which were selected from sets of MALDI spectra obtained at the four conditions of (a) (3, 25, x6, 337) (shot number range of 61-80), (b) (3, 25, x4, 337) (shot number range of 41-60), (c) (4.2, 35, x6, 337) (shot number range of 71-90), and (d) (3, 25, x6, 355) (shot number range of 21-40).
- Fig. 8 illustrates MALDI spectra of samples of Y 5 K:CHCA (peptide-to-matrix ratio) of 1 : 8300 with T early near 968 K, which were selected from sets of MALDI spectra obtained at the four conditions of (a) (3, 25, x6, 337) (shot number range of 61-80), (b) (3, 25, x4, 337) (shot number range of 41-60
- FIG. 9 illustrates MALDI spectra of samples of angiotensin II (DRVYIHPF):CHCA (peptide-to-matrix ratio) of 1 : 8300 with T early near 968 K, which were selected from sets of MALDI spectra obtained at the four conditions of (a) (3, 25, x6, 337) (shot number range of 71-90), (b) (3, 25, x4, 337) (shot number range of 31-50), (c) (4.2, 35, x6, 337) (shot number range of 81-100), and (d) (3, 25, x6, 355) (shot number range of 21-40).
- DRVYIHPF angiotensin II
- CHCA peptide-to-matrix ratio
- MALDI spectra for peptides turned out to be reproducible once those tagged by the same T early were compared.
- samples with different peptide-to-matrix ratios the same fragmentation patterns for the peptide and matrix ions at the same T early were observed, while the peptide-to-matrix ion abundance ratios were different.
- Matrix-to-peptide proton transfer occurs in MALDI mass spetrometry, i.e., M'H + + P ⁇ M' + PH + .
- the M'H + is the proton donor that might be [CHCA + H] + , [CHCA + H - H 2 O] + , or [CHCA + H - CO2] + in the present case.
- the fact that the peptide-to-matrix ion abundance ratio is thermally determined suggests that the proton transfer is almost in thermal equilibrium.
- the abundances of the matrix- and analyte-derived ions were measured for the spectra in the new set. At this stage, one needs to know the identity of M'H + to calculate Q. However, as far as checking the constancy of Q is concerned, one can use the abundance of any of the potential proton donors mentioned above, or their combinations, because the relative abundances of all the matrix-derived ions were fixed when T early was fixed.
- concentration independence of the fragmentation pattern of matrix ions further suggests that a fragment ion such as [CHCA + H - H 2 O] + is not the main proton donor because, if it were, its abundance would decrease more rapidly than that of [CHCA + H] + as the amount of peptide increases.
- the method of the present invention may be applicable to all the analyte that can be ionized by MALDI.
- Peptides Y 6 , Y 5 K, and angiotensin II were purchased from Peptron (Daejeon, Korea). Matrices CHCA and DHB were purchased from Sigma (St. Louis, MO, USA). Aqueous solution of an analyte(s) was mixed with 1:1 water/acetonitrile solution of CHCA or DHB. In CHCAMALDI, 1.0 ⁇ L of a solution containing 0-250 pmol of analyte and 25 nmol of CHCA was loaded on the target and vacuum- or air-dried. Sampling for DHB-MALDI of Y 6 was carried out in two steps. In each step, 1 ⁇ L of a solution containing 0.5-320 ⁇ mol of Y 6 and 50 nmol of DHB was loaded and vacuum-dried.
- T early It is not required to use kinetic analysis of anlayte ion fragmentation in order to measure T early of MALDI spectrum. Fragmentation pattern of a matrix ion, or total number of ions generated may be used as an indicator for T early .
- T early cannot be easily determined in these methods when identities, concentrations and number of analytes in a sample change.
- a good measure of T early allowing for easy and rapid calculation of T early , is required for substantial quantitative analysis, regardless of identities, concentrations and number of analytes in a sample. The following criteria are required for a good measure of T early .
- T early by using fragmentation pattern of an analyte ion does not satisfy the second and third criteria. Even when using the fragmentation pattern of a matrix ion, it is difficult to determine T early if matrix ion signals are contaminated by others. When the total number of ions generated in MALDI is used as a measure of T early , the first and second criteria can be satisfied.
- TIC total ion count
- Table 3 Total ion count (TIC) versus analyte concentration in CHCA-MALDI Analyte Concentration (pmol) a TIC per laser pulse b
- T early 875 ⁇ 5K
- T early 900 ⁇ 5K - c 0 600 ⁇ 60 1250 ⁇ 130 Y5K 0.10 540 ⁇ 90 1300 ⁇ 80 1.0 450 ⁇ 50 1100 ⁇ 110 10 460 ⁇ 50 1070 ⁇ 70 Y5R 0.10 540 ⁇ 50 1220 ⁇ 40 1.0 530 ⁇ 160 1250 ⁇ 130 10 520 ⁇ 100 1050 ⁇ 120 Mixture d 1.0/analyte 580 ⁇ 50 1220 ⁇ 30 a Number of picomoles of analyte in 25 nmol of CHCA in a solid sample b Averages over three or more measurements with one standard deviation c Pure CHCA d 1.0 pmol each of Y 5 K, Y 5 R, YLYEIAR, YGGFL, creatinine, and histamine in 25 nmol of CHCA
- TIC is not significantly affected by the identities, concentrations, and number of analytes in a sample. Also, TIC is very sensitive to T early change (875 K ⁇ 900 K). Thus, TIC satisfies all the three criteria and, hence, can be a useful measure of T early .
- a similar measurement for a vacuum-dried sample of 10 ⁇ mol Y 5 K in 25 nmol CHCA was performed, this time selecting spectra with TIC of 1100 ⁇ 200 ions/pulse. As shown in Fig. 14 , the spectra thus obtained are virtually the same. Also, similar results for angiotensin II in CHCA were obtained. The results indicate that TIC is an excellent measure of T early . Moreover, the spot-to-spot and sample-to-sample reproducibilities were checked and it was found that the strategy of spectral acquisition-temperature selection utilizing TIC worked well.
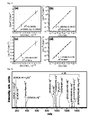
- the present inventors obtained MALDI spectra for vacuum-dried samples containing 0.01-250 ⁇ mol of Y 5 K in 25 nmol CHCA, selected those with TIC of 900 ⁇ 180 ions/pulse, and calculated the [AH + ]/[MH + ] versus [A]/[M] data from the spectra. The result is shown in Fig. 15(a) . Excellent linearity of the calibration curve demonstrates the utility of TIC for temperature selection and, hence, for quantification.
- Laser pulse energy was adjusted in order to control TIC in MALDI spectra.
- Laser pulse energy was manually adjusted by rotating a circular variable neutral density filter (model CNDQ-4-100.0 M, CVI Melles Griot, Albuquerque, NM, USA) installed immediately after the laser. This filter was mounted on a step motor assembly and the laser pulse energy was systematical adjusted by rotating the filter with a command from the data system.
- a circular variable neutral density filter model CNDQ-4-100.0 M, CVI Melles Griot, Albuquerque, NM, USA
- the following negative feedback method turned out to be convenient for the temperature control.
- the laser pulse energy was adjusted to two times the threshold and 10 single-shot spectra were obtained and averaged. From the spectrum thus obtained, TIC was calculated and compared with a preset value, thereby calculating the adjustment needed for the laser pulse energy. The result was used to determine the rotational direction and angle for the filter. After the angular adjustment of the filter, spectral acquisition was resumed. Spectral acquisition from the spot was terminated when the materials in the spot got significantly depleted by repetitive laser irradiation. For CHCA-MALDI, termination was made when the laser pulse energy became three times the threshold.
- the experiment for a vacuum-dried sample with 10 ⁇ mol Y 5 K in 25 nmol CHCA was repeated, this time with the feedback adjustment of the laser pulse energy using TIC of 900 ions/pulse as the preset value.
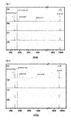
- the spectra averaged over the shot number ranges of 31-40, 81-90, 131-140, and 241-250 are shown in Fig. 16 .
- the total TICs in these shot number ranges were 9,000 (9,000), 8,600 (53,000), 9,000 (103,000), and 8,100 (188,000), respectively, with the numbers in the parentheses denoting TICs accumulated over the shot number ranges of 31-40, 31-90, 31-140, and 31-250, respectively.
- Spectral acquisition was terminated at the shot number 250, where the laser pulse energy became three times the threshold. As shown in Fig. 16 , both the spectral patterns and ion abundances were similar throughout the measurement on the spot, demonstrating a successful acquisition of reproducible spectra by TIC control.
- the 355 nm output of a Nd:YAG laser (Surelite III-10, Continuum, Santa Clara, CA, USA) for MALDI instead of the nitrogen laser was used in order to test the feasibility of this method.
- the threshold pulse energy at this wavelength was 0.25 ⁇ J/pulse.
- 2,500 ions/pulse as the preset value for TIC was used, and data acquisition using two times the threshold pulse energy was started. After acquiring 10 spectra, TIC was measured and compared with the preset value. The pulse energy as an attempt to restore TIC to the preset value was adjusted.
- the pulse energy was adjusted by changing the delay time for Q-switching-the actual methods of pulse energy adjustment can be different for different lasers.
- the first spectrum (shot number range of 31-40) in Fig. 17(a) was obtained using the pulse energy corresponding to 2 times the threshold. Then, the laser output was adjusted for TIC-control. The result obtained in the shot number range of 61-70 is shown in Fig. 17(b) .
- the two spectra look similar demonstrating a successful reproduction of mass spectra through TIC control via laser output.
- the result obtained at the same shot number range (61-70) obtained with the laser output fixed at 2 times the threshold is shown in Fig. 17(c) . It can be seen that quantitatively reproducible spectra can be generated by the adjustment of laser output as was the case of the pulse energy adjustment with a neutral density filter.
- TIC-controlled spectra at many spots on a vacuum-dried peptide/CHCA sample were acquired. The thus acquired spectra were similar regardless of the spot chosen for laser irradiation. Without TIC control, checking the spot-to-spot variation is meaningless because even the spectra obtained at the same spot are not reproducible.
- TIC-controlled spectra were obtained from this sample using the same preset value for TIC as before, i.e., 900 ions/pulse. Their patterns were similar to those in Fig. 16 , indicating that TIC control can reduce the errors caused at the time of sample loading.
- T early associated with the spectra obtained from air-dried samples tends to be slightly higher than that from the vacuum-dried sample even though the same preset value of TIC was used in both cases.
- the [CHCA+H - CO 2 ] + -to-[CHCA+H] + abundance ratio is a little larger for air-dried samples than for the vacuum-dried one.
- An explanation for the above difference is as follows. In order to generate the same numbers of ions from the two different samples, T early for the air-dried sample should be a little higher than that for the vacuum-dried one because the sample area exposed to laser irradiation is smaller for the former sample. Regardless, it is remarkable to note that the spectra obtained from two samples with significantly different morphology have become similar upon TIC control.
- a set of TIC-controlled MALDI spectra was obtained by repetitive irradiation of a spot on a sample with 20 ⁇ mol Y 6 in 100 nmol DHB using TIC of 1,300 ions per pulse as the preset value. Both the spectral patterns and ion abundances are similar throughout the measurement on the spot, as in CHCA-MALDI. Also, the calibration curve for 1.0-640 pmol of Y6 in 100 nmol of DHB was obtained. Excellent linearity of the calibration curve shown in Fig. 15(c) demonstrates the utility of TIC control in quantification with DHB-MALDI.
- Samples containing 50 pmol of DLGEEHFK, and tryptic digest of 6.5 pmol of cytochrome c in 25 nmol of CHCA were prepared. According to the TIC-control method described in Example 11, MALDI spectra were obtained by setting TIC of 3,000 particles per shot. The calibration curve for DLGEEHFK obtained from the thus-obtained mass spectra is shown in Fig. 20 . The matrix signal suppression effect for the sample was 94 %. The amount of DLGEEHFK obtained by mass spectra was 9.7 pmol, while the accurate amount of DLGEEHFK was 50 pmol.
- the matrix signal suppression effect was 78 ⁇ 7%, and this value is well matched with the value of 84% estimated by Eq. (4).
- the quantification result of the sample was 19 ⁇ 4 pmol, and this value is not good, comparing with the accurate value of 50 pmol.
- the matrix signal suppression effect was 55 ⁇ 4%, and this value is well matched with the value of 59% estimated by Eq. (4).
- the quantification result of the sample was 51 ⁇ 6 pmol, and this value was well matched with the accurate value of 50 pmol.
Landscapes
- Physics & Mathematics (AREA)
- Chemical & Material Sciences (AREA)
- Analytical Chemistry (AREA)
- Optics & Photonics (AREA)
- Engineering & Computer Science (AREA)
- Plasma & Fusion (AREA)
- Other Investigation Or Analysis Of Materials By Electrical Means (AREA)
Applications Claiming Priority (4)
| Application Number | Priority Date | Filing Date | Title |
|---|---|---|---|
| KR20120077986 | 2012-07-17 | ||
| KR20130000817 | 2013-01-03 | ||
| KR20130000816 | 2013-01-03 | ||
| PCT/KR2013/006406 WO2014014279A1 (fr) | 2012-07-17 | 2013-07-17 | Procédé permettant d'améliorer la reproductibilité des spectres de masse et procédé d'analyse quantitative l'utilisant |
Publications (2)
| Publication Number | Publication Date |
|---|---|
| EP2876434A1 true EP2876434A1 (fr) | 2015-05-27 |
| EP2876434A4 EP2876434A4 (fr) | 2016-05-04 |
Family
ID=49949045
Family Applications (1)
| Application Number | Title | Priority Date | Filing Date |
|---|---|---|---|
| EP13820231.2A Withdrawn EP2876434A4 (fr) | 2012-07-17 | 2013-07-17 | Procédé permettant d'améliorer la reproductibilité des spectres de masse et procédé d'analyse quantitative l'utilisant |
Country Status (4)
| Country | Link |
|---|---|
| US (1) | US9646810B2 (fr) |
| EP (1) | EP2876434A4 (fr) |
| JP (1) | JP6216786B2 (fr) |
| WO (1) | WO2014014279A1 (fr) |
Cited By (2)
| Publication number | Priority date | Publication date | Assignee | Title |
|---|---|---|---|---|
| WO2018209433A1 (fr) * | 2017-05-15 | 2018-11-22 | Sergey Krylov | Procédé et système de détermination d'une constante de dissociation d'équilibre d'une paire de liaison réversible |
| US11397138B2 (en) | 2017-08-17 | 2022-07-26 | Lg Chem, Ltd. | Method for qualitatively analyzing insoluble pigment compound |
Families Citing this family (9)
| Publication number | Priority date | Publication date | Assignee | Title |
|---|---|---|---|---|
| CN103871820B (zh) * | 2012-12-10 | 2017-05-17 | 株式会社岛津制作所 | 离子迁移率分析器和其组合设备以及离子迁移率分析方法 |
| GB201316164D0 (en) * | 2013-09-11 | 2013-10-23 | Thermo Fisher Scient Bremen | Targeted mass analysis |
| WO2015175561A1 (fr) * | 2014-05-12 | 2015-11-19 | Quest Diagnostics Investments Incorporated | Quantification de tamoxifène et de ses métabolites par spectrométrie de masse |
| GB2544959B (en) * | 2015-09-17 | 2019-06-05 | Thermo Fisher Scient Bremen Gmbh | Mass spectrometer |
| US10319574B2 (en) | 2016-08-22 | 2019-06-11 | Highland Innovations Inc. | Categorization data manipulation using a matrix-assisted laser desorption/ionization time-of-flight mass spectrometer |
| KR102258865B1 (ko) * | 2016-08-22 | 2021-05-31 | 하이랜드 이노베이션 인코포레이티드 | 매트릭스 지원 레이저 탈착/이온화 비행 시간 질량 분광계를 사용한 샷 단위 샘플링 |
| DE102016124889B4 (de) * | 2016-12-20 | 2019-06-06 | Bruker Daltonik Gmbh | Massenspektrometer mit Lasersystem zur Erzeugung von Photonen verschiedener Energie |
| KR102362175B1 (ko) * | 2018-08-30 | 2022-02-11 | 주식회사 엘지화학 | Maldi 질량 분석을 이용한 고분자의 상대적 정량분석방법 |
| KR102385738B1 (ko) * | 2018-09-11 | 2022-04-13 | 주식회사 엘지화학 | Maldi 질량분석용 수불용성 물질 시편의 제조방법 및 maldi 질량분석법을 이용한 수불용성 물질의 정량분석방법 |
Family Cites Families (23)
| Publication number | Priority date | Publication date | Assignee | Title |
|---|---|---|---|---|
| US3546188A (en) * | 1967-09-27 | 1970-12-08 | Kay Fries Chem Inc | Degraded vinyl chloride resins decolorized with trialkyl orthoformates |
| US3548188A (en) * | 1969-05-06 | 1970-12-15 | Vacuum Instr Corp | Method and apparatus for mass analyzing a gas which is selectively desorbed from a body |
| JPH01219557A (ja) * | 1988-02-26 | 1989-09-01 | Shimadzu Corp | クロマトグラフィー/質量分析計 |
| JP2926773B2 (ja) * | 1989-08-22 | 1999-07-28 | 株式会社島津製作所 | 液体クロマトグラフ/質量分析法及びその装置 |
| US5015845A (en) * | 1990-06-01 | 1991-05-14 | Vestec Corporation | Electrospray method for mass spectrometry |
| JP3131273B2 (ja) * | 1992-02-24 | 2001-01-31 | 日本電子株式会社 | 試料液霧化装置 |
| JP3659216B2 (ja) * | 2001-11-13 | 2005-06-15 | 株式会社島津製作所 | 飛行時間型質量分析装置 |
| US7368728B2 (en) | 2002-10-10 | 2008-05-06 | Universita' Degli Studi Di Milano | Ionization source for mass spectrometry analysis |
| US6953928B2 (en) * | 2003-10-31 | 2005-10-11 | Applera Corporation | Ion source and methods for MALDI mass spectrometry |
| KR100611313B1 (ko) * | 2004-06-30 | 2006-08-10 | 고려대학교 산학협력단 | 폴리펩티드의 n-말단 치환용 화합물, 이를 이용한폴리펩티드 내의 아미노산 서열분석 및 정량방법 |
| JP4407486B2 (ja) * | 2004-11-12 | 2010-02-03 | 株式会社島津製作所 | 飛行時間型質量分析装置 |
| US7176454B2 (en) * | 2005-02-09 | 2007-02-13 | Applera Corporation | Ion sources for mass spectrometry |
| JP2006226717A (ja) * | 2005-02-15 | 2006-08-31 | Shiseido Co Ltd | 非イオン性界面活性剤の定量方法 |
| JP5227556B2 (ja) * | 2007-09-06 | 2013-07-03 | 株式会社日立製作所 | 分析装置 |
| KR20100010802A (ko) | 2008-07-23 | 2010-02-02 | 마승홍 | 휴대기기용 보호케이스 |
| KR101087079B1 (ko) * | 2009-03-27 | 2011-11-25 | 서울대학교산학협력단 | 삼단계 질량분석장치 |
| JP5649835B2 (ja) * | 2010-02-25 | 2015-01-07 | オリンパス株式会社 | 振動スペクトル分析方法 |
| JP5657904B2 (ja) * | 2010-03-26 | 2015-01-21 | 株式会社日立ハイテクソリューションズ | ガス分析装置及びガス分析方法 |
| DE102010019857B4 (de) * | 2010-05-07 | 2012-02-09 | Bruker Daltonik Gmbh | Aufnahmetechik für MALDI-Flugzeitmassenspektrometer |
| JP5556641B2 (ja) * | 2010-12-15 | 2014-07-23 | 株式会社島津製作所 | 液体クロマトグラフ質量分析装置 |
| US20120318970A1 (en) * | 2011-06-15 | 2012-12-20 | Quimby Bruce D | Ion selection optimization for mass spectrometry |
| KR101689255B1 (ko) * | 2013-01-03 | 2016-12-26 | 주식회사 아스타 | 레이저 펄스 에너지를 조절하는 질량분석법을 이용한 정량 분석 방법 |
| KR101689254B1 (ko) * | 2013-01-03 | 2016-12-26 | 서울대학교산학협력단 | 전체 이온 개수를 측정하여 일정한 온도에서 생성된 이온들의 질량 스펙트럼을 구하는 방법 및 말디 질량분석법을 이용한 정량 분석을 위한 매트릭스의 용도 |
-
2013
- 2013-07-17 US US14/415,302 patent/US9646810B2/en active Active
- 2013-07-17 WO PCT/KR2013/006406 patent/WO2014014279A1/fr not_active Ceased
- 2013-07-17 JP JP2015523010A patent/JP6216786B2/ja not_active Expired - Fee Related
- 2013-07-17 EP EP13820231.2A patent/EP2876434A4/fr not_active Withdrawn
Cited By (3)
| Publication number | Priority date | Publication date | Assignee | Title |
|---|---|---|---|---|
| WO2018209433A1 (fr) * | 2017-05-15 | 2018-11-22 | Sergey Krylov | Procédé et système de détermination d'une constante de dissociation d'équilibre d'une paire de liaison réversible |
| US11506660B2 (en) | 2017-05-15 | 2022-11-22 | Sergey Krylov | Method and system for determining equilibrium dissociation constant of a reversible binding pair |
| US11397138B2 (en) | 2017-08-17 | 2022-07-26 | Lg Chem, Ltd. | Method for qualitatively analyzing insoluble pigment compound |
Also Published As
| Publication number | Publication date |
|---|---|
| US9646810B2 (en) | 2017-05-09 |
| WO2014014279A1 (fr) | 2014-01-23 |
| EP2876434A4 (fr) | 2016-05-04 |
| JP6216786B2 (ja) | 2017-10-18 |
| JP2015528116A (ja) | 2015-09-24 |
| US20150221488A1 (en) | 2015-08-06 |
Similar Documents
| Publication | Publication Date | Title |
|---|---|---|
| US9646810B2 (en) | Method for improving mass spectrum reproducibility and quantitative analysis method using same | |
| US8581179B2 (en) | Protein sequencing with MALDI mass spectrometry | |
| Spengler et al. | Fundamental aspects of postsource decay in matrix-assisted laser desorption mass spectrometry. 1. Residual gas effects | |
| US7718958B2 (en) | Mass spectroscopic reaction-monitoring method | |
| Tang et al. | Quantitative analysis of biopolymers by matrix-assisted laser desorption | |
| US9349578B2 (en) | Quantitative analysis method using mass spectrometry wherein laser pulse energy is adjusted | |
| CA2477835C (fr) | Procede et systeme de quantification a haut rendement de petites molecules recourant a la desorption laser et au suivi de reactions multiples | |
| Barbacci et al. | Sequence and side-chain specific photofragment (193 nm) ions from protonated substance P by matrix-assisted laser desorption ionization time-of-flight mass spectrometry | |
| Balcerzak | An overview of analytical applications of time of flight-mass spectrometric (TOF-MS) analyzers and an inductively coupled plasma-TOF-MS technique | |
| US7671343B2 (en) | Method of mass analysis and mass spectrometer | |
| Palmblad et al. | Liquid matrix deposition on conductive hydrophobic surfaces for tuning and quantitation in UV-MALDI mass spectrometry | |
| KR101689254B1 (ko) | 전체 이온 개수를 측정하여 일정한 온도에서 생성된 이온들의 질량 스펙트럼을 구하는 방법 및 말디 질량분석법을 이용한 정량 분석을 위한 매트릭스의 용도 | |
| US8110795B2 (en) | Laser system for MALDI mass spectrometry | |
| US7388194B2 (en) | Method and system for high-throughput quantitation using laser desorption and multiple-reaction-monitoring | |
| KR20140009641A (ko) | 일정한 온도에서 생성된 이온들의 질량 스펙트럼을 측정하는 방법 | |
| Hercules et al. | Applications of laser microprobe mass spectrometry in organic analysis | |
| Side | Solid mixed matrices and their advantages in matrix-assisted laser desorption/ionisation time-of-flight mass spectrometry | |
| GB2468394A (en) | Pulsed laser system for MALDI mass spectrometry | |
| Maul et al. | Spatially resolved ultra-trace analysis of elements combining resonance ionization with a MALDI-TOF spectrometer | |
| Park et al. | Efficiency of gas-phase ion formation in matrix-assisted laser desorption ionization with 2, 5-dihydroxybenzoic acid as matrix | |
| Roman et al. | Solid Analysis by Mass Spectrometry. | |
| Prebyl et al. | Calibration for determining monomer ratios in copolymers by electrospray ionization mass spectrometry | |
| Fernández-Lima et al. | UV laser induced desorption of CsI and RbI ion clusters | |
| 안성희 | Matrix-assisted variable wavelength laser desorption ionization of peptide | |
| Macha et al. | Analysis of Polymeric Hydrocarbon Materials by Matrix-Assisted Laser Desorption/Ionization (Maldi) Mass Spectrometry |
Legal Events
| Date | Code | Title | Description |
|---|---|---|---|
| PUAI | Public reference made under article 153(3) epc to a published international application that has entered the european phase |
Free format text: ORIGINAL CODE: 0009012 |
|
| 17P | Request for examination filed |
Effective date: 20150127 |
|
| AK | Designated contracting states |
Kind code of ref document: A1 Designated state(s): AL AT BE BG CH CY CZ DE DK EE ES FI FR GB GR HR HU IE IS IT LI LT LU LV MC MK MT NL NO PL PT RO RS SE SI SK SM TR |
|
| AX | Request for extension of the european patent |
Extension state: BA ME |
|
| DAX | Request for extension of the european patent (deleted) | ||
| RIC1 | Information provided on ipc code assigned before grant |
Ipc: H01J 49/00 20060101ALI20151124BHEP Ipc: G01N 27/26 20060101ALI20151124BHEP Ipc: H01J 49/16 20060101AFI20151124BHEP |
|
| RA4 | Supplementary search report drawn up and despatched (corrected) |
Effective date: 20160405 |
|
| RIC1 | Information provided on ipc code assigned before grant |
Ipc: H01J 49/16 20060101AFI20160330BHEP Ipc: H01J 49/00 20060101ALI20160330BHEP Ipc: G01N 27/26 20060101ALI20160330BHEP |
|
| 17Q | First examination report despatched |
Effective date: 20170705 |
|
| STAA | Information on the status of an ep patent application or granted ep patent |
Free format text: STATUS: THE APPLICATION IS DEEMED TO BE WITHDRAWN |
|
| 18D | Application deemed to be withdrawn |
Effective date: 20171116 |