EP2921843A1 - Dispositif de paramétrage de régions d'analyse - Google Patents
Dispositif de paramétrage de régions d'analyse Download PDFInfo
- Publication number
- EP2921843A1 EP2921843A1 EP12888367.5A EP12888367A EP2921843A1 EP 2921843 A1 EP2921843 A1 EP 2921843A1 EP 12888367 A EP12888367 A EP 12888367A EP 2921843 A1 EP2921843 A1 EP 2921843A1
- Authority
- EP
- European Patent Office
- Prior art keywords
- characteristic quantity
- divisional
- image
- analysis target
- target region
- Prior art date
- Legal status (The legal status is an assumption and is not a legal conclusion. Google has not performed a legal analysis and makes no representation as to the accuracy of the status listed.)
- Ceased
Links
Images


Classifications
-
- G—PHYSICS
- G02—OPTICS
- G02B—OPTICAL ELEMENTS, SYSTEMS OR APPARATUS
- G02B21/00—Microscopes
- G02B21/36—Microscopes arranged for photographic purposes or projection purposes or digital imaging or video purposes including associated control and data processing arrangements
-
- G—PHYSICS
- G01—MEASURING; TESTING
- G01N—INVESTIGATING OR ANALYSING MATERIALS BY DETERMINING THEIR CHEMICAL OR PHYSICAL PROPERTIES
- G01N21/00—Investigating or analysing materials by the use of optical means, i.e. using sub-millimetre waves, infrared, visible or ultraviolet light
- G01N21/17—Systems in which incident light is modified in accordance with the properties of the material investigated
- G01N21/25—Colour; Spectral properties, i.e. comparison of effect of material on the light at two or more different wavelengths or wavelength bands
- G01N21/31—Investigating relative effect of material at wavelengths characteristic of specific elements or molecules, e.g. atomic absorption spectrometry
- G01N21/35—Investigating relative effect of material at wavelengths characteristic of specific elements or molecules, e.g. atomic absorption spectrometry using infrared light
- G01N21/3563—Investigating relative effect of material at wavelengths characteristic of specific elements or molecules, e.g. atomic absorption spectrometry using infrared light for analysing solids; Preparation of samples therefor
-
- G—PHYSICS
- G01—MEASURING; TESTING
- G01J—MEASUREMENT OF INTENSITY, VELOCITY, SPECTRAL CONTENT, POLARISATION, PHASE OR PULSE CHARACTERISTICS OF INFRARED, VISIBLE OR ULTRAVIOLET LIGHT; COLORIMETRY; RADIATION PYROMETRY
- G01J3/00—Spectrometry; Spectrophotometry; Monochromators; Measuring colours
- G01J3/02—Details
- G01J3/0205—Optical elements not provided otherwise, e.g. optical manifolds, diffusers, windows
- G01J3/0248—Optical elements not provided otherwise, e.g. optical manifolds, diffusers, windows using a sighting port, e.g. camera or human eye
-
- G—PHYSICS
- G01—MEASURING; TESTING
- G01J—MEASUREMENT OF INTENSITY, VELOCITY, SPECTRAL CONTENT, POLARISATION, PHASE OR PULSE CHARACTERISTICS OF INFRARED, VISIBLE OR ULTRAVIOLET LIGHT; COLORIMETRY; RADIATION PYROMETRY
- G01J3/00—Spectrometry; Spectrophotometry; Monochromators; Measuring colours
- G01J3/28—Investigating the spectrum
- G01J3/45—Interferometric spectrometry
- G01J3/453—Interferometric spectrometry by correlation of the amplitudes
-
- G—PHYSICS
- G02—OPTICS
- G02B—OPTICAL ELEMENTS, SYSTEMS OR APPARATUS
- G02B21/00—Microscopes
- G02B21/36—Microscopes arranged for photographic purposes or projection purposes or digital imaging or video purposes including associated control and data processing arrangements
- G02B21/365—Control or image processing arrangements for digital or video microscopes
-
- G—PHYSICS
- G01—MEASURING; TESTING
- G01N—INVESTIGATING OR ANALYSING MATERIALS BY DETERMINING THEIR CHEMICAL OR PHYSICAL PROPERTIES
- G01N21/00—Investigating or analysing materials by the use of optical means, i.e. using sub-millimetre waves, infrared, visible or ultraviolet light
- G01N21/17—Systems in which incident light is modified in accordance with the properties of the material investigated
- G01N21/25—Colour; Spectral properties, i.e. comparison of effect of material on the light at two or more different wavelengths or wavelength bands
- G01N21/31—Investigating relative effect of material at wavelengths characteristic of specific elements or molecules, e.g. atomic absorption spectrometry
- G01N21/35—Investigating relative effect of material at wavelengths characteristic of specific elements or molecules, e.g. atomic absorption spectrometry using infrared light
- G01N2021/3595—Investigating relative effect of material at wavelengths characteristic of specific elements or molecules, e.g. atomic absorption spectrometry using infrared light using FTIR
Definitions
- the present invention relates to a system for setting an analysis target region within an observed sample image obtained with an observation optical system, such as an optical microscope.
- a microspectroscopy apparatus is a device which is provided with an observation optical system for microscopically observing a sample surface and an analyzing system for performing a spectroscopic analysis on a portion of interest within the observed area.
- a microscopic infrared spectroscopic analyzer which performs an analysis using infrared light has: an illumination optical system acting as the aforementioned analyzing system for casting infrared light onto a sample; an aperture element having an opening (normally, a rectangular opening) for allowing the passage of only the light coming from a specific region which is of interest to the user (region of interest) among the light reflected by or transmitted through the sample illuminated with the infrared light; and an infrared detector for detecting the reflected or transmitted light which has passed through the opening.
- the microscopic infrared spectroscopic analyzer is hereinafter simply referred to as the "infrared microscope.”
- the infrared microscope an image of the sample surface observed in visible light is obtained by the observation optical system. From this image observed in visible light, the position, size and orientation (angle) of the opening of the aperture element are specified so as to fit the opening into the region of interest. Subsequently, infrared light is cast from the illumination optical system. Then, among the reflected or transmitted light, the light which has passed through the opening is detected by the detector. Based on the thereby obtained infrared spectrum (the intensity distribution with respect to the wavelength), the region of interest is analyzed.
- Patent Literature 1 an infrared microscope is described in which an area having characteristic image information (this area is hereinafter called the "characteristic image area”) is extracted by performing an edge extraction, binarization or other processes on an observed image of a sample.
- an analyzer which has such a system for extracting a characteristic image area from an observed image, when a user specifies an appropriate position within the observed image with a pointing device or the like, a certain area is extracted; for example, based on the brightness value at the specified position, an area having a predetermined range of brightness values around that brightness value is extracted (Patent Literature 2), or an area surrounded by an edge including the specified position is extracted.
- the following problem occurs: For example, if the sample surface has three-dimensional projections or recesses, the shades which occur due to those projections or recesses may be incorrectly included in the characteristic image area if the previously described process is used. This results in the characteristic image area being extracted with a larger area than the region of interest.
- Such an incorrect selection may possibly be avoided by adjusting a certain threshold (e.g. the aforementioned "predetermined range").
- a certain threshold e.g. the aforementioned "predetermined range”
- the previously described problem is not limited to infrared microscopes but can generally occur in any type of analyzer which allows users to set a region to be analyzed (this region is hereinafter called the "analysis target region") within a sample image obtained by an observation of a sample and then performs an analysis on that analysis target region.
- the problem to be solved by the present invention is to provide a system capable of quickly and accurately setting an analysis target region as intended by a user, based on an observed image of a sample obtained with an optical microscope or similar device, without requiring cumbersome tasks in the process of setting the analysis target region within that image.
- the present invention aimed at solving the previously described problem is a system for setting, within an observed image of a sample, an analysis target region that is a region on which an analysis is to be performed by an analyzer, the system including:
- the characteristic quantity calculator divides an observed image into a large number of areas (divisional areas) and obtains a predetermined image characteristic quantity (which is hereinafter shortened as the "characteristic quantity") for each divisional area.
- the divisional area in the present invention may consist of one pixel (i.e. the smallest unit of the observed image) or a set of neighboring pixels.
- a pixel characteristic quantity or texture characteristic quantity can be used (both of which will be described later).
- the characteristic quantity used in the present invention may be a single kind of quantity or a combination of two or more of kinds of quantities. The characteristic quantity should be previously specified by users or system manufacturers.
- a user initially selects a portion of the region which the user desires to analyze (the region of interest) within an observed image by drawing a point, line, area or the like with a mouse or similar device (the divisional area selector). By this drawing operation, a plurality of divisional areas are determined (which are hereinafter called the "representative selected areas").
- the characteristic quantity range calculator determines the value range of the characteristic quantity for the divisional areas to be extracted as the target of the analysis. For example, this range for the characteristic quantity can be determined by statistically processing the values of the characteristic quantity of the representative selected areas and setting a range that includes most of those values (which may include all the values).
- the area extractor checks every divisional area in the observed image for whether or not its characteristic quantity value is within that value range, and extracts each divisional area whose characteristic quantity value is within that range.
- the divisional areas thus extracted are designated as the analysis target region.
- an observed image of a sample is divided into a large number of divisional areas, from which users are allowed to select a plurality of divisional areas (representative selected areas). In this operation, only a partial and representative set of the divisional areas needs to be selected. Based on the characteristic quantity data of the representative selected areas, a value range to be set for the analysis target region is calculated. Each divisional area having a characteristic quantity value included in that range is extracted from the observed image and designated as the analysis target region.
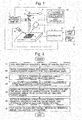
- Fig. 1 is a configuration diagram showing the main components of the infrared microscope of the present embodiment.
- an infrared interferometer 1 includes an infrared source, fixed mirror, movable mirror, beam splitter and other devices. It emits an infrared interference light produced by an interference of infrared rays having different wavelengths.
- the infrared interference light is reflected by a half mirror 4 and cast onto a sample 3 placed on a movable stage 2.
- the infrared interference light cast onto the sample 3 is reflected by the surface, the light undergoes absorption at one or more wavelengths (normally, at multiple wavelengths) specific to the substances present on that location.
- the infrared light reflected from the sample 3 passes through the half mirror 4 and reaches the aperture element 5, which admits only the reflected light coming from a specific region.
- This light is redirected by a reflection mirror 6 to an infrared detector 7, which receives and detects the light. Therefore, the infrared interference light arriving at the infrared detector 7 is reflective of the infrared absorption which occurs at the specific region in the sample 3.
- the detection signal produced by the infrared detector 7 is sent to a data processor 10.
- a Fourier transform calculator 100 performs a Fourier transform process on the detection signal to obtain an infrared absorption spectrum showing the absorbance over a predetermined range of wavelengths.
- the spectrum data thus obtained is sent to a controller 11 and displayed on the screen of a display unit 13 connected to the controller 11. Meanwhile, visible light is emitted from a visible light source 8 and illuminates a large area on the sample 3.
- the visible light reflected from the sample 3 is introduced into a CCD camera 9. In the CCD camera 9, an observed image of the surface of the sample 3 is formed, and the data of the observed image are sent to the controller 11.
- the observed image data sent to the controller 11 are also displayed on the screen of the display unit 13.
- the area to be illuminated with the infrared interference light can be changed by appropriately operating the movable stage 2 and aperture element 5 under the command of the controller 11.
- the controller 11 also controls the operations of the infrared interferometer 1, visible light source 8 and other components.
- the data processor 10 and controller 11 can be configured to achieve various functions (which will be described later) by executing, on a personal computer, a dedicated controlling and data-processing software program previously installed on the computer.
- the system shown in Fig. 1 is configured to perform a reflective infrared measurement and reflective visible observation.
- the configuration may be changed so as to perform a transmissive infrared measurement and/or transmissive visible observation. It is also possible to include a mechanism for allowing users to visually and directly observe the sample surface through an eyepiece.
- Step S1 After a sample 3 as a measurement target is placed on the movable stage 2, a visible image of the sample 3 is taken with the CCD camera 9.
- the obtained image data are sent to the controller 11, and the observed image as shown in Fig. 3 is displayed on the screen of the display unit 13 (Step S1). Furthermore, the controller 11 divides this observed image into a plurality of areas as shown in Fig. 4 (in the shown example, M ⁇ N areas) and calculates a characteristic quantity for each divisional area (Step S2).
- Each divisional area may consist of a single pixel or a set of neighboring pixels.
- a pixel characteristic quantity or texture characteristic quantity can be used.
- the pixel characteristic quantity is the image information possessed by each individual pixel, such as the brightness, hue and saturation.
- the texture characteristic quantity is a numerical representation of texture components, such as a point, line and roughness. This can be calculated, for example, using a local histogram (a histogram covering the region of interest and the surrounding area) or a histogram of an image in which edges are extracted by means of a second-order Sobel filter or the like. Since the texture characteristic quantity normally contains a large amount of information, its number of dimensions may be appropriately decreased by a principal component analysis or similar technique in order to increase the processing speed. Other than these examples, any characteristic quantity commonly used in the image processing can be used.
- the characteristic quantity data calculated for each divisional area in Step S2 are stored in a storage unit (not shown).
- a partial and representative set of divisional areas (representative selected areas) within the observed image displayed on the screen of the display unit 13 (Step S3).
- Fig. 5 shows an example of the observed image on which the user has selected the representative selected areas by drawing the line 21.
- the controller 11 selects all the divisional areas including the line 21 as the representative selected areas ( Fig. 6 ).
- the controller 11 reads, from the storage unit, the values of the characteristic quantity of the representative selected areas specified by the user, and calculates their distribution (Step S4; Figs. 7A and 7B ).
- Figs. 7A and 7B each show one-dimensional distribution of the representative selected areas with only the brightness value used as the characteristic quantity (brightness distribution).
- Step S5 a value range of the characteristic quantity for the divisional areas to be extracted as the measurement target region is determined for the distribution calculated in Step S4.
- Fig. 7A the mean value and standard deviation ⁇ of the brightness distribution are calculated, and the range of ⁇ 3 ⁇ from the mean value is defined as the value range of the brightness to be extracted as the measurement target region. If a multi-peak distribution having two or more peaks as shown in Fig. 7B is obtained in Step S4, it is possible to divide the distribution into k sections (in the case of Fig. 7B , two sections) by k-means clustering or other techniques, and to calculate the value range of the brightness for each section by the previously described method.
- Step S6 the characteristic quantity values of all the divisional areas are read from the storage unit, and each divisional area is checked for whether or not its characteristic quantity value is within the range calculated in Step S5. Then, every divisional area having a characteristic quantity value included in that range is extracted and designated as the analysis target region.
- the controller 11 puts a specific color on the analysis target region in the observed image displayed on the screen of the display unit 13 (Step S7; Fig. 8 ). The user visually checks the image of Fig. 8 and completes the process if the analysis target region is set as intended. If the analysis target region is not set as intended, the user should appropriately increase or decrease the range of the representative selected areas.
- Step S7 results in the extraction of a plurality of mutually independent areas, all of those areas may be displayed on the screen.
- a single area i.e. an area which is not internally separated
- the representative selected areas specified by the user may be exclusively displayed.
- the controller 11 adjusts the opening size of the aperture element 5 and the position of the sample 3 placed on the movable stage 2, after which the infrared interference light is cast from the infrared interferometer to perform an analysis of the analysis target region.
- the value range calculated in Step S5 is defined as ⁇ 3 ⁇ from the mean value of the brightness distribution. Naturally, it is possible to allow users to appropriately set this range based on the distribution calculated in Step S4.
- the user sets the representative selected areas within the region which is of interest to the user to extract the analysis target region.
- this method is the opposite of the previously described method; it includes temporarily setting representative selected areas within an area "other than” the region of interest and extracting, as the analysis target region, a region "exclusive of” the representative selected areas. This method is hereinafter described with reference to Figs. 9-11 .
- the lump 23 is the region of interest to the user.
- the user temporarily sets the representative selected areas by drawing a line 22 within an area "other than" the region of interest (lump) 23 (Step S3).
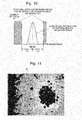
- the consequently obtained characteristic quantity distribution (brightness distribution) is shown in Fig. 10 (Step S4).
- the brightness distribution of the representative selected areas in Fig. 10 does not include the brightness distribution within the region of interest 23. Therefore, in Step S5, the value range for the divisional areas to be extracted as the analysis target region is set in the opposite way, i.e. in such a manner as to "exclude” the brightness distribution of the representative selected areas (in the example of Fig.
- Step S6 the divisional areas included in the aforementioned ranges exclusive of the representative selected areas are designated as the analysis target region.
- Fig. 11 shows analysis target regions designated in the observed image by the present method. In Fig. 11 , not only the region of interest 23 but also many other areas are designated and colored as the analysis target regions. In such a case, the user selects the region of interest 23 by a mouse click or similar operation, whereupon the controller 11 automatically sets the position and size of the opening of the aperture element 5 to fit the opening into the clicked region. As shown in Fig.
- the line 22 is a closed curve and an extracted region exists inside that curve, it is possible to automatically designate the region inside the closed curve as the analysis target region, and automatically set the position and size of the opening of the aperture element 5 to fit the opening into that region.
- the present invention can be applied in various analyzers other than the infrared microscope, such as a microspectroscopy apparatus or imaging mass microscope.
Landscapes
- Physics & Mathematics (AREA)
- Spectroscopy & Molecular Physics (AREA)
- General Physics & Mathematics (AREA)
- Chemical & Material Sciences (AREA)
- Engineering & Computer Science (AREA)
- Analytical Chemistry (AREA)
- Multimedia (AREA)
- Optics & Photonics (AREA)
- General Health & Medical Sciences (AREA)
- Immunology (AREA)
- Pathology (AREA)
- Health & Medical Sciences (AREA)
- Computer Vision & Pattern Recognition (AREA)
- Life Sciences & Earth Sciences (AREA)
- Biochemistry (AREA)
- Investigating Or Analysing Materials By Optical Means (AREA)
- Microscoopes, Condenser (AREA)
Applications Claiming Priority (1)
| Application Number | Priority Date | Filing Date | Title |
|---|---|---|---|
| PCT/JP2012/079617 WO2014076789A1 (fr) | 2012-11-15 | 2012-11-15 | Dispositif de paramétrage de régions d'analyse |
Publications (2)
| Publication Number | Publication Date |
|---|---|
| EP2921843A1 true EP2921843A1 (fr) | 2015-09-23 |
| EP2921843A4 EP2921843A4 (fr) | 2015-11-25 |
Family
ID=50730729
Family Applications (1)
| Application Number | Title | Priority Date | Filing Date |
|---|---|---|---|
| EP12888367.5A Ceased EP2921843A4 (fr) | 2012-11-15 | 2012-11-15 | Dispositif de paramétrage de régions d'analyse |
Country Status (4)
| Country | Link |
|---|---|
| US (2) | US20150301323A1 (fr) |
| EP (1) | EP2921843A4 (fr) |
| JP (1) | JP5900644B2 (fr) |
| WO (1) | WO2014076789A1 (fr) |
Families Citing this family (9)
| Publication number | Priority date | Publication date | Assignee | Title |
|---|---|---|---|---|
| US9995922B2 (en) * | 2013-03-08 | 2018-06-12 | Shimadzu Corporation | Analysis target region setting apparatus |
| JP6798096B2 (ja) * | 2015-01-30 | 2020-12-09 | 株式会社ニデック | 眼底撮影装置 |
| JP6623551B2 (ja) * | 2015-05-15 | 2019-12-25 | ソニー株式会社 | 情報処理装置、情報処理システム及び情報処理方法 |
| US20180045937A1 (en) * | 2016-08-10 | 2018-02-15 | Zeta Instruments, Inc. | Automated 3-d measurement |
| EP3529591B1 (fr) | 2016-10-20 | 2021-08-04 | Optina Diagnostics, Inc. | Procédé et système de détection d'une anomalie dans un tissu biologique |
| JP6927415B2 (ja) * | 2018-03-29 | 2021-08-25 | 株式会社島津製作所 | イメージング質量分析におけるデータ処理方法及びデータ処理プログラム |
| EP3779427A4 (fr) * | 2018-03-30 | 2021-04-14 | Shimadzu Corporation | Unité de traitement de données d'imagerie et programme de traitement de données d'imagerie |
| CN114544991B (zh) * | 2020-11-25 | 2025-12-09 | 深圳迈瑞生物医疗电子股份有限公司 | 一种样本分析装置及其控制方法 |
| JP2023108281A (ja) * | 2022-01-25 | 2023-08-04 | 株式会社エビデント | 観察システム、顕微鏡、観察方法、及びプログラム |
Family Cites Families (10)
| Publication number | Priority date | Publication date | Assignee | Title |
|---|---|---|---|---|
| JPH1096691A (ja) * | 1991-03-19 | 1998-04-14 | Tokai Rika Co Ltd | 面分析方法及び面分析装置 |
| US6136540A (en) * | 1994-10-03 | 2000-10-24 | Ikonisys Inc. | Automated fluorescence in situ hybridization detection of genetic abnormalities |
| US5706083A (en) * | 1995-12-21 | 1998-01-06 | Shimadzu Corporation | Spectrophotometer and its application to a colorimeter |
| US6011595A (en) * | 1997-09-19 | 2000-01-04 | Eastman Kodak Company | Method for segmenting a digital image into a foreground region and a key color region |
| US7272252B2 (en) * | 2002-06-12 | 2007-09-18 | Clarient, Inc. | Automated system for combining bright field and fluorescent microscopy |
| US7403646B2 (en) * | 2002-10-24 | 2008-07-22 | Canon Kabushiki Kaisha | Image processing apparatus, image processing method, program, and recording medium for generating a difference image from a first radiographic image and second radiographic image |
| JP4863692B2 (ja) | 2005-11-02 | 2012-01-25 | 株式会社島津製作所 | イメージ質量分析装置 |
| WO2008085914A1 (fr) * | 2007-01-05 | 2008-07-17 | Malvern Instruments, Inc. | Investigation spectrométrique d'une hétérogénéité |
| JP4481319B2 (ja) * | 2007-02-13 | 2010-06-16 | 富士通株式会社 | データ設定装置 |
| JP2010276371A (ja) | 2009-05-26 | 2010-12-09 | Shimadzu Corp | 赤外顕微鏡 |
-
2012
- 2012-11-15 JP JP2014546779A patent/JP5900644B2/ja not_active Expired - Fee Related
- 2012-11-15 WO PCT/JP2012/079617 patent/WO2014076789A1/fr not_active Ceased
- 2012-11-15 EP EP12888367.5A patent/EP2921843A4/fr not_active Ceased
- 2012-11-15 US US14/442,812 patent/US20150301323A1/en not_active Abandoned
-
2019
- 2019-03-05 US US16/292,613 patent/US20190196170A1/en not_active Abandoned
Also Published As
| Publication number | Publication date |
|---|---|
| WO2014076789A1 (fr) | 2014-05-22 |
| US20190196170A1 (en) | 2019-06-27 |
| JP5900644B2 (ja) | 2016-04-06 |
| EP2921843A4 (fr) | 2015-11-25 |
| US20150301323A1 (en) | 2015-10-22 |
| JPWO2014076789A1 (ja) | 2016-09-08 |
Similar Documents
| Publication | Publication Date | Title |
|---|---|---|
| US20190196170A1 (en) | Method for setting analysis target region by extracting, from an observed image divisional areas having a value of image characteristic quantity within a value range | |
| JP5804070B2 (ja) | クロマトグラムデータ処理装置及び処理方法 | |
| EP1990630B1 (fr) | Procede de traitement d'image spectrale, programme de traitement d'image spectrale et systeme d'imagerie spectrale | |
| JP5766958B2 (ja) | 顕微鏡システム、情報処理装置、及び情報処理プログラム | |
| US20170156476A1 (en) | Apparatus and method for analyzing hair and/or predicting an outcome of a hair-coloring treatment | |
| US10184885B2 (en) | Information processing device to process spectral information, and information processing method | |
| EP3531344A1 (fr) | Système de traitement d'images et procédé de réglage | |
| EP3353712B1 (fr) | Détection automatisée de taches dans des images en champ clair d'une pathologie | |
| CN111344103B (zh) | 基于高光谱光学传感器的涂层区域定位方法和装置、及除胶系统 | |
| JP6896906B2 (ja) | 分光画像データ処理装置および2次元分光装置 | |
| CN108604375B (zh) | 用于多维数据的图像分析的系统和方法 | |
| CN107969148A (zh) | 图像分析系统和方法 | |
| KR20260038265A (ko) | 초분광 이미지 분석에 기반한 컬러 및 두께 상태를 판정하는 시스템 및 방법 | |
| JP5983858B2 (ja) | 分析対象領域設定装置 | |
| US9558551B2 (en) | Image measurement apparatus and image measurement method for determining a proportion of positive cell nuclei among cell nuclei included in a pathologic examination specimen | |
| KR20180130553A (ko) | 색 얼룩 부위 평가 방법 및 색 얼룩 부위 평가 장치 | |
| JP2018169390A (ja) | 染色体異常判定装置 | |
| KR20220066168A (ko) | 측정 대상 물질의 스펙트럼 정보를 추출하는 방법 | |
| JP2013040832A (ja) | 食品判別装置および食品判別方法 | |
| Bacci et al. | Durum wheat quality evaluation software | |
| US8929639B2 (en) | Image processing apparatus, image processing method, image processing program, and virtual microscope system | |
| JP2007192552A (ja) | 分光測定装置 | |
| Troscianko et al. | Image calibration and analysis toolbox user guide |
Legal Events
| Date | Code | Title | Description |
|---|---|---|---|
| PUAI | Public reference made under article 153(3) epc to a published international application that has entered the european phase |
Free format text: ORIGINAL CODE: 0009012 |
|
| 17P | Request for examination filed |
Effective date: 20150529 |
|
| AK | Designated contracting states |
Kind code of ref document: A1 Designated state(s): AL AT BE BG CH CY CZ DE DK EE ES FI FR GB GR HR HU IE IS IT LI LT LU LV MC MK MT NL NO PL PT RO RS SE SI SK SM TR |
|
| AX | Request for extension of the european patent |
Extension state: BA ME |
|
| RA4 | Supplementary search report drawn up and despatched (corrected) |
Effective date: 20151028 |
|
| RIC1 | Information provided on ipc code assigned before grant |
Ipc: G01N 21/3563 20140101AFI20151022BHEP |
|
| DAX | Request for extension of the european patent (deleted) | ||
| STAA | Information on the status of an ep patent application or granted ep patent |
Free format text: STATUS: EXAMINATION IS IN PROGRESS |
|
| 17Q | First examination report despatched |
Effective date: 20190529 |
|
| REG | Reference to a national code |
Ref country code: DE Ref legal event code: R003 |
|
| STAA | Information on the status of an ep patent application or granted ep patent |
Free format text: STATUS: THE APPLICATION HAS BEEN REFUSED |
|
| 18R | Application refused |
Effective date: 20210917 |