EP3073776A1 - Verfahren und vorrichtung zur vorhersage der zustände von drahtlosverbindungen - Google Patents
Verfahren und vorrichtung zur vorhersage der zustände von drahtlosverbindungen Download PDFInfo
- Publication number
- EP3073776A1 EP3073776A1 EP15305429.1A EP15305429A EP3073776A1 EP 3073776 A1 EP3073776 A1 EP 3073776A1 EP 15305429 A EP15305429 A EP 15305429A EP 3073776 A1 EP3073776 A1 EP 3073776A1
- Authority
- EP
- European Patent Office
- Prior art keywords
- wireless link
- quality
- predicting
- prediction
- local predictor
- Prior art date
- Legal status (The legal status is an assumption and is not a legal conclusion. Google has not performed a legal analysis and makes no representation as to the accuracy of the status listed.)
- Withdrawn
Links
- 238000000034 method Methods 0.000 title claims abstract description 23
- 238000005259 measurement Methods 0.000 claims description 34
- 238000012935 Averaging Methods 0.000 claims description 2
- 230000033001 locomotion Effects 0.000 description 11
- 238000013459 approach Methods 0.000 description 6
- 230000006870 function Effects 0.000 description 6
- 230000007774 longterm Effects 0.000 description 6
- 230000007704 transition Effects 0.000 description 6
- 230000000454 anti-cipatory effect Effects 0.000 description 5
- 230000000875 corresponding effect Effects 0.000 description 4
- 230000000694 effects Effects 0.000 description 4
- 230000004807 localization Effects 0.000 description 4
- 238000013442 quality metrics Methods 0.000 description 4
- 230000008569 process Effects 0.000 description 3
- 230000008901 benefit Effects 0.000 description 2
- 230000002596 correlated effect Effects 0.000 description 2
- 238000013144 data compression Methods 0.000 description 2
- 230000001419 dependent effect Effects 0.000 description 2
- 238000005562 fading Methods 0.000 description 2
- 238000010801 machine learning Methods 0.000 description 2
- 238000012706 support-vector machine Methods 0.000 description 2
- 230000006978 adaptation Effects 0.000 description 1
- 238000004458 analytical method Methods 0.000 description 1
- 230000005540 biological transmission Effects 0.000 description 1
- 230000001413 cellular effect Effects 0.000 description 1
- 238000000354 decomposition reaction Methods 0.000 description 1
- 230000007423 decrease Effects 0.000 description 1
- 230000003247 decreasing effect Effects 0.000 description 1
- 230000006855 networking Effects 0.000 description 1
- 238000005457 optimization Methods 0.000 description 1
- 238000011160 research Methods 0.000 description 1
- 238000013468 resource allocation Methods 0.000 description 1
- 230000002123 temporal effect Effects 0.000 description 1
- 238000012360 testing method Methods 0.000 description 1
Images

Classifications
-
- H—ELECTRICITY
- H04—ELECTRIC COMMUNICATION TECHNIQUE
- H04W—WIRELESS COMMUNICATION NETWORKS
- H04W16/00—Network planning, e.g. coverage or traffic planning tools; Network deployment, e.g. resource partitioning or cells structures
- H04W16/22—Traffic simulation tools or models
-
- H—ELECTRICITY
- H04—ELECTRIC COMMUNICATION TECHNIQUE
- H04W—WIRELESS COMMUNICATION NETWORKS
- H04W24/00—Supervisory, monitoring or testing arrangements
- H04W24/10—Scheduling measurement reports ; Arrangements for measurement reports
Definitions
- the present invention relates to a method and apparatus for predicting a wireless link state.
- link quality prediction is important for network proactive optimization, link routing and scheduling services. Unexpected poor link quality may cause low data rates, and call drops.
- the network may proactively reallocate the links to improve the resource efficiency, as well as to provide seamless robust service for better user experience.
- Typical approaches for wireless link prediction apply numerical methods to analyse time series of channel state measurements. From the methodical perspective, auto-regression and autocorrelation methods dominate, but also supervised machine learning techniques such as Support Vector Machines (SVMs) are used often.
- SVMs Support Vector Machines
- link quality metric is often chosen separately depending on how the prediction will be applied. Different link quality metrics are summarized as follows.
- Physical indicators are based on the signal strength, such as the received signal strength indication (RSSI), the link quality indication (LQI) and the signal-to-noise ratio (SNR).
- Logical indicators estimate the link quality by tracking the message loss, such as packet success rate (PSR) or expected transmission count (ETC).
- PSR packet success rate
- ETC expected transmission count
- link metrics differ in the time scale, which highly affects the prediction complexity and accuracy.
- Some link quality metrics such as RSSI, can vary in the order of one ms. This allows to capture radio propagation effects such as fast fading but allows to ignore the time-variance of path loss due to user mobility.
- Link metrics at larger time scale require including the effects of user mobility, such as an effect of varying path loss and deployment, but allow ignoring very fast effects such as fast fading.
- a method for predicting a quality of a wireless link classifies a spatial domain into subdomains. Classifying the spatial domain into subdomains is performed on different levels. Edge level subdomains, route level subdomains, map level subdomains and cell level subdomains represent different areas of different extent. At least one local predictor is chosen for each subdomain. The local predictor is adapted to the given characteristics of a subdomain in order to provide an adequate prediction. The wireless link quality of at least one subdomain is predicted by at least one local predictor. The at least one local predictor uses side information for the prediction. Such side information is derivable from street maps. Side information is e.g. information where on the map a mobile user can move, e.g.
- side information indicates where a user cannot move, e.g. on a wall or building, on a river or the like.
- the quality of the wireless link is predicted by combining the results of the at least one predictors. Using side information for predicting the quality of the radio link in the subdomain reduces the prediction problem drastically. Many places where users are not located or located with low probability are excluded from the prediction process and link quality for such places is not determined.
- the at least one local predictor predicts the wireless link quality based on a radio map.
- the radio map shows a measure for channel quality of at least one serving cell depending on the location on the map.
- a user equipment at this location derives the channel quality which it will experience from the radio map.
- location based channel quality is given in the radio map.
- a channel quality or as related parameter channel state or channel gain is expressed in different physical measures, e.g. path loss, interference, signal strength at the user, load at the base station or backlog in the transmit queue.
- the user experiences different channel qualities due to the distance to the base station, obstacles within the transmit path which enhance path loss and interference and the like.
- the spatial domain is classified into subdomains on different hierarchical levels.
- Such hierarchical levels are at least one of an edge level subdomain, a route level subdomain, a map level subdomain and a cell level subdomain.
- Edge level means that the subdomain is defined by an edge between two nodes, which represents a small subdomain.
- Route level subdomain is defined according to a route or part of a route on which a user moves and is thus logically connected to the users movement.
- Cell level subdomain is defined by the serving area of a cell and is thus logically connected to the random access network.
- Map level subdomain is defined by the radio map providing the information and represents the overall area which is addressed by a specific radio map.
- the local predictor of an edge level subdomain predicts a wireless link along a street section based on measurement reports of user equipments passing the street section.
- the measurement reports used for the prediction are measurement reports of the same user.
- the measurement reports used for the prediction are measurement reports of one or more other users.
- the local predictor of a route level subdomain predicts a wireless link on a route based on measurement reports of user equipments passing through the same route.
- the measurement reports used for the prediction are measurement reports of the same user.
- the measurement reports used for the prediction are measurement reports of one or more other users.
- the local predictor of a cell level subdomain predicts a wireless link within a cell served by one base station based on measurement reports of user equipments served by the base station.
- the measurement reports used for the prediction are measurement reports of the same user.
- the measurement reports used for the prediction are measurement reports of one or more other users.
- the measurement reports for a subdomain may contain information of different locations within this subdomain. Especially in bigger subdomains like route level subdomain or cell level subdomain, multiple measurements in the area of the subdomain are available and are used by the local predictor.
- the local predictor uses historical link quality data for predicting the wireless link in the local predictors of corresponding subdomains.
- the historical link quality data is from the same user. In one embodiment, the historical link quality data is from one or more other users.
- further side information is at least one of current user equipment position, current user equipment speed and direction of motion.
- further side information is also additional street map information indicating future parts of a trajectory, e.g. at street crossings, one way roads, speed limits, etc.
- a step of adjusting the results of the at least one local predictor by historical prediction error data for the at least one local predictor is performed.
- the adjusting step is performed for each local predictor which is used for the prediction.
- Historical error data comes from comparison of previous predictions and real time measurements performed for the prediction time and location. So thus say, the prediction error in the past for a certain location is incorporated in the prediction for the same or a neighboring location.
- the prediction of the quality of the wireless link includes combining the adjusted results of the at least one local predictor.
- an apparatus for predicting the quality of a wireless link comprises at least one local predictor for predicting a wireless link in a subdomain.
- the at least one local predictor uses side information derivable from street maps for predicting the wireless link quality for the at least one subdomain.
- the apparatus further comprises a storage unit for storing and providing historical prediction error data for each local predictor.
- the apparatus further comprises a prediction unit for receiving the results from the at least one local predictor and historical prediction error data for the at least one local predictor.
- the prediction unit is for combining the received results and prediction error data and for providing a combined prediction result of the wireless link.
- the at least one local predictor predicts the wireless link quality based on a radio map.
- the radio map shows a measure for channel quality of at least one serving cell depending at a given location. This means, for a given location, the radio map shows the channel quality a user may expect if located at this given location at a certain time.
- a channel quality or, as related parameter, channel state or channel gain is expressed in different physical measures, e.g. path loss, interference, signal strength at the user, load at the base station or backlog in the transmit queue.
- path loss, interference e.g. path loss, interference, signal strength at the user, load at the base station or backlog in the transmit queue.
- the user experiences different channel qualities due to the distance to the base station, obstacles within the transmit path which enhance path loss and interference and the like.
- the prediction unit is for adjusting each prediction value generated by a local predictor with the historical prediction error data and for generating a combined prediction result by averaging the adjusted prediction values.
- the prediction unit is for adjusting each prediction value with data available from side information.
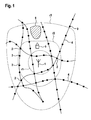
- Fig. 1 discloses a radio map showing channel quality at different locations.
- a channel quality or as related parameter channel state or channel gain is expressed in different physical measures, e.g. path loss, interference, signal strength at the user, load at the base station or backlog in the transmit queue. Depending on the location, the user experiences different channel qualities due to the distance to the base station 1, obstacles within the transmit path which enhance path loss and interference and the like.
- a radio map may be extended by a street map showing streets 4, street crossings 2 and maybe buildings 5 and corresponding information like speed limits, one way streets, etc.
- channel quality is shown over the whole radio map.
- channel quality is shown mainly in the areas of streets 4 and street crossings 2 and areas where a mobile user might be, e.g.
- Fig. 1 for illustrative purposes and to schematically indicate the radio map, a base station 1 is shown. Path loss rises with the distance to the base station 1, which is indicated by the circles r1, r2, r3 around the base station 1. The higher the distance to the base station 1, the lower the signal strength and the higher the path loss. Also other circumstances lead to higher path loss, like a building 5 or obstacle for example. In the area 6 behind a building, the signal strength and hence the channel quality is worse compared to other areas. Fig. 1 only depicts some indications how a radio map and the given information, e.g. channel quality at different locations is to be understood.
- a radio map according to the invention is a two dimensional street map, which indicates the channel quality distributed over the whole map.
- the channel quality is given on a regular grid available and overlaid to the street map.
- the channel quality is given on points useful for link quality prediction, e.g. on street crossings 2 and certain points 3 on a street 4. If the number of points 3 for giving the channel quality is increased, in the end, a channel quality distribution on a whole street 4 is available.
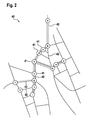
- the street map is converted to a network graph 40 as given in Fig. 2 by a network graph generator. Street crossings are converted to nodes 41 of the network graph 40. Streets connecting the street crossings are converted to edges 42 of the network graph 40. In one embodiment, all street crossings and streets are converted into the network graph 40.
- only major street crossings and corresponding streets are converted into the network graph 40.
- the edges of the network graph 40 also reflect constraints given by traffic rules, i.e. one way streets etc.
- Street maps are available in many shapes, sizes and scales. Small street maps are used for describing trajectories in dense urban area while the large scale highway maps are used for describing trajectories with higher speed in the less-dense suburban area. By generating the network graph 40, information of differently shaped street maps is systematically merged together in a network graph 40.
- FIG. 2 An example of the converted network graph 40 from a sub-region the street map is depicted in Fig. 2 .
- three user trajectories are indicated as dotted line, dashed line and crossed line.
- the first user trajectory (dotted line) passes the nodes 41 a, b, c, d, e, m, n and o.
- the second user trajectory (dashed line) passes the nodes 41 a, b, c, d, e, f, g and 1.
- the third user trajectory (crossed line) passes the nodes 41 o, n, m, e, f, g, h and i.
- a prediction unit is used for predicting a movement of a mobile user 23 between multiple consecutive nodes 41.
- the predicted movement of a mobile user between multiple consecutive nodes 41 is used as a long-term trajectory prediction at large granularity.
- it is used as side information for predicting the short-term trajectory of a mobile user, i.e. the movement of a mobile user between two neighboring nodes 41, as described in more detail below.
- Such side information is, e.g. the probability of turning of a mobile user.
- Historical data describing a route R k of at least one mobile user k in the past are collected from time t 0 up to time t ⁇ t 0 .
- the hitting time from one node 41 to the other may shift, but the distribution of the traveling time between the two nodes 41 usually remains stationary.
- the prediction of movement of a mobile user between multiple consecutive nodes 41 is based on Markov Models such as data compression algorithms, e.g. including PPM and LZ78, or Hidden Markov Models.
- r ⁇ 0 k , ... , r ⁇ n k is inferred from the Markov Models.
- the data compression algorithm e.g. PPM or LZ78 is used to construct a suffix tree and P r ⁇ n + 1 k
- N ' is the variable order of the Markov Model.
- the model complexity is decreased by using a semi-Markov Model.
- the traveling time ⁇ n + 1 k depends only on the node s n + 1 k
- the node s n + 1 k depends on the previous node states s n - N ⁇ k , ... , s n k .
- s n - 1 k are derived from the transition probability and the emission probability parameters. From that, the probability P r ⁇ n + 1 k
- a radio map is used to look up the channel quality a user expects a certain predicted location at a certain time.
- Fig. 3 discloses an overview of the prediction framework 30 for predicting a wireless channel quality.
- multiple predictions are performed simultaneously in N predictors 33, 35, 37.
- the predictors 33, 35, 37 provide the predicted values to a data processor 31.
- the data processor further comprises historical prediction errors 34, 36, 38 for each local predictor 33, 35, 37.
- the historical prediction errors 34, 36, 38 are received by the data processor 31 from a network 39.
- the historical prediction errors 34, 36, 38 are stored in a look up table for different times for a local predictor 33, 35, 37.
- the historical prediction errors 34, 36, 38 are expressed as a mathematic formula including the time of a day and/or the day of a week as a variable.
- the formula is generated by interpolating historical measurements.
- the historical prediction errors 34, 36, 38 represent the errors of the predictors in the past, not the predicted value itself.
- a prediction unit 32 adjusts the results of each local predictor 33, 35, 37 with the historical prediction errors 34, 36, 38. This approach allows including N models and data sets in the selection process and to decide a-posteriori with full knowledge, i.e. after the N local predictions have been performed by the local predictors 33, 35, 37.
- a classification is made with regard to the subdomain of the local predictor 33, 35, 37. So to say, the spatial domain of the universal predictor is classified into different levels of subdomains and local predictors 33, 35, 37 are inferred for each subdomain. The following three levels of suddomains are defined.
- a cell-based local predictor 33, 35, 37 the spatial domain is classified into distinct finite areas served by different cells.
- a local predictor 33, 35, 37 is trained per cell using adaptively the measurements and the reports from the user equipments served by the cell. Such a classification allows each local predictor 33, 35, 37 to capture the cell-specific antenna propagation model and traffic load status distinctly.
- a route-based local predictor 33, 35, 37 the spatial domain is classified into distinct finite routes.
- User trajectories a, b, c, d, e, m, n, o and a, b, c, d, e, f, g, l and o, n, m, e, f, g, h, i in Fig. 2 are examples for such routes.
- a local predictor 33, 35, 37 is inferred by using adaptively the measurements and the reports from the user equipments passing through the same routes. This level of the classification takes into account the strongly correlated mobility pattern of different user equipments traveling along the same route. For example, the velocity does not differ much along a single route.
- the route-based local predictor provides a detailed model for distinct mobility pattern.
- the difference of the mobility patterns at different times of a day and days of a week is also taken into account. This is relevant e.g. to address different conditions in the rush hour.
- the spatial domain is classified into distinct edges between the road crossings.
- a road map is converted to a topological graph as described in Fig. 2 , where the nodes are defined as the street crossings and the edges are defined as the connections between the nodes. It is intuitive that a group of user equipments experience similar link quality model while passing through the same edge. This results from the fact that the user equipments are constrained to a similar area of the map under the same traffic condition constrains such as velocity, yaw angle, and traffic light signal timing.
- a distinct local predictor 33, 35, 37 is interred for each subdomain (cell, route, or edge) using the historical link quality data and a set of side information.
- Side information is information in which direction a user equipment may move according to the network graph given in Fig. 2 , but also other information affecting the link quality and the users movement and probability of presence of a user equipment at a certain place.
- Each local predictor 33, 35, 37 may use different hyperparameters for the prediction model, or even a different model to adapt the non-stationary local changes. Such an approach is more computationally attractive for large spatial data.
- Choosing proper local predictors 33, 35, 37 helps to improve the prediction accuracy and adaptability.
- the local predictors 33, 35, 37 cause discontinuities in prediction on the boundaries of subdomains.
- Introducing a two-tier structure as described below and using the transition prediction between multiple consecutive nodes as described with regard to Fig. 2 provides extra information for the prediction on the boundaries of subdomains.
- a higher level predictor 33, 35, 37 like a cell-based predictor or a global predictor based on a whole map is chosen in addition or instead of the smaller area (edge-based) local predictors 33, 35, 37.
- a lower level local predictor 33, 35, 37 is chosen such as a route-based or edge-based local predictor 33, 35, 37.
- an indirect prediction of the wireless link quality is performed.
- a user trajectory is predicted as described above.
- a radio map i.e. link quality map
- the link quality is predicted.
- the indirect prediction is in fact transferred to a pure trajectory prediction problem, provided that a radio map, as schematically depicted in Fig. 1 , is available.
- the radio map is derived from test driving.
- the long-term trajectory prediction as described above with regard to Fig. 2 provides the future location of the user equipment. The future location in large scale is implied by the next hitting nodes 41.
- this transition probability provides useful information a small-term trajectory prediction when the user equipment is about to cross the borders between two subdomains, e.g. edge-level subdomains and transit to the next node 41.
- a small-term trajectory prediction is performed when the user equipment is about to cross the borders between two subdomains, e.g. edge-level subdomains and transit to the next node 41.
- the small-term trajectory prediction addresses the case in which the user traverses between two neighboring nodes 41.
- small-term trajectory prediction is performed when either (i) no or only incomplete side information about the user's spatial constraints, e.g. a street map and the user's position is available or when (ii) a prediction based on the complete side information is too complex.
- no or only incomplete side information about the user's spatial constraints e.g. a street map and the user's position is available
- a prediction based on the complete side information is too complex.
- a prediction is performed as illustrated in Fig. 3 when the user reaches the confidence radius of the neighboring node 41. So to say, the process as disclosed in Fig. 3 is only performed when the user reaches a node 41.
- the predictor waits until the user has decided about the next stable phase of his trajectory and reaches the confidence radius r of the next node 41. Consequently, the trajectory does not have to be predicted. This highly decreases the complexity of the problem by several orders of magnitude. Instead of predicting the user's decision of a crossroad only it's movement time has to be predicted based on its velocity and bearing.
- the above short-term trajectory prediction Given historical time-stamped localizations, estimated waiting time at the predicted neighboring node 41 and estimated transition probability of the neighboring node 41 (travelling/staying time) the above short-term trajectory prediction outputs a one-step-ahead forecast of trajectory and a N-step-ahead forecast of trajectory. The predicted trajectory is then provided to the given radio map and the predicted link quality is derived thereof.
- a direct prediction of the wireless link quality is performed.
- the link quality prediction is a regression function based on:
- the local predictor 33, 35, 37 applying direct prediction of link quality provides a one-step-ahead forecasting of the link quality.
- the local predictor 33, 35, 37 is able to provide accurate one-step-ahead link quality forecasting.
- the local predictor 33, 35, 37 provides a N-step-ahead forecasting of the link quality. For longer prediction time horizon the local predictor 33, 35, 37 provides the successive N predicted values of the link quality.
- DSP digital signal processor
- ASIC application specific integrated circuit
- FPGA field programmable gate array
- ROM read only memory
- RAM random access memory
Landscapes
- Engineering & Computer Science (AREA)
- Computer Networks & Wireless Communication (AREA)
- Signal Processing (AREA)
- Mobile Radio Communication Systems (AREA)
Priority Applications (1)
| Application Number | Priority Date | Filing Date | Title |
|---|---|---|---|
| EP15305429.1A EP3073776A1 (de) | 2015-03-24 | 2015-03-24 | Verfahren und vorrichtung zur vorhersage der zustände von drahtlosverbindungen |
Applications Claiming Priority (1)
| Application Number | Priority Date | Filing Date | Title |
|---|---|---|---|
| EP15305429.1A EP3073776A1 (de) | 2015-03-24 | 2015-03-24 | Verfahren und vorrichtung zur vorhersage der zustände von drahtlosverbindungen |
Publications (1)
| Publication Number | Publication Date |
|---|---|
| EP3073776A1 true EP3073776A1 (de) | 2016-09-28 |
Family
ID=52807763
Family Applications (1)
| Application Number | Title | Priority Date | Filing Date |
|---|---|---|---|
| EP15305429.1A Withdrawn EP3073776A1 (de) | 2015-03-24 | 2015-03-24 | Verfahren und vorrichtung zur vorhersage der zustände von drahtlosverbindungen |
Country Status (1)
| Country | Link |
|---|---|
| EP (1) | EP3073776A1 (de) |
Cited By (3)
| Publication number | Priority date | Publication date | Assignee | Title |
|---|---|---|---|---|
| CN107623586A (zh) * | 2017-07-20 | 2018-01-23 | 深圳大学 | 网络链路预测方法及装置 |
| JP2019140563A (ja) * | 2018-02-13 | 2019-08-22 | 株式会社デンソー | 移動システム通信装置 |
| CN115460401A (zh) * | 2022-08-24 | 2022-12-09 | 北京邮电大学 | 一种优化视频码率分配的方法 |
Citations (2)
| Publication number | Priority date | Publication date | Assignee | Title |
|---|---|---|---|---|
| US20140099967A1 (en) * | 2012-09-06 | 2014-04-10 | Dell Products, Lp | Method and Apparatus for Predicting Mobile Device Wireless Link Quality of Service Requirements Along a Predicted Path |
| US20150055608A1 (en) * | 2012-09-06 | 2015-02-26 | Dell Products, Lp | Method and Apparatus for Unified Communication System Involving Context Aware Radio Communication Management for Multiple User Devices |
-
2015
- 2015-03-24 EP EP15305429.1A patent/EP3073776A1/de not_active Withdrawn
Patent Citations (2)
| Publication number | Priority date | Publication date | Assignee | Title |
|---|---|---|---|---|
| US20140099967A1 (en) * | 2012-09-06 | 2014-04-10 | Dell Products, Lp | Method and Apparatus for Predicting Mobile Device Wireless Link Quality of Service Requirements Along a Predicted Path |
| US20150055608A1 (en) * | 2012-09-06 | 2015-02-26 | Dell Products, Lp | Method and Apparatus for Unified Communication System Involving Context Aware Radio Communication Management for Multiple User Devices |
Non-Patent Citations (1)
| Title |
|---|
| N. BARMAN, S. VALENTIN: "Wireless Link Quality Prediction Using Street and Coverage Maps", 29 September 2014 (2014-09-29), Stutgart, Germany, pages 43 - 45, XP002744394, Retrieved from the Internet <URL:http://www-old.cs.uni-paderborn.de/fileadmin/Informatik/AG-Karl/Events/1KuVSAnticipatory/proceedings.pdf> [retrieved on 20150911] * |
Cited By (6)
| Publication number | Priority date | Publication date | Assignee | Title |
|---|---|---|---|---|
| CN107623586A (zh) * | 2017-07-20 | 2018-01-23 | 深圳大学 | 网络链路预测方法及装置 |
| CN107623586B (zh) * | 2017-07-20 | 2021-06-04 | 深圳大学 | 网络链路预测方法及装置 |
| JP2019140563A (ja) * | 2018-02-13 | 2019-08-22 | 株式会社デンソー | 移動システム通信装置 |
| US11290937B2 (en) | 2018-02-13 | 2022-03-29 | Denso Corporation | Mobile system communication apparatus |
| CN115460401A (zh) * | 2022-08-24 | 2022-12-09 | 北京邮电大学 | 一种优化视频码率分配的方法 |
| CN115460401B (zh) * | 2022-08-24 | 2025-03-11 | 北京邮电大学 | 一种优化视频码率分配的方法 |
Similar Documents
| Publication | Publication Date | Title |
|---|---|---|
| Zhang et al. | Mobility prediction: A survey on state-of-the-art schemes and future applications | |
| US20090046678A1 (en) | Method for predicting the mobility in mobile ad hoc networks | |
| JP2011138487A (ja) | 空間−時間関係に基づく交通予測方法およびシステム | |
| Sliwa et al. | Machine learning based context-predictive car-to-cloud communication using multi-layer connectivity maps for upcoming 5G networks | |
| Wang et al. | An adaptive and vanets-based next road re-routing system for unexpected urban traffic congestion avoidance | |
| Martinez et al. | Evaluating the impact of a novel warning message dissemination scheme for VANETs using real city maps | |
| EP3073460A1 (de) | Vorhersage der trajektorie von mobilen teilnehmern | |
| Cárdenas et al. | GraTree: A gradient boosting decision tree based multimetric routing protocol for vehicular ad hoc networks | |
| Sakthivel et al. | The impact of mobility models on geographic routing in multi-hop wireless networks and extensions-a survey | |
| Shahi et al. | A comparative study on efficient path finding algorithms for route planning in smart vehicular networks | |
| EP3073776A1 (de) | Verfahren und vorrichtung zur vorhersage der zustände von drahtlosverbindungen | |
| US20210120491A1 (en) | Information processing apparatus, control method, and program | |
| Pradhan et al. | COPILOT: Cooperative perception using Lidar for handoffs between road side units | |
| EP3010255A1 (de) | Verfahren, System, Benutzerendgerät und Computerprogramme zur Schätzung von Pfaden mobiler Benutzerendgeräte durch zellulare Netzwerk- und Karteninformationen | |
| Murshed et al. | Ensemble sarsa and lstm for user-centric handover decisions in 5g vehicular networks | |
| Ali et al. | A comprehensive review of radio signal propagation prediction for terrestrial wireless communication systems | |
| Uchiyama et al. | Ad-hoc localization in urban district | |
| Miles et al. | Optimal trajectory determination of a single moving beacon for efficient localization in a mobile ad-hoc network | |
| Darabkh et al. | Leveraging fog computing and software-defined networking for a novel velocity-aware routing protocol with election and handover thresholds in VANETs | |
| EP3461166B1 (de) | Verfahren zur klassifizierung eines nachbarn in einem ad-hoc-netzwerk, klassifizierungsvorrichtung, fahrzeug mit einer klassifizierungsvorrichtung und einem computerprogramm | |
| Saravanan et al. | Improving QoS in V2X Communication by observing Area-Level Network Nodal Points | |
| Jiang et al. | GUI: GPS-less traffic congestion avoidance in urban areas with inter-vehicular communication | |
| Shree et al. | Exploring position-based routing protocols in vehicular ad-hoc networks | |
| Murshed | Reinforcement learning-based user-centric handover decision-making in 5G vehicular networks | |
| Chakroun et al. | Learning-based infrastructure to vehicle link quality estimation |
Legal Events
| Date | Code | Title | Description |
|---|---|---|---|
| PUAI | Public reference made under article 153(3) epc to a published international application that has entered the european phase |
Free format text: ORIGINAL CODE: 0009012 |
|
| AK | Designated contracting states |
Kind code of ref document: A1 Designated state(s): AL AT BE BG CH CY CZ DE DK EE ES FI FR GB GR HR HU IE IS IT LI LT LU LV MC MK MT NL NO PL PT RO RS SE SI SK SM TR |
|
| AX | Request for extension of the european patent |
Extension state: BA ME |
|
| STAA | Information on the status of an ep patent application or granted ep patent |
Free format text: STATUS: THE APPLICATION IS DEEMED TO BE WITHDRAWN |
|
| 18D | Application deemed to be withdrawn |
Effective date: 20170329 |