EP3096254A1 - Verfahren zur überwachung und visualisierung des medizinischen zustandes eines patienten - Google Patents
Verfahren zur überwachung und visualisierung des medizinischen zustandes eines patienten Download PDFInfo
- Publication number
- EP3096254A1 EP3096254A1 EP15168778.7A EP15168778A EP3096254A1 EP 3096254 A1 EP3096254 A1 EP 3096254A1 EP 15168778 A EP15168778 A EP 15168778A EP 3096254 A1 EP3096254 A1 EP 3096254A1
- Authority
- EP
- European Patent Office
- Prior art keywords
- value
- displayed
- patient
- patient monitoring
- homunculus
- Prior art date
- Legal status (The legal status is an assumption and is not a legal conclusion. Google has not performed a legal analysis and makes no representation as to the accuracy of the status listed.)
- Withdrawn
Links
- 238000012544 monitoring process Methods 0.000 title claims abstract description 177
- 238000000034 method Methods 0.000 title claims abstract description 78
- QVGXLLKOCUKJST-UHFFFAOYSA-N atomic oxygen Chemical compound [O] QVGXLLKOCUKJST-UHFFFAOYSA-N 0.000 claims description 97
- 229910052760 oxygen Inorganic materials 0.000 claims description 97
- 239000001301 oxygen Substances 0.000 claims description 97
- 230000008859 change Effects 0.000 claims description 80
- 230000036772 blood pressure Effects 0.000 claims description 69
- 230000036387 respiratory rate Effects 0.000 claims description 47
- 230000000747 cardiac effect Effects 0.000 claims description 45
- 230000007177 brain activity Effects 0.000 claims description 37
- 230000005540 biological transmission Effects 0.000 claims description 27
- 230000002232 neuromuscular Effects 0.000 claims description 27
- 230000033764 rhythmic process Effects 0.000 claims description 26
- 210000004556 brain Anatomy 0.000 claims description 23
- 230000035488 systolic blood pressure Effects 0.000 claims description 23
- 210000005013 brain tissue Anatomy 0.000 claims description 22
- 230000036760 body temperature Effects 0.000 claims description 21
- 230000035487 diastolic blood pressure Effects 0.000 claims description 21
- 238000007917 intracranial administration Methods 0.000 claims description 19
- 230000002685 pulmonary effect Effects 0.000 claims description 16
- 230000002861 ventricular Effects 0.000 claims description 16
- 238000004590 computer program Methods 0.000 claims description 15
- 210000004072 lung Anatomy 0.000 claims description 14
- 238000001514 detection method Methods 0.000 claims description 12
- 210000003813 thumb Anatomy 0.000 claims description 11
- 230000000694 effects Effects 0.000 claims description 7
- 238000009499 grossing Methods 0.000 claims description 7
- 241000533950 Leucojum Species 0.000 claims description 5
- 239000011049 pearl Substances 0.000 claims description 5
- 210000004243 sweat Anatomy 0.000 claims description 5
- 210000003811 finger Anatomy 0.000 claims description 4
- 208000031636 Body Temperature Changes Diseases 0.000 claims description 3
- 230000003205 diastolic effect Effects 0.000 claims description 3
- 230000000630 rising effect Effects 0.000 claims description 3
- 201000003471 ovarian fetiform teratoma Diseases 0.000 description 160
- 230000000007 visual effect Effects 0.000 description 116
- 230000006870 function Effects 0.000 description 59
- CURLTUGMZLYLDI-UHFFFAOYSA-N Carbon dioxide Chemical compound O=C=O CURLTUGMZLYLDI-UHFFFAOYSA-N 0.000 description 45
- 238000005259 measurement Methods 0.000 description 38
- 229910002092 carbon dioxide Inorganic materials 0.000 description 31
- 210000003128 head Anatomy 0.000 description 15
- 238000012806 monitoring device Methods 0.000 description 12
- 230000004075 alteration Effects 0.000 description 10
- 210000004247 hand Anatomy 0.000 description 10
- 230000004872 arterial blood pressure Effects 0.000 description 9
- 229960004424 carbon dioxide Drugs 0.000 description 9
- 239000001569 carbon dioxide Substances 0.000 description 9
- 238000009877 rendering Methods 0.000 description 9
- 230000002159 abnormal effect Effects 0.000 description 8
- 238000013461 design Methods 0.000 description 8
- 206010002091 Anaesthesia Diseases 0.000 description 7
- 230000037005 anaesthesia Effects 0.000 description 7
- 210000002414 leg Anatomy 0.000 description 7
- 206010021143 Hypoxia Diseases 0.000 description 5
- 238000012545 processing Methods 0.000 description 5
- 239000000872 buffer Substances 0.000 description 4
- 239000003086 colorant Substances 0.000 description 4
- 230000007954 hypoxia Effects 0.000 description 4
- 230000008569 process Effects 0.000 description 4
- 230000015572 biosynthetic process Effects 0.000 description 3
- 230000007423 decrease Effects 0.000 description 3
- 238000000537 electroencephalography Methods 0.000 description 3
- 238000005516 engineering process Methods 0.000 description 3
- 210000003743 erythrocyte Anatomy 0.000 description 3
- 230000036541 health Effects 0.000 description 3
- 210000003205 muscle Anatomy 0.000 description 3
- 230000009467 reduction Effects 0.000 description 3
- 230000029058 respiratory gaseous exchange Effects 0.000 description 3
- 238000003786 synthesis reaction Methods 0.000 description 3
- 206010021118 Hypotonia Diseases 0.000 description 2
- 208000008589 Obesity Diseases 0.000 description 2
- 210000000617 arm Anatomy 0.000 description 2
- 238000003491 array Methods 0.000 description 2
- 210000001367 artery Anatomy 0.000 description 2
- 230000003190 augmentative effect Effects 0.000 description 2
- 230000008901 benefit Effects 0.000 description 2
- 210000000746 body region Anatomy 0.000 description 2
- 210000000744 eyelid Anatomy 0.000 description 2
- 239000007789 gas Substances 0.000 description 2
- 239000007788 liquid Substances 0.000 description 2
- 230000036640 muscle relaxation Effects 0.000 description 2
- 210000004165 myocardium Anatomy 0.000 description 2
- 235000020824 obesity Nutrition 0.000 description 2
- 210000001147 pulmonary artery Anatomy 0.000 description 2
- 230000010349 pulsation Effects 0.000 description 2
- 210000005241 right ventricle Anatomy 0.000 description 2
- 230000003068 static effect Effects 0.000 description 2
- 230000000287 tissue oxygenation Effects 0.000 description 2
- 238000012800 visualization Methods 0.000 description 2
- FBPFZTCFMRRESA-JGWLITMVSA-N D-glucitol Chemical compound OC[C@H](O)[C@@H](O)[C@H](O)[C@H](O)CO FBPFZTCFMRRESA-JGWLITMVSA-N 0.000 description 1
- MYMOFIZGZYHOMD-UHFFFAOYSA-N Dioxygen Chemical compound O=O MYMOFIZGZYHOMD-UHFFFAOYSA-N 0.000 description 1
- 206010061991 Grimacing Diseases 0.000 description 1
- 208000006148 High Cardiac Output Diseases 0.000 description 1
- 206010020772 Hypertension Diseases 0.000 description 1
- 208000001953 Hypotension Diseases 0.000 description 1
- 208000009378 Low Cardiac Output Diseases 0.000 description 1
- 208000010428 Muscle Weakness Diseases 0.000 description 1
- 206010028372 Muscular weakness Diseases 0.000 description 1
- 241001282135 Poromitra oscitans Species 0.000 description 1
- 206010048232 Yawning Diseases 0.000 description 1
- 210000000709 aorta Anatomy 0.000 description 1
- 230000000712 assembly Effects 0.000 description 1
- 238000000429 assembly Methods 0.000 description 1
- 210000004369 blood Anatomy 0.000 description 1
- 239000008280 blood Substances 0.000 description 1
- 238000009530 blood pressure measurement Methods 0.000 description 1
- 238000010586 diagram Methods 0.000 description 1
- 229910001882 dioxygen Inorganic materials 0.000 description 1
- 230000008921 facial expression Effects 0.000 description 1
- 230000036074 healthy skin Effects 0.000 description 1
- 230000001146 hypoxic effect Effects 0.000 description 1
- 230000003434 inspiratory effect Effects 0.000 description 1
- 208000028867 ischemia Diseases 0.000 description 1
- 210000003127 knee Anatomy 0.000 description 1
- 210000005240 left ventricle Anatomy 0.000 description 1
- 239000004973 liquid crystal related substance Substances 0.000 description 1
- 208000012866 low blood pressure Diseases 0.000 description 1
- 239000000203 mixture Substances 0.000 description 1
- 238000012986 modification Methods 0.000 description 1
- 230000004048 modification Effects 0.000 description 1
- 230000037311 normal skin Effects 0.000 description 1
- 230000003287 optical effect Effects 0.000 description 1
- 230000000737 periodic effect Effects 0.000 description 1
- 230000002093 peripheral effect Effects 0.000 description 1
- 239000004065 semiconductor Substances 0.000 description 1
- 239000004984 smart glass Substances 0.000 description 1
- 239000007787 solid Substances 0.000 description 1
- 230000001960 triggered effect Effects 0.000 description 1
- 238000013024 troubleshooting Methods 0.000 description 1
Images


Classifications
-
- A—HUMAN NECESSITIES
- A61—MEDICAL OR VETERINARY SCIENCE; HYGIENE
- A61B—DIAGNOSIS; SURGERY; IDENTIFICATION
- A61B5/00—Measuring for diagnostic purposes; Identification of persons
- A61B5/74—Details of notification to user or communication with user or patient; User input means
- A61B5/742—Details of notification to user or communication with user or patient; User input means using visual displays
- A61B5/745—Details of notification to user or communication with user or patient; User input means using visual displays using a holographic display
-
- G—PHYSICS
- G16—INFORMATION AND COMMUNICATION TECHNOLOGY [ICT] SPECIALLY ADAPTED FOR SPECIFIC APPLICATION FIELDS
- G16H—HEALTHCARE INFORMATICS, i.e. INFORMATION AND COMMUNICATION TECHNOLOGY [ICT] SPECIALLY ADAPTED FOR THE HANDLING OR PROCESSING OF MEDICAL OR HEALTHCARE DATA
- G16H40/00—ICT specially adapted for the management or administration of healthcare resources or facilities; ICT specially adapted for the management or operation of medical equipment or devices
- G16H40/60—ICT specially adapted for the management or administration of healthcare resources or facilities; ICT specially adapted for the management or operation of medical equipment or devices for the operation of medical equipment or devices
- G16H40/63—ICT specially adapted for the management or administration of healthcare resources or facilities; ICT specially adapted for the management or operation of medical equipment or devices for the operation of medical equipment or devices for local operation
-
- A—HUMAN NECESSITIES
- A61—MEDICAL OR VETERINARY SCIENCE; HYGIENE
- A61B—DIAGNOSIS; SURGERY; IDENTIFICATION
- A61B5/00—Measuring for diagnostic purposes; Identification of persons
- A61B5/0002—Remote monitoring of patients using telemetry, e.g. transmission of vital signals via a communication network
- A61B5/0004—Remote monitoring of patients using telemetry, e.g. transmission of vital signals via a communication network characterised by the type of physiological signal transmitted
- A61B5/0006—ECG or EEG signals
-
- A—HUMAN NECESSITIES
- A61—MEDICAL OR VETERINARY SCIENCE; HYGIENE
- A61B—DIAGNOSIS; SURGERY; IDENTIFICATION
- A61B5/00—Measuring for diagnostic purposes; Identification of persons
- A61B5/74—Details of notification to user or communication with user or patient; User input means
- A61B5/742—Details of notification to user or communication with user or patient; User input means using visual displays
- A61B5/7425—Displaying combinations of multiple images regardless of image source, e.g. displaying a reference anatomical image with a live image
-
- A—HUMAN NECESSITIES
- A61—MEDICAL OR VETERINARY SCIENCE; HYGIENE
- A61B—DIAGNOSIS; SURGERY; IDENTIFICATION
- A61B5/00—Measuring for diagnostic purposes; Identification of persons
- A61B5/74—Details of notification to user or communication with user or patient; User input means
- A61B5/742—Details of notification to user or communication with user or patient; User input means using visual displays
- A61B5/744—Displaying an avatar, e.g. an animated cartoon character
-
- G—PHYSICS
- G16—INFORMATION AND COMMUNICATION TECHNOLOGY [ICT] SPECIALLY ADAPTED FOR SPECIFIC APPLICATION FIELDS
- G16H—HEALTHCARE INFORMATICS, i.e. INFORMATION AND COMMUNICATION TECHNOLOGY [ICT] SPECIALLY ADAPTED FOR THE HANDLING OR PROCESSING OF MEDICAL OR HEALTHCARE DATA
- G16H10/00—ICT specially adapted for the handling or processing of patient-related medical or healthcare data
- G16H10/60—ICT specially adapted for the handling or processing of patient-related medical or healthcare data for patient-specific data, e.g. for electronic patient records
-
- A—HUMAN NECESSITIES
- A61—MEDICAL OR VETERINARY SCIENCE; HYGIENE
- A61B—DIAGNOSIS; SURGERY; IDENTIFICATION
- A61B5/00—Measuring for diagnostic purposes; Identification of persons
- A61B5/02—Detecting, measuring or recording for evaluating the cardiovascular system, e.g. pulse, heart rate, blood pressure or blood flow
- A61B5/0205—Simultaneously evaluating both cardiovascular conditions and different types of body conditions, e.g. heart and respiratory condition
-
- A—HUMAN NECESSITIES
- A61—MEDICAL OR VETERINARY SCIENCE; HYGIENE
- A61B—DIAGNOSIS; SURGERY; IDENTIFICATION
- A61B5/00—Measuring for diagnostic purposes; Identification of persons
- A61B5/74—Details of notification to user or communication with user or patient; User input means
- A61B5/742—Details of notification to user or communication with user or patient; User input means using visual displays
- A61B5/7435—Displaying user selection data, e.g. icons in a graphical user interface
Definitions
- the invention relates to a method, a computer program and a system for monitoring and visualizing a patient's medical condition.
- Contemporary health care settings such as intensive care units, intermediate care units, operating rooms, hospital wards, ambulances and medevac helicopters make extensive use of devices showing patient monitoring data increasingly featuring powerful computers and large format flat screen displays. Furthermore, monitoring data is being used and displayed in telemedicine products, online and offline hardware and software applications, and a wide scope of consumer health products (e.g., e-health applications for smart devices), for use at home or in retirement homes.
- consumer health products e.g., e-health applications for smart devices
- Modern day monitoring devices display a multitude of monitoring parameters, e.g., ECG, blood pressure, oxygen saturation, respiratory rate, and expiratory CO2. These parameters are displayed either as natural numbers or graphically as a waveform.
- E.g., current monitors may show blood pressure values numerically from 0-300 mmHg or as a waveform, showing the value of a parameter over time, but not as an intuitively understandable single display (or instrument).
- a contemporary patient monitor may display 20 and more different raw data points and waveforms on a single screen.
- the problem underlying the present invention is to provide a method, a computer program and a system for monitoring and visualizing a patient's medical condition that reduces the afore-mentioned disadvantages.
- a graphical representation of the (e.g. human) patient (being particularly formed as a homunculus) comprises a body having at least a torso and a head (as well as particularly two legs and two arms extending from the torso, respectively) is displayed using a display device, wherein said displayed graphical representation comprises at least one region which is allocated to at least one provided (e.g. measured or determined) patient monitoring quantity (e.g.
- said graphical representation or said at least one region is automatically rendered such that the appearance of the at least one region depends on, particularly corresponds to, the current value of the at least one patient monitoring quantity and/or such that the appearance of the at least one region is altered, preferably in real-time, when the at least one patient monitoring quantity, e.g. its current value, to which said at least one region is allocated, changes.
- the present invention provides a method and system for rendering images (that can be displayed by a two- or three-dimensional (graphic) display device) of a synthetic patient model.
- the system may be provided either as an addition to a monitoring device (i.e., as a standalone device), may be incorporated/integrated into a conventional patient monitoring device, or may be configured to display said rendered images as a hologram.
- the graphical representation of the patient or the homunculus is altered according to (e.g. raw) monitoring data inputs, that may be contained in a data stream or several separate data streams and are herein denoted as patient monitoring quantities.
- patient monitoring quantities can be, but are not limited to: pulse rate (PR), peripheral oxygen saturation (OS), blood pressure (BP), body temperature (Temp), ECG QRS heart rate (HR), ECG rhythm detection (ECG), ECG ST-segment deflection (ST), right ventricular pressure (RVP), pulmonary capillary wedge pressure (PCWP), mixed venous oxygen saturation (MVOS), cardiac output (CO)/cardiac index (CI), central venous pressure (CVP), respiratory rate (RR), tidal volume (TV), expiratory carbon dioxide (eCO2), expiratory oxygen (eO2), brain activity (BIS, EEG), Intracranial pressure (ICP), brain tissue oxygenation tension (BO), neuromuscular transmission (NMT).
- PR pulse rate
- OS peripheral oxygen saturation
- BP
- the raw data is organized and processed according to algorithms and sent to a graphics processor for rendering.
- the respective patient monitoring quantity or quantities can either be measured using an appropriate sensor interacting with the patient or may be (e.g. automatically) derived from one or several measured quantities.
- the invention thus creates an instrument showing a synthetic rendering of the monitored patient according to the (e.g. raw) data input (e.g. patient montoring quantities) representing the state of the actual patient.
- the data input e.g. patient montoring quantities
- the method uses alterations of the attributes of specified parts called regions of the graphical representation of the patient or of said homunculus, including their presence or absence, volume or area of regions (3D) or area (2D), and color.
- the inputs of the individual (e.g. raw) patent monitoring data for each quantity/parameter cause alterations of the attributes of one or more regions of the graphical representation of the patient (e.g. homunculus).
- the method also proportions the extent of change of the regions of the graphical representation of the patient (e.g. homunculus) according to the data input (e.g. the patient monitoring quantities) and the algorithms.
- the required changes of the attributes of the regions of the visual patient representation (e.g. homunculus) are forwarded to a graphics processor for rendering as a two- or three-dimensional image that is displayed with said display device.
- the invention provides a computer generated instrument (e.g. comprising a graphical display), that synthesizes the (e.g. raw) monitoring data (e.g. the patient monitoring quantities) into a single dynamic two- or three-dimensional synthetic patient model that is displayed, particularly in real time, representing the condition of the actual monitored patient according to the (e.g. raw) data input.
- a computer generated instrument e.g. comprising a graphical display
- the system and method according to the invention is easier for healthcare providers and personal consumers (e.g., users of e-health applications on smart devices) to interpret and to understand; an important advantage when they must make quick decisions.
- the invention creates the visual patient monitoring instrument from data received from patient monitoring devices (respectively the sensors applied to the patient, e.g. SpO2 sensor) and software, from data stored in a relational database, or from other methods that come to mind to those skilled in the art.
- patient monitoring devices e.g. the sensors applied to the patient, e.g. SpO2 sensor
- software from data stored in a relational database, or from other methods that come to mind to those skilled in the art.
- a plurality of patient monitoring quantities is provided (e.g. measured and/or determined), wherein said displayed graphical representation (e.g. homunculus) comprises a plurality of regions, wherein each region is allocated to at least one of said patient monitoring signals, and wherein the appearance of the respective region depends on the current value of the at least one associated patient monitoring signal to which the respective region is allocated and/or wherein the appearance of the respective region is altered, particularly in real-time, when the at least one measured patient monitoring signal to which the respective region is allocated changes.
- said displayed graphical representation e.g. homunculus
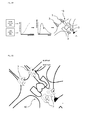
- the graphical representation of the patient is displayed such that it creates the impression of being looked at from the top, as is the usual anesthesiologists point of view when standing at the anesthesiologists position at the head of a patient, wherein particularly the point of view is a 45° angle from the head with a 30° angle of tilt upwards.
- the point of view is a 45° angle from the head with a 30° angle of tilt upwards.
- said angle from the head means the angle that is enclosed by a projection of the viewing direction on the horizontal or coronal plane of the graphical representation/homunculus and the longitudinal axis of the graphical representation/homunculus.
- the angle characterizing said tilt is the angle enclosed by the horizontal or coronal plane of the graphical representation/homunculus and the viewing direction (see also Fig. 2 ).
- the graphical representation of the patient is adapted to characteristics of the patient, particularly to its gender, age, weight, height, medical conditions. (e.g. obesity).
- bars may be shown above or below alarm fields to indicate the magnitude of deviation from a normal value of a patient monitoring quantity (also denoted as patient monitoring data point).
- the length and the color of the bar may indicate the magnitude of deviation from the normal value.
- the position of the bar on the upper or lower border of the alarm field may indicate a deviation above (upper border) or below (lower border) the normal range of the quantity in question.
- alerts based on the recognition of critical situations may be generated and particularly displayed using said display device.
- a critical situation alert is triggered when specific combinations of parameters or quantities (data points), as outlined e.g. below in Table 2, are detected to deviate above or below their prespecified normal ranges.
- the at least one patient monitoring quantity is one of:
- said at least one region (comprising a volume, e.g. when displayed in 3D, or an area, e.g. when displayed in 2D) is one of the following regions:
- the homunculus can be divided or may comprise several regions, wherein each region can be one of the regions described above. Further, each of these regions may be allocated to one or several of the above-stated quantities (data points).
- the method according to the invention allows to display the medical condition of the respective patient in a intuitive manner that can be much more rapidly assessed by a physician or monitoring person than a mere display of data points whose relations to certain anatomic and physiologic features of the patient/homunculus is not shown.
- the displayed volume of the body of the graphical representation changes between a first value derived from the current diastolic blood pressure (DBP) and a second value derived from the current systolic blood pressure (SBP), particularly with a frequency associated to the pulse rate (PR).
- DBP current diastolic blood pressure
- SBP current systolic blood pressure
- PR pulse rate
- the first value is smaller than the second value.
- a colour of the body of the graphical representation is altered when said oxygen saturation (OS) changes.
- the appearance of said graphical representation (e.g. homunculus) or body is altered when the current body temperature changes, wherein particularly a change of the body temperature leads to a change in an amount and/or the appearance of temperature indicators displayed on or adjacent to said body, wherein particularly said temperature indicators for temperatures lower than a pre-defined normal temperature range (e.g. 36° to 37°C) are formed as icicles and/or snowflakes, and wherein temperature indicators for temperatures higher than said pre-defined normal temperature are manifested in one or more of the following or similar visualizations on the graphical display: sweat pearls, heat waves, and flames.
- a pre-defined normal temperature range e.g. 36° to 37°C
- the displayed volume of the heart is altered between a first value derived from the current diastolic blood pressure (DBP) and a second value derived from the current systolic blood pressure (SBP), particularly with a frequency associated to the ECG QRS heart rate (HR).
- DBP current diastolic blood pressure
- SBP current systolic blood pressure
- HR ECG QRS heart rate
- the displayed volume of the vena cava is associated to the value of the current mean central venous pressure (CVP), wherein the displayed volume of the vena cava is altered when the current mean central venous pressure (CVP) changes, wherein particularly the displayed volume of the vena cava is proportional to the current mean central venous pressure (CVP).
- CVP current mean central venous pressure
- the displayed volume of the lung is altered between a first value and a second value derived from the tidal volume (TV), respectively, particularly with a frequency associated to the respiratory rate (RR), wherein particularly the first value is smaller than the second value.
- the displayed volume of the expiratory CO 2 cloud is altered between a first value and a second value derived from the capnographic value (CAP), respectively, particularly with a frequency associated to the respiratory rate (RR), wherein particularly the first value is smaller than the second value.
- CAP capnographic value
- RR respiratory rate
- the appearance of the eye is altered when the bispectral index (BI) or electroencephalogram (EEG) value changes (e.g. by a pre-defined threshold amount), wherein particularly a first range of the bispectral index (BI) or electroencephalogram (EEG) value is associated to a display of the eye in an open state and a second range of the bispectral index (BI) or electroencephalogram (EEG) value is associated to a display of the eye in a closed state, wherein particularly a third, inbetween range of the bispectral index (BI) or electroencephalogram (EEG) value is associated to a display of the eye in a partially open state.
- BI bispectral index
- EEG electroencephalogram
- the appearance of the hand is altered when the neuromuscular transmission (NMT) value changes (e.g. by a pre-defined threshold amount), wherein particularly a first range of the neuromuscular transmission (NMT) value is associated to a display of relaxed hands and a second range of the neuromuscular transmission (NMT) value is associated to the display of an extended thumb and a closed fist of said hand (i.e., representing a thumbs up gesture).
- NMT neuromuscular transmission
- the change in volume and/or appearance of the at least one region of said graphical representation is displayed using a smoothing function, so as to provide smoother changes in volume and/or appearance at the lower and the higher ends of the range of the input parameters (e.g. patient monitoring quantities).
- a smoothing function is displayed using a smoothing function, so as to provide smoother changes in volume and/or appearance at the lower and the higher ends of the range of the input parameters (e.g. patient monitoring quantities).
- f(x) sin ⁇ * x / x max - ⁇ / 2 + 1 * y max / 2 , where x is the input parameter (e.g. patient monitoring quantity) within the interval [0; x max ] and y max the maximum result (i.e., the maximum change in volume and/or appearance of the at least one region of said graphical representation).
- the values from 0 to 125 lie on the first convex part of the smoothing function (graph is curved to the left), whereas the values from 125 to 250 lie on the second concave part of the smoothing function (graph is curved to the right).
- a computer program for monitoring and visualizing a patient's medical condition, comprises program code that is adapted to conduct the method according to the invention as described herein when the computer program is executed on a computer.
- the at least one patient monitoring quantity or one or several of these quantities described herein are provided as an input used by the computer program.
- the features of the method according to the invention may also be used to further specify the computer program according to the invention, wherein the respective patient monitoring quantities that are measured or provided in the context of the method according to the invention are provided as an input used by the computer program.
- the invention relates to a system for monitoring and visualizing a patient's medical condition, wherein the system comprises a display device and is configured to conduct the method according to the invention as described herein (see also above).
- the system may comprise a processing device connected to the display device that is adapted to conduct the method according to the invention using the display device.
- the processing device can comprise a computer on which a computer program according to the invention is executed. Other configurations are also possible (see above).
- a further aspect relates to:
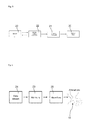
- the invention synthesizes multiple streams of raw patient monitoring data into a single display device 20 (or instrument), showing a synthetic model of the monitored patient P, which is generated according to algorithms and rendered dynamically, particularly in real time, by a graphics processor 21 (cf. Fig. 5 ).
- a graphics processor 21 cf. Fig. 5
- the patient monitoring data are displayed as a multitude of individual numbers or waveforms, which are difficult to observe, particularly in stressful situations.
- the invention offers, among others, the advantageous technical effect of providing the medical information in the context of the actual body regions to which they are associated so that a fast and intuitive understanding of the complete medical condition of the patient P is supported.
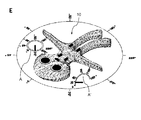
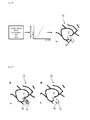
- Fig. 1 shows a possible basic design of an automatically rendered graphical representation 10 of a patient P in the form of a homunculus 10, according to a preferred embodiment, as well as the parts or regions 1 to 9 of the homunculus that are automatically altered according to the invention.
- the homunculus comprises a body 1 that may be indicated by a circumferential outline, which body 1 comprises at least a torso 1 a and a head 1b extending from the torso 1 a, as well as preferably two arms 1c (particularly with hands 9 and particularly fingers, respectively) and two legs 1d extending from the torso 1 a, respectively.
- body 1 may be indicated by a circumferential outline, which body 1 comprises at least a torso 1 a and a head 1b extending from the torso 1 a, as well as preferably two arms 1c (particularly with hands 9 and particularly fingers, respectively) and two legs 1d extending from the torso 1 a, respectively.
- two arms 1c particularly with
- said parts or regions can be: said body 1, a heart 2, an arterial system 3, a vena cava 4, a lung 5, an expiratory CO 2 cloud 6 that is exhaled by the head 1 b of the homunculus 10, at least one eye 7 (preferably two eyes 7). a brain 8 and at least one hand 9, particularly two hands 9. Further body regions may also be used.
- the dynamic alterations of the states of the parts or regions 1 to 9 of the homunculus 10 include their presence or absence, as well as changes in volume, area, length and color of parts/regions 1 to 9.
- the homunculus 10 may be looked at from all angles according to user input. A preferred embodiment places the point of view at an angle A of 45 degrees from the head 1b of the homunculus 10 with an angle A' of 45 degrees of tilt. Various angles A, A' of view of the homunculus 10 are shown in Fig 2 .
- a preferred method according to the invention creates a dynamic rendering of a synthetic patient model, representing the condition of the actual monitored patient P according to the raw input data.
- the method uses alterations in the states (or attributes) of specified parts or regions 1 to 9 of a displayed homunculus 10, i.e., the representation of a human being (i.e., Fig. 1 ).
- the dynamic alterations include presence/absence of parts or regions, changes in volume and area of parts or regions (in a 3D embodiment), area of parts or regions (in a 2D embodiment) or even length of parts or regions and changes in color of parts or regions.
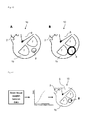
- An artistic impression of a 3D embodiment is shown in Fig 3 .
- the present invention addresses the problem of presenting an appropriate synthesis of patient monitoring quantities to a health care provider or another user of a monitoring device (e.g., personal consumer using an e-health app).
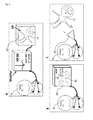
- the invention presents all monitoring information in a single, easy to understand instrument, which is dynamically rendered and shown on a display device 20 (i.e., Fig. 4 A and B ). It may be presented on a wearable electronics device such as smart glasses or augmented reality devices, or as a hologram (i.e., Fig. 4 C) .
- the display of the instrument may be two or three-dimensional.
- the visual patient display device 20 may be presented: A: as a separate standalone device in addition to a state-of-the-art patient monitoring device (Monitor), B: integrated with a conventional patient monitoring device (single monitor showing both the visual patient instrument and conventional monitoring data) or C: projected as a hologram.
- the present invention is particularly suited to be used integrated with a conventional patient monitoring device (a single screen showing both the visual patient instrument and conventional monitoring data) and displayed together with the raw monitoring data, e.g. the image B shown in Fig. 4 .
- a conventional patient monitoring device a single screen showing both the visual patient instrument and conventional monitoring data
- the display device 20 may be, for example, a cathode ray tube (CRT), a liquid crystal display (LCD) screen, a gas plasma-based flat-panel display, an organic light-emitting diode (OLED) display, an augmented reality (AR) device such as a head-mounted display (HMD), e.g.
- CTR cathode ray tube
- LCD liquid crystal display
- OLED organic light-emitting diode
- AR augmented reality
- HMD head-mounted display
- the visualization may be presented on a computerized wristwatch (smart watch), as a hologram (e.g. as shown in Fig. 4 C) , or other devices suitable for display of the instrument.
- the present invention provides for the creation of a two- or three-dimensional instrument from the synthesis of raw monitoring data.
- the invention creates a homunculus 10, which is a synthetic representation of the condition of the actual monitored patient.
- a graphics processor 21 dynamically renders the image.
- the system includes a computer 22 (which may be a general purpose computer or a dedicated, specially designed computer), the memory 23 containing the software code with the algorithms, a graphics processor 21, and a display device 20.
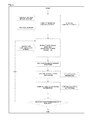
- step 1 the raw input data (i.e., "DATA STREAM” in Fig. 6 ) is loaded into system memory (i.e., "MEMORY” in Fig. 6 ) and is transformed by the general purpose computer into patient monitoring quantities (also denoted as data points), which can be utilized directly by the invention.
- the raw monitoring data may come from commercially (or otherwise) available sensors (e.g., a pulse oximeter) and devices or software output, e.g. a simulator or a relational database.
- PR pulse rate
- SpO2 oxygen saturation
- BP blood pressure
- Temp body temperature
- the resulting patient monitoring quantities or data points are a representation of each patient monitoring parameter (raw data).
- Data points originate from sensor data, e.g., pressures, volumes, and saturations, without regard to the initial format and within a certain range. If the raw patient data from the sensors is processed on-site, it is loaded directly into the memory 23. If it is delivered from a remote patient monitoring device, an additional data store is prepared as required. However, raw data may also be used without further processing as a patient monitoring quantity.
- step 2 the patient monitoring quantities (data points) are transformed by the e.g. general purpose computer 22 according to the algorithms 25 of the present invention (e.g. Fig. 6 ) into one or multiple alterations in the states of specified parts or regions 1 to 9 of the homunculus 10.
- the method uses changes in the attributes of specified parts or regions 1 to 9 of the homunculus.
- alterations i.e., "ALTERATIONS” in Fig. 6
- these alterations include the presence and absence of parts or regions 1 to 9, the volume or area of parts or regions 1 to 9 (3D) or area (2D) of parts or regions 1 to 9 or even length of parts or regions 1 to 9, and the color and movement of parts or regions 1 to 9 of the homunculus 10.
- the graphics processor 21 renders the image on a display device 20 (i.e., the parts or regions 1 to 9 of the homunculus 10 are changed dynamically) from the pertinent information.
- data points are allocated to one or more representative parts or regions 1 to 9 of the homunculus 10 (cf. e.g. Fig. 7 ).
- the rendering of the e.g. real-time instrument, showing the synthetic model of the patient P takes place following the subroutines outlined hereafter (i.e., subroutines A and B).
- subroutine A While subroutine A (cf. Fig. 8 ) generates input data for subroutine B (cf. Fig. 9 ), they may be executed autonomously. In detail, subroutine A may generate data and temporarily store it in a data buffer until subroutine B consumes the data for further processing. Both subroutine A and subroutine B are connected through the overall visual patient monitoring algorithm (e.g. Fig. 6 ).
- Subroutine A starts by computing an individual homunculus model 10 based on the monitored patients medical profile (i.e., age, weight, gender, height, pediatric, medical conditions, e.g. obesity) by altering a default homunculus model creating a "customized patient avatar". For example, if a patient is a woman, a homunculus having a body 1 representing a woman is displayed. The outcome (depicted as "INDIVIDUAL HOMUNCULUS MODEL" in Fig. 8 ) of this procedure (depicted as "COMPUTE INDIVIDUAL HOMUNCULUS MODEL" in Fig. 8 ) is used as an input for subroutine B ( Fig. 9 ) of the algorithm.
- the monitored patients medical profile i.e., age, weight, gender, height, pediatric, medical conditions, e.g. obesity
- a default homunculus model creating a "customized patient avatar”. For example, if a patient is a woman, a hom
- the next step is to handle the incoming patient monitoring data.
- patient data arrives in form of a data stream ("RAW PATIENT MONITORING DATA STREAM" in Fig. 8 )
- parameters that match the patient monitoring parameters monitored by the invention are extracted from the data stream, loaded into memory 23 and transformed into said data points (also denoted as patient monitoring quantities), as described in step one above.
- these data points are associated with the current timestamp and added to the session data store ("ADD DATA POINTS TO SESSION DATA STORE” in Fig. 8 ) so that session trend information can be computed in a subsequent step ("COMPUTE SESSION TREND INFORMATION" in Fig. 8 ).
- session trend information is used as an input for subroutine B ( Fig. 9 ) of the algorithm and may be represented on the display.
- the computer 22 takes the available individual data points (i.e., the patient's vital parameters) and supplies them to the specific algorithms. Subsequently, these algorithms compute the state of each part or regions 1 to 9 of the homunculus model 10 ("COMPUTE INDIVIDUAL HOMUNCULUS MODEL ANIMATIONS" in Fig. 8 ). The individual algorithms are described in detail below. Once the individual animations have been computed, they are passed to subroutine B ( Fig. 9 ) of the overall visual patient monitoring algorithm.
- Fig. 9 represents subroutine B of the visual patient monitoring overall algorithm ( Fig. 5 ) according to a preferred embodiment, in which subroutine A fills a data buffer in memory 23 that is loaded and consumed by subroutine B for further processing.
- the two- or three-dimensional homunculus model 10 is computed ("COMPUTE HOMUNCULUS GRAPHICAL MODEL REPRESENTATION" in Fig. 9 ) by using the individualized homunculus model (i.e., the customized patient avatar) 10, session trend information (i.e., the monitoring session history), and the model animations to be performed on the individual homunculus model 10.
- the two- or three-dimensional representation of the homunculus 10 is stored in memory 23 ("STORE HOMUNCULUS GRAPHICAL MODEL REPRESENTATION IN MEMORY") for later rendering by the graphics processor 21.
- the next step is to wait for a specific interval to be elapsed ("WAIT FOR INTERVAL TO ELAPSE" in Fig. 9 ) before sending the two- or three-dimensional model representation to the graphics processor 21 for rendering purposes.
- the latter timespan which is pre- or dynamically determined, represents the sequence of image change by the display device 20 (i.e., the display refresh rate).
- Subroutine B is repeated as long as data is present in the data buffer filled by subroutine A.
- the instructions for carrying out the present invention may be stored in any recordable medium such as a hard drive, magnetically recordable tape, or as a compact disk. They may be stored in the memory 23 (i.e., MEMORY in Fig. 5 ).
- the memory 23 may include both volatile and nonvolatile memory components. Volatile components are those that do not retain data upon loss of power. Nonvolatile components are those that retain data upon a loss of power.
- the memory 23 may comprise, for example, random access memory (RAM), read-only memory (ROM), hard disk drives, solid state drives and/or other memory components, or a combination of any two or more of these memory components.
- the RAM may comprise, for example, static random access memory (SRAM), dynamic random access memory (DRAM), or magnetic random access memory (MRAM), non-volatile random-access memory (NVRAM), and other forms of memory.
- the ROM may comprise, for example, a programmable read-only memory (PROM), an erasable programmable read-only memory (EPROM), an electrically erasable programmable read-only memory (EEPROM), compact flash memory, or other like memory device.
- Example 1 Visual patient monitoring algorithm #1 (pulse rate and blood pressure)
- This algorithm is used to make region 1 (body) as shown in Fig. 1 of the homunculus 10 pulsate in an intuitive way according to the pulse rate and blood pressure of the patient P.
- the patient monitoring quantities are the Blood Pressure BP and the Pulse Rate PR e.g. from a SpO2 Sensor.
- the ease in/out function causes very low and very high pressures to cause less extensive changes in volume or area of parts (3D) or area (2D) of region 1 when compared to changes in medium pressure ranges. This function will enable users to better detect low and high-pressure extremes.
- Region 1 of the homunculus 10 alternates between the volume or area of parts (3D) or area (2D) value of diastolic blood pressure (minimum) and systolic blood pressure (maximum).
- the changes in volume or area of parts (3D) or area (2D) of region 1 occurs with the frequency of the pulse rate PR, derived e.g. from the SpO2 sensor, and follows an arterial pressure curve form.
- the arterial pressure curve form according to which the volume or area of parts (3D) or area (2D) change of region (body) 1 is achieved, is stored in memory 23.
- Several curve forms may be stored in memory 23 and displayed for different blood pressure amplitudes.
- Fig. 11 provides a graphical example of a change in volume or area of parts (3D) or area (2D) of region (body) 1 of the homunculus 10 taking place during each cycle from minimum to maximum blood pressure.
- the patient monitoring quantity is the oxygen saturation e.g. from a SpO2 Sensor (SpO2).
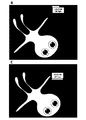
- body 1 of the homunculus 10 has a normal skin color tone (e.g., HEX color #F8EFDA), representing the look of healthy skin at normal oxygen levels.
- HEX color #F8EFDA normal skin color tone
- body 1 gradually becomes light blue (e.g., HEX color #84B0E8) to dark blue (e.g., HEX color #0E3996) and finally purple (e.g., HEX color #723C7F) and grey (e.g., HEX color #DEDEDE) representing various degrees of hypoxia.
- HEX color #F8EFDA normal skin color tone
- FIG. 13 provides graphical examples of the changes in color of body 1 of the homunculus 10 according to oxygen saturation data.
- Fig. 13 shows graphical examples of changes in color (shown as grey scale) of body 1 of the homunculus 10 according to oxygen saturation.
- This algorithm allows the patients temperature to be indicated in an intuitive way in body 1 ( Fig. 1 ) of the homunculus 10 according to the temperature data of the patient P.
- the corresponding patient monitoring quantity (input) is the body temperature BT.
- temperature indicators 11 appear on body 1 of the homunculus 10.
- the amount of temperature indicators 11 presented allows the user to understand the temperature of the patient P intuitively.
- Temperature indicators 11 for temperatures lower than normal may be icicles, snowflakes, temperature indicators 11 for temperatures higher than normal may be sweat pearls or heat waves rising from body 1 of the homunculus 10.
- the amount of temperature indicators 11 shown preferably follows an ease in/out function. This enables users to detect low and high-temperature extremes better. Assigning different designs of temperature indicators 11 than the ones described here as the preferred embodiment of the invention, e.g.
- Fig. 15 provides a graphical example of a change in the amount of temperature indicators 11 of body 1 of the homunculus 10 according to body temperature of the patient P.
- Fig. 15 shows graphical examples of the changes in the amounts of temperature indicators 11 displayed in region (body) 1 of the homunculus 10 according to body temperature.
- the patient monitoring quantities_(inputs) are the ECG QRS heart rate (HR) and Blood pressure (BP).
- Changes in input blood pressure lead to a change in volume or area of parts (3D) or area (2D) of the heart 2 particularly following an ease in/out function.
- the ease in/out function causes very low and very high pressures to cause less extensive changes in volume or area of parts (3D) or area (2D) of heart 2 when compared to changes in medium pressure ranges. This function will enable users to better detect low and high-pressure extremes.
- Region (heart) 2 of the homunculus 10 alternates between the volume or area of parts (3D) or area (2D) value of diastolic blood pressure (minimum) and systolic blood pressure (maximum).
- the changes in volume or area of parts (3D) or area (2D) of region (heart) 2 occurs with the frequency of the ECG QRS heart rate (HR), and follows an arterial pressure curve form.
- the arterial pressure curve form according to which the volume or area of parts (3D) or area (2D) change of region (heart) 2 is achieved, is stored in memory 23.
- a schematic overview of this algorithm is given in Fig. 16 .
- Inputs ECG QRS heart rate HR and Blood pressure BP, ST-Segments of leads I,II,III, aVF, aVR, aVL, V1, V2, V3, V4, V5, V6.
- This algorithm allows for specific sections of the heart 2 ( Fig. 1 ) of the homunculus 10 to change their color and reduce the dynamics of their movement according to ST-segment deflection input from the ECG leads.
- An intuitive color will be chosen to make the muscle of the visual heart 2 appear hypoxic, e.g., a darker shade of red.
- the movement dynamic change of area/volume
- changes in color and reduction in movement represent various degrees of ST-segment deflection and underlying suggested heart muscle hypoxia or ischemia.
- ST-segment deflections lead to a change in color of specific sections of heart 2 of the homunculus 10.
- the sections of heart 2 of the homunculus 10 have a normal, default red color tone (e.g., HEX color #FF5555), representing the look of a healthy heart muscle at normal oxygen levels.
- the sections of heart 2 of the homunculus 10 allocated to the ECG lead gradually become darker, e.g., from HEX color #C90000 to HEX color #8B0000 and finally purple (e.g., HEX color #723C7F) and grey (e.g., HEX color #DEDEDE).
- HEX color #C90000 HEX color #C90000
- HEX color #8B0000 HEX color #723C7F
- grey e.g., HEX color #DEDEDE
- an ST-segment deflection in leads representing the septal part of the heart 2 i.e., leads V1, V2
- leads V1, V2 will cause color changes and reduction of area/volume change (i.e., less dynamic movement) of the septal part of heart 2 of the homunculus 10.
- an ST-segment deflection in leads representing the inferior part of the heart 2 i.e., leads II, III, aVF
- leads II, III, aVF will cause color changes and less dynamic movement of the inferior part of heart 2 of the homunculus 10.
- Changes in ST-segment deflection of specific ECG leads leads to a change in volume or area of parts (3D) or area (2D) of the sections of heart 2 of the homunculus 10 allocated to these ECG leads.
- the ease in/out function causes very small and very large ST-segment deflections to cause less extensive changes in volume or area of parts (3D) or area (2D) of heart 2 when compared to changes in medium ST-segment deflection ranges. This function will enable users to better detect relevant ST-segment deflections.
- Fig. 17 gives a schematic overview of this algorithm.
- Fig. 19 provides graphical examples of ST-segment deflections in specific ECG leads.
- Fig. 19 shows graphical examples of the changes in color of specified sections of the heart 2 of the homunculus 10 according to ST-segment deflection data.
- the ST-segment deflection algorithm in addition to the color change in the specified parts of heart 2 of the homunculus 10 also the movement (dynamic change of area/volume) is reduced.
- Example 6 Visual patient monitoring algorithm #6 (visual right ventricular pressure)
- This algorithm allows for a specific section of heart 2 (e.g. Fig. 1 ) of the homunculus 10 to change its volume or area of parts (3D) or area (2D) in an intuitive way according to the right ventricular pressure of the patient P.
- the patient monitoring quantity (inputs) is the Right ventricular pressure (RVP)
- Changes in input right ventricular pressure lead to a change in volume or area of parts (3D) or area (2D) of a specific section of heart 2 of the homunculus 10, representing the right ventricle of the heart 2, particularly following an ease in/out function.
- the ease in/out function causes very low and very high pressures to cause less extensive changes in volume or area of parts (3D) or area (2D) of the specified section of heart 2 when compared to changes in medium pressure ranges. This function will enable users better to detect low and high extremes of right ventricular pressure.
- the volume or area of parts (3D) or area (2D) of the specific part of the homunculus 10 fluctuates according to the right ventricular pressure wave, when this input is available.
- Fig. 20 gives a schematic overview of this algorithm.
- This algorithm is used to enable heart 2 of the homunculus 10 (e.g. Fig. 1 ) to show the heart rhythm of the patient P as detected by a rhythm detection software in an intuitive way.
- the detection of specific heart rhythms causes the display of electrical conduction path forms 14 associated with the detected rhythm on part 2 of the homunculus 10.
- the electrical conduction paths forms 14, which are displayed according to the detected heart rhythm, are stored in memory 23.
- Several conduction path forms 15 may be stored in memory 23 and displayed for different ECG heart rhythms.
- Fig 21 shows graphical examples of various electrical conduction path forms 14 displayed on heart 2 of the homunculus 10 according to ECG rhythms detected by ECG rhythm detection.
- Example 8 Visual patient monitoring algorithm #8 (visual pulmonary capillary wedge pressure or wedge pressure)
- This algorithm allows for a specific section of heart 2 (e.g. Fig. 1 ) of the homunculus 10 to change its volume or area of parts (3D) or area (2D) in an intuitive way according to the pulmonary capillary wedge pressure of the patient P.
- Pulmonary capillary wedge pressure is also known as wedge pressure.
- the patient monitoring quantities (inputs) are the pulmonary capillary wedge pressure or wedge pressure (PCWP).
- Changes in input pulmonary capillary wedge pressure lead to a change in volume or area of parts (3D) or area (2D) of a specific section of heart 2 of the homunculus 10, representing a section 15 of the pulmonary artery, particularly following an ease in/out function.
- the ease in/out function causes very low and very high pressures to cause less extensive changes in volume or area of parts (3D) or area (2D) of the specified section of heart 2 when compared to changes in medium pressure ranges. This function will enable users better to detect low and high extremes of pulmonary capillary wedge pressure.
- the volume or area of parts (3D) or area (2D) of the specific part 15 of the homunculus 10 fluctuates according to the pulmonary artery pressure wave, when this input is available.
- Fig. 23 provides graphical examples of different pulmonary capillary wedge pressures.
- Example 9 Visual patient monitoring algorithm #9 (visual mixed venous oxygen saturation)
- This algorithm allows a specific section of part 2 of the homunculus ( Fig. 1 ) of the homunculus 10 to change its color in an intuitive way according to the mixed venous oxygen saturation of the patient P.
- the patient monitoring quantity (input) is the mixed venous oxygen saturation (MVOS).
- Fig. 25 provides a graphical example of a change in color (here indicated in grey scale) of the specific section 16 of heart 2 of the homunculus 10 according to mixed venous oxygen saturation.
- Example 10 Visual patient monitoring algorithm #10 (visual cardiac output, visual cardiac index)
- cardiac output or cardiac index, which is the cardiac output related to body surface area
- the patient monitoring quantity is the cardiac output and/or cardiac index.
- cardiac output indicators 18 appear on a specific section 17 of heart 2 of the homunculus 10.
- the amount of cardiac output indicators 18 presented allows the user to understand the cardiac output of the patient P intuitively.
- Cardiac output or cardiac index indicators 18 include the amount of erythrocytes (red blood cells) being ejected from the left ventricle of the heart 2 into the aorta.
- the amount of cardiac output indicators 18 shown particularly follows an ease in/out function. This enables users to detect low and high cardiac output or cardiac index extremes better. Assigning different designs of cardiac output, respectively, cardiac index indicators 18 other than the red blood cells design described here as the preferred embodiment of the invention, will occur to those skilled in the art and may be used without varying from the spirit of this invention.
- Fig. 27 provides a graphical example of a change in the amount of cardiac output indicators 18 shown in a specific section 17 of heart 2 of the homunculus 10 according to cardiac output or cardiac index measurement.
- Fig. 27 shows graphical examples of the changes in the amounts of cardiac output indicators displayed in a specific section of part 2 of the homunculus according to cardiac output.
- Example 11 Visual patient monitoring algorithm #11 (visual arterial system)
- This algorithm is used to enable region 3 in form of visual arteries (or artery system) of the homunculus 10 (e.g. Fig. 1 ) pulsate in an intuitive way according to the pulse rate or invasive (art.) blood pressure wave and blood pressure of the patient P.
- the patient monitoring quantities (inputs) are the blood pressure BP and the pulse rate e.g. from a SpO2 Sensor (PR) or from an invasive blood pressure wave.
- PR SpO2 Sensor
- Changes in input blood pressure lead to a change in volume or area of parts (3D) or area (2D) of region 3 of the homunculus 10 particularly following an ease in ease out function.
- the ease in/out function causes very low and very high pressures to cause less extensive changes in volume or area of parts (3D) or area (2D) of part 3 when compared to changes in medium pressure ranges. This function will enable users to better detect low and high-pressure extremes.
- Regions 3 of the homunculus 10 alternate between the volume or area of parts (3D) or area (2D) value of diastolic blood pressure (minimum) and systolic blood pressure (maximum).
- the changes in volume or area of parts (3D) or area (2D) of region 3 occur with the frequency of the pulse rate (PR), derived from the e.g. SpO2 sensor or from e.g. an invasive blood pressure wave, and follow an arterial pressure curve form.
- PR pulse rate
- the arterial pressure curve form according to which the volume or area of parts (3D) or area (2D) change of part 3 is achieved, is stored in memory 23.
- curve forms may be stored in memory 23 and displayed for different blood pressure amplitudes.
- Fig. 28 gives a schematic overview of this algorithm.
- Fig. 29 provides a graphical example of a change in volume or area of parts (3D) or area (2D) of regions 3 of the homunculus 10 taking place during each cycle from minimum to maximum blood pressure.
- Example 12 Visual patient monitoring algorithm #12 (visual vena cava)
- This algorithm allows region 4 ( Fig. 1 ) of the homunculus 10, i.e., the vena cava 4, to change its volume or area of parts (3D) or area (2D) in an intuitive way according to the central venous pressure of the patient P.
- the patient monitoring quantity (inputs) is the central venous pressure (CVP).
- Changes in input central venous pressure lead to a change in volume or area of parts (3D) or area (2D) of the vena cava 4 particularly following an ease in/out function.
- the ease in/out function causes very low and very high pressures to cause less extensive changes in volume or area of parts (3D) or area (2D) of region 4 when compared to changes in medium pressure ranges. This function will enable users better to detect low and high extremes of central venous pressure.
- the volume or area of parts (3D) or area (2D) of region (vena cava) 4 of the homunculus 10 fluctuate according to the CVP pressure wave, when this input is available. A schematic overview of this algorithm is given in Fig. 30 .
- This algorithm allows regions 5 (e.g. Fig. 1 ) that represent the two lungs of the homunculus 10 to change their volume or area of parts (3D) or area (2D) in an intuitive way according to the respiratory rate RR and tidal volume TV.
- the patient monitoring quantites (inputs) are the respiratory rate (RR) and the tidal volume TV.
- the ease in/out function causes very low and very high tidal volumes to cause less extensive changes in volume or area of parts (3D) or area (2D) of regions (lungs) 5 when compared to changes in medium tidal volume ranges. This function will enable users better to detect low and high tidal volume extremes.
- Regions (lungs) 5 of the homunculus 10 alternate between a default volume or area of parts (3D) or area (2D) value (minimum) and the value according to the tidal value of the patient P (maximum).
- the changes in volume or area of parts (3D) or area (2D) of both lungs in part 5 occur with the frequency of the respiratory rate PR, and preferably follows a volume-time curve.
- the volume time curve according to which the volume or area of parts (3D) or area (2D) change of both lungs 5 is achieved, is stored in memory 23.
- curve forms may be stored in memory 23 and displayed for different respiratory rates.
- the change in volume or area of parts (3D) or area (2D) of both lungs 5 is according to the actual volume or area of parts (3D) or area (2D) curve input from the patient P, when this input is available.
- Fig. 31 gives a schematic overview of this algorithm.
- This algorithm allows a region 6 in the form of a CO 2 cloud of the homunculus 10 (e.g. Fig. 1 ) to change its volume or area of parts (3D) or area (2D) in an intuitive way according to the respiratory rate RR and exspiratory carbon dioxide measurement (eCO2).
- the patient monitoring quantities (inputs) are the respiratory rate RR and exspiratory carbon dioxide measurement eCO2.
- An intuitive color to represent carbon dioxide for region 6 of the homunculus 10 representing the CO 2 cloud can be for example HEX color #F9FB04.
- the ease in/out function causes very low and very high end-expiratory CO 2 values to cause less extensive changes in volume or area of parts (3D) or area (2D) of region 6 when compared to changes in medium end-tidal CO 2 measurement. This function will enable users to better detect low and high end-tidal CO 2 extremes.
- Region 6 of the homunculus 10 alternates between nonexistent (minimum) and the value according to the end-expiratory CO 2 measurement of the patient P (maximum).
- the changes in volume or area of parts (3D) or area (2D) of region 6 occur with the frequency of the respiratory rate PR, and particularly follows an expiratory CO 2 curve.
- the end-expiratory CO 2 curve according to which the volume or area of parts (3D) or area (2D) change of region 6 is achieved, is stored in a memory.
- the change in volume or area of parts (3D) or area (2D) of region 6 behave according to the actual end-expiratory CO 2 curve input (capnogaphy) from the patient P, when this input is available.
- Example 15 Visual patient monitoring algorithm #15 (visual oxygen cloud)
- This algorithm allows the fraction of expired oxygen (FeO2) to be indicated in an intuitive way in region 6 of the homunculus 10 (e.g. Fig. 1 ) according to the FeO2 data input.
- the patient monitoring quantity (input) is the expired oxygen (FeO2).
- Changes in the input expiratory oxygen lead to a change area/volume of a colored section 19 in region 6 of the homunculus 10 (visual CO 2 & oxygen cloud) particularly following an ease in ease out function.
- the area[2D]/volume[3D] change will be relative to the dynamic area[2D]/volume[3D] changes of region 6 of the homunculus 10 occurring according to the visual patient monitoring algorithm #13 (visual respiration).
- An intuitive color to represent oxygen for the section 19 of region 6 representing expired oxygen can be for example HEX color #84B0E8.
- the ease in/out function causes very low and very high expiratory oxygen values to cause less extensive changes in volume or area of parts (3D) or area (2D) of the colored section 19 in region (e.g.
- Fig. 34 provides a graphical example of a change in volume or area of parts (3D) or area (2D) of the specific section 19 of region 6 according to different measurements of expired oxygen.
- Fig. 34 shows graphical examples of a change in area[2D]/volume[3D] of the colored sections in part 6 according to expiratory oxygen data changes.
- This algorithm allows both eyes of part 7 (e.g. Fig. 1 ) of the homunculus 10 to change their state, and the specific section of body 1 of the homunculus 10, representing the head 1b to indicate brain activity in an intuitive way according to a brain activity measurement, e.g., from the Bispectral index system (BIS) or an electroencephalography (EEG).
- a brain activity measurement e.g., from the Bispectral index system (BIS) or an electroencephalography (EEG).
- the patient monitoring quantity (inputs) is the Brain activity from e.g. the Bispectral Index system (BIS) or an Electroencephalography (EEG).
- Bispectral index (BIS) or electroencephalography (EEG) data input the state of both eyes 7 changes from closed 7b to open 7a.
- the degree of openness will allow the user intuitively to understand the deepness of anesthesia of the patient P.
- Brain activity input indicative of deep anesthesia lead to eyes with eyelids closed (7b), values representing high brain activity indicating shallow anesthesia depth cause partially open (7c) eyes or eyelids 7 or open (7a) eyes 7.
- brain activity indicators appear around the section of region 1 of the homunculus 10 representing the head 1b of the visual patient monitoring.
- the amount of brain activity indicators presented allows the user intuitively to understand the brain activity of the patient (which is an indicator of anesthesia depth).
- Brain activity indicators for brain activity levels may be represented by dynamic waveform patterns, circles and stars rotating around and moving outwards and inwards in random movement from region 8 of the homunculus 10, representing the brain 8 of the homunculus located in head 1 b of the homunculus 10.
- the homunculus 10 may be complemented by periodic nodding of the region 1b of body 1 representing the head, as well as yawning represented as opening of the mouth or grimacing of the homunculus appearing in prespecified ranges of brain activity. Also, the homunculus 10 may gradually be lowered into a pool of liquid or clouds to represent anesthesia, a graphical example of which is depicted in Fig 35 .
- the degree of openness of the eyes 7 and the amount of brain activity indicators displayed particularly follow an ease in/out function. This enables users better to detect low and high brain activity value extremes.
- Fig. 36 gives a schematic overview of this algorithm.
- Fig. 37 provides a graphical example of a change in the state of both eyes 7 of the homunculus 10 according to the brain activity values.
- Fig. 37 shows graphical examples of the changes in the states of both eyes 7 of the homunculus 10 according to changes in brain activity measurements (e.g., BIS, EEG).
- B Eyes 7 in a partially open state 7c indicating medium brain activity, e.g., BIS value of 75
- C Eyes 7 in a closed state 7b indicating a low brain activity, e.g., BIS value of 40.
- Fig. 38 shows graphical examples of the changes in the amount of brain activity indicators 12 displayed around or adjacent region 8 of the homunculus 10 representing the brain according to changes in brain activity measurements (e.g., BIS, EEG).
- A High brain activity, e.g., BIS value of 100
- B low brain activity, e.g., BIS value of 40.
- Example 17 Visual patient monitoring algorithm #17 (visual intracranial pressure)
- This algorithm allows region 8 ( Fig. 1 ) of the homunculus 10 forming the brain to change its volume or area of parts (3D) or area (2D) and appearance in an intuitive way according to the intracranial pressure of the patient P.
- the patient monitoring quantity (input) is the intracranial pressure (ICP).
- the appearance of region 8 will gradually change according to an ease in/out function from an appearance where the brain 8 appears relaxed to an appearance where the brain 8 appears compressed and tense, representing high intracranial pressure.
- the ease in/out functions causes very low and very high pressures to cause less extensive changes in volume or area of parts (3D) or area (2D) of region 8 when compared to changes in medium pressure ranges. This function will enable users better to detect low and high extremes of intracranial pressure.
- the volume or area of parts (3D) or area (2D) of region i.e.
- Fig. 39 provides a schematic overview of this algorithm.
- Fig. 40 provides a graphical example of a change in the appearance of brain 8 of the homunculus 10 according to different measurements of intracranial pressure.
- Fig. 40 shows a graphical example of a change in the appearance of brain 8 of the homunculus according to changes in intracranial pressure measurements.
- Example 18 Visual patient monitoring algorithm #18 (visual brain tissue oxygen tension)
- This algorithm allows region (i.e. brain) 8 of the homunculus (e.g. Fig. 1 ) to change its color in an intuitive way according to the brain tissue oxygen tension of the patient.
- the patient monitoring quantity (input) is the brain tissue oxygen tension (BO). Changes in brain tissue oxygen tension lead to a change in color of brain 8 of the homunculus 10.
- brain 8 of the homunculus 10 has a normal white color, representing well-oxygenated brain tissue.
- HEX color #84B0E8 As oxygen content decreases the color gradually turns from a light blue color (e.g., HEX color #84B0E8) to a darker blue (e.g., HEX color #0E3996) and eventually turns purple (e.g., HEX color #723C7F) and dark grey (e.g., HEX color #DEDEDE) representing various degrees of brain tissue hypoxia. Assigning other, different colors to the central venous saturation data points will occur to those skilled in the art and may be used without varying from the spirit of this invention.
- HEX color #84B0E8 As oxygen content decreases the color gradually turns from a light blue color (e.g., HEX color #84B0E8) to a darker blue (e.g., HEX color #0E3996) and eventually turns purple (e.g., HEX color #723C7F) and dark grey (e.g., HEX color #DEDEDE) representing various degrees
- Fig. 41 gives a schematic overview of this algorithm.
- Fig. 42 provides a graphical example of a color change (indicated in grey scale) of the region (i.e. brain) 8 of the homunculus 10 according to brain tissue oxygen saturation measurements. Particularly, Fig. 42 shows a graphical example of a change in color (indicated in grey scale) of brain 8 of the homunculus 10 according to brain tissue oxygen saturation. A: 100% oxygen saturation, B: 75% oxygen saturation.
- This algorithm allows the body 1 and both hands 9 (particularly also thumbs 9a) of the homunculus 10 (e.g. Fig. 1 ) to change their state in an intuitive way according to the neuromuscular transmission measurement system (NMT).
- the patient monitoring quantity (input) is provided e.g. by a neuromuscular transmission measurement system (NMT).
- the body 1, hands 9 and thumbs 9a of the homunculus 10 change from relaxed (flaccid) to tense and the hands 9 show an extended thumb (thumbs up) 9a.
- the degree of relaxation of the hands and extension of the thumb will allow the user intuitively to understand the degree of neuromuscular transmission of the patient.
- NMT values indicative of good muscle relaxation lead to the fingers of the hands and all joints to hang down giving a relaxed indication.
- NMT data input part 1 of the homunculus may change its shape to appear tilted at the knees and the elbows to represent muscle weakness or muscle strength intuitively.
- NMT values indicative of good muscle relaxation lead to changes in the relative positions of the sections of part 1 of the homunculus representing the legs, arms and head, giving a relaxed indication. They appear to hang down following the gravitational force.
- Fig. 43 gives a schematic overview of this algorithm.
- Fig. 44 provides graphical examples of the changes according to different NMT measurements.
- Fig. 44 shows graphical examples of the changes to the stiffness of arms, legs and neck according to different NMT measurements.
- the general visual patient monitoring algorithm ( Fig. 6 ), the subroutines ( Figs. 8 and 9 ) and algorithms #1 to #19 of the present invention are embodied in software or code executed by general purpose hardware as discussed above.
- the algorithms and subroutines may also be embodied in dedicated hardware or a combination of software/general purpose hardware and dedicated hardware. If embodied in dedicated hardware, the algorithms and subroutines can be implemented as a circuit or state machine that employs any one of or a combination of a number of technologies.
- These technologies may include, but are not limited to, discrete logic circuits having logic gates for implementing various logic functions upon an application of one or more data signals, application specific integrated circuits having appropriate logic gates, programmable gate arrays (PGA), field programmable gate arrays (FPGA), or other components, etc.
- PGA programmable gate arrays
- FPGA field programmable gate arrays
- each block may represent a module, segment or portion of code that comprises program instructions to implement the specified logical function(s).
- the program instructions may be embodied in the form of source code that comprises human-readable statements written in a programming language or machine code that comprises numerical instructions recognizable by a suitable execution system such as a processor in a computer system or other system.
- the machine code may be converted from the source code, etc.
- each block may represent a circuit or a number of interconnected circuits to implement the specified logical function(s).
- the algorithms and subroutines comprise software or code
- it can be embodied in any computer-readable medium for use by or in connection with an instruction execution system such as, for example, a processor in a computer system or other system.
- the logic may comprise, for example, statements including instructions and declarations that can be fetched from the computer-readable medium and executed by the instruction execution system.
- a "computer-readable medium" can be any medium that can contain, store, or maintain the algorithms and subroutines for use by or in connection with the instruction execution system.
- the computer readable medium can comprise any one of many physical media such as, for example, electronic, magnetic, optical, electromagnetic, infrared, or semiconductor media.
- the computer-readable medium may be a random access memory (RAM) including, for example, static random access memory (SRAM) and dynamic random access memory (DRAM), magnetic random access memory (MRAM), or non-volatile random-access memory (NVRAM).
- RAM random access memory
- SRAM static random access memory
- DRAM dynamic random access memory
- MRAM magnetic random access memory
- NVRAM non-volatile random-access memory
- the computer-readable medium may be a read-only memory (ROM), a programmable read-only memory (PROM), an erasable programmable read-only memory (EPROM), an electrically erasable programmable read-only memory (EEPROM), or other type of memory device.
- PROM programmable read-only memory
- EPROM erasable programmable read-only memory
- EEPROM electrically erasable programmable read-only memory
- warning semaphores is implemented as part of a preferred embodiment of the invention is through the use of an alarm system representing an annunciator panel.
- an alarm system representing an annunciator panel.
- Accompanying the graphical homunculus display (or instrument) could be a panel displaying alerts showing fields with the designations of the monitored parameters in a specific order and place, as in an annunciator panel.
- the order of the fields and the normal range of the parameters may be configurable by the user or may be dynamically adapted by the software. When the measured value of a parameter is within its normal range, its corresponding field is invisible, i.e., not displayed.
- Fig. 45 shows graphical examples of how the described alarm system may be implemented in a preferred embodiment of the invention.
- an abnormal measurement for a parameter may cause the field displaying the name of the abnormal parameter to become visible and turn yellow, i.e., to signify a state that requires CAUTION, or red, i.e., to indicate a WARNING of a dangerous state.
- these alerts may be accompanied by a bar in the correspondent color (yellow or red), with the length of the colored bar indicating the magnitude of deviation from the normal, and the position of the bar on the upper or lower border of the field indicating a deviation above (upper border) or below (lower border) the normal range.
- the colored yellow bar spans over half of the fields upper or lower border (50%).
- a measured value of a parameter reaches a value halfway between the value defined as the beginning of the CAUTION range and the value defined as the beginning of the WARNING range, the length of the yellow bar will gradually increase with the value of the measured parameter from 50% to 100%.
- Fig. 46 shows graphical examples of fields showing various CAUTION and WARNINGS states.
- the volume or area of parts (3D) or area (2D) or length representing the abnormal parameter in the visual patient display (or instrument) may alternate its color between the color displayed by the visual patient graphical display and the abnormal yellow or red color, e.g. in 1 second intervals.
- Combinations of two or more specified parameters in the CAUTION range will produce a WARNING and cause the display of an additional critical situations alert, indicating to the user that a dangerous situation may be occurring.
- a graphical example of this is shown in Fig 45 , D.
- Table 2 (page 46) outlines examples of parameter combinations, which will cause the display of a critical situation alert, when in an abnormal range at the same time.
- Fig 45 shows graphical examples of how an alarm system based on caution and warning fields and color changes of the part of the homunculus representing the abnormal parameter may be implemented.
- C The parameter oxygen saturation is far below its normal range, a red warning sign with arrows pointing downwards appears and region (i.e. body) 1 of the homunculus 10 intermittently flashes red.
- Fig 46 shows graphical examples of various "CAUTION” and "WARNING” states.
- C The measured value for heart rate is high (140/min) and within the range defined as "WARNING”.
- E The measured value for heart rate is low (45/min) and between the value defined as the beginning of the "CAUTION” range (60/min in this example) and the value defined as the beginning of the "WARNING" range (40/min in this example).
- the bar at the bottom of the field has increased to a length of 75% of the field.
- F The measured value for heart rate is high (40/min) and within the range defined as "WARNING".
Landscapes
- Health & Medical Sciences (AREA)
- Life Sciences & Earth Sciences (AREA)
- Engineering & Computer Science (AREA)
- Medical Informatics (AREA)
- Biomedical Technology (AREA)
- Public Health (AREA)
- General Health & Medical Sciences (AREA)
- Physics & Mathematics (AREA)
- Veterinary Medicine (AREA)
- Animal Behavior & Ethology (AREA)
- Surgery (AREA)
- Molecular Biology (AREA)
- Heart & Thoracic Surgery (AREA)
- Pathology (AREA)
- Biophysics (AREA)
- Epidemiology (AREA)
- Primary Health Care (AREA)
- Business, Economics & Management (AREA)
- General Business, Economics & Management (AREA)
- Computer Networks & Wireless Communication (AREA)
- Physiology (AREA)
- Nuclear Medicine, Radiotherapy & Molecular Imaging (AREA)
- Radiology & Medical Imaging (AREA)
- Measuring And Recording Apparatus For Diagnosis (AREA)
Priority Applications (6)
| Application Number | Priority Date | Filing Date | Title |
|---|---|---|---|
| EP15168778.7A EP3096254A1 (de) | 2015-05-21 | 2015-05-21 | Verfahren zur überwachung und visualisierung des medizinischen zustandes eines patienten |
| PCT/EP2016/060931 WO2016184823A1 (en) | 2015-05-21 | 2016-05-14 | Method and system for monitoring a patient's medical condition |
| EP16724016.7A EP3311315B1 (de) | 2015-05-21 | 2016-05-14 | Verfahren zur überwachung und visualisierung des medizinischen zustandes eines patienten |
| US15/816,749 US10702214B2 (en) | 2015-05-21 | 2017-11-17 | Method and system for monitoring a patient's medical condition |
| US15/929,872 US11096632B2 (en) | 2015-05-21 | 2020-05-27 | Method and system for monitoring a patient's medical condition |
| US17/445,656 US11957491B2 (en) | 2015-05-21 | 2021-08-23 | Method and system for monitoring a patient's medical condition |
Applications Claiming Priority (1)
| Application Number | Priority Date | Filing Date | Title |
|---|---|---|---|
| EP15168778.7A EP3096254A1 (de) | 2015-05-21 | 2015-05-21 | Verfahren zur überwachung und visualisierung des medizinischen zustandes eines patienten |
Publications (1)
| Publication Number | Publication Date |
|---|---|
| EP3096254A1 true EP3096254A1 (de) | 2016-11-23 |
Family
ID=53264499
Family Applications (2)
| Application Number | Title | Priority Date | Filing Date |
|---|---|---|---|
| EP15168778.7A Withdrawn EP3096254A1 (de) | 2015-05-21 | 2015-05-21 | Verfahren zur überwachung und visualisierung des medizinischen zustandes eines patienten |
| EP16724016.7A Active EP3311315B1 (de) | 2015-05-21 | 2016-05-14 | Verfahren zur überwachung und visualisierung des medizinischen zustandes eines patienten |
Family Applications After (1)
| Application Number | Title | Priority Date | Filing Date |
|---|---|---|---|
| EP16724016.7A Active EP3311315B1 (de) | 2015-05-21 | 2016-05-14 | Verfahren zur überwachung und visualisierung des medizinischen zustandes eines patienten |
Country Status (3)
| Country | Link |
|---|---|
| US (3) | US10702214B2 (de) |
| EP (2) | EP3096254A1 (de) |
| WO (1) | WO2016184823A1 (de) |
Cited By (1)
| Publication number | Priority date | Publication date | Assignee | Title |
|---|---|---|---|---|
| US20190108650A1 (en) * | 2016-04-06 | 2019-04-11 | Koninklijke Philips N.V. | Method, device and system for enabling to analyze a property of a vital sign detector |
Families Citing this family (10)
| Publication number | Priority date | Publication date | Assignee | Title |
|---|---|---|---|---|
| CN110010242B (zh) * | 2019-04-03 | 2021-09-17 | 吉林大学第一医院 | 一种基于物联网的重症监护系统 |
| US20200323436A1 (en) * | 2020-05-04 | 2020-10-15 | Stacey Knapp | Heart Rate Display System |
| CN116744843A (zh) * | 2020-11-24 | 2023-09-12 | 佐治亚技术研究公司 | 用可穿戴心血管感测测量血流动力学参数的系统和方法 |
| EP4176802A1 (de) * | 2021-11-03 | 2023-05-10 | Koninklijke Philips N.V. | System und verfahren zur patientenüberwachung |
| USD1048050S1 (en) * | 2021-11-19 | 2024-10-22 | Koninklijke Philips N.V. | Graphical user interface for display screen or portion thereof |
| KR20240097495A (ko) * | 2022-12-20 | 2024-06-27 | 삼성전자주식회사 | 전자장치에서 건강 정보를 제공하는 방법 및 그 전자장치 |
| EP4435799A1 (de) | 2023-03-21 | 2024-09-25 | ETH Zürich | System und verfahren zur bereitstellung einer vorhersage für physiologische parameter eines patienten |
| EP4462444A1 (de) | 2023-05-11 | 2024-11-13 | Universität Zürich | Visuelle übermittlung des zukünftigen zustands eines patienten |
| USD1107755S1 (en) * | 2023-12-12 | 2025-12-30 | Koninklijke Philips N.V. | Display screen or portion thereof with graphical user interface |
| EP4700782A1 (de) | 2024-08-21 | 2026-02-25 | Koninklijke Philips N.V. | System und verfahren zur steuerung der wahrnehmbarkeit einer medizinischen visualisierung |
Citations (4)
| Publication number | Priority date | Publication date | Assignee | Title |
|---|---|---|---|---|
| US6032119A (en) * | 1997-01-16 | 2000-02-29 | Health Hero Network, Inc. | Personalized display of health information |
| US20070027368A1 (en) * | 2005-07-14 | 2007-02-01 | Collins John P | 3D anatomical visualization of physiological signals for online monitoring |
| US20110172564A1 (en) * | 2010-01-08 | 2011-07-14 | Medtronic, Inc. | User interface that displays medical therapy and posture data |
| WO2012159190A1 (en) * | 2011-05-24 | 2012-11-29 | Axon Medical Technologies Corp. | Visual indexing system for medical diagnostic data |
Family Cites Families (26)
| Publication number | Priority date | Publication date | Assignee | Title |
|---|---|---|---|---|
| US4639223A (en) * | 1985-01-02 | 1987-01-27 | Keller Jr J Walter | Simulated heart display system |
| WO2002100267A1 (en) * | 2001-06-13 | 2002-12-19 | Compumedics Limited | Methods and apparatus for monitoring consciousness |
| US7305262B2 (en) * | 2003-12-11 | 2007-12-04 | Ge Medical Systems Information Technologies, Inc. | Apparatus and method for acquiring oximetry and electrocardiogram signals |
| US7257447B2 (en) * | 2005-04-20 | 2007-08-14 | Cardiac Pacemakers, Inc. | Method and apparatus for indication-based programming of cardiac rhythm management devices |
| US8033996B2 (en) * | 2005-07-26 | 2011-10-11 | Adidas Ag | Computer interfaces including physiologically guided avatars |
| DE102005036564A1 (de) * | 2005-08-03 | 2007-02-22 | Siemens Ag | Betriebsverfahren für eine bildgebende medizintechnische Anlage und hiermit korrespondierende Gegenstände |
| US8612024B2 (en) * | 2006-02-24 | 2013-12-17 | Medtronic, Inc. | User interface with 3D environment for configuring stimulation therapy |
| US7912544B1 (en) * | 2007-04-20 | 2011-03-22 | Pacesetter, Inc. | CRT responder model using EGM information |
| US8442630B2 (en) * | 2007-10-09 | 2013-05-14 | University of Pittsburgh—of the Commonwealth System of Higher Education | Automated assessment of atrioventricular and ventriculoatrial conduction |
| AU2008310577A1 (en) * | 2007-10-12 | 2009-04-16 | Patientslikeme, Inc. | Self-improving method of using online communities to predict health-related outcomes |
| US8936555B2 (en) * | 2009-10-08 | 2015-01-20 | The Regents Of The University Of Michigan | Real time clinical decision support system having linked references |
| US20110144510A1 (en) * | 2009-12-16 | 2011-06-16 | Pacesetter, Inc. | Methods to identify damaged or scarred tissue based on position information and physiological information |
| JP6251035B2 (ja) * | 2010-12-01 | 2017-12-20 | コーニンクレッカ フィリップス エヌ ヴェKoninklijke Philips N.V. | nリード式ECGシステムの作動方法 |
| US9962083B2 (en) * | 2011-07-05 | 2018-05-08 | Saudi Arabian Oil Company | Systems, computer medium and computer-implemented methods for monitoring and improving biomechanical health of employees |
| US9943269B2 (en) * | 2011-10-13 | 2018-04-17 | Masimo Corporation | System for displaying medical monitoring data |
| WO2013190557A2 (en) * | 2012-06-21 | 2013-12-27 | Given Imaging Ltd. | System and method for spatiotemporally synchronizing and displaying bodily organ images and physiological parameter(s) related thereto |
| US9445765B2 (en) * | 2012-07-25 | 2016-09-20 | Tosense, Inc. | Internet-based system for characterizing patients undergoing an electrophysiology procedure |
| US9282911B2 (en) * | 2012-11-27 | 2016-03-15 | Physio-Control, Inc. | Linear display of ECG signals |
| EP2811460A3 (de) * | 2013-06-04 | 2015-11-11 | Technion Research & Development Foundation Limited | Erzeugung eines synthetischen Modells mit organischer Richtigkeit |
| TWI556796B (zh) * | 2014-01-28 | 2016-11-11 | 許淑霞 | 利用心電訊號估計麻醉深度的方法與裝置 |
| US20150228254A1 (en) * | 2014-02-07 | 2015-08-13 | St. Jude Medical, Cardiology Division, Inc. | Systems and Methods for Generating, Storing, and Displaying Anatomical Maps |
| US10478127B2 (en) * | 2014-06-23 | 2019-11-19 | Sherlock Solutions, LLC | Apparatuses, methods, processes, and systems related to significant detrimental changes in health parameters and activating lifesaving measures |
| CA2973096A1 (en) * | 2015-01-06 | 2016-07-14 | Cardiovascular Biotherapeutics, Inc. | Angiogenic treatment of ischemic heart disease |
| US11122987B2 (en) * | 2016-12-27 | 2021-09-21 | Sensible Medical Innovations Ltd. | Method and system for radiofrequency (RF) tissue(s) monitoring |
| US11617520B2 (en) * | 2018-12-14 | 2023-04-04 | Covidien Lp | Depth sensing visualization modes for non-contact monitoring |
| US11147980B2 (en) * | 2019-04-11 | 2021-10-19 | Pacesetter, Inc. | Method and device for monitoring left ventricular hypertrophy and calculating defibrillation thresholds |
-
2015
- 2015-05-21 EP EP15168778.7A patent/EP3096254A1/de not_active Withdrawn
-
2016
- 2016-05-14 EP EP16724016.7A patent/EP3311315B1/de active Active
- 2016-05-14 WO PCT/EP2016/060931 patent/WO2016184823A1/en not_active Ceased
-
2017
- 2017-11-17 US US15/816,749 patent/US10702214B2/en active Active
-
2020
- 2020-05-27 US US15/929,872 patent/US11096632B2/en active Active
-
2021
- 2021-08-23 US US17/445,656 patent/US11957491B2/en active Active
Patent Citations (4)
| Publication number | Priority date | Publication date | Assignee | Title |
|---|---|---|---|---|
| US6032119A (en) * | 1997-01-16 | 2000-02-29 | Health Hero Network, Inc. | Personalized display of health information |
| US20070027368A1 (en) * | 2005-07-14 | 2007-02-01 | Collins John P | 3D anatomical visualization of physiological signals for online monitoring |
| US20110172564A1 (en) * | 2010-01-08 | 2011-07-14 | Medtronic, Inc. | User interface that displays medical therapy and posture data |
| WO2012159190A1 (en) * | 2011-05-24 | 2012-11-29 | Axon Medical Technologies Corp. | Visual indexing system for medical diagnostic data |
Cited By (2)
| Publication number | Priority date | Publication date | Assignee | Title |
|---|---|---|---|---|
| US20190108650A1 (en) * | 2016-04-06 | 2019-04-11 | Koninklijke Philips N.V. | Method, device and system for enabling to analyze a property of a vital sign detector |
| US11810325B2 (en) * | 2016-04-06 | 2023-11-07 | Koninklijke Philips N.V. | Method, device and system for enabling to analyze a property of a vital sign detector |
Also Published As
| Publication number | Publication date |
|---|---|
| US20180103916A1 (en) | 2018-04-19 |
| US10702214B2 (en) | 2020-07-07 |
| EP3311315A1 (de) | 2018-04-25 |
| WO2016184823A1 (en) | 2016-11-24 |
| EP3311315B1 (de) | 2022-07-20 |
| US20220039761A1 (en) | 2022-02-10 |
| US11957491B2 (en) | 2024-04-16 |
| US20200281540A1 (en) | 2020-09-10 |
| US11096632B2 (en) | 2021-08-24 |
Similar Documents
| Publication | Publication Date | Title |
|---|---|---|
| US11957491B2 (en) | Method and system for monitoring a patient's medical condition | |
| US12593980B2 (en) | Medical monitoring system | |
| US5321800A (en) | Graphical language methodology for information display | |
| US20110218406A1 (en) | Visual Display For Medical Monitor | |
| McGregor | Big data in neonatal intensive care | |
| CN105852799B (zh) | 一种显示cpr监测数据的方法、设备、呼吸机及监护仪 | |
| US7413546B2 (en) | Method and apparatus for monitoring dynamic cardiovascular function using n-dimensional representations of critical functions | |
| US20030156143A1 (en) | Anesthesia drug monitor | |
| JP5536582B2 (ja) | 生体パラメータ表示装置 | |
| CN103565418B (zh) | 用于监视对象的临床状态的方法、设备 | |
| CN103648372A (zh) | 用户可配置中心监测站 | |
| CN102014741A (zh) | 同步多个用户的心率参数 | |
| JP2020185138A (ja) | 感情推定システム、および感情推定装置 | |
| CN113226154B (zh) | 早期预警评分的显示方法、监护设备及系统 | |
| US10136813B2 (en) | Systems and methods for patient cardiovascular and respiratory management | |
| US11284829B2 (en) | Apparatus and method for processing physiological information | |
| JP4141133B2 (ja) | 周期的データを表示する装置及び方法 | |
| CN112911992B (zh) | 监护方法、监护仪及计算机存储介质 | |
| US6273855B1 (en) | Method and device for compressed optical representation of medical data | |
| EP4462444A1 (de) | Visuelle übermittlung des zukünftigen zustands eines patienten | |
| WO2023126012A1 (zh) | 病人监护设备和病人监护报警方法 | |
| JP2016521148A (ja) | 医療システムに対する聴覚に関する機能強化 | |
| Deneault | Comparing Geometric Object and Conventional Displays in Patient Monitoring |
Legal Events
| Date | Code | Title | Description |
|---|---|---|---|
| PUAI | Public reference made under article 153(3) epc to a published international application that has entered the european phase |
Free format text: ORIGINAL CODE: 0009012 |
|
| AK | Designated contracting states |
Kind code of ref document: A1 Designated state(s): AL AT BE BG CH CY CZ DE DK EE ES FI FR GB GR HR HU IE IS IT LI LT LU LV MC MK MT NL NO PL PT RO RS SE SI SK SM TR |
|
| AX | Request for extension of the european patent |
Extension state: BA ME |
|
| STAA | Information on the status of an ep patent application or granted ep patent |
Free format text: STATUS: THE APPLICATION IS DEEMED TO BE WITHDRAWN |
|
| 18D | Application deemed to be withdrawn |
Effective date: 20170524 |